Impact Factor
- Issue 12; 2026
- Issue 11; 2026
- Issue 10; 2026
- Issue 9; 2026
- Issue 8; 2026
- Volume 16; 2026
- Advance Articles
- Past Issues
- Cover Images
- Cover Suggestion
- Index & Coverage
- Special Issues
Introduction
Experimental
Results and Discussion
Conclusion
Supplementary Material
Acknowledgements
References
International Journal of Biological Sciences
International Journal of Medical Sciences
 Global reach, higher impact

Theranostics 2016; 6(1):54-64. doi:10.7150/thno.13159 This issue Cite
Research Paper
A Wash-Free Homogeneous Colorimetric Immunoassay Method
Huiqiao Liu1,#, Pengfei Rong2,#, Hongwei Jia3,#, Jie Yang1, Bo Dong1, Qiong Dong2, Cejun Yang2, Pengzhi Hu2, Wei Wang2, Haitao Liu3, Dingbin Liu1, ![]()
1. College of Chemistry, Research Center for Analytical Sciences, State Key Laboratory of Medicinal Chemical Biology, Tianjin Key Laboratory of Molecular Recognition and Biosensing, and Collaborative Innovation Center of Chemical Science and Engineering, Nankai University, 94 Weijin Road, Tianjin 300071, China
2. Department of Radiology, The Third Xiangya Hospital, Central South University, Changsha, Hunan 410013, China
3. Key Laboratory of Optical Information Science and Technology, Ministry of Education, Institute of Modern Optics, Nankai University, Tianjin 300071, China
# H.L., P.R., and H. J. contributed equally to this work.
Received 2015-7-6; Accepted 2015-8-30; Published 2016-1-1
Abstract

Rapid and convenient biosensing platforms could be beneficial to timely diagnosis and treatment of diseases in virtually any care settings. Sandwich immunoassays, the most commonly used methods for protein detection, often rely on expensive tags such as enzyme and tedious wash and incubation procedures operated by skilled labor. In this report, we revolutionized traditional sandwich immunoassays by providing a wash-free homogeneous colorimetric immunoassay method without requirement of any separation steps. The proposed strategy was realized by controlling the growth of gold nanoparticles (AuNPs) to mediate the interparticle spacing in the protein-AuNP oligomers. We have demonstrated the successful in vitro detection of cancer biomarker in serum samples from patients with high clinical sensitivity and specificity.
Keywords: colorimetric immunoassay, gold nanoparticles, clinical diagnostics
Introduction
The rapid and accurate analysis of proteins is a major discipline in the fields of clinical diagnostics, proteomics, pharmacy, and biology.[1-4] Immunoassay depends on the antibody-antigen interactions and is widely used for protein analysis in many settings.[5] To measure the analytes of interest, a variety of different labels are employed in immunoassays, such as fluorophores,[6] radioisotopes,[7] electrochemiluminescent tags,[8] Raman tags,[9] DNA-barcodes,[10] and enzymes.[11] Despite considerable advances in protein detection, current immunoassay methods still face several challenges. First, the capture antibodies against target proteins are randomly immobilized on a two-dimensional surface, which often leads to insufficient capture of protein markers to the surface-anchored antibody and thus influences the detection sensitivity.[12] Second, the labels are often sensitive to environmental conditions, making the immunoassay kits inconvenient for shipping, storage, and use. Third, multiple steps of incubation and wash cycles are inevitably required in a typical immunoassay method. As a result, the entire immunoassay usually takes several hours to days to obtain the assay results. These drawbacks enable immunoassays unsuitable for point-of-care (POC) detection, which is essential for timely clinical diagnostics especially in resource-poor areas.[13]
The emergence of homogeneous assay method makes the integration of immunoassays with POC possible.[14,15] Homogeneous immunoassays simplify the assay process and generate detection signals directly without resorting to separation steps of the detectably labeled specific binding members. For instance, a homogeneous immunoassay method was coupled with dynamic light scattering (DLS) technique for one-step measurement of cancer biomarkers.[16] Other signal transducers in homogeneous immunoassays include fluorescence,[17] electrochemiluminescence,[18] magnetic relaxation switching (MRS),[19] and localized surface plasmon resonance (LSPR).[20] These assays usually require advanced instruments and specialty labels to acquire readout signals. Colorimetric assays have drawn considerable research interests owing to their simple readout, which even can be seen by the naked eyes alone and do not require any specialist facilities and healthcare professionals.[21] The most well-known example of heterogeneous colorimetric immunoassay is enzyme-linked immunosorbent assay (ELISA), which serves as the clinical gold standard for protein detection.
Owing to the high extinction coefficients,[22] gold nanoparticles (AuNPs) have been employed to construct homogeneous colorimetric assays for a large amount of analytes ranging from ions,[23] small organic compounds[24] to DNA,[25] and enzymes.[26] These assays take advantage of the optical transition caused by the target-induced aggregation of AuNPs, resulting in a red-to-blue (or -purple) color change of the bulk solutions.[27-30] When an evident optical transition occurs, the interparticle spacing of the cross-linked AuNPs is generally smaller than the NPs' diameter. In this respect, AuNPs can not be applied as a general immuno-label in a colorimetric homogeneous assay for protein detection because the interparticle spacing in the antibody-protein-AuNP oligomers is often larger than the particles' size.[31] Some special AuNP-based homogeneous immunoassays have been rationally designed for protein detection by using peptide epitopes[20] or choosing large sized AuNPs[32]. A general homogeneous colorimetric immunoassay method for protein detection based on AuNPs is highly required.
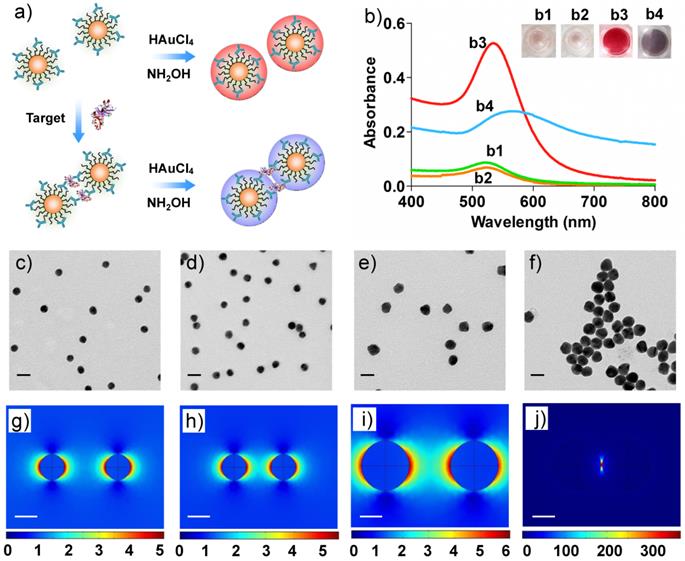
We herein report a wash-free homogenous colorimetric immunoassay by controlling the growth of AuNPs (used as the labels) in aqueous solutions. In this report, we attempt to modulate the interparticle spacing of the AuNP oligomers by controlling the growth of Au on the cross-linked AuNPs. With Au growth, the enlargement of particle size may decrease the interparticle spacing of the cross-linked AuNPs, thus inducing a distinct optical transition: the color of the bulk solution changes to be purple. When detection targets are absent, the color becomes deep red because of the generation of larger sized mono-dispersed AuNPs in solutions (Figure 1).
a) Schematic illustration of the homogenous colorimetric immunoassay based on the controllable growth of AuNPs. b) UV-vis absorption and corresponding photographs of AuNPs solutions. b1: 0.5 nM of Ab-AuNPs solution; b2: b1 incubated with target protein (human IgG, 100 ng/mL); b3: b1 added with Au growth solutions (NH2OH (20 mM) and HAuCl4 (120 μM)); b4: b2 added with Au growth solutions. c-f) TEM images of the samples b1-4 in b). The scale bars are 30 nm. g-j) Near-field distributions of the normalized electric field |E|/|Einc| at the excitation laser's wavelength (633 nm) for the cases in b1-b4, which are obtained on the plane vertical to the propagation direction of the incident plane wave. The interparticle spacing between two AuNPs was set according to the results of c-f) TEM images, respectively. The scale bars are 15 nm.
Experimental
Materials and Instrumentation
AuNPs with diameter of 15 nm were purchased from TED PELLA, INC. Thioctic acid, N-hydroxysucinimide (NHS), 1-ethyl-3-(3-dimethyllaminopropyl) carbodiimide hydrochloride (EDC-HCl), 4-(dimethylamino) pyridine (DMAP), 11-mercaptopropionic acid (MPA), Hydroxylamine (NH2OH), gold (III) chloride trihydrate (HAuCl4-3H2O), Tween 20, fetal bovine serum (FBS), and bovine serum albumin (BSA) were purchased from Sigma-Aldrich. The PEG 2000 derivative (H2N-PEG-COOH) was purchased from Biomatrik Inc. The 96-well polystyrene plate was purchased from R&D Systems. Human IgG, anti-IgG antibody, Carcinoembryonic antigen (CEA), two kinds of monoclonal anti-CEA antibody (catalog: BCW1101003; both of the host animals are mouse and the clones are C030501 and C010601, respectively.), and CEA ELISA kit were purchased from Biocell Biotechnol. Co., Ltd. (Zhengzhou, China). De-ionized water (Milli-Q grade, Millipore) with a resistivity of 18.2 MΩ-cm was used throughout this study. The UV-vis spectra were recorded with U-3900 spectrophotometer (Hitachi). The absorbance of AuNP solutions in 96-well plates were collected at 525 nm by a Synergy 2 Multi-Mode Microplate Reader (Bio-Tek Instruments, Inc). Mass spectral data were obtained with matrix-assisted laser desorption/ionization time of flight (MALDI-TOF) instrument with positive-ion or negative-ion mode. Dynamic light scattering (DLS) and zeta potential (ζ) were performed on a Zeta Sizer Nano ZS (Malvern Zetasizer 3000HS and He/Ne laser at 632.8 nm at scattering angles of 90 at 25 °C). TEM images were obtained by using a JEOL1400 TEM at an accelerating voltage of 100 kV. The gel electrophoresis experiments were conducted by the electrophoresis system (JY600C).
Synthesis of PEG linker
The synthesis route is shown in Scheme S1. Briefly, to a solution of NHS (0.9 g, 7.8 mmol) in anhydrous dichloromethane (20 mL) was added thioctic acid (1.34 g, 6.5 mmol). Then, EDC-HCl (1.38 g, 7.2 mmol) and a catalytic amount of DMAP were added into the stirred solution. The resulted mixture was cooled for the first hour at 5 °C and left to react at room temperature overnight. The obtained solution was diluted with dichloromethane (30 mL), and washed with brine (3 × 50 mL), dried over Na2SO4 and concentrated to dryness to yield the NHS-activated thioctic acid (1.93 g, 98 %). The activated ester (182 mg, 0.6 mmol) was added to a stirred solution of H2N-PEG-COOH (1 g, 0.5 mmol) in dichloromethane (30 mL) and left the mixture to react overnight. The obtained solution was concentrated to 10 mL and then added into 50 mL of cold diethyl ether dropwise slowly. White precipitate was obtained and washed with cold diethyl ether to yield the PEG intermediate terminated in thioctic acid (0.71 g, 64 %). The molecular weight was determined to be 2238 by MALDI-TOF (Figure S1). The obtained PEG intermediate (0.5 g, 0.22 mmol) was mixed with NHS (31 mg, 0.27 mmol), EDC-HCl (50 mg, 0.27 mmol), and a catalytic amount of DMAP in 10 mL of dichloromethane, and the mixture was allowed to react overnight. The solution was then added dropwisely into 50 mL of cold diethyl ether to obtain the white precipitate, which was further washed with cold diethyl ether to yield the PEG derivative (293 mg, 58 %) whose one side is thioctic acid and the other side is NHS group. The MALDI-TOF data indicate that the molecular weight of the final product is 2335, demonstrating the successful activation of the acid in the PEG intermediate.
Preparation of antibody-functionalized AuNPs
The protocal of preparing the antibody-functionalized AuNPs was shown in Figure S2. In brief, to the solution of citrate-capped AuNPs (2 nM) with diameter of 15 nm was added the as-prepared PEG linkers (100 µM). After reaction for 2 h at room temperature, the PEG linkers were tethered onto the surface of AuNPs via Au-S bonds to form PEG-AuNPs. The obtained PEG-AuNPs were purified by centrifugation (10 min, 14000 r/min) and resuspended in PBS (pH7.4) for twice. Subsequently, anti-IgG or anti-CEA antibodies (100 nM) were allowed to incubate with the purified PEG-AuNPs at 4 °C overnight. The anti-IgG or anti-CEA antibodies were conjugated with the PEG linker through the reaction between the primary amines on antibodies and the NHS activated carboxyl groups on the PEG linker. Next, to the mixture was added 10 mM of phosphate buffer (pH 8.5). Under this basic condition, the unreacted NHS esters on PEG linkers were hydrolyzed to avoid nonspecific reaction with proteins when used in immunoassay. The mixture was incubated at room temperature for 15 min and purified by centrifugation (10 min, 14000 r/min) to yield Ab-AuNPs, which were resuspended in distilled water for further use.
Agarose Gel Electrophoresis
Electrophoresis of PEG-AuNPs and AuNPs linked with anti-IgG was performed with 2 % agarose in TAE (40 mM Tris-acetate, 1 mM EDTA, pH 8.3) at 70 V for 22 min. PEG-AuNPs and Ab-AuNPs were diluted to 40 nM in TAE (containing 0.1 % SDS) and mixed with glycerol (1:1) before loading onto the gel.
The procedure of AuNP-based immunoassay
The obtained Ab-AuNPs were applied to detect proteins of interest by two steps without the need of wash and any signal amplification strategy (like the use of enzyme). In the first step, the as-prepared Ab-AuNPs (0.5 nM) were incubated with various concentrations (0, 10, 20, 50, 100, and 200 ng/mL) of detection targets (human IgG or CEA were used in this study) at 37 °C for 30 min. In the second step, to the AuNPs solutions were added Au growth solutions (NH2OH (20 mM) and HAuCl4 (120 μM)). For the clinical samples, the precipitates after centrifugation were dispersed into distilled water for further growth of Au. The solutions became from nearly colorless to red or purple, which depends on the concentrations of detection targets. In the end, photographs were taken and their corresponding absorbance at 525 nm was recorded by a Synergy 2 Multi-Mode Microplate Reader.
HRP-based ELISA for CEA
In term of HRP-based ELISA for CEA, the commercial CEA ELISA kit was employed to measure the levels of CEA in both spiked samples and clinical samples. We performed the detection procedures strictly by following the recommended steps as received.
Clinical samples
Both the healthy human serum samples and those of patients suffered from various types of cancer were collected from the Third Xiangya Hospital, Changsha, China. The serum samples from the patients were diagnosed by the current gold-standard in the clinic such as histopathological examination before being detected with the AuNP-based colorimetric assay and HRP-based ELISA. The clinical samples were stored at -80 °C for further use. The handling of these samples followed all necessary safety precautions.
Simulation of the electric field distributions on AuNPs
The simulation is performed with the RF module of COMSOL Multiphysics software, in which the finite element method (FEM) is adpoted for solving the frequency-domain differential Maxwell's equations. In this calculation, two important physical quantities, absorption cross section (σabs) and scattering cross section (σsc) are introduced to evaluate the absorption and scattering strength of AuNPs, respectively. The absorption cross section and the scattering cross section are defined as the ratio of the power absorbed or scattered by this system (Pabs or Psc) to the flux density (I0) of the incident plane wave
,
(1)
The absorbed and scattered power are calculated with the following integrals,
,
(2)
In Eq. (2), E and H are electric and magnetic field vectors, ω is the angular frequency of incident light, ε and μ are the dielectric constant and magnetic permeability of gold, and S is the Poynting vector of the scattered field. V is the region of the AuNPs, and A is a closed surface encompassing the AuNPs with n being the out-pointing normal vector of the surface.
Results and Discussion
Proof-of-concept experiments
To demonstrate the feasibility of the colorimetric immunoassay, we first prepared a polyethylene glycol (PEG) linker to tether antibodies onto AuNPs. One side of the PEG linker was modified with thioctic acid for anchoring the linker onto Au surface via Au-S bond, and the other side was terminated in N-hydroxysucinimide (NHS)-activated carboxylic acid for conjugating with antibody. The synthesis protocol and characterization of the linker were shown in Supporting Information Scheme S1 and Figure S1 respectively. The NHS-terminated PEG linker was then functionalized onto AuNP surfaces to produce PEG-AuNPs. We then verified the concept of the colorimetric immunoassays using immunoglobulin G (IgG) as a model protein. In order to construct the immunoassay, human anti-IgG antibody was conjugated with the PEG linkers on AuNPs by means of amide bonds, thus coating on the AuNP surfaces to form Ab-AuNPs (Figure S2 in Supporting Information). We characterized the obtained AuNPs by three tools: UV-vis spectroscopy, DLS and gel electrophoresis. As indicated in Supporting Information Figure S3, after modification with antibodies, the absorption band of AuNPs red-shifted from 520 to 525 nm. Correspondingly, the average hydrodynamic diameter of citrate-AuNPs is 31.1 nm, while that of Ab-AuNPs increased to be 64.5 nm (Figure S4 in Supporting Information). What's more, it may due to the exsistance of protein on the surface of AuNPs, the Ab-AuNPs with more negtive charges have a higher electrophoretic mobility than AuNPs modified with PEG (Figure S5 in Supporting Information).[33,34] The results demonstrate the success of surface modification of the AuNPs with PEG linkers and antibodies.
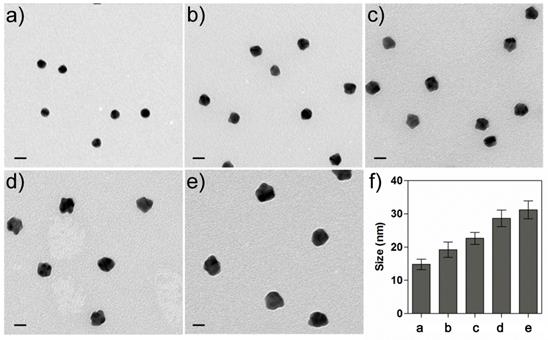
We next tested whether Au can grow on the Ab-AuNPs to form larger sized AuNPs. Biomolecules contain polar chemical groups such as carboxylic acid, amine, and thiol, etc. Those groups are able to bind with gold salts and guide the crystal growth of AuNPs.[35] To investigate this, the as-prepared Ab-AuNPs were applied as the seeds for NP growth. Hydroxylamine (NH2OH) has been shown as an ideal reducing agent to perform the reduction of hydrogen tetrachloroaurate (III) (HAuCl4) in the presence of Au seeds.[36] In this study, an aliquot of Ab-AuNPs (0.5 nM) solutions were added with various amounts of HAuCl4 (their final concentrations were set to be 0, 10, 40, 160, 640 μM). NH2OH (20 mM) was then introduced to each mixture, and the resulting solutions were rigorously vortexed to facilitate the reduction. We noted that the color of the solutions turned red quickly where the color intensity was proportional to the concentration of HAuCl4. The morphology of the NPs was examined by transmission electron microscopy (TEM). As shown in Figure 2, the NP size was well correlated with the concentration of HAuCl4, i.e., more HAuCl4 can induce larger sized AuNPs. We found that the particle size had no noticeable change if either NH2OH or HAuCl4 was added to the Ab-AuNPs seeds. In addition, no NPs were formed when simply mixing NH2OH and HAuCl4 together, without addition of the Ab-AuNPs as seeds. These results reveal that Ab-AuNPs can act as the seeds for Au growth, which is the basic principle of the colorimetric immunoassay in this study.
a-e) TEM images of the Ab-AuNPs samples after adding the Au growth solutions containing 20 mM of NH2OH and various concentrations (0, 10, 40, 160, and 640 µM) of HAuCl4. f) Measurements of the NP sizes for a-e). The error bars represent the standard deviations of measurements of the particle sizes shown in the TEM images a-e). The scale bars are 20 nm.
We now turn our attention to the Au growth in the presence of detection targets that can bind with the antibody on Ab-AuNPs to form cross-linked AuNP oligomers. Firstly, the incubation time of Ab-AuNPs and detection targrets were investigated. From Figure S6 in Supporting Information, we noted that the aggregation degree of AuNPs increased gradually with the incubation time from 0 to 60 min. Given the effectiveness of the detection, we chose 30 min as the incubation time for the mixtures of Ab-AuNPs and detection targrets, which is generally sufficient for a homogeneous immunoassay. To investigate the Au growth in the presence of detection targets, 100 ng/mL of human IgG was incubated with the as-prepared Ab-AuNPs (0.5 nM) at 37 °C for 30 min. The DLS data suggest that the average hydrodynamic diameter of the IgG-Ab-AuNP oligomers was 454.7 nm (Figure S7 in Supporting Information), while that of the individual Ab-AuNPs was 64.5 nm, demonstrating the formation of the cross-linked AuNP oligomers. However, both the color of the solution and its corresponding UV-vis absorption have negligible changes (Figure 1b1,b2). This phenomenon is not surprising because the interparticle spacing in the IgG-Ab-AuNP oligomers is larger than the diameter of the AuNP individuals.[20, 31] Upon the addition of Au growth solutions (NH2OH (20 mM) and HAuCl4 (120 μM)), the color of the solution turned purple in 30 s. We reasoned that the growth of AuNPs may decrease the interparticle spacing of the cross-linked AuNPs. Obvious purple color can be seen by the naked eyes when the interparticle spacing was smaller than the diameter of the AuNPs, which was confirmed by a distinct shift of SPR in wavelength (Figure 1b4). As a consequence, the absorption band red-shifted significantly from 520 to 565 nm with increased SPR intensity. In contrast, the introduction of Au growth solution to the Ab-AuNPs seeds in the absence of targets caused the formation of larger sized individual AuNPs, leading to a deep red solution (Figure 1b3) as well as increased absorbance at 525 nm from approximately 0.07 to 0.55. These results were clearly supported by the TEM images (Figure 1c-f). With the Au growth, the diameter of individual AuNPs increased to be around 29 nm with mono-dispersity, while the aggregates composed of larger sized AuNPs were formed in the presence of targets. Unambiguously, this colorimetric immunoassay can be useful for sensing proteins in a technically straightforward manner by simply mixing the samples together followed by addition of Au growth solutions, without the requirement of tedious wash steps and the involvement of any enzymes.
Simulation of the distributions of electric field on AuNPs
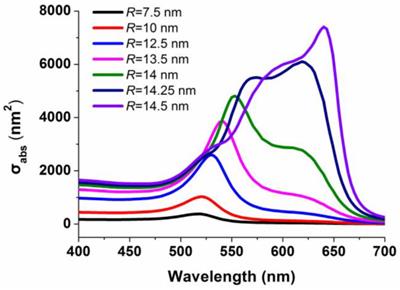
To better understand the phenomenon of the color change, the mechanism of generating purple or red color was further investigated by calculating the electric field distributions on the AuNPs. The considered configuration for simulation is shown in Figures 1g-j. For the AuNP oligomers linked by IgG, the distance between two particle centers are fixed to be 30 nm according to the sizes of the antibody and IgG; For the mono-dispersed AuNPs, we chose the distance between the particle's surfaces rather than the particle's centers for the simulation since the mono-dispersed AuNPs are free in solutions, and in this case, the subsequent Au growth will not change the distances between the AuNP individuals. We therefore set the distance between the particle's surfaces to be 25 nm, larger than the size of two antibodies. The whole configuration was put into liquid with a refractive index 1.33. The AuNPs were illuminated by an incident plane wave, and its electric-field polarization was parallel to the connection between the two particles' centers. The refractive index of gold for different wavelengths with tabulated values was obtained from the Handbook of Optical Constants of Solids Part II.[37] Figure 3 shows the spectra of the absorption cross section (σabs) of AuNPs in the IgG-Ab-AuNP oligomers with AuNPs growth. SPR peaks were clearly observed for the AuNPs with different radius (R) in the process of Au growth. With the increase of R, the SPR peaks red-shifted gradually, which agrees well with the spectra of absorption bands shown in Figure 1b. The normalized near-field (|E|/|Einc|, where E and Einc are the electric vectors of the total field and incident plane wave, respectively) distributions of the AuNPs are shown in Figures 1g-j, corresponding to the TEM results of Figures 1c-f, respectively. The results indicated that the enhancement of the electric field in the nano-gap increased as R increased, which is due to the decrease of the interparticle spacing. After AuNPs growth, the enhancement of the electric-field intensity in the nano-gap of the AuNP oligomers is around 3,000 times higher than that of the same sized mono-dispersed AuNPs (Table S1 and S2 in Supporting Information). The above calculations are performed with the RF module of COMSOL Multiphysics software.
Spectra of the absorption cross section (σabs) of AuNPs in the IgG-Ab-AuNPs oligomer with the increase of the radius (R) of the AuNPs.
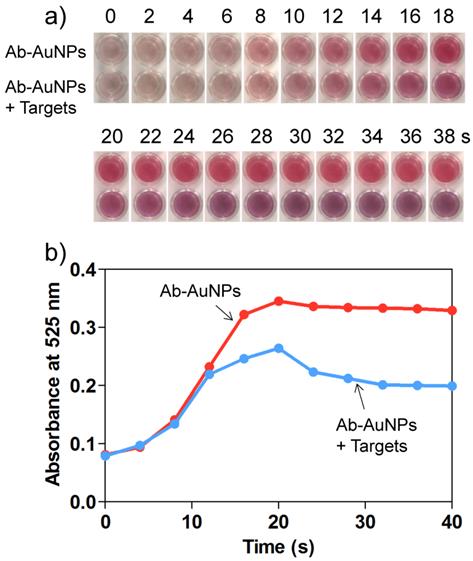
Monitoring the dynamic process of Au growth
It is also worth noting that the process of AuNP growth was dynamic, which means that a quencher is required to stop the reduction reaction. 11-mercaptopropionic acid (MPA) has been demonstrated to be an ideal quencher to stop the AuNP growth effectively through the formation of less reactive Au(I)-MPA complex.[38] To optimize the Au growth time, we monitored the color change of the solutions as well as their simultaneous absorbance change at 525 nm using a microplate reader. For the individual Ab-AuNPs (0.5 nM), incubation with NH2OH (20 mM) and HAuCl4 (120 μM) enabled the resulting solution to be red in color (Figure 4a), and the color intensity was time-dependent, which was well confirmed by the graduate increase of the absorbance at 525 nm (Figure 4b). The maximum absorbance was obtained at 20 s. Interestingly, for the target-induced cross-linked AuNPs, the introduction of Au growth solutions enabled the resulting solution to turn pink from the initiation of the reaction to 20 s and subsequently turn purple remarkably. We reasoned that, at the early stages of NP growth, the size of nanoparticles increased accompanied by a decrease of the interparticle spacing. However, In the beginning 20 s, the interparticle spacing is still larger than the diameter of NPs, and thus the plasma resonance coupling between NPs is insufficient to fully induce a red-to-purple color change. After 20 s, the further NP growth could cause the interparticle spacing to decrease to be smaller than the NP diameter. In these cases, the resulting solution turned purple because of the strong plasma resonance coupling in the cross-linked AuNPs. This time-dependent AuNP growth process was examined using TEM by stopping the reaction at appropriate time with excess MPA. In the absence of detection targets, the AuNPs remained mono-dispersive (Figure S8 in Supporting Information), while those in the presence of targets aggregated into oligomers (Figure S9 in Supporting Information). Figures S10 and S11 in Supporting Information show the corresponding near-field distributions of normalized electric field |E|/|Einc| for mono-dispersed AuNPs and AuNP oligomers in the process of AuNP growth, respectively. On the basis of the results, we reasoned that the AuNP growth in the AuNP oligomers can unambiguously decrease the interparticle spacing, causing significant enhancement of the electric field in the nano-gap between the NPs. As a result, the SPR bands red-shift evidently, which was reflected by a color change.
a) Time-dependent color change and b) corresponding UV-vis absorbance at 525 nm for the mixture of Ab-AuNPs (0.5 nM) and target IgG (100 ng/mL) after adding the Au growth solutions. The absorbance was recorded by a conventional microplate reader.
Sensitivity and specificity of the immunoassay for human IgG
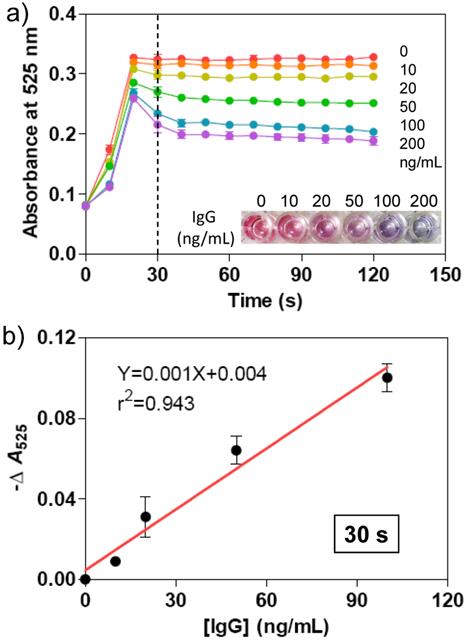
Subsequently, we evaluated the analytical performance of the immunoassay method for protein detection. The as-prepared Ab-AuNPs were incubated with various amounts of IgG with final concentrations of 0, 10, 20, 50, 100, and 200 ng/mL at 37 °C for 30 min. Then, the Au growth solutions were added into the mixtures and the absorbance of each solution was recorded on a microplate reader every 10 s during the growth of AuNPs. We also observed the dynamic process of AuNPs growth, and the degree of AuNP aggregation depended on the concentration of the sandwiched targets (Figure 5). Higher concentration of IgG induced more AuNP aggregates, whose solution turns purple in color, while lower concentration of IgG favors the generation of more mono-dispersed AuNPs with larger size, which appears red in solution. The purple and red color can be readily differentiated by the naked eye, without requirement of any expensive analytical tools or skilled labors. The typical concentration-dependent color change was shown in Figure 5a, which was taken after 30 s of adding Au growth solutions. The color change was confirmed by measuring the absorbance of at 525 nm. With the plots of -ΔA525 (-ΔA525 = A-A0, where A is the absorbance of Ab-AuNP solution at 525 nm after adding IgG and Au growth solutions, and A0 is that only adding Au growth solutions) versus various concentrations of IgG, a calibration curve was achieved. As shown in Figure 5b, very good linear response is observed in the range between 0 and 100 ng/mL of IgG concentration. The limit of detection (LOD) at 3σ (σ = S0/S; S0, standard deviation of blank sample; S, the slope of the calibration curve) was determined to be 3.74 ng/mL, which is comparable to other reported methods such as time-resolved fluoroimmunoassay (5 ng/mL),[39] flow immunoassay (5.0 × 10⁻⁷ M),[40] electrochemical immunoassay (1.0 × 10⁻¹⁰ M),[41] and luminescence resonance energy transfer (LRET)-based immunoassay (0.88 µg/mL).[42]
a) Time-dependent absorbance at 525 nm for the mixtures of Ab-AuNPs (0.5 nM) and various concentrations of target IgG (0, 10, 20, 50, 100, 200 ng/mL) after adding the Au growth solutions. The absorbance was recorded by a conventional microplate reader. The photograph indicates the color change of the AuNP solutions taken at 30 s. b) Plots of -ΔA525 versus various concentrations of IgG. -ΔA525 = A-A0, where A is the absorbance of Ab-AuNP solution at 525 nm after adding IgG and Au growth solutions, and A0 is that only adding Au growth solution. The relationship between -ΔA525 and IgG concentration is linear after 30 s. The error bars represent the standard deviations of three independent measurements.
To investigate the specificity of the immunoassay method, HSA and human IgM (100 ng/mL) were incubated with the Ab-AuNPs solutions respectively, followed with Au growth solutions. The reason for the use of these two proteins is that they usually coexist in the normal human serum. The results indicated that the color of the solutions changed into red, which is similar to that of blank samples, indicating the generation of mono-dispersed larger sized AuNPs. As reflected, the absorbance of the solutions at 525 nm increased to be around 0.34 in 30 s (Figure S12 in Supporting Information, measured by a conventional microplate reader). In contrast, 100 ng/mL of IgG as well as those of HSA and human IgM in the presence of 100 ng/mL of IgG led to an evident appearance of the purple color. Correspondingly, the absorbance of the solutions at 525 nm increased to be around 0.2 under the same measurement conditions. The specific antigen-antibody immune interactions enable this approach good specificity in detecting IgG in complex samples with negligible interference from its analogues.
Detection of CEA in clinical serum samples
Encouraged by these initial experiments, we next applied this proposed approach into clinical biomarker detection. Carcinoembryonic antigen (CEA), a commonly used clinical biomarker associated with colon cancer, lung cancer, urothelialcarcinoma, ovarian carcinoma, and breast cancer,[43] was employed as the detection target in the sandwich colorimetric immunoassay. To do this, anti-CEA antibody was covalently functionalized onto the AuNP surfaces via PEG linker. To create a calibration curve to measure the amount of CEA in clinical samples, various concentrations of CEA in pure fetal bovine serum were incubated with the obtained anti-CEA antibody-modified AuNPs. The specific interactions of CEA and its antibody on AuNPs enable the formation of cross-linked AuNP oligomers. The addition of Au growth solutions allows the enlargement of AuNPs in the oligomers. The color change was determined by the concentration of CEA (Figure S13 in Supporting Information), which is similar to that when detected IgG. The calibration curve for CEA detection exhibits a nearly linear dependence at 0-100 ng/mL with a LOD of 5.66 ng/mL (Figure 6a). The specificity of the immunoassay method to detect CEA was also investigated. From Figure S14 we can see the interfering protein of IgG, HSA and AFP (100 ng/ml) showed the similar phenomenon as that of the blank, indicating that these protein did not interfere with the detection of CEA. Since the concentration of serum CEA in most individuals with cancer is often in the range from several to hundreds ng/mL, our simple homogeneous immunoassay is thus promising to measure the amount of CEA in clinical samples without the need of advanced instruments. Table S3 in Supporting Information presents the comparison of AuNP-based immunoassays for various detection targets.
a) Plots of -ΔA525 versus various concentrations of cancer biomarker CEA. b) The naked-eye results of the immunoassays for healthy serum samples (A1-6) and clinical serum samples (B1-6, C1-6, and D1-6). c) Bar graphs of the CEA concentrations measured by the AuNP-based colorimetric immunoassay (having biases) and conventional ELISA (grey background). The error bars represent the standard deviations of three independent measurements.
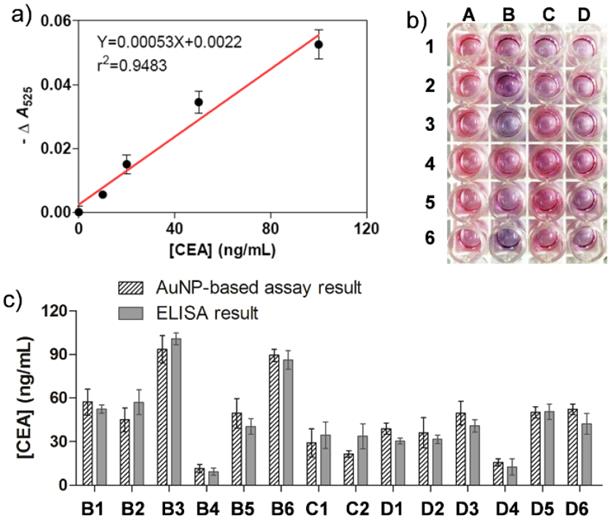
To test the potential of the simple immunoassay in clinical diagnostics, 18 serum samples from patients that suffered from various types of cancer were collected from hospital. These cases have been positively diagnosed using the clinical standard strategies such as histopathological examination. 6 healthy sera were applied as controls. Figure 6b shows a typical assay image of the sera test using our sandwich method. Column A illustrates the color change of the healthy sera and column B-D shows that of the cancer sera. The results reveal that the color of most cancer samples changes to be purple while that of all healthy samples turns red, which can be attributed to the fact that the concentration of CEA in cancer samples is often higher than that of the healthy samples. From this image, 14 out of 18 cancer sera were positively detected by the AuNP-based naked-eye assay while none of negative samples was detected. The clinical sensitivity and specificity were calculated to be 78% and 100% respectively. The -ΔA525 values for both healthy and patient samples are summarized in Table S4 in Supporting Information. Furthermore, the clinical information of the serum samples is also presented in Tables S5 and S6 in Supporting Information.
Compared to yes-or-no diagnosis, quantitative measurement often provides more valuable information to physicians to help them make better clinical decisions. We next attempted to quantify the amount the CEA in the cancer sera. Horseradish peroxidase (HRP)-based ELISA, the most commonly used colorimetric methods in clinical biomarker detection, was employed to screen the same clinical samples to compare with our assay. To do this, a calibration curve was first created with a conventional immunoassay procedure. The linear detection range was 0-80 ng/mL with a LOD of 1.84 ng/mL (Figure S15 in Supporting Information). Based on the calibration curve, the amounts of CEA in the cancer sera were then measured (Table S6 in Supporting Information) and compared with those determined by our AuNP-based assay (Figure 6c). The trends of both types of tests are correlated well and no significant difference in quantifying the amounts of CEA was observed (P > 0.05). It is worth noting that both the two methods are unable to fully provide positive diagnosis results for all cancer sera, most likely due to the fact that the concentrations of CEA in certain clinical sera are below the clinical threshold. Another reason is that CEA is a universal biomarker in many cancers, but not all types of tumor overexpress CEA in serum. In other words, it is not surprising that CEA is undetectable in some cancer sera.
Conclusion
In summary, we report a homogenous colorimetric immunoassay method without the need of tedious wash steps. The results can be seen by the naked eye in 30 s, allowing rapid detection of protein biomarkers in two steps. First, the antibody-labeled AuNPs were incubated with the target protein; second, the Au growth solutions were added to the mixture and the resulting color change as well as the absorbance were recorded conveniently. In contrast, a typical ELISA method requires 5-6 steps of operation. More importantly, both the sensitivity and dynamic detection range of the proposed AuNP-based immunoassays is competitive with those of ELISA in our preliminary test, making the assay promising as an alternative of ELISA for clinical use. Given the simplicity of the assay operation and readout, our approach provides new opportunities for detection of protein biomarkers in both clinical laboratory and home use particlulary in combination with POC platforms.
Supplementary Material
Supplementary Scheme S1, Figures S1-S15, and Tables S1-S6.
Acknowledgements
We acknowledge the support from the National Natural Science Foundation of China (Grants 21475066, 81401463, 81471715, 30900359 and 61322508), the Fundamental Research Funds for Central Universities (China), and the 973 Program (Grant 2013CB328701).
Competing Interests
The authors have declared that no competing interest exists.
References
1. Xiang Y, Lu Y. Using personal glucose meters and functional DNA sensors to quantify a variety of analytical targets. Nat Chem. 2011;3:697-703
2. Tokel O, Inci F, Demirci U. Advances in plasmonic technologies for point of care applications. Chem Rev. 2014;114:5728-52
3. Thaxton CS, Elghanian R, Thomas AD, Stoeva SI, Lee JS, Smith ND. et al. Nanoparticle-based bio-barcode assay redefines "undetectable" PSA and biochemical recurrence after radical prostatectomy. Proc. Natl. Acad. Sci. U. S. A. 2009;106:18437-42
4. Kelley SO, Mirkin CA, Walt DR, Ismagilov RF, Toner M, Sargent EH. Advancing the speed, sensitivity and accuracy of biomolecular detection using multi-length-scale engineering. Nat Nanotechnol. 2014;9:969-80
5. Saviranta P, Okon R, Brinker A, Warashina M, Eppinger J, Geierstanger BH. Evaluating sandwich immunoassays in microarray format in terms of the ambient analyte regime. Clin Chem. 2004;50:1907-20
6. Tabakman SM, Lau L, Robinson JT, Price J, Sherlock SP, Wang H. et al. Plasmonic substrates for multiplexed protein microarrays with femtomolar sensitivity and broad dynamic range. Nat. Commun. 2011;2:466
7. Xing Y, Zhao J, Conti PS, Chen K. Radiolabeled nanoparticles for multimodality tumor imaging. Theranostics. 2014;4:290-306
8. Sanchez-Carbayo M, Mauri M, Alfayate R, Miralles C, Soria F. Analytical and clinical evaluation of TSH and thyroid hormones by electrochemiluminescent immunoassays. Clin Biochem. 1999;32:395-403
9. Narayanan R, Lipert RJ, Porter MD. Cetyltrimethylammonium bromide-modified spherical and cube-like gold nanoparticles as extrinsic Raman labels in surface-enhanced Raman spectroscopy based heterogeneous immunoassays. Anal Chem. 2008;80:2265-71
10. Nam JM, Thaxton C S, Mirkin CA. Nanoparticle-based bio-bar codes for the ultrasensitive detection of proteins. Science. 2003;301:1884-6
11. De la Rica R, Stevens MM. Plasmonic ELISA for the ultrasensitive detection of disease biomarkers with the naked eye. Nat Nanotechnol. 2012;7:821-4
12. Park JS, Cho MK, Lee EJ, Ahn KY, Lee KE, Jung JH. et al. A highly sensitive and selective diagnostic assay based on virus nanoparticles. Nat Nanotechnol. 2009;4:259-64
13. Zagorovsky K, Chan WCW. A plasmonic DNAzyme strategy for point-of-care genetic detection of infectious pathogens. Angew Chem Int Ed. 2013;52:3168-71
14. Shults MD, Janes KA, Lauffenburger DA, Imperiali B. A multiplexed homogeneous fluorescence-based assay for protein kinase activity in cell lysates. Nat Meth. 2005;2:277-83
15. Miller EM, Wheeler AR. A digital microfluidic approach to homogeneous enzyme assays. Anal Chem. 2008;80:1614-9
16. Liu X, Dai Q, Austin L, Coutts J, Knowles G, Zou J. et al. A one-step homogeneous immunoassay for cancer biomarker detection using gold nanoparticle probes coupled with dynamic light scattering. J Am Chem Soc. 2008;130:2780-2
17. Liu L, Shao M, Dong X, Yu X, Liu Z, He Z. et al. Homogeneous immunoassay based on two-photon excitation fluorescence resonance energy transfer. Anal Chem. 2008;80:7735-41
18. Akhavan-Tafti H, Binger DG, Blackwood JJ, Chen Y, Creager RS, de Silva R. et al. A homogeneous chemiluminescent immunoassay method. J Am Chem Soc. 2013;135:4191-4
19. Chen Y, Xianyu Y, Wang Y, Zhang X, Cha R, Sun J. et al. One-step detection of pathogens and viruses: combining magnetic relaxation switching and magnetic separation. ACS Nano. 2015;9:3184-91
20. Andresen H, Mager M, Griessner M, Charchar P, Todorova N, Bell N. et al. Single-step homogeneous immunoassays utilizing epitope-tagged gold nanoparticles: on the mechanism, feasibility, and limitations. Chem Mater. 2014;26:4696-704
21. Khlebtsov N, Bogatyrev V, Dykman L, Khlebtsov B, Staroverov S, Shirokov A. et al. Analytical and theranostic applications of gold nanoparticles and multifunctional nanocomposites. Theranostics. 2013;3:167-80
22. Liu X, Atwater M, Wang J, Huo Q. Extinction coefficient of gold nanoparticles with different sizes and different capping ligands. Colloid Surfaces B. 2007;58:3-7
23. Lee JS, Han MS, Mirkin CA. Colorimetric detection of mercuric ion (Hg2+) in aqueous media using DNA-functionalized gold nanoparticles. Angew Chem Int Ed. 2007;46:4093-6
24. Lee JS, Ulmann PA, Han MS, Mirkin CA. A DNA-gold nanoparticle-based colorimetric competition assay for the detection of cysteine. Nano Lett. 2008;8:529-33
25. Bai X, Shao C, Han X, Li Y, Guan Y, Deng Z. Visual detection of sub-femtomole DNA by a gold nanoparticle seeded homogeneous reduction assay: Toward a generalized sensitivity-enhancing strategy. Biosens Bioelectron. 2010;25:1984-8
26. Laromaine A, Koh L, Murugesan M, Ulijn RV, Stevens MM. Protease-triggered dispersion of nanoparticle assemblies. J Am Chem Soc. 2007;129:4156-7
27. Liang S, Li C, Zhang C, Chen Y, Xu L, Bao C. et al. CD44v6 monoclonal antibody-conjugated gold nanostars for targeted photoacoustic imaging and plasmonic photothermal therapy of gastric cancer stem-like cells. Theranostics. 2015;5:970-84
28. Liu JW, Lu Y. A colorimetric lead biosensor using DNAzyme-directed assembly of gold nanoparticles. J Am Chem Soc. 2003;125:6642-3
29. Wang J, Wang L, Liu X, Liang Z, Song S, Li W. et al. A gold nanoparticle-based aptamer target binding readout for ATP assay. Adv Mater. 2007;19:3943-6
30. Liu D, Wang Z, Jin A, Huang X, Sun X, Wang F. et al. Acetylcholinesterase-catalyzed hydrolysis allows ultrasensitive detection of pathogens with the naked eye. Angew Chem Int Ed. 2013;52:14065-9
31. Chapman R, Lin Y, Burnapp M, Bentham A, Hillier D, Zabron A. et al. Multivalent nanoparticle networks enable point-of-care detection of human phospholipase-A2 in serum. ACS Nano. 2015;9:2565-73
32. Byun JY, Shin YB, Kim DM, Kim MG. A colorimetric homogeneous immunoassay system for the C-reactive protein. Analyst. 2013;138:1538-43
33. Yezhelyev MV, Qi LF, O'Regan RM, Nie SM, Gao XH. Proton-sponge coated quantum dots for siRNA delivery and intracellular imaging. J Am Chem Soc. 2008;130:9006-12
34. Liu WH, Howarth M, Greytak AB, Zheng Y, Nocera DG, Ting AY, Bawendi MG. Compact biocompatible quantum dots functionalized for cellular imaging. J Am Chem Soc. 2008;130:1274-84
35. Wang Z, Zhang J, Ekman JM, Kenis PJA, Lu Y. DNA-mediated control of metal nanoparticle shape: one-pot synthesis and cellular uptake of highly stable and functional gold nanoflowers. Nano Lett. 2010;10:1886-91
36. Brown KR, Natan MJ. Hydroxylamine seeding of colloidal Au nanoparticles in solution and on surfaces. Langmuir. 1998;14:726-8
37. Palik ED. Handbook of optical constants of solids Part II. Academic: Orlando. 1985
38. Zhao L, Ji X, Sun X, Li J, Yang W, Peng X. Formation and stability of gold nanoflowers by the seeding approach: the effect of intraparticle ripening. J Phys Chem C. 2009;113:16645-51
39. Niu CG, Liu J, Qin P-Z, Zeng G-M, Ruan M, He H. A novel bifunctional europium chelate applied in quantitative determination of human immunoglobin G using time-resolved fluoroimmunoassay. Anal Biochem. 2011;409:244-8
40. Tang D, Niessner R, Knopp D. Flow-injection electrochemical immunosensor for the detection of human IgG based on glucose oxidase-derivated biomimetic interface. Biosens Bioelectron. 2009;24:2125-30
41. Zhong Z, Li M, Xiang D, Dai N, Qing Y, Wang D. et al. Signal amplification of electrochemical immunosensor for the detection of human serum IgG using double-codified nanosilica particles as labels. Biosens Bioelectron. 2009;24:2246-9
42. Wang M, Hou W, Mi CC, Wang WX, Xu ZR, Teng HH. et al. Immunoassay of goat antihuman immunoglobulin G antibody based on luminescence resonance energy transfer between near-infrared responsive NaYF4:Yb, Er upconversion fluorescent nanoparticles and gold nanoparticles. Anal Chem. 2009;81:8783-9
43. Ho JAA, Lin YC, Wang LS, Hwang KC, Chou PT. Carbon nanoparticle enhanced immunoelectrochemical detection for protein tumor marker with cadmium sulfide biotracers. Anal Chem. 2009;81:1340-6
Author contact
![]() Corresponding author: E-mail: liudbedu.cn.
Corresponding author: E-mail: liudbedu.cn.