Theranostics
13.3
Impact Factor
- Current Issue
- Advance Articles
- Volume 16; 2026
- Volume 15; 2025
- Volume 14; 2024
- Volume 13; 2023
- Volume 12; 2022
- Archive
- Cover Images
- Cover Suggestion
- Special Issues
Top
Introduction
Materials and methods
Results
Discussion
Abbreviations
Supplementary Material
Acknowledgements
References
Introduction
Materials and methods
Results
Discussion
Abbreviations
Supplementary Material
Acknowledgements
References
International Journal of Biological Sciences
International Journal of Medical Sciences
 Global reach, higher impact

Theranostics 2017; 7(5):1114-1132. doi:10.7150/thno.18175 This issue Cite
Research Paper
The YAP1/SIX2 axis is required for DDX3-mediated tumor aggressiveness and cetuximab resistance in KRAS-wild-type colorectal cancer
De-Wei Wu1, Po-Lin Lin1, Lee Wang2, Chi-Chou Huang3, Huei Lee1 ![]()
1. Graduate Institute of Cancer Biology and Drug Discovery, Taipei Medical University, Taipei, Taiwan
2. Department of Public Health, Chung Shan Medical University, Taichung, Taiwan
3. Department of Surgery, Chung Shan Medical University, Taichung, Taiwan
Received 2016-11-1; Accepted 2017-1-4; Published 2017-2-27
Citation:
Wu DW, Lin PL, Wang L, Huang CC, Lee H. The YAP1/SIX2 axis is required for DDX3-mediated tumor aggressiveness and cetuximab resistance in KRAS-wild-type colorectal cancer. Theranostics 2017; 7(5):1114-1132. doi:10.7150/thno.18175. https://www.thno.org/v07p1114.htm
Other stylesAbstract

The mechanism underlying tumor aggressiveness and cetuximab (CTX) resistance in KRAS-wild-type (KRAS -WT) colorectal cancer remains obscure. We here provide evidence that DDX3 promoted soft agar growth and invasiveness of KRAS-WT cells, as already confirmed in KRAS-mutated cells. Mechanistically, increased KRAS expression induced ROS production, which elevated HIF-1α and YAP1 expression. Increased HIF-1α persistently promoted DDX3 expression via a KRAS/ROS/HIF-1α feedback loop. DDX3-mediated aggressiveness and CTX resistance were regulated by the YAP1/SIX2 axis in KRAS-WT cells and further confirmed in animal models. Kaplan-Meier and Cox regression analysis indicated that DDX3, KRAS, and YAP1 expression had prognostic value for OS and RFS in KRAS-WT and KRAS-mutated tumors, but SIX2 and YAP1/SIX2 were prognostic value only in KRAS-WT patients. The observation from patients seemed to support the mechanistic action of cell and animal models. We therefore suggest that combining YAP1 inhibitors with CTX may therefore suppress DDX3-mediated tumor aggressiveness and enhance CTX sensitivity in KRAS-WT colorectal cancer.
Keywords: DDX3, YAP1, SIX2, KRAS, and colorectal cancer.
Introduction
Colorectal cancers are the most frequently encountered carcinomas in Europe and North America (1). The incidence rate of this disease has also markedly increased in Taiwan in the past two decades (2). Unfortunately, relapses of metastatic colorectal cancer remain common, due to resistance to standard treatments that include chemotherapy, anti-angiogenesis therapies, and anti-EGFR monoclonal antibody treatments, administered singly or in combination (3-7). These treatment failures are largely a result of the incomplete understanding of the mechanisms underlying tumor aggressiveness and resistance to therapeutics in colorectal cancer.
Tumor growth and metastasis in colorectal cancer occurs due to KRAS gene mutations, which promote the loss of APC expression by triggering activation of β-catenin/TCF by ERK signaling (8,9). We recently reported that DDX3 promoted tumor invasion in colorectal cancer, regardless of APC loss, by activating β-catenin/TCF signaling via the CK1ε/Dvl2 axis (10). We further demonstrated that DDX3 upregulated KRAS transcription and enhanced oncogenic KRAS-mediated tumor invasion following β-catenin/TCF activation by MEK/ERK and PI3K/AKT signaling (11). Therefore, the colorectal tumor aggressiveness mediated by KRAS mutation appears to require β-catenin/TCF activation by DDX3. However, the involvement of DDX3 in the progression and metastasis of KRAS-wild-type (WT) colorectal tumors remains to be established.
Activation of YAP1, a novel oncogene in the Hippo pathway, is known to promote tumorigenesis (12). In particular, a YAP1 transcriptional complex (β-catenin-YAP1- TBX5) is required for the survival and tumorigenesis of β-catenin-derived cancers (13). Expression of YAP1 restored the viability of KRAS-mutated colon cancer cells in which KRAS signaling was suppressed (14). Similarly, YAP1 expression was positively correlated with poor prognosis and resistance to the anti-EGFR antibody cetuximab (CTX) in colorectal cancer patients, regardless of their KRAS mutational status (15).
A higher frequency of unfavorable responses to CTX has been reported in KRAS-mutated than in KRAS-WT colorectal cancer (6). KRAS mutation is therefore a key predictor of poor response to CTX in colorectal cancer patients. However, an unfavorable response to CTX also occurs in KRAS-WT colorectal cancer patients, but the mechanism underlying this CTX resistance is unclear (16). Our preliminary data indicate that an increase in KRAS expression by ectopic DDX3 expression elevates levels of reactive oxygen species (ROS) and HIF-1α expression. A software analysis predicted HIF-1α as a putative YAP1 transcription factor. We therefore hypothesized that increases in YAP1 expression due to DDX3-mediated HIF-1α expression, which in turn is triggered by increased KRAS-induced ROS production, might represent a mechanism for tumor aggressiveness and CTX resistance that is unique to KRAS-WT colorectal cancers.
Materials and methods
Cell lines
SW48 cells were kindly provided by Dr. Wun-Shaing Wayne Chang (National Institute of Cancer Research, National Health Research Institutes, Miaoli, Taiwan). COLO320 HSR (COLO) were kindly provided by Dr. Yen-Chou Chen (Graduate Institute of Medical Science, Taipei Medical University, Taipei, Taiwan). All other cells were obtained from the American Type Culture Collection (ATCC) and the culture condition as described elsewhere. Cells were cultured and stored according to the suppliers' instructions and used at passages 5 to 20. Once resuscitated, cell lines are routinely authenticated (once every 6 months, cells were last tested in December 2013) through cell morphology monitoring, growth curve analysis, species verification by isoenzymology and karyotyping, identity verification using short tandem repeat profiling analysis, and contamination checks.
Study subjects
This study enrolled of 138 patients with colorectal cancer. The inclusion criteria for patients were: primary diagnosed with colorectal carcinoma; no metastatic disease at diagnosis; no previous diagnosis of carcinoma; no neoadjuvant treatment before primary surgery; no evidence of disease within one month of primary surgery. Tumor specimens collected from surgically-resected colorectal cancer patients were stored at -80℃ in the Division of Colon and Rectum, Chung Shan Medical University Hospital (Taichung, Taiwan), between 1996 and 2006. Patients were asked to submit written informed consent and the study was approved by the Institutional Review Board (201312044). The tumor stage of each specimen were histologically determined according to the WHO classification system. Cancer relapse data were obtained by chart review and confirmed by surgeons. Clinical parameters and overall survival (OS) data were collected from chart review and the Taiwan Cancer Registry, Ministry of Health and Welfare, Executive Yuan, Taiwan, ROC. Survival time was defined as the period from the date of primary surgery to the date of death. The median follow-up time was 1432 days (ranging from 102 to 2572 days) and the end of the follow-up period was December 2007. Based on follow-up data, relapse data from 138 patients were available, indicating that 29 patients relapsed (22 had distant metastasis, and 7 had local and distant metastasis). Tumors frequently relapsed in the liver (13 patients), metastasized in the lung (4 patients), hypopharynx (1 patient) bone (1 patient), left para-aortic lymph node (1 patient), pelvic (1 patient), rectum (1 patient), and 7 patients had tumors that metastasized to more than one organ.
Chemicals and antibodies
AZD6244 and Verteporfin were obtained from Selleckchem (Houston, TX). Cetuximab was kindly provided as a gift from Merck (Biberach, Germany). All other chemicals were purchased from Sigma Chemical (St. Louis, MO) unless otherwise indicated. Anti-total ERK, and anti-phosphorylated (p)-ERK antibodies were obtained from Cell Signaling (Danvers, MA). All other antibodies were purchased from Santa Cruz Biotechnology (Dallas, TX).
Plasmid constructs and transfection
DDX3 (#1 TRCN0000000001; #2 TRCN0000000003), YAP1 (TRCN00001072660), HIF1-α (TRCN0000318674), KRAS (TRCN0000033260), β-catenin (TRCN0000314991), ERK1/2 (TRCN0000010050, TRCN0000006150), CD84 (TRCN0000057476) and SIX2 (TRCN0000014643) shRNAs were purchased from the National shRNA Core Facility, Academia Sinica (Taipei, Taiwan). DDX3 and YAP1 overexpression plasmids were obtained from Addgene Company (Cambridge, MA). YAP1 and SIX2-Luc plasmid were purchased from GeneCopoeia Company (Rockville, MD). The SIX2-Luc plasmid was constructed by inserting different length EcoRI/HindIII fragment into a EcoRI/HindIII-treated pEZX-PG02.1 vector (GeneCopoeia, Rockville, MD). The c-fos-mutated binding site on the SIX2 promoter constructs containing multiple-point mutations were constructed by the QuickChange site-directed mutagenesis system (Stratagene, La Jolla, CA). The WT sequence (#1: GAGTCAGCTT; #2: AATTTGACTC; #3: GCAGTGACTC) for c-fos binding sites on SIX2 promoter has been changed to the mutated sequence (#1: GAATGAGCTT; #2: AATTTGTCGC; #3: GCAGTGTCGC). Different concentrations of expression plasmids were transiently transfected into colon cancer cells (1 × 10⁶) using the Turbofect reagent (Glen Burnie, MD). After 48 h, the cells were harvested and whole cell extracts were assayed in subsequent experiments.
Western blotting
Equal amounts of protein were separated onto sodium dodecyl sulfate-polyacrylamide gel electrophoresis (SDS-PAGE) gels and then transferred onto a polyvinylidene difluoride membrane (PerkinElmer, Norwalk, CT). After blocking, the membranes were reacted with specific antibody at 4°C overnight, followed by incubation with horseradish peroxidase-conjugated secondary antibody for 1 h. The blots were observed using an enhanced chemiluminescence kit (PerkinElmer).
Immunohistochemistry (IHC) analysis
The immunohistochemical procedures and quantification methods were described previously (17). The intensities of signals were evaluated independently by three observers. Immunostaining scores were defined as the cell staining intensity (0 = nil; 1 = weak; 2 =moderate; and 3 = strong) multiplied by the percentage of labeled cells (0-100%), leading to scores from 0 to 300. A score over 150 was rated as “high” immunostaining, while a score less than 150 was rated as “low” immunostaining.
RNA isolation, real-time PCR, and microarray analysis
Total RNA was extracted by homogenization in 1 ml TRIzol reagent, followed by chloroform extraction and isopropanol precipitation. A 3 μg sample of total RNA from colorectal tumor tissues was reverse transcribed using SuperScript II Reverse Transcriptase (Invitrogen Life Technologies) and oligo(dT) 15 primer. The primer sequences for detecting YAP1 expression were the forward primers, 5'- GCTCTTCAACGCCGTCA-3', and the reverse primer, 5'- AGTACTGGCCTGTCGGGAGT-3'. The primer sequences for detecting SIX2 expression were the forward primers, 5'-GCCAAGGAAAGGGAGAACAACG-3', and the reverse primer, 5'-GAGTCTTCTCATCCTCCGAGC-3'. For microarray analysis, the RNA isolation and cDNA microarray analyses were conducted by the Phalanx Biotech Group (Hsinchu, Taiwan). Gene expression chip performed with HOA v6.1 human OneArray. The GEO accession number is GSE88851.
Luciferase reporter assay
Cells were transfected with indicated combination of reporter plasmid with overexpression and knockdown plasmids. Luciferase assays were performed using the Luciferase Reporter Assay System (Promega, Madison, WI) 24 h after transfection. Normalized luciferase activity was reported as the ratio of luciferase activity/β-galactosidase activity.
Anchorage independent soft agar colony formation
The bottom agar consisted of growth medium containing 10% fetal bovine serum and 0.75% agarose in 60 mm tissue culture dishes. Five hundred cells were resuspended in growth medium containing 10% fetal bovine serum and 0.75% agarose and plated on top of the bottom agar. The cells were incubated at 37 °C in 5% CO2. Colonies were visualized and quantified under a microscope after 18 days' cultivation, and the numbers of colonies larger than 100 micrometers in diameter were counted.
Invasion assay
The Boyden chamber with a pore size of 8 μm was used for cell invasion assay. Cells (1 × 10⁴) in 0.5% serum containing culture medium (HyClone, Ogden, UT) were plated in the upper chamber and 10% fetal bovine serum was added to culture medium in the lower chamber as a chemoattractant. The upper side of the filter was covered with 0.2% Matrigel (Collaborative Research, Boston, MA) diluted in RPMI-1640. After 16 h, cells on the upper side of the filter were removed and cells that adhered to the underside of membrane were fixed in 95% ethanol and stained with 10% Giemsa dye. The number of invasive cells was counted in the ten contiguous fields.
Chromatin Immunoprecipitation (ChIP) assay
For the IP experiments, cells transfected with plasmids were harvested and cell lysates were prepared using the IP lysis buffer. Cell extracts (1.5 mg) were incubated with 40 μL of anti-antibody-agarose affinity gel (Millipore). After extensive washing with immunoprecipitation lysis buffer, the immunoprecipitated proteins were analyzed by immunoblotting using specific antibodies Immunoprecipitated DNA was precipitated with ethanol and resuspended in 20 μL ddH2O. The eluates were diluted 1:50 in dilution buffer and then subjected to immunoprecipitation with the second antibodies. PCR amplification of immunoprecipitated DNA was carried out using the primers consisting of the oligonucleotides that encompass the promoter region. The PCR products were separated on 2% agarose gels and analyzed using ethidium bromide staining. The primer sequence of the HIF-1α binding site on the YAP1 promoter was: the forward primer, 5'- AGAATACGGGGCACGCTTC-3' and the reverse primer, 5'- CCTGCACACTCCCGGC-3'. The primer sequence of the c-fos binding site on the SIX2 promoter was: #1 the forward primer, 5'- ACCACCGTCCTAGAGTCCC-3' and the reverse primer, 5'- CTATGGAAGCTGACTCCGGC-3'. #2 the forward primer, 5'- GTGACTGACAGCGTCTCCAT-3' and the reverse primer, 5'- ATTCTAAGCGGGCATGAGGC-3'. #3 the forward primer, 5'- CGAGGGCTTGGGCCAG-3' and the reverse primer, 5'- ACTGGCCCCCGGTGAG-3'.
Annexin V-PI staining
The cells were collected by trypsinization and centrifugation at 1,000 g for 5 min. Following resuspension in binding buffer (10 mM HEPES-NaOH, 140 mM NaCl, 2.5 mM CaCl2) at a final cell density of 1~2 × 10⁶ cells/ml, 100 μl of a single-cell suspension (1~2 × 10⁵ cells) was incubated with 5 μl annexin V-FITC and 5 μl PI for 15 min at room temperature in the dark. After addition of 400 μl of binding buffer, the samples were analyzed by using a BD FACSCalibur flow cytometer (BD Biosciences, San Jose) within 1 h. For each sample, 10,000 events were counted.
MTT cytotoxicity assay
The cell lines were cultured in a humidified incubator containing 95% air and 5% CO2 at 37°C in 96-well flat-bottomed microtiter plates containing RPMI and DMEM supplemented with 10% heat-inactivated fetal bovine serum (FBS), 100 U/ml penicillin, and 100 U/ml streptomycin. Before CTX treatment, the cells in the exponential growth phase were pretreated with overexpression and knockdown plasmids for 24 h. After 48 h of incubation, the in vitro cytotoxic effects of these treatments were determined by MTT assay (at 570 nm) and the cell viability was expressed as a percentage of the control (untreated) cells (% of control).
In vivo tail-vein injection animal model
The tail-vein injection was according with previous studies (18-20). Mice were injected with colon cancer cells via the tail vein (105 cells in 0.1 ml of PBS) at day 7. Six weeks after injection of tumor cells, mice were euthanized, and lungs were dissected and examined for the development of visible lung tumor nodules. Tissues were either processed for Hematoxylin and Eosin staining. These animals were maintained in individual ventilated cages according to the guidelines established in "Guide For The Care and Use of Laboratory Animals" prepared by the Committee on Care and Use of Laboratory Animals of the Institute of Laboratory Animal Resources Commission on Life Sciences, National Research Council, U.S.A. (1985). Use of animals has been approved by the Institutional Animal Care and Use Committee of Taipei Medical University, Taipei, Taiwan (LAC-2015-0284).
In vivo preclinical animal model experiments
The tumor cells were injected subcutaneously into the backs of 4-5-week-old female Balb/c nude mice. The xenograft size was measured every three days and the tumor volume was determined as (length x width2)/2. When tumors grew to 100 mm3, mice were randomized to the following groups: vehicle (DMSO), cetuximab (10 mg/kg), AZD6244 (10 mg/kg), Verteporfin (10 mg/kg), and a combination of two of each of the drugs. Drugs were administered by intraperitoneal injection every three days.
Statistical analysis
Statistical analysis was performed using the SPSS statistical software program (Version 18.0; SPSS Inc.). The association between DDX3, KRAS, YAP1 and SIX2 expression was analyzed by the chi-square test. Survival plots were generated using the Kaplan-Meier method and differences between patient groups were determined by the log-rank test. Multivariate Cox regression analysis was performed to determine OS and RFS. The analysis was stratified for all known variables (age, gender, smoking status and tumor stage) and protein expression.
Results
DDX3 promotes soft agar growth and invasiveness in KRAS-WT colon cancer cells
DDX3 promotes tumor aggressiveness in KRAS-mutated colorectal cancer (11), so we determined whether it would promote soft agar growth and cell invasiveness in KRAS-WT colorectal cancer cells. Western blotting revealed the highest expression of DDX3 in HT29 cells, followed by SNU-C1, COLO320 HSR (COLO), and SW48 cells (Figure 1A). The high-DDX3-expressing HT29 and SNU-C1 cells were transfected with two kinds of DDX3 small hairpin (sh) RNAs and the low-DDX3-expressing SW48 and COLO cells were transfected with two doses of a DDX3 expression vector. These transfections changed the expression of DDX3 in these four cell types in the expected manner (Figure 1B). Representative results for soft agar colony formation and matrigel membrane invasiveness are shown in Figure 1C. Both abilities were markedly decreased in DDX3-knockdown HT29 and SNU-C1 cells (Figure 1D) and dose-dependently increased in DDX3-overexpressing SW48 and COLO cells (Figure 1D). Therefore, DDX3 expression appeared to increase the aggressiveness of KRAS-WT cells, as already confirmed in KRAS-mutated cells (11).
Figure 1
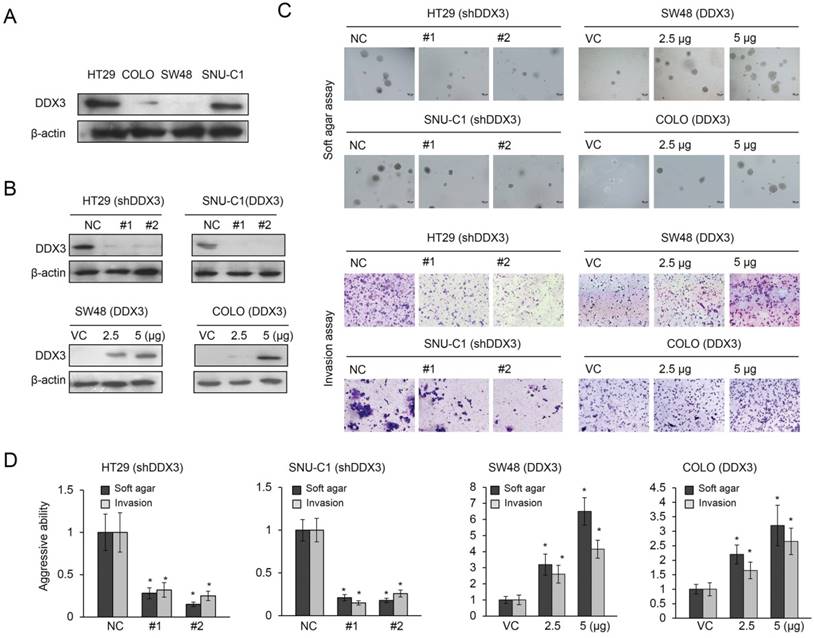
Increased expression of DDX3 promotes soft agar growth and invasiveness in KRAS-WT colorectal cancer cells. (A) Four KRAS-WT colorectal cancer cell lines (HT29, SNU-C1, COLO, and SW48) were used to evaluate the expression levels of DDX3 protein by western blotting. (B) In the HT29 and SNU-C1 cells, DDX3 was knocked down by two types of DDX3 shRNAs. DDX3 was overexpressed in COLO and SW48 cells following treatment with various doses of DDX3 expression vector. The DDX3 protein expression was determined by western blotting. (C) Representative soft agar colony formation and the number of invading cells in these four cell lines with and without DDX3 expression. (D) The soft agar colony formation and the invasiveness was evaluated in HT29 and SNU-C1 cells, with or without DDX3 shRNA transfection, and in COLO and SW48 cells, with or without DDX3 expression vector transfection, and compared with the soft agar colony formation and invasiveness of control cells. P value was calculated by the Student's t-test. The significant differences in experimental groups were compared to VC or NC (*P < 0.05).
DDX3 promotes cell aggressiveness via a KRAS/ROS/HIF-1α /DDX3 cascade feedback loop
Enhanced KRAS transcription by ectopic DDX3 expression is triggered by increased binding of Sp1 to the KRAS promoter (11). Western blotting showed that DDX3 knockdown decreased KRAS expression in HT29 and SNU-C1 cells and DDX3 overexpression increased this expression in SW48 and COLO cells (Figure 2A). Cell aggressiveness was markedly altered by DDX3 manipulation in SNU-C1 and SW48 cells (Figure 2B). These changes in aggressiveness by DDX3 manipulation were nearly completely reversed by KRAS manipulation in both cell types when compared with their control cells (Figure 2B). The ROS level was decreased in SNU-C1 cells and increased in SW48 cells by DDX3 manipulation (Figure 2C upper panel). However, the increase in ROS level due to DDX3 overexpression was almost completely reversed by KRAS silencing in DDX3-overexpressing SW48 cells (Figure 2C lower panel). The increase in ROS level triggered by DDX3 overexpression appeared to promote aggressiveness in KRAS-WT colon cancer cells by upregulation of KRAS expression.
High ROS levels are also associated with greater HIF-1α and YAP1 expression (21,22), so we examined the possibility that cell aggressiveness induced by DDX3 overexpression could enhance HIF-1α and YAP1 expression via KRAS-induced ROS generation. Western blotting indicated that the expression of KRAS, YAP1, and HIF-1α in SNU-C1 cells was almost completely eliminated by DDX3 manipulation, KRAS silencing, or treatment with the ROS scavenger N-acetylcysteine (NAC) (Figure 2D). SW48 cells subjected to the same treatments showed the opposite effects (Figure 2D). SW48 and COLO cells were treated with a ROS inducer (pyocyanin), followed by co-transfection with shHIF-1α, shYAP1, or shKRAS. DDX3, KRAS, HIF-1α, and YAP1 expression were induced by ROS inducer in SW48 and COLO cells (Figure 2D). Interestingly, nearly complete elimination of DDX3, KRAS, HIF-1α, and YAP1 expression were found in SW48 and COLO cells transfected with shHIF-1α or shKRAS, as determined by western blots (Figure 2D). These results supported a previous study indicating that HIF-1α directly upregulates DDX3 expression at the transcription level (23). The aggressiveness induced by DDX3 in KRAS-WT cells may therefore arise via a KRAS/ROS/HIF-1α/DDX3 feedback loop.
ROS generation by DDX3-induced KRAS expression promotes YAP1 transcription via enhanced HIF-1α binding to the YAP1 promoter
A software analysis indicated a putative binding site for HIF-1α located at -1136/-1044 on the YAP1 promoter (-1434/+182) (http://alggen.lsi.upc.es/cgi-bin/promo_v3/promo/promoinit.cgi?dirDB=TF_8.3., Figure 2E). We therefore examined the possibility that ROS generation by DDX3-induced KRAS expression could upregulate YAP1 transcription by enhancing HIF-1α binding to the YAP1 promoter. Luciferase reporter assays and real-time PCR analysis showed a strong decrease in YAP1 promoter activity and its mRNA level in DDX3-knockdown SNU-C1 cells, but a dose-dependent increase in DDX3-overexpressing SW48 cells (Figure 2E). The YAP1 promoter activity in SNU-C1 and SW48 cells was almost completely eliminated by transfection with shDDX3, shKRAS, shHIF-1α, or NAC treatment, when compared with both cell types transfected with a non-specific shRNA (NC) (Figure 2F). Pyocyanin treatment markedly elevated the YAP1 promoter activity in SNU-C1 and SW48 cells, but this increase was suppressed by transfection with shHIF-1α or shKRAS, when compared with both cell types transfected with an empty expression vector (VC) (Figure 2F). ChIP assays using real-time PCR analysis confirmed that HIF-1α binding to the YAP1 promoter was almost completely eliminated by shDDX3, shKRAS, shHIF-1α, or NAC treatment in SNU-C1 and DDX3-overexpressing SW48 cells, compared with NC cells (Figure 2G). Similarly, HIF-1α binding to the YAP1 promoter was nearly eliminated by shHIF-1α or shKRAS transfection in HT29 and SW48 cells in the presence of pyocyanin, when compared with control cells (Figure 2G). These results indicated that ROS generation due to DDX3-induced KRAS expression enhanced HIF-1α binding to the YAP1 promoter and upregulated YAP1 transcription.
The YAP1/SIX2 axis is responsible for DDX3-mediated cell invasiveness
We used western blotting to explore the possibility that YAP1 could be responsible for DDX3-mediated cell invasiveness by examining the changes in DDX3 and YAP1 expression by gene manipulations in four types of KRAS-WT colon cancer cells (Figure 3A upper panel). HIF-1α expression was increased as expected in DDX3-overexpressing SW48 and COLO cells, but was unchanged by YAP-1 silencing. Boyden chamber assays showed that invasiveness was markedly decreased by YAP1 knockdown in HT29 and SNU-C1 cells. The increased invasiveness due to DDX3 overexpression was nearly eliminated in YAP1-knockdown SW48 and COLO cells, when compared with their VC cells (Figure 3A lower panel). The increased invasiveness of DDX3-overexpressing SW48 cells was nearly completely reversed by shKRAS, shHIF-1α, or shYAP1 transfection or by treatment with a PI3K inhibitor LY294002 or NAC, when compared with VC cells (Figure 3B).
We conducted a microarray analysis to identify which gene(s) could be modulated by the DDX3-YAP1 axis. The microarray analysis data showed more than two-fold increase of gene expressions by DDX3 overexpression and then decreased by YAP1 silencing in SW48 cells (Figure 3C left panel). Among these genes, CD84 and SIX2 were selected for further experiments because both genes have known to play an oncogenic role in leukemia and breast cancer (24,25).
Figure 2
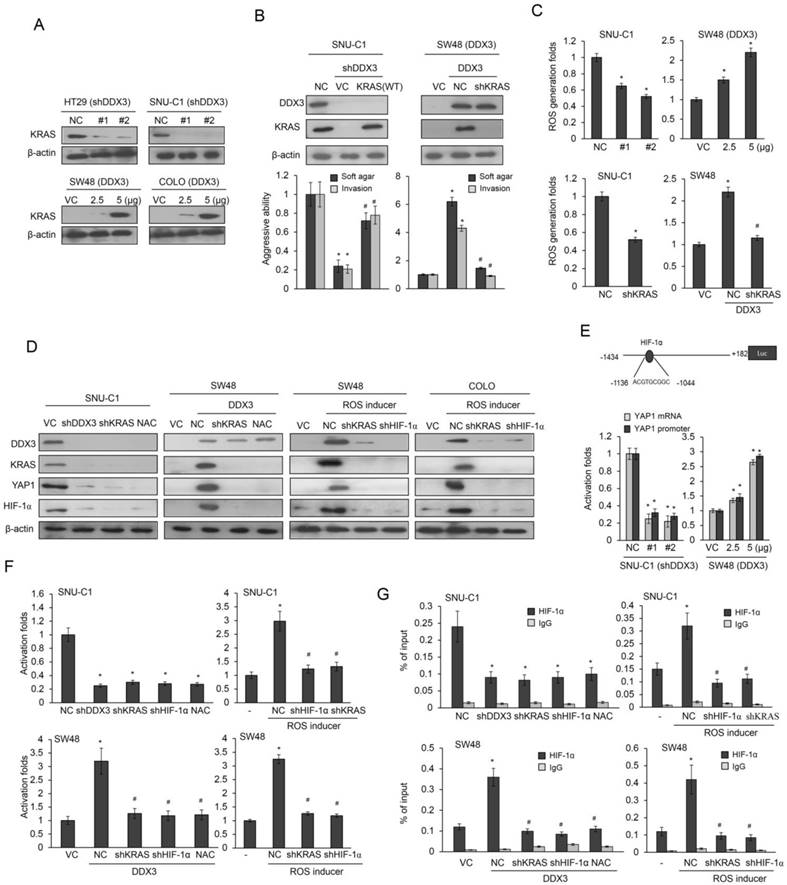
DDX3 promotes cell aggressiveness via the feedback loop of KRAS/ROS/HIF-1α/DDX3 cascade. (A) The expression of KRAS in DDX3-knockdown HT29 and SNU-C1 cells and DDX3-overexpression SW48 and COLO cells was evaluated by western blotting. (B) SNU-C1 cells were transfected with the indicated combination of DDX3 shRNA and wild-type (WT) KRAS for 24 h. SNU-C1 cells were transfected with the indicated combination of DDX3 expression vector and KRAS shRNA for 24 h. The aggressiveness was evaluated by the soft agar colony formation and the invasiveness. The expression of DDX3 and KRAS was determined by western blotting. (C) SNU-C1 cells were transfected with the indicated combination of DDX3 shRNA and KRAS-WT shRNA for 24 h. SNU-C1 cells were transfected with indicated combination of DDX3 expression vector and KRAS shRNA for 24 h. ROS production was evaluated by a flow cytometry. (D) SNU-C1 and DDX3-overexpressing SW48 cells were incubated in the presence or absence of NAC for 5h and then co-transfected with KRAS-WT shRNA for 24 h. Expression of DDX3, KRAS, YAP1, HIF-1α, and β-actin was then determined by western blotting of cell lysates. SW48 and COLO cells were treated with pyocyanin for 5 h. KRAS or HIF-1α shRNAs were transfected into both cell types for 24 h and then the expression of DDX3, KRAS, YAP1, HIF-1α and β-actin was evaluated by western blotting of cell lysates. (E) Schematic diagram of YAP1 promoter-driven luciferase reporters. YAP1 mRNA and promoter (-1434/+182) activity in DDX3-knockdown SNU-C1 cells and DDX3-overexpression in SW48 cells was evaluated by real-time PCR and luciferase reporter activity assays. (F) SNU-C1 and DDX3-overexpressing SW48 cells were incubated with or without NAC for 5h and with or without KRAS shRNA for 24 h. The SW48 and COLO cells were treated with pyocyanin for 5 h. SW48 and COLO cells were transfected with KRAS or HIF-1α shRNAs for 24 h. The luciferase reporter activity assay were performed to evaluate the promoter activity. (G) SNU-C1 and DDX3-overexpressing SW48 cells were incubated with or without NAC for 5h and with or without KRAS shRNA for 24 h. The SW48 and COLO cells were treated with pyocyanin for 5 h. SW48 and COLO cells were transfected with KRAS or HIF-1α shRNAs for 24 h. Chromatin Immunoprecipitation (ChIP) assays were performed to evaluate the binding activities of putative transcription factors. P value was calculated by the Student's t-test. The significant differences in experimental groups were compared to VC or NC (*P < 0.05). The significant differences in experimental groups were compared to DDX3-overexpression alone (#P < 0.05). For ROS inducer experiment, the significant difference was compared to vehicle controls (*P < 0.05). The significant difference was compared to ROS inducer treatment alone (#P < 0.05).
Figure 3
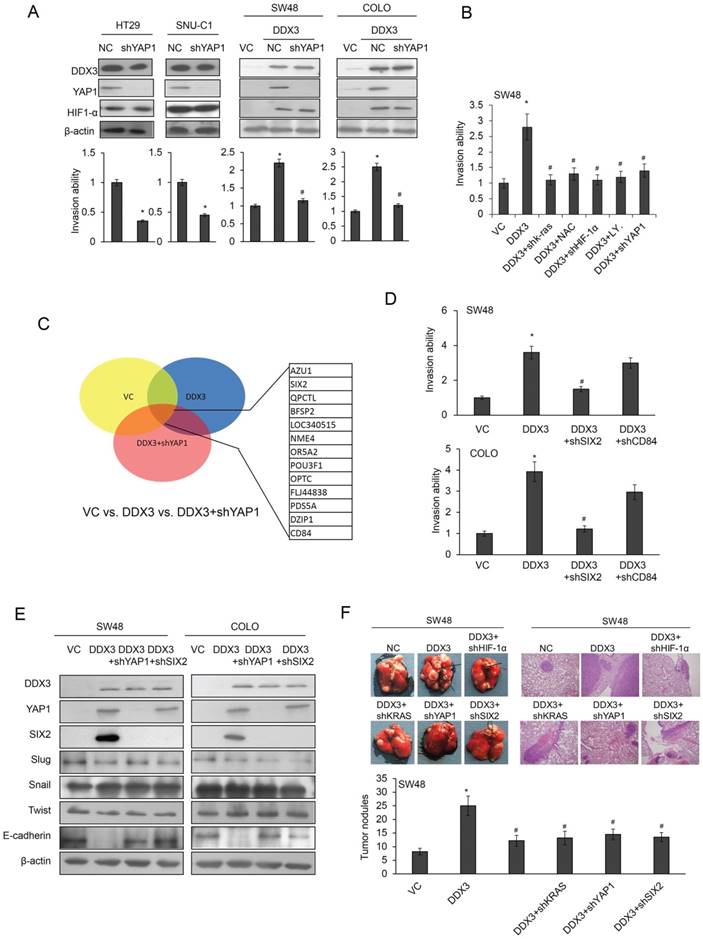
The YAP1/SIX2 axis is responsible for DDX3-mediated cell invasiveness. (A) HT29 and SNU-C1 cells were transfected with YAP1 shRNA for 24 h. SW48 and COLO cells were transfected with the indicated combination of DDX3 expression vector and YAP1 shRNA for 24 h. The invasiveness was evaluated by Boyden chamber assays. The expression of DDX3, YAP1, HIF-1α, and KRAS was determined by western blotting. (B) SW48 cells were treated with the indicated combinations of DDX3 expression vector, NAC, LY294002, HIF-1α shRNA, or YAP1 shRNA for 24 h. The invasiveness was evaluated by Boyden chamber assays. (C) Microarray analysis of SW48 transfected with the indicated combinations of DDX3 expression vector and YAP1 shRNA for 24 h. (D) DDX3-overexpressing SW48 and COLO cells were transfected with the indicated combinations of SIX2 or CD84 shRNA for 24 h. The invasiveness was evaluated by Boyden chamber assays for an additional 16 h. (E) DDX3-overexpressing SW48 and COLO cells were transfected with the indicated combinations of YAP1 or SIX2 shRNA for 48 h. The expression of DDX3, YAP1, SIX2, Slug, Snail, Twist, E-cadherin, and β-actin was evaluated by western blotting of the cell lysates. (F) The stable clones of DDX3-overexpressing SW48 and DDX3/shHIF-1α, DDX3/shKRAS, DDX3/shYAP1 and DDX3/shSIX2 combinations were established for animal experiments. Examples of mice with visual lung tumor nodules at 8 weeks after tail vein inoculation of the indicated cell types. Representative H & E staining of lung tumor nodules from each group of mice are shown. The number of lung tumor nodules in each group of mice. Data are presented as mean ± SD. P value was calculated by the Student's t-test. The significant differences in experimental groups were compared to VC or NC (*P < 0.05). The significant differences in experimental groups were compared to the group of DDX3-overexpression alone (#P< 0.05).
Boyden chamber assays indicated that the invasiveness of DDX3-overexpressing COLO and SW48 cells was almost completely reversed by SIX2 silencing, but was slightly unchanged by CD84 knockdown (Figure 3D right panel). Western blotting revealed marked elevations of YAP1 and SIX2 expression, but reduced E-cadherin expression, in DDX3-overexpressing SW48 cells. However, the three transcriptional repressors of E-cadherin (Slug, Snail, and twist) were nearly unchanged in DDX3 overexpressing SW48 cells (Figure 3E left panel). Similar findings were also observed in DDX3-overexpressing COLO cells subjected to the same treatments (Figure 3E right panel). These results indicated that the YAP1/SIX2 axis may be responsible for DDX3-mediated cell invasiveness via decreased E-cadherin expression.
Induction of xenograft metastatic lung tumors by a DDX3-overexpressing SW48 stable clone occurs through the KRAS/HIF-1α/YAP1/SIX2 cascade
The tail vein injection nude mouse model was used to determine if xenograft metastatic lung tumor nodules could be induced by DDX3 overexpression through the KRAS/HIF-1α/YAP1/SIX2 cascade. Stable clones of DDX3-overexpressing SW48 and DDX3/shHIF-1α, DDX3/shKRAS, DDX3/shYAP1, and DDX3/shSIX2 combinations were established for animal experiments. The representative metastatic lung tumor nodules formed in nude mice injected with the indicated stable clones are shown in Figure 3F. The presence of metastatic lung tumor nodules in nude mice injected with different clones was confirmed by hematoxylin and eosin (H & E) staining (Figure 3F). The highest number of metastatic lung tumor nodules was observed in nude mice injected with the stable DDX3-overexpressing SW48 clone, but this nodules formation was nearly completely suppressed when mice were injected with stable DDX3/shHIF-1α, DDX3/shKRAS, DDX3/shYAP1, and DDX3/shSIX2 SW48 clones (Figure 3F). These animal model results strongly support the mechanism suggested by the cell models, whereby DDX3 promotes tumor invasion via the KRAS/HIF-1α/YAP1/ SIX2 cascade.
DDX3 upregulates SIX2 transcription via enhanced c-fos binding to the SIX2 promoter due to c-fos upregulation and phosphorylation by PI3K/AKT signaling
Luciferase reporter assays and real-time PCR analysis indicated that the promoter activity (-1253/+246) and mRNA levels of SIX2 were dose-dependently increased in DDX3-overexpressing SW48 and COLO cells (Figure 4A upper panel). Conversely, the SIX2 promoter activity and its mRNA levels were markedly decreased by DDX3 knockdown in SNU-C1 and HT29 cells (Figure 4A lower panel). We constructed different lengths of SIX2 promoters (-1253/+246, -719/+246, and -49/+246) by PCR and deletion mutations to elucidate whether the binding activity of c-fos on the SIX2 promoter could be regulated by the DDX3/YAP1 axis. The third, second, and first putative c-fos binding sites were located at the -1253/+246, -719/+246, and -49/+246 regions of the SIX2 promoter (Figure 4B upper panel). The decreased SIX2 promoter activity in SNU-C1 and DDX3-overexpressing SW48 cells depended on the number of c-fos binding sites on these three SIX2 promoters (Figure 4B lower panel). In addition, the reporter activity of these three SIX2 promoters (-1253/+246, -719/+246, and -49/+246) was decreased in DDX3-knockdown SNU-C1 cells (Figure 4B); conversely, the reporter activity of these three SIX2 promoters gradually elevated with DDX3-overexpression in SW48 cells compared with VC cells (Figure 4B).
We constructed c-fos binding site-mutated promoters (-1253/+246) to verify an involvement of c-fos in DDX3-mediated SIX2 transcription. Luciferase reporter assays indicated that the SIX2 promoter activity in SNU-C1 and DDX3-overexpressing SW48 cells depended on the number of c-fos binding site mutations on the SIX2 promoter (Figure 4C lower panel). ChIP analysis further confirmed that c-fos binding activity on the three c-fos-mutated SIX2 promoter was nearly completely eliminated in DDX3-knockdown SNU-C1 and DDX3-overexpressing SW48 cells, when compared with NC and VC cells (Figure 4D). The binding activity of c-fos onto the SIX2 promoter was markedly decreased in SNU-C1 and DDX3-overexpressing SW48 cells by LY294002 treatment or AKT silencing, suggesting that phosphorylated c-fos binding onto the SIX2 promoter depended on c-fos expression initiated by PI3K/AKT signaling (Figure 4E and 4F). DDX3 therefore appears to upregulate SIX2 transcription via enhanced phosphorylated c-fos binding to the SIX2 promoter in response to c-fos expression due to PI3K/AKT signaling.
The YAP1/SIX2 axis may be responsible for DDX3-mediated CTX resistance via an autophagy/apoptotic pathway
We used the MTT assay to examine the possibility that DDX3 may also confer CTX resistance in HT29 and SW48 cells. DDX3 expression was altered by DDX3 manipulation in both cell types. The IC50 value for CTX was markedly decreased, from 1.81μM to 0.16μM, and increased, from 0.22μM to 1.90μM, by DDX3 manipulation in HT29 and WS48 cells, respectively (Figure 5A).
Figure 4
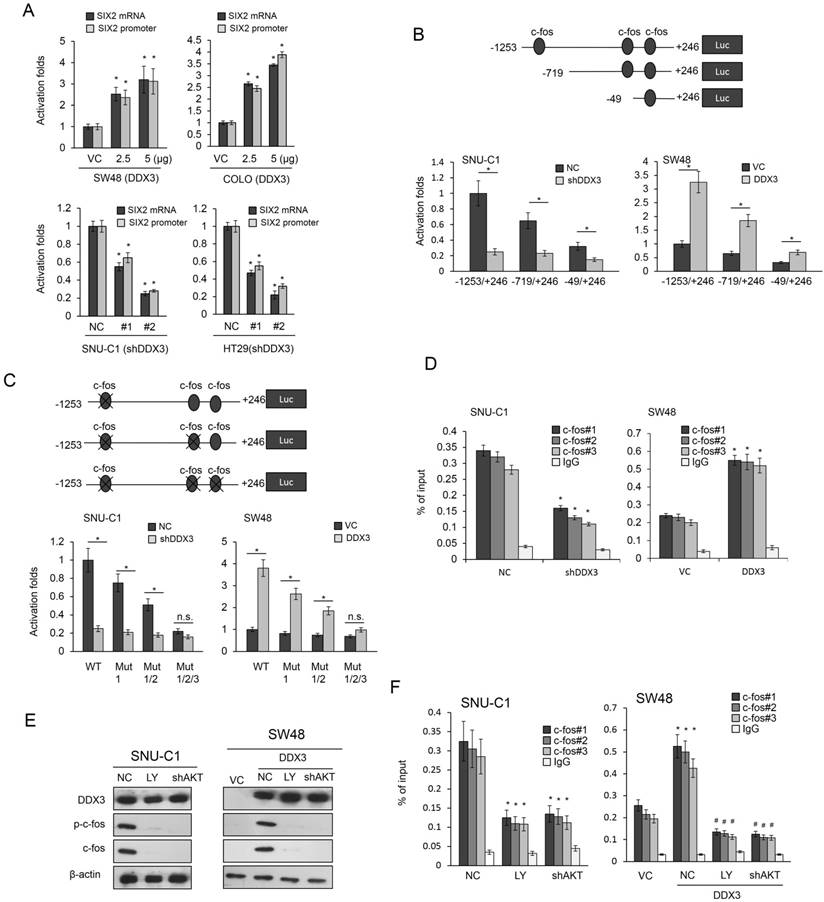
DDX3 upregulates SIX2 transcription via enhanced c-fos binding to the SIX2 promoter due to c-fos upregulation and phosphorylation by PI3K/AKT signaling. (A) SIX2 mRNA and promoter (-1253/+246) activity in DDX3-knockdown SNU-C1 and HT29 cells and DDX3-overexpressing SW48 and COLO cells were evaluated by real-time PCR and luciferase reporter activity assays. (B) Schematic diagram of SIX2-promoter-driven luciferase reporters: SIX2 (-1253/+246)-Luc, SIX2 (-719/+246)-Luc, and SIX2 (-49/+246)-Luc. SIX2 promoter activity in DDX3-knockdown SNU-C1 cells and DDX3-overexpressing SW48 cells was evaluated by luciferase reporter activity assays. (C) Schematic diagram of SIX2-promoter-driven luciferase reporters (-1253/+246) and the mutated construct of the c-fos binding site. The four SIX2 promoter constructs and shDDX3 or its expression vector were co-transfected into the indicated cell types. Luciferase reporter activity was measured at 48 h. (D) The c-fos binding ability in DDX3-knockdown SNU-C1 cells and DDX3-overexpressing SW48 cells was evaluated by ChIP using real-time PCR. SNU-C1 cells and DDX3-overexpressing SW48 cells were treated with an AKT inhibitor LY294002 or with AKT shRNA. (E) The phospho-c-fos (p-c-fos) and total c-fos protein expression was evaluated by western blotting. (F) The p-c-fos binding ability was evaluated by ChIP using real-time PCR. P value was calculated by the Student's t-test. The significant differences in experimental groups were compared to VC or NC (*P < 0.05). The significant differences in experimental groups were compared to the group of DDX3-knockdown or DDX3-overexpression alone (#P< 0.05). N.s., Non-significance.
Figure 5
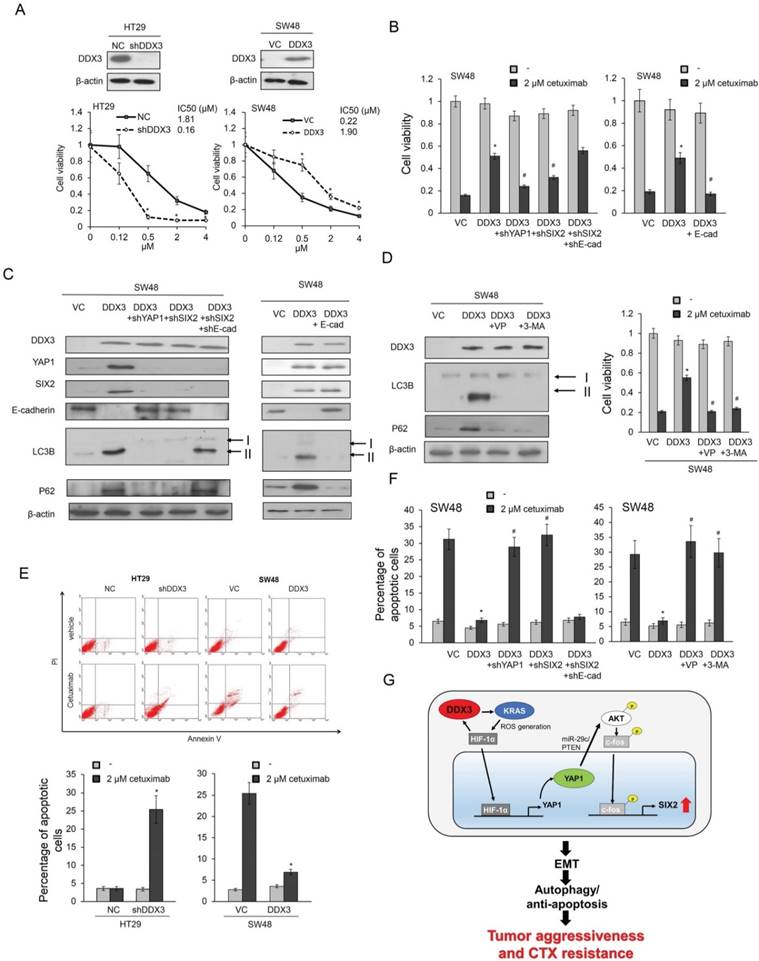
The YAP1/SIX2 axis may be responsible for DDX3-mediated CTX resistance via an autophagy/apoptotic pathway. (A) High-DDX3-expressingHT29 and low-DDX3-expressing SW48 colon cancer cells were transfected with DDX3 shRNA and DDX3 expression vector to determine the the IC50 value for CTX using the MTT assay. (B) SW48 cells were transfected with the indicated combination of DDX3, YAP1 shRNA, SIX2 shRNA, and E-cadherin shRNA for 24 hr. The gene expressions, as indicated, and the cell viability following CTX treatment, were evaluated by western blotting and MTT assays, respectively. (C) The LC3B and P62 expressions in SW48 cells transfected with the indicated combinations of DDX3, YAP1 shRNA, SIX2 shRNA, and E-cadherin shRNA were evaluated by western blotting. (D) DDX3-overexpressing SW48 cells were treated with verteporfin (VP) or 3-MA for 5 h and these cells were then incubated with or without 2 μM CTX for additional 72 h. The cell viability for CTX was evaluated by western blotting and MTT assays. (E) HT29 and SW48 cells were transfected with DDX3 shRNA and DDX3 expression vector for 24 h. These cells were then treated with 0.1% PBS or 2 μM of CTX for 72 h and then subjected to annexin-V/PI assays, followed by a flow cytometry. The percentage of apoptotic cells in the annexin V+/PI- population plus the annexin-V+/PI+ population was summed. (F) SW48 cells were transfected with the indicated combinations of DDX3, YAP1 shRNA, SIX2 shRNA, and E-cadherin shRNA for 24 h. The apoptotic status following CTX exposure was evaluated by annexin-V and PI staining, followed by a flow cytometry. (G) The possible mechanistic action of DDX3 on cetuximab resistance in colorectal cancer cells. P value was calculated by the Student's t-test. The significant differences in experimental groups were compared to VC or NC (*P < 0.05). The significant differences in experimental groups were compared to the group of DDX3-knockdown or DDX3-overexpression alone (#P < 0.05).
We investigated the possible involvement of the YAP1/SIX2 axis in DDX3-mediated CTX resistance by transfecting SW48 cells with a DDX3 expression vector and/or co-transfecting with shYAP1, shSIX2, shE-cadherin, or an E-cadherin expression vector. The cell viability following CTX treatment markedly increased in DDX3-overexpressing SW48 cells, but this increase was almost eliminated by YAP1 or SIX2 silencing or ectopic E-cadherin expression, when compared with control cells (Figure 5B).
Autophagy has been associated with CTX resistance (26), so we used two autophagy molecular markers, LC3B and p62, to determine the possible involvement of autophagy in DDX3-mediated CTX resistance. Western blotting analysis showed that the expression of DDX3, YAP1, SIX2, and E-cadherin in SW48 cells changed as expected following DDX3 overexpression, YAP1, SIX2, and E-cadherin silencing, or ectopic E-cadherin expression (Figure 5C). The expression of LC3B-II and p62 markedly increased in DDX3-overexpressing SW48 cells, but this increase was almost completely eliminated by YAP1 or SIX2 silencing. Interestingly, the expression of LC3B-II and p62 in DDX3-overexpressing SW48 cells was nearly completely reversed by combining SIX2 with E-cadherin silencing (Figure 5C left panel). The increase of LC3B-II and p62 expression in DDX3-overexpressing SW48 cells was nearly completely eliminated by ectopic E-cadherin expression (Figure 5C right panel). Treatment with the YAP1 inhibitor verteporfin and the autophagy inhibitor 3-methyladenine (3-MA) almost completely reversed the increase in LC3B-II and p62 expression induced by DDX3 overexpression in SW48 cells (Figure 5D left panel). The increased cell viability following CTX treatment in DDX3-overexpressing SW48 cells was almost completely eliminated by both inhibitors, when compared with the control cells (Figure 5D right panel). These results clearly indicated an involvement of autophagy in DDX3-mediated CTX resistance modulated by the YAP1/SIX2 axis.
Annexin V-PI staining indicated that the changes in cell viability due to CTX in DDX3-knockdown HT29 and DDX3-overexpressing SW48 cells occurred via apoptosis (Figure 5E). The decrease in apoptotic cell percentages by CTX treatment in DDX3-overexpressing SW48 cells was almost completely reversed by YAP1 or SIX2 silencing, and the restoration of apoptotic cell percentages was nearly reversed by combined SIX2/E-cadherin silencing (Figure 5F). The possible mechanistic action of DDX3 on CTX resistance in KRAS-WT colorectal cancer was proposed in Figure 5G. These results clearly indicate that the YAP1/SIX2 axis is responsible for DDX3-mediated CTX resistance, which occurs via an autophagy/apoptotic pathway.
Combining the YAP1 inhibitor verteporfin with CTX almost completely suppresses tumor burdens induced by a stable DDX3-overexpressing SW48 clone in nude mice
A preclinical animal study combining a YAP1 inhibitor verteporfin with CTX was conducted to examine tumor growth induced by a stable DDX3-overexpressing KRAS-WT SW48 clone in nude mice and compared with tumor growth following CTX, verteporfin, or the ERK inhibitor AZD6244 treatment alone, or a combination AZD6244 plus CTX treatments. Representative subcutaneous tumor burdens of the nude mice in each group are shown in Figure 6A. The tumor burden induced by a stable DDX3-overexpressing SW48 clone was almost completely suppressed by the verteporfin+CTX combination, but only slightly suppressed by CTX, verteporfin, and AZD6244 treatments alone or by the AZD6244+CTX treatment, when compared with vehicle controls. The tumor burden induced by SW48 cells transfected with an empty vector (SW48-VC) was smaller than the tumor burden induced by a stable DDX3-overexpressing SW48 clone. The tumor burden induced by SW48-VC was somewhat suppressed by CTX treatment (Figure 6B and C). Immunohistochemistry analysis indicated that p-EGFR, p-ERK, and YAP1 expression in tumor burden were nearly suppressed by verteporfin+CTX combination, but the cleavage of caspase-3 expression was overexpressed compared with the vehicle group. Interestingly, the cleavage of caspase-3 expression was slight changed by CTX, verteporfin, and AZD6244 treatments alone in tumor burdens (Figure 6D). These results strongly support the mechanism proposed in the cell model for promotion of tumor invasion and CTX resistance by the YAP1/SIX2 axis, mediated by DDX3, in KRAS-WT colorectal cancer.
Figure 6
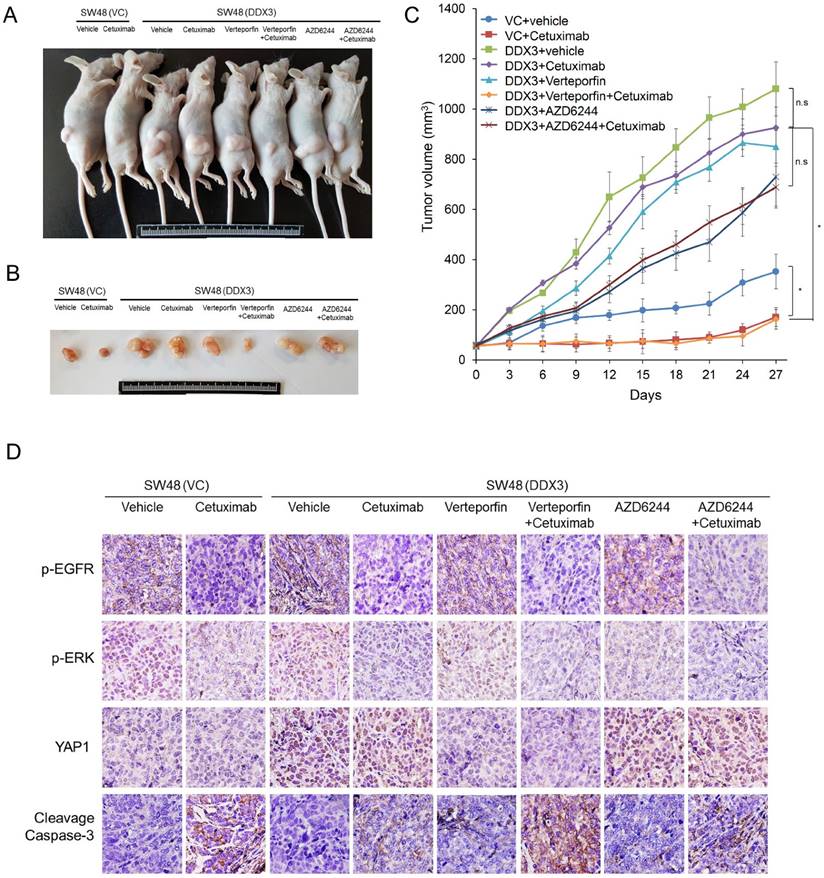
The combination of a YAP1 inhibitor verteporfin with CTX almost completely suppresses the tumor burden induced by tail vein injection of a stable DDX3-overexpressing SW48 clone in nude mice. (A and B) The SW48 xenografts were treated with vehicle or cetuximab (CTX; 10 mg/kg). The DDX3-overexpressing SW48 xenografts were treated with vehicle, CTX (10 mg/kg), verteporfin (10 mg/kg), AZD6244 (10 mg/kg), or the listed combinations. The representative tumor burdens in the eight groups are illustrated. (C) The tumor volumes in the 8 groups of nude mice were measured at 3-day intervals from Day 3 to Day 27. Mean ± SD values (mm3) were calculated from the tumor volumes of five nude mice in each group. (D) A representative immunostaining results of p-EGFR, p-ERK, YAP1, and cleavage caspase-3 in tumors of each group of nude mice. P value was calculated by the Student's t-test. The significance was signed with “*” (P < 0.05). N.s., non-significance.
A positive correlation exists between YAP1 and SIX2 in KRAS-WT patients, but not in KRAS-mutated patients
We collected 138 tumors from colorectal cancer patients for immunohistochemistry analysis to verify the association between DDX3 expression and KRAS, YAP1, and SIX2 expression. Representative immunostaining results are shown in Figure 7A. The expression of DDX3, KRAS, YAP1, and SIX2 was not associated with the clinical parameters of age, genders, smoking status, and Duke's stage. The expression of these four proteins was also not related with KRAS mutations in this study population (Table 1). Interestingly, KRAS, YAP1, and SIX2 were more highly expressed in high-DDX3 tumors than in low-DDX3 tumors (68% vs. 40%, P = 0.001 for KRAS, 81% vs. 23% for YAP1, P < 0.001, 53% vs. 29%, P = 0.006; Table 2). The KRAS expression level was positively correlated with YAP1 and SIX2 expression (58% vs. 22%, P = 0.003 for YAP1; 51% vs. 25%, P = 0.001 for SIX2; Table 2). A positive correlation between YAP1 and SIX2 expression was also observed in this study population (P = 0.001). When the study population was divided by KRAS mutational status, a positive correlation of DDX3 with KRAS, YAP1, and SIX2 was observed in KRAS-WT patients. The correlation of KRAS with YAP1 and SIX2 was still seen in the KRAS-WT patients, but was not observed in the KRAS-mutated patients (Table 2). These results suggest that DDX3-induced tumor invasion via the YAP1/SIX2 axis may play a more important role in KRAS-WT patients than in KRAS-mutated patients.
Figure 7
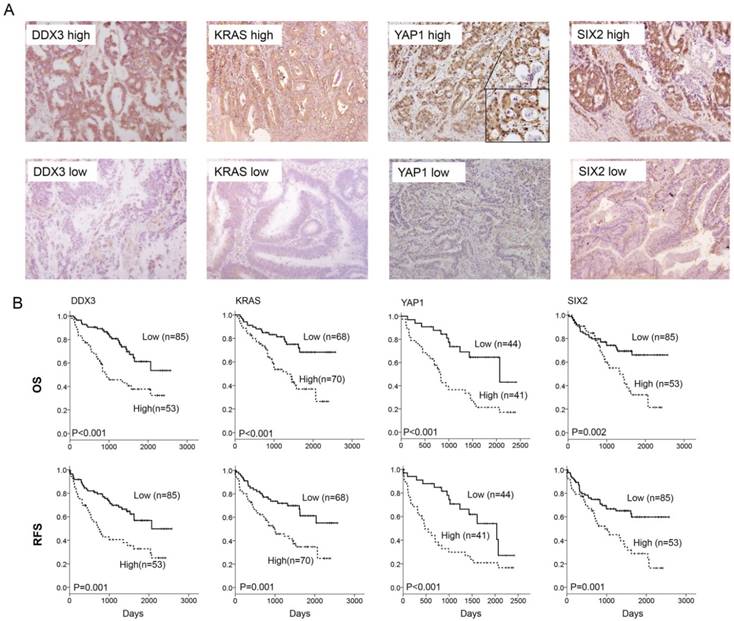
The representative immunostaining results of DDX3, KRAS, YAP1, and SIX2 expression in colorectal tumors and the prognostic value of these molecules on OS and RFS was assessed by a Kaplan-Meier analysis. (A) The representative immunostaining results of DDX3, KRAS, YAP1, and SIX2 in colorectal tumors; (B) The survival curves in patients with high-DDX3, high-KRAS, high-YAP1 and high-SIX2 tumors for OS and RFS were compared to those with low-DDX3, low-KRAS, low-YAP1 and low-SIX2 tumors.
SIX2 and YAP1/SIX2 have prognostic significance for OS and RFS in KRAS-WT, but not in KRAS-mutated, patients
We next examined the possibility that the expression of DDX3, KRAS, YAP1, and SIX2 could be associated with OS and RFS in colorectal cancer. Kaplan-Meier analysis indicated that patients with high DDX3-, KRAS-, YAP1-, and SIX2-expressing tumors exhibited shorter OS and RFS periods than their counterparts (Figure 7B). Cox-regression analysis further showed an independent prognostic value of DDX3, KRAS, YAP1, and SIX2 expression on OS and RFS in the entire study population and in the KRAS-WT subgroup (Table 3). The prognostic significance of DDX3, KRAS, and YAP1 for OS and RFS was also observed, but the prognostic value of SIX2 observed in the KRAS-mutated subgroup was not seen in the KRAS-mutated subgroup (Table 3). The prognostic significance of the YAP1/SIX2 combination for OS and RFS was evident in the KRAS-WT subgroup, but not in the KRAS-mutated subgroup (Table 4). These results from colorectal cancer patients strongly support the mechanism suggested by the cell and animal models whereby DDX3-induced tumor aggressiveness via the DDX3/KRAS/YAP1/SIX2 cascade was predominately revealed in KRAS-WT colorectal cancer, but not in KRAS-mutated colorectal cancer.
Table 1
Association of DDX3, KRAS, YAP1, and SIX2 expression with various clinical parameters in colorectal cancer patients.
| DDX3 | KRAS | YAP1* | SIX2 | |||||||||||||
|---|---|---|---|---|---|---|---|---|---|---|---|---|---|---|---|---|
| n | Low | High | P | n | Low | High | P | n | Low | High | P | n | Low | High | P | |
| Age | ||||||||||||||||
| ≤65 | 61 | 36 (59) | 25 (41) | 0.579 | 61 | 31 (51) | 30 (49) | 0.747 | 38 | 22 (58) | 16 (42) | 0.967 | 61 | 42 (69) | 19 (31) | 0.119 |
| >65 | 77 | 49 (64) | 28 (36) | 77 | 37 (48) | 40 (52) | 47 | 27 (57) | 20 (43) | 77 | 43 (56) | 34 (44) | ||||
| Gender | ||||||||||||||||
| Female | 63 | 36 (57) | 27 (43) | 0.324 | 63 | 29 (46) | 34 (54) | 0.485 | 38 | 22 (58) | 16 (42) | 0.967 | 63 | 37 (59) | 26 (41) | 0.526 |
| Male | 75 | 49 (65) | 26 (35) | 75 | 39 (52) | 36 (48) | 47 | 27 (57) | 20 (43) | 75 | 48 (64) | 27 (36) | ||||
| Smoking status | ||||||||||||||||
| Nonsmokers | 89 | 55 (62) | 34 (38) | 0.947 | 89 | 44 (49) | 45 (51) | 0.959 | 53 | 31 (59) | 22 (42) | 0.839 | 89 | 53 (60) | 36 (40) | 0.506 |
| Smokers | 49 | 30 (61) | 19 (39) | 49 | 24 (49) | 25 (51) | 32 | 18 (56) | 14 (44) | 49 | 32 (65) | 17 (35) | ||||
| Duke stage | ||||||||||||||||
| A & B | 54 | 33 (61) | 21 (39) | 0.925 | 54 | 31 (57) | 23 (43) | 0.126 | 30 | 19 (63) | 11 (37) | 0.433 | 54 | 35 (65) | 19 (35) | 0.533 |
| C & D | 84 | 52 (62) | 32 (38) | 84 | 37 (44) | 47 (56) | 55 | 30 (55) | 25 (45) | 84 | 50 (60) | 34 (40) | ||||
| KRAS | ||||||||||||||||
| WT | 76 | 52 (68) | 24 (32) | 0.068 | 76 | 34 (45) | 42 (55) | 0.238 | 49 | 28 (57) | 21 (43) | 0.913 | 76 | 45 (59) | 31 (41) | 0.524 |
| Mutation | 62 | 33 (53) | 29 (47) | 62 | 34 (55) | 28 (45) | 36 | 21 (58) | 15 (42) | 62 | 40 (65) | 22 (35) | ||||
*85 of 138 results for YAP1 immunohistochemistry were available.
Table 2
Correlation of DDX3 with KRAS and SIX2 expression and association between KRAS and SIX2 expression in colorectal cancer patients with different KRAS status.
| KRAS | YAP1 | SIX2 | ||||||||||
|---|---|---|---|---|---|---|---|---|---|---|---|---|
| No | Low | High | P | No | Low | High | P | No | Low | High | P | |
| All study population | ||||||||||||
| DDX3 | ||||||||||||
| Low | 85 | 51(60) | 34(40) | 0.001 | 48 | 37(77) | 11(23) | <0.001 | 85 | 60(71) | 25(29) | 0.006 |
| High | 53 | 17(32) | 36(68) | 37 | 7(19) | 30(81) | 53 | 25(47) | 28(53) | |||
| KRAS | ||||||||||||
| Low | 23 | 18(78) | 5(22) | 0.003 | 68 | 51(75) | 17(25) | 0.001 | ||||
| High | 62 | 26(42) | 36(58) | 70 | 34(49) | 36(51) | ||||||
| YAP1 | ||||||||||||
| Low | 44 | 32(73) | 12(27) | 0.001 | ||||||||
| High | 41 | 15(37) | 26(63) | |||||||||
| KRAS-WT | ||||||||||||
| DDX3 | ||||||||||||
| Low | 52 | 28(54) | 24(46) | 0.019 | 29 | 22(76) | 7(24) | <0.001 | 52 | 35(67) | 17(33) | 0.034 |
| High | 24 | 6(25) | 18(75) | 20 | 3(15) | 17(85) | 24 | 10(42) | 14(58) | |||
| KRAS | ||||||||||||
| Low | 10 | 8(80) | 2(20) | 0.040 | 34 | 25(74) | 9(26) | 0.022 | ||||
| High | 39 | 17(44) | 22(56) | 42 | 20(48) | 22(52) | ||||||
| YAP1 | ||||||||||||
| Low | 25 | 18(72) | 7(28) | 0.003 | ||||||||
| High | 24 | 7(29) | 17(71) | |||||||||
| KRAS mutation | ||||||||||||
| DDX3 | ||||||||||||
| Low | 33 | 23(70) | 10(30) | 0.012 | 19 | 15(79) | 4(21) | 0.001 | 33 | 25(76) | 8(24) | 0.048 |
| High | 29 | 11(38) | 18(62) | 17 | 4(24) | 13(76) | 29 | 15(52) | 14(48) | |||
| KRAS | ||||||||||||
| Low | 13 | 10(77) | 3(23) | 0.041 | 34 | 26(77) | 8(24) | 0.030 | ||||
| High | 23 | 9(39) | 14(61) | 28 | 14(50) | 14(50) | ||||||
| YAP1 | ||||||||||||
| Low | 19 | 14(74) | 5(26) | 0.102 | ||||||||
| High | 17 | 8(47) | 9(53) | |||||||||
Table 3
Cox regression analysis of DDX3, KRAS, YAP1, and SIX2 expression on the influence of OS and RFS in colorectal cancer patients with different KRAS status.
| Variables | OS | RFS | |||||||
|---|---|---|---|---|---|---|---|---|---|
| Case | Adjusted | 95%CI | P | Case | Adjusted | 95%CI | P | ||
| No. | HR* | No. | HR* | ||||||
| All study population | |||||||||
| DDX3 | |||||||||
| Low | 85 | 1 | 85 | 1 | |||||
| High | 53 | 3.12 | 1.81-5.39 | <0.001 | 53 | 2.56 | 1.56-4.22 | <0.001 | |
| KRAS | |||||||||
| Low | 68 | 1 | 68 | 1 | |||||
| High | 70 | 2.56 | 1.43-4.55 | 0.001 | 70 | 2.17 | 1.29-3.63 | 0.003 | |
| YAP1 | |||||||||
| Low | 44 | 1 | 44 | 1 | |||||
| High | 41 | 3.40 | 1.69-6.86 | 0.001 | 41 | 2.68 | 1.45-4.96 | 0.002 | |
| SIX2 | |||||||||
| Low | 85 | 1 | 85 | 1 | |||||
| High | 53 | 2.27 | 1.34-3.87 | 0.002 | 53 | 2.26 | 1.39-3.68 | 0.001 | |
| KRAS-WT | |||||||||
| DDX3 | |||||||||
| Low | 58 | 1 | 58 | 1 | |||||
| High | 25 | 3.39 | 1.59-7.24 | 0.002 | 25 | 2.44 | 1.22-4.89 | 0.012 | |
| KRAS | |||||||||
| Low | 39 | 1 | 39 | 1 | |||||
| High | 44 | 2.92 | 1.31-6.47 | 0.009 | 44 | 2.17 | 1.06-4.45 | 0.034 | |
| YAP1 | |||||||||
| Low | 25 | 1 | 25 | 1 | |||||
| High | 24 | 4.39 | 1.46-13.22 | 0.008 | 24 | 3.31 | 1.29-8.53 | 0.013 | |
| SIX2 | |||||||||
| Low | 45 | 1 | 45 | 1 | |||||
| High | 31 | 3.65 | 1.68-7.93 | 0.001 | 31 | 3.19 | 1.57-6.50 | 0.001 | |
| KRAS mutation | |||||||||
| DDX3 | |||||||||
| Low | 33 | 1 | 33 | 1 | |||||
| High | 29 | 2.49 | 1.08-5.76 | 0.033 | 29 | 2.29 | 1.10-4.77 | 0.027 | |
| KRAS | |||||||||
| Low | 34 | 1 | 34 | 1 | |||||
| High | 28 | 2.96 | 1.20-7.31 | 0.019 | 28 | 2.53 | 1.16-5.53 | 0.020 | |
| YAP1 | |||||||||
| Low | 19 | 1 | 19 | 1 | |||||
| High | 17 | 3.33 | 1.25-8.84 | 0.016 | 17 | 3.10 | 1.29-7.42 | 0.011 | |
| SIX2 | |||||||||
| Low | 40 | 1 | 40 | 1 | |||||
| High | 22 | 0.928 | 0.38-2.28 | 0.871 | 22 | 1.24 | 0.57-2.71 | 0.586 | |
OS: overall survival; HR: Hazard ratio; RFS: relapse-free survival. *HR adjusted for age, gender, smoking status, and duke stage.
Table 4
Cox regression analysis of the combinations of YAP1 and SIX2 expressions in tumors from colorectal cancer patients with different KRAS mutation status
| Variables | OS | RFS | |||||||
|---|---|---|---|---|---|---|---|---|---|
| Case | Adjusted | 95%CI | P | Case | Adjusted | 95%CI | P | ||
| No. | HR* | No. | HR* | ||||||
| Total population | |||||||||
| YAP1/SIX2 | |||||||||
| Others | 59 | 1 | 59 | 1 | |||||
| High/high | 26 | 2.80 | 1.48-5.30 | 0.002 | 26 | 2.99 | 1.61-5.56 | 0.001 | |
| KRAS-WT | |||||||||
| YAP1/SIX2 | |||||||||
| Others | 32 | 1 | 32 | 1 | |||||
| High/high | 17 | 4.35 | 1.70-11.16 | 0.002 | 17 | 5.01 | 2.00-12.58 | 0.001 | |
| KRAS mutation | |||||||||
| YAP1/SIX2 | |||||||||
| Others | 27 | 1 | 27 | 1 | |||||
| High/high | 9 | 1.62 | 0.58-4.49 | 0.354 | 9 | 2.05 | 0.79-5.29 | 0.139 | |
OS: overall survival; HR: Hazard ratio; RFS: relapse-free survival. *HR adjusted for age, gender, smoking status, and duke stage.
Discussion
YAP1 acts as central driver of compensation for the loss of KRAS signaling in KRAS-dependent cancers (14,27). Consistent with this notion, we have provided novel evidence that YAP1-induced SIX2 expression is responsible for tumor aggressiveness and CTX resistance in KRAS-WT colorectal cancer, but not in KRAS-mutated colorectal cancer. SIX2 is known to promote breast cancer metastasis via reduction of E-cadherin expression by transcriptional and epigenetic defects (24). In addition, DDX3 promotes SIX2 expression at the transcriptional level via enhanced c-fos binding to the SIX2 promoter following PI3K/AKT activation by YAP1; this, in turn, confers tumor aggressiveness and CTX resistance via a decrease in E-cadherin expression (Figure 5G). Our preclinical animal model demonstrated that the YAP1 inhibitor, verteporfin, in combination with CTX, can efficiently overcome DDX3-mediated CTX resistance and completely suppresses tumor growth induced by a DDX3-overexpressing KRAS-WT SW48 stable clone (Figure 6). We therefore suggest that activation of the YAP1/SIX2 axis by DDX3 may play a critical role in tumor aggressiveness and CTX resistance in KRAS-WT colorectal cancer.
Activation of MEK/ERK and PI3K/AKT signaling is important in tumor aggressiveness and CTX resistance in colorectal cancer (28-33). Our previous research and the present study showed activation of ERK signaling in DDX3-overexpressing KRAS-mutated colon cancer cells (11), but this signaling was unchanged by DDX3 manipulation in KRAS-WT colon cancer cells. Interestingly, PI3K/AKT signaling can be activated in both KRAS-mutated and KRAS-WT colon cancer cells, but by different molecular mechanisms. The ERK signaling activated by DDX3 was responsible for PI3K/AKT activation in KRAS-mutated colon cancer cells (32). By contrast, in the KRAS-WT cells, DDX3-induced YAP1 expression elevated miR-29c expression, and miR-29c then targeted PTEN to activate PI3K/AKT signaling (34) (Figure S1).
DDX3 promotes tumor malignancy in KRAS-mutated colorectal cancer via β-catenin activation, which arises due to GSK3β inactivation by PI3K/AKT signaling (11). However, an increase in YAP1 expression by DDX3, through c-fos phosphorylation by PI3K/AKT signaling, was responsible for tumor aggressiveness in KRAS-WT colorectal cancer (Figure 4E). Transfection of shβ-catenin and shYAP1 in KRAS-mutated and KRAS-WT colon cancer cells lend to further support for increased DDX3-mediated cell invasion and colony formation in response to β-catenin and YAP1 signaling, respectively, in KRAS-mutated and KRAS-WT colon cancer cells (Figure S2).
SIX2 and YAP1/SIX2 had a prognostic value in KRAS-WT, but not in KRAS-mutated, colorectal cancer patients (Tables 3 and Table 4), indicating a greater importance of the YAP1/SIX2 axis in DDX3-mediated CTX resistance in KRAS-WT than in KRAS-mutated colorectal cancer. A previous study suggested that YAP1 may be a biomarker for predicting CTX resistance in colorectal cancer, regardless of KRAS mutational status. Our comparison of six different KRAS-mutated and four different KRAS-WT colon cancer cell types showed that DDX3 expression levels were positively correlated with CTX resistance in all ten cell lines (Figure S3). In addition, DDX3 may also confer CTX resistance in KRAS-mutated HCT116 and DLD1 cells (Figure S4). DDX3 manipulation studies in KRAS-mutated HCT116 and DLD1 compared with KRAS-WT HT29 and SW48 cells (Figure S5) confirmed a marked decrease in KRAS, p-ERK, p-AKT, HIF1α, and YAP1 expression by DDX3 manipulation in KRAS-mutated HCT116 cells and an increase in DLD1 cells. By contrast, p-ERK expression was unchanged by DDX3 manipulation in KRAS-WT HT29 and SW48 cells (Figure S5). The expression of HIF-1α and YAP1 paralleled the increases and decreases in ROS generation due to DDX3 manipulation. The cell viability in response to CTX was slightly decreased by YAP1 silencing, but was markedly decreased by ERK knockdown in KRAS-mutated HCT116 cells. Conversely, the cell viability following CTX treatment was slightly decreased by ERK silencing, but was markedly decreased by YAP1 knockdown in KRAS-WT HT29 cells (Figure S6).
We also conducted a preclinical animal study using a stable DDX3-overexpressing KRAS-mutated DLD1 clone to ensure that the combination of the MEK/ERK inhibitor, AZD6244, and CTX would overcome DDX3-mediated CTX resistance and suppress tumor growth (Figure S7). Inhibition of MEK/ERK signaling has been shown to overcome CTX resistance in KRAS-mutated colorectal cancer(33,35-37), and our observations in cell and animal models were consistent with previous studies (Figure S7) and indicated that the MEK/ERK signaling may be responsible for CTX resistance in KRAS-mutated colon cancer cells.
One limitation of this study was that a clinical response to CTX was not available in this study population because these patients' specimens were collected 10-20 years ago. However, the expression of DDX3, KRAS, YAP1, and SIX2 was associated with responses to 5-flurouracil (5-FU)-based chemotherapy in this study population (Table S1) More importantly, the association of YAP, SIX2 and YAP1/SIX2 expression with an unfavorable response to 5-FU-based chemotherapy was only found in KRAS-WT patients, but not in KRAS-mutated patients (Table S1 and S2).
In summary, the evidence from cells, animals, and patients seems to strongly support the hypothesis that DDX3 could serve as a reliable biomarker for predicting survival, tumor recurrence, and drug resistance in colorectal cancers, regardless of KRAS mutational status. In addition, the combination of a YAP1 inhibitor with CTX could be effective in suppressing DDX3-mediated tumor aggressiveness and CTX resistance in KRAS-WT colorectal cancer.
Abbreviations
PI: propidium iodide; FITC: fluorescein isothiocyanate; MTT: 3-(4,5-Dimethylthiazol-2-yl)-2,5-diphenyltetrazolium bromide; ChIP: chromatin immunoprecipitatio; SDS-PAGE: sodium dodecyl sulfate-polyacrylamide gel electrophoresis; OS: overall survival; RFS: relapse free survival; CTX: cetuximab; KRAS-WT: KRAS-wild-type; ROS: reactive oxygen species; ATCC: American Type Culture Collection); COLO: COLO320 HSR; shRNA: small hairpin RNA; NAC: N-acetylcysteine; NC: non-specific shRNA; VC: vector control; HR: Hazard ratio.
Supplementary Material
Supplementary figures and tables.
Acknowledgements
This work was jointly supported by grants from the Ministry of Science and Technology in Taiwan, ROC (105-2320-B-038 -057; 105-2325-B-038 -003 -CC2).
Author Contributions
DWW and HL contributed to the study concept and design. CCH collected the clinical samples. DWW, PLL, LW contributed to the acquisition of data. DWW analyzed and interpreted the data. LW made statistical analyses. HL drafted the manuscript. HL provided administrative, technical or material support. All authors discussed the results and commented on the manuscript.
Competing Interests
The authors have declared that no competing interest exists.
References
1. Center MM, Jemal A, Smith RA. et al. Worldwide variations in colorectal cancer. CA Cancer J Clin. 2009;59:366-78
2. Su SY, Huang JY, Jian ZH. et al. Mortality of colorectal cancer in Taiwan, 1971-2010: temporal changes and age-period-cohort analysis. Int J Colorectal Dis. 2012;27:1665-72
3. Cremolini C, Schirripa M, Antoniotti C. et al. First-line chemotherapy for mCRC-a review and evidence-based algorithm. Nat Rev Clin Oncol. 2015;12:607-19
4. Brandi G, De Lorenzo S, Nannini M. et al. Adjuvant chemotherapy for resected colorectal cancer metastases: Literature review and meta-analysis. World J Gastroenterol. 2016;22:519-33
5. Marques I, Araujo A, de Mello RA. Anti-angiogenic therapies for metastatic colorectal cancer: current and future perspectives. World J Gastroenterol. 2013;19:7955-71
6. Karapetis CS, Khambata-Ford S, Jonker DJ. et al. K-ras mutations and benefit from cetuximab in advanced colorectal cancer. N Engl J Med. 2008;359:1757-65
7. Van Cutsem E, Kohne CH, Hitre E. et al. Cetuximab and chemotherapy as initial treatment for metastatic colorectal cancer. N Engl J Med. 2009;360:1408-17
8. Pollock CB, Shirasawa S, Sasazuki T. et al. Oncogenic K-RAS is required to maintain changes in cytoskeletal organization, adhesion, and motility in colon cancer cells. Cancer Res. 2005;65:1244-50
9. Li J, Mizukami Y, Zhang X. et al. Oncogenic K-ras stimulates Wnt signaling in colon cancer through inhibition of GSK-3beta. Gastroenterology. 2005;128:1907-18
10. He TY, Wu DW, Lin PL. et al. DDX3 promotes tumor invasion in colorectal cancer via the CK1epsilon/Dvl2 axis. Sci Rep. 2016;6:21483
11. Wu DW, Lin PL, Cheng YW. et al. DDX3 enhances oncogenic KRASinduced tumor invasion in colorectal cancer via the betacatenin/ZEB1 axis. Oncotarget. 2016;7:22687-99
12. Lau AN, Curtis SJ, Fillmore CM. et al. Tumor-propagating cells and Yap/Taz activity contribute to lung tumor progression and metastasis. EMBO J. 2014;33:468-81
13. Rosenbluh J, Nijhawan D, Cox AG. et al. beta-Catenin-driven cancers require a YAP1 transcriptional complex for survival and tumorigenesis. Cell. 2012;151:1457-73
14. Shao DD, Xue W, Krall EB. et al. KRAS and YAP1 converge to regulate EMT and tumor survival. Cell. 2014;158:171-84
15. Lee KW, Lee SS, Kim SB. et al. Significant association of oncogene YAP1 with poor prognosis and cetuximab resistance in colorectal cancer patients. Clin Cancer Res. 2015;21:357-64
16. Wilson PM, Labonte MJ, Lenz HJ. Molecular markers in the treatment of metastatic colorectal cancer. Cancer J. 2010;16:262-72
17. Wu DW, Lee MC, Wang J. et al. DDX3 loss by p53 inactivation promotes tumor malignancy via the MDM2/Slug/E-cadherin pathway and poor patient outcome in non-small-cell lung cancer. Oncogene. 2014;33:1515-26
18. Duquet A, Melotti A, Mishra S. et al. A novel genome-wide in vivo screen for metastatic suppressors in human colon cancer identifies the positive WNT-TCF pathway modulators TMED3 and SOX12. EMBO Mol Med. 2014;6:882-901
19. Ma C, Rong Y, Radiloff DR. et al. Extracellular matrix protein betaig-h3/TGFBI promotes metastasis of colon cancer by enhancing cell extravasation. Genes Dev. 2008;22:308-21
20. Jackstadt R, Roh S, Neumann J. et al. AP4 is a mediator of epithelial-mesenchymal transition and metastasis in colorectal cancer. J Exp Med. 2013;210:1331-50
21. Chandel NS, McClintock DS, Feliciano CE. et al. Reactive oxygen species generated at mitochondrial complex III stabilize hypoxia-inducible factor-1alpha during hypoxia: a mechanism of O2 sensing. J Biol Chem. 2000;275:25130-8
22. Dixit D, Ghildiyal R, Anto NP. et al. Chaetocin-induced ROS-mediated apoptosis involves ATM-YAP1 axis and JNK-dependent inhibition of glucose metabolism. Cell Death Dis. 2014;5:e1212
23. Botlagunta M, Krishnamachary B, Vesuna F. et al. Expression of DDX3 is directly modulated by hypoxia inducible factor-1 alpha in breast epithelial cells. PLoS One. 2011;6:e17563
24. Wang CA, Drasin D, Pham C. et al. Homeoprotein Six2 promotes breast cancer metastasis via transcriptional and epigenetic control of E-cadherin expression. Cancer Res. 2014;74:7357-70
25. Marom A, Barak AF, Kramer MP. et al. CD84 mediates CLL-microenvironment interactions. Oncogene. 2016
26. Li X, Lu Y, Pan T. et al. Roles of autophagy in cetuximab-mediated cancer therapy against EGFR. Autophagy. 2010;6:1066-77
27. Greten FR. YAP1 takes over when oncogenic K-Ras slumbers. Cell. 2014;158:11-2
28. De Roock W, Claes B, Bernasconi D. et al. Effects of KRAS, BRAF, NRAS, and PIK3CA mutations on the efficacy of cetuximab plus chemotherapy in chemotherapy-refractory metastatic colorectal cancer: a retrospective consortium analysis. Lancet Oncol. 2010;11:753-62
29. Karapetis CS, Jonker D, Daneshmand M. et al. PIK3CA, BRAF, and PTEN status and benefit from cetuximab in the treatment of advanced colorectal cancer-results from NCIC CTG/AGITG CO.17. Clin Cancer Res. 2014;20:744-53
30. Perrone F, Lampis A, Orsenigo M. et al. PI3KCA/PTEN deregulation contributes to impaired responses to cetuximab in metastatic colorectal cancer patients. Ann Oncol. 2009;20:84-90
31. Misale S, Di Nicolantonio F, Sartore-Bianchi A. et al. Resistance to anti-EGFR therapy in colorectal cancer: from heterogeneity to convergent evolution. Cancer Discov. 2014;4:1269-80
32. Dunn EF, Iida M, Myers RA. et al. Dasatinib sensitizes KRAS mutant colorectal tumors to cetuximab. Oncogene. 2011;30:561-74
33. Yoon J, Koo KH, Choi KY. MEK1/2 inhibitors AS703026 and AZD6244 may be potential therapies for KRAS mutated colorectal cancer that is resistant to EGFR monoclonal antibody therapy. Cancer Res. 2011;71:445-53
34. Tumaneng K, Schlegelmilch K, Russell RC. et al. YAP mediates crosstalk between the Hippo and PI(3)K-TOR pathways by suppressing PTEN via miR-29. Nat Cell Biol. 2012;14:1322-9
35. Troiani T, Napolitano S, Vitagliano D. et al. Primary and acquired resistance of colorectal cancer cells to anti-EGFR antibodies converge on MEK/ERK pathway activation and can be overcome by combined MEK/EGFR inhibition. Clin Cancer Res. 2014;20:3775-86
36. Do K, Cao L, Kang Z. et al. A Phase II Study of Sorafenib Combined With Cetuximab in EGFR-Expressing, KRAS-Mutated Metastatic Colorectal Cancer. Clin Colorectal Cancer. 2015;14:154-61
37. Brand TM, Iida M, Wheeler DL. Molecular mechanisms of resistance to the EGFR monoclonal antibody cetuximab. Cancer Biol Ther. 2011;11:777-92
Author contact
![]() Corresponding author: Huei Lee, Ph. D., Professor, Graduate Institute of Cancer Biology and Drug Discovery, Taipei Medical University, Room 5, 12th floor, F building, No. 3, Park Street, Nangang District 115, Taipei, Taiwan. Tel: 886-27361661 ext. 7616; Fax: 886-26558562; E-mail: hledu.tw
Corresponding author: Huei Lee, Ph. D., Professor, Graduate Institute of Cancer Biology and Drug Discovery, Taipei Medical University, Room 5, 12th floor, F building, No. 3, Park Street, Nangang District 115, Taipei, Taiwan. Tel: 886-27361661 ext. 7616; Fax: 886-26558562; E-mail: hledu.tw
Citation styles
APA
Wu, D.W., Lin, P.L., Wang, L., Huang, C.C., Lee, H. (2017). The YAP1/SIX2 axis is required for DDX3-mediated tumor aggressiveness and cetuximab resistance in KRAS-wild-type colorectal cancer. Theranostics, 7(5), 1114-1132. https://doi.org/10.7150/thno.18175.
ACS
Wu, D.W.; Lin, P.L.; Wang, L.; Huang, C.C.; Lee, H. The YAP1/SIX2 axis is required for DDX3-mediated tumor aggressiveness and cetuximab resistance in KRAS-wild-type colorectal cancer. Theranostics 2017, 7 (5), 1114-1132. DOI: 10.7150/thno.18175.
NLM
Wu DW, Lin PL, Wang L, Huang CC, Lee H. The YAP1/SIX2 axis is required for DDX3-mediated tumor aggressiveness and cetuximab resistance in KRAS-wild-type colorectal cancer. Theranostics 2017; 7(5):1114-1132. doi:10.7150/thno.18175. https://www.thno.org/v07p1114.htm
CSE
Wu DW, Lin PL, Wang L, Huang CC, Lee H. 2017. The YAP1/SIX2 axis is required for DDX3-mediated tumor aggressiveness and cetuximab resistance in KRAS-wild-type colorectal cancer. Theranostics. 7(5):1114-1132.
This is an open access article distributed under the terms of the Creative Commons Attribution (CC BY-NC) license (https://creativecommons.org/licenses/by-nc/4.0/). See http://ivyspring.com/terms for full terms and conditions.