Impact Factor
- Issue 14; 2026
- Issue 13; 2026
- Issue 12; 2026
- Issue 11; 2026
- Issue 10; 2026
- Volume 16; 2026
- Advance Articles
- Past Issues
- Cover Images
- Cover Suggestion
- Index & Coverage
- Special Issues
1. Introduction
2. Exosome isolation and...
3. SERS Substrate
4. Data analysis
5. Conclusion and outlook
Abbreviations
Acknowledgements
References
International Journal of Biological Sciences
International Journal of Medical Sciences
 Global reach, higher impact

Theranostics 2024; 14(5):1966-1981. doi:10.7150/thno.92621 This issue Cite
Review
Cancer diagnosis using label-free SERS-based exosome analysis
Yajuan Liu1, Mei Li2, Haisha Liu2, Chao Kang2 ![]() , Cheng Wang3
, Cheng Wang3 ![]()
1. Key Laboratory of Molecular Target & Clinical Pharmacology, and the NMPA & State Key Laboratory of Respiratory Disease, School of Pharmaceutical Sciences & the Fifth Affiliated Hospital, Guangzhou Medical University, 511436, Guangzhou, China.
2. School of Chemistry and Chemical Engineering, Guizhou University, 550025, Guiyang, China.
3. Smurfit Institute of Genetics, Trinity College Dublin, Dublin 2, Ireland.
Received 2023-11-26; Accepted 2024-2-18; Published 2024-2-24
Abstract

Exosomes, carrying distinctive biomolecules reflective of their parent cell's status and origin, show promise as liquid biopsy biomarkers for cancer diagnosis. However, their clinical translation remains challenging due to their relatively low concentration in body fluids. Surface-Enhanced Raman spectroscopy (SERS) has recently gained significant attention as a label-free and sensitive technique for exosome analysis. This review explores label-free SERS for exosome detection, covering exosome isolation and characterization methods, advancements in SERS substrates, and fingerprint analysis techniques using machine learning. Furthermore, we emphasize the challenges and offer insights into the future prospects of SERS-based exosome analysis to enhance cancer diagnosis.
Keywords: Cancer diagnosis, Exosome, Raman Spectroscopy, SERS, label-free SERS
1. Introduction
Extracellular vesicles (EVs), surrounded by a lipid bilayer, are released by both prokaryotes and eukaryotes and can be broadly classified into two main types: microvesicles and exosomes, distinguished by their distinct cellular origins [1]. Exosomes originate from endosomes and typically range in diameter from 40 to 160 nm [2]. The secretion of exosomes initiates with the formation of multivesicular bodies through plasma membrane invagination [3, 4]. Exosome secretion plays a pivotal role in both physiological and pathological processes, influencing the composition of exosomes, including their surface molecules and contents [5]. Depending on the specific cell of origin, exosomes carry a wide range of cellular components, such as nucleus acid, lipids, and proteins [5-7].
Exosomes possess a diverse cargo, conveniently accessible in various locations, and packaging essential molecular components, making them exceptionally valuable biomarkers [8]. As a superior choice for noninvasive liquid-biopsy in disease diagnosis, prognosis, and monitoring therapy response, exosomes offer promising potential [5, 9-11]. Consequently, there is an urgent need for highly sensitive technologies to enhance exosome analysis due to the low concentration of exosomes in biofluid is and to the low recovery efficiency of current isolation techniques, which constitutes a crucial step in exosome analysis [12]. In response to this demand, a diverse array of biosensing platforms has emerged, offering promising opportunities to achieve lower limits of detection and significantly enhance the accuracy in exosome characterization [13].
Among the various techniques, surface-enhanced Raman spectroscopy (SERS) stands out as a promising method that significantly amplifies the Raman signal of molecules. This is achieved by attaching the analytes to a plasmonic SERS substrate, resulting in an enhancement factor (EF) of up to 1011 [14]. The enhancement arises from the interaction of light with nanostructured materials such as gold (Au) and silver (Ag) nanoparticles, which produce a strong surface plasmon resonance effect [14]. The unique advantages of SERS, including non-invasiveness, high sensitivity, rapid analysis, resistance to photobleaching and photodegradation, multiplex detection capabilities, and low interference from water, have made it a popular technology in exosome analysis [15].
SERS detection can be broadly classified into two distinct approaches: label-free exosome detection [16] and exosome detection employing SERS-tags [17-20]. In SERS-tag analysis, Raman tags, reporters, or dyes are typically affixed to the surface of nanoparticles, which are subsequently bound to exosomes through specific antibodies targeting exosomal biomarkers [21, 22]. The sharp and distinct signal emitted by the Raman tag enables precise quantification of exosome concentration, offering exceptional selectivity in detecting exosomes bearing particular biomarkers [13]. Labeled-SERS generally exhibits high sensitivity owing to the substantial signal enhancement conferred by labels. This approach provides remarkable specificity, as labeled molecules can precisely target specific exosomal markers. Labeled-SERS finds particular utility in research applications demanding both heightened sensitivity and the precise targeting of specific exosomal components. However, the progress of SERS-tag-based exosome analysis is constrained by the availability of exosome biomarkers and suitable Raman tags [13]. Furthermore, labeled-SERS necessitates additional steps for exosome labeling, potentially affecting their biological characteristics. It may also have limitations when applied to high-throughput analysis due to the additional labeling procedures and the associated processing time. Additionally, labeled-SERS can incur extra costs related to the procurement and utilization of labeling agents. The introduction of labels carries the potential risk of altering the biological properties of exosomes, which could be a concern in specific research scenarios.
Conversely, label-free SERS relies on the inherent properties of exosomes, particularly their natural Raman scattering signals [23-26]. Label-free SERS provides a unique spectral fingerprint of exosomes without the need for identifying specific exosome biomarkers or employing Raman tags [16]. Label-free-SERS simplifies the sample preparation process since it omits the labeling steps typically required [23]. This characteristic makes label-free SERS potentially more suitable for high-throughput applications. Moreover, label-free SERS tends to be more cost-effective, as it eliminates the need for external labels. It proves particularly valuable in broader screening contexts or when minimal sample manipulation is desired. Importantly, label-free SERS is less likely to adversely affect the biological integrity of exosomes, rendering it the preferred choice for bioanalytical investigations.
The biochemical characteristics of substances on the surface of exosomes are closely associated with cancer diagnosis [27-29]. For instance, the phosphorylation status of proteins may play a crucial role in the early development of cancer cells [28]. Numerous research groups have employed different analytical techniques to demonstrate that the degree of protein phosphorylation on the surface of extracellular vesicles isolated from the blood of various cancer patients, including breast cancer, lung cancer, and pancreatic cancer, is significantly higher than that in healthy individuals [27, 28]. Furthermore, changes in surface polysaccharides [29] and lipid molecules (such as phospholipids, cholesterol, sphingolipids, and ceramides) [30] can also be used to detect pancreatic, lung, liver, and colon-related cancers. These studies indicate that cancer occurrence is closely linked to the biochemical changes of many substances on the surface of exosomes, rather than relying solely on a single protein marker. Label-free SERS enables the characterization of exosomes by capturing their unique fingerprint, which corresponds to the specific biochemical compounds present on their surface. Based on this advantage, label-free SERS has demonstrated promising applications in diagnosing various types of cancers, including lung cancer [31-33] breast cancer [34-37], melanoma [38], oral and oropharyngeal squamous cell carcinoma [39], head and neck cancer [40], urogenital cancer [41], hepatocellular carcinoma [42], nasopharyngeal cancer [43] and gastric cancer [44]. Moreover, this technique allows for simultaneous diagnosis of multiple cancers [28, 45] and can accurately identify cancer in patients at different stages [46].
This review primarily explores exosome detection using label-free SERS. We began by discussing exosome isolation and characterization methods from label-free SERS-based exosome research, as the concentration and size of exosomes are crucial factors in SERS analysis. Next, we focused on the advancements in SERS substrates, as their selection and improvement play a pivotal role in SERS analysis. While label-free SERS technology offers the potential for simultaneous analysis of various diseases, there is a risk of signal overlap among different biomolecules, leading to the loss of some diagnostic signals. Consequently, we also summarized data analysis methods, particularly fingerprint analysis techniques, which include linear/non-linear machine learning methods commonly utilized in label-free SERS analysis. We concentrate on research from the past 5 years, highlighting challenges and providing insights into the future potential of SERS-based exosome analysis for improving cancer diagnosis.
2. Exosome isolation and characterization
For effective SERS analysis of exosomes, it's essential to isolate exosomes specifically from an extensive range of body fluids, including blood/plasma/serum [28, 33, 36, 40-42, 44-52], urine [53] and saliva [39]. Depending on the research purpose and experimental conditions, exosomes may also be isolated from other sources such as fetal bovine serum [54] and bronchoalveolar lavage fluid [31]. It should be noted that cells [23, 32-35, 37, 38, 43, 46, 49, 55-60] are also commonly used for discriminative analysis of cancerous and non-cancerous exosomes based on SERS (Figure 1). Significant advancements have been achieved in the field of exosome isolation techniques, yielding promising insights into the understanding of exosomes [61, 62]. However, it has become evident that the rapid and efficient isolation of exosomes remains a challenge, primarily due to the intricate nature of biological samples, the potential interference from other extracellular vesicles sharing similar physicochemical and biochemical properties, and the inherent heterogeneity of exosomes themselves. A variety of methods (Table 1) have been employed to successfully extract exosomes from a wide range of sample matrices, showcasing their effectiveness.
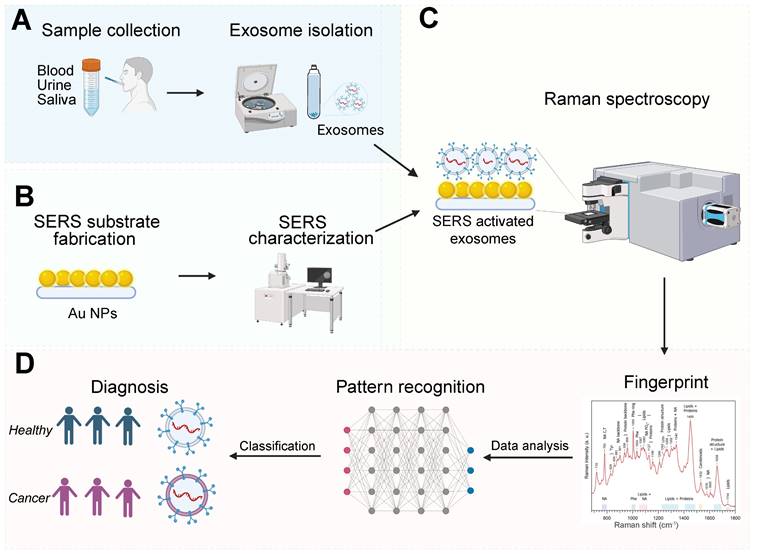
Illustration of exosome analysis for cancer diagnosis using label-free SERS. (A) Sample collection, exosome isolation. (B) Fabrication and characterization of SERS substrate. (C) Spectroscopic data collection of exosomes via SERS. (D) Exosome classification and cancer diagnosis through SERS patterns. The Figure 1D fingerprint image was adapted with permission from reference [79], copyright 2012 Wiley.
Comparison between the common exosome isolation methods
| Technique | Purity | Equipment | Time | Yield | Specimen volume | Exosome Integrity | Ref |
|---|---|---|---|---|---|---|---|
| UC | Low (5-25%) | Heavy, not portable | >4 h | Low | High (~1 mL) | Exosome damage | [39] |
| SEC | High | Special column | 0.3 h | Median | Median (500 μL) | Loss of small vesicle | [55] |
| Ultrafiltration | High | Cheap | <4 h | Median | Median (400 μL) | Loss of small vesicle | [64] |
| Immunoprecipitation | High (99%) | Expensive | 4-20 h | Low | Median (up to 1 mL) | Exosome damage | [65] |
| Microfluidic SERS | High | Easy integration | 1 h | Median | Low (20 μL) | Exosome damage | [50, 66] |
UC: Ultracentrifugation; SEC: Size Exclusion Chromatography; Microfluidic SERS: Microfluidic Surface-Enhanced Raman Spectroscopy.
Ultracentrifugation is widely regarded as the gold standard for isolating exosomes due to its ability to generate exceptionally high centrifugal forces [61]. The centrifugal force employed typically falls within the range of approximately 100,000 to 120,000 times. It is a user-friendly approach, as it does not demand extensive technical knowledge. It offers long-term affordability, as only one ultracentrifuge machine is needed for extended use. Additionally, it is a moderately time-consuming method that typically does not require complex sample pretreatments. Consequently, ultracentrifugation (UC)-based techniques have gained significant popularity in SERS analysis exploring exosomes [28, 32-34, 38-40, 42, 48, 51, 56, 57, 59, 60, 63]. Size exclusion chromatography (SEC) [31-33, 36, 40, 45-47, 55] and ultrafiltration [37, 38, 41, 58] are popular size-based exosome isolation techniques. Some commercial assay kits which are based immunity capture are also commonly used in exosome isolation techniques [33, 35, 49, 54]. It is worth mentioning that a magnetic SERS platform has been developed to facilitate the combined process of exosome isolation and Raman signal enhancement. It is noteworthy that a magnetic SERS platform has been developed to streamline the concurrent processes of exosome isolation and Raman signal enhancement [23, 50]. This innovative system integrates a microfluidic Raman biochip for the isolation and detection of serum exosomes on a single chip, with Raman beads being employed to differentiate between individuals with good health and those diagnosed with cancer, all within the span of 1 h. This device is capable of efficiently handling and detecting low-volume samples within a short timeframe, with a median isolation efficiency.
To assess the quality of isolated exosomes, numerous techniques have been developed for characterizing their protein content, size distribution, morphology, concentration, and biochemical composition. Nanoparticle tracking analysis (NTA) are commonly used to count and size exosome, which are viewed by the incident illumination coming from laser light [32, 36-40, 45-48, 50-52, 55, 57-59, 63]. Transmission electron microscopy (TEM) is used as a compensation to confirm the detection of NTA as it is relatively time-consuming and not fitted for a large amount of exosomes although it can be used to check the quality of preparations in a visualized way [28, 31, 33, 36-38, 40-43, 45-47, 50, 51, 53, 54, 56-60]. Western blotting is an important procedure for exosome characterization to confirm some specific proteins in exosomes [28, 32, 33, 36, 41, 43, 45, 46, 48, 50, 53, 54, 56-60]. As well as those commonly used techniques, there are some more techniques used for exosome characterization depending on the research purpose before SERS analysis, such as dynamic light scattering [32, 34-36, 38, 47, 60], zeta potential analyzer [32, 38], fluorescence [23], flow cytometry [43, 52, 58], atomic force microscope [48], single particle interferometric reflectance imaging sensing [40], tunable resistive pulse sensing [54] and protein assay kit [60].
3. SERS Substrate
3.1 Evaluate the SERS effect
Regarding the SERS effect, it is of utmost importance to characterize the NPs, which involves assessing their size, shape, and distribution. Various microscopy techniques, including scanning electron microscopy [23, 28, 31, 32, 34-36, 40, 45, 46, 49, 53-57, 63], transmission electron microscope [23, 33, 38, 41, 49, 50], atomic force microscopy [34, 55, 63]. have been employed for this purpose. These microscopies not only aid in estimating the uniformity and average number of NPs, but also provide valuable insights into their overall structure. [45]. Furthermore, multiple spectroscopic methods have been widely used to characterize and confirm the formation of NPs. Notable among these are UV-visible spectrophotometry [28, 34, 38, 43, 53, 60], X-ray spectroscopy [23, 35, 53, 56], dynamic light scattering [38], electrochemical impedance spectroscopy [35], Fourier transform infrared spectroscopy [56]. For instance, UV-Vis spectrophotometry allows monitoring the characteristic surface plasmon resonance (SPR) band of NPs, confirming their formation [34]. In some cases, researchers have employed multiple techniques to ensure thorough verification [35]. Combining different characterization methods enhances the reliability and accuracy of the results, providing a comprehensive understanding of the NPs under investigation.
In the realm of SERS substrate design, researchers have harnessed the power of the FDTD method, a robust numerical tool for computational electrodynamics modeling [23, 28, 38, 49, 53-55, 57]. By employing FDTD, they have gain profound insights into the intricate interplay between electromagnetic (EM) fields and the localized surface plasmon resonances (LSPRs) of the substrate [67]. This advanced simulation technique has enabled both qualitative and quantitative analyses of SERS phenomena, fostering a more comprehensive understanding of the underlying physics [68]. Moreover, FDTD has emerged as a highly valuable tool for optimizing the design and fabrication of SERS substrates, facilitating precise molecular analysis for diverse applications.
To assess the SERS effect, EF is one of the most important metric to gauge the "magnitude" of the enhancement in SERS [45, 55]. Indeed, the substantial variation in the reported EFs can be attributed to a combination of factors, notably the wide variability in the EF's definition and the diverse methods utilized for its estimation in practice [28, 34, 35, 43, 49, 57, 67]. Such discrepancies in the definitions and equations of EFs emerge from varying perspectives, including the single molecule viewpoint, SERS substrate viewpoint, and analytical chemistry viewpoint [69]. Besides, EF calculation from different research are based on different materials such as methylene blue (MB) [28], rhodamine 6G (R6G) [34, 45], 4-mercaptobenzoic acid (4-MBA) [49], crystal violet [35], exosome [38, 42, 50, 55]. It should be noted that a vague EF emerges, wherein essential normalization concerning non-SERS conditions is occasionally disregarded, a factor of significant importance.
3.2 Basic SERS substrate
SERS substrate based on various materials which significantly enhances the Raman signal is one of the keys to guarantee the sensitivity of the label-free exosome analysis (Figure 1). Several criteria are important when selecting a SERS substrate for exosome analysis. Firstly, it should exhibit high sensitivity, given the typically low concentration of exosomes. Secondly, it should minimize any adverse effects on the biological activity of exosomes. Gold (Au) is the preferred material for exosome analysis due to its strong enhancement effect and minimal impact on the biological activity of exosomes [37, 40, 58, 60, 70]. Silver (Ag) is occasionally used as an alternative because it can provide even stronger absorption effects [39, 44, 59]. However, the use of Ag may potentially diminish the biological activity of exosomes. Based on those materials, the simple way to construct SERS substrate is to drop exosome and NPs evenly on the silicon [37]/CaF2 [39] substrate. The NPs can be either self-made [37] or commercially available [40]. The ratio between NPs and exosomes are based on their concentrations. The NPs cannot always be guaranteed to successfully assembled which results in low and subsequent uniformity of SERS substrate and low experimental repeatability. The SERS signal has been improved in various ways.
3.3 Size and shape of NPs
Multiple studies have demonstrated a correlation between the SERS signal and the size and shape of NPs [71-73]. Consequently, one viable approach to enhancing the SERS signal is by exerting control over the size and shape of NPs. In the context of exosome analysis, spherical NPs are commonly employed (either self-prepared or purchased from different suppliers). The size of these NPs varies across different studies, typically ranging from 20-200nm (refer to Table 2). It is worth noting that the SERS signal could potentially be influenced by both the size of exosomes and the NPs themselves, although our understanding of this relationship remains incomplete.
Label-free SERS-based exosome analysis for cancer diagnosis
| Cancer type | Exosome resource | Purification | NP size (nm) | EF | EF material | Data analysis | Successful rate | SERS substrate | SERS characteristics | Ref |
|---|---|---|---|---|---|---|---|---|---|---|
| Breast | Cell | UC | N/A | N/A | N/A | CNN | >95% | AuNPs on silicon wafer | Simple substrate: easy to make, relatively low level of sensitive, uniformity and reproductivity | [37] |
| Oral and Oropharyngeal | Salivary | UC | N/A | N/A | N/A | PCA-LDA | 74.2% | AuNPs on CaF2 glass | [39] | |
| Multiple | Cell | Commercial kits | N/A | N/A | N/A | Random forest analysis | >96.8% | AuNPs | [58] | |
| Urogenital | Serum | UC | N/A | N/A | N/A | CNN | >74% | AgNPs on silicon wafer | [41] | |
| Breast | Cell, serum | SEC/ UC | 71.0±9.6 | N/A | N/A | N/A | 100%/ 79.4% | Au nanostar on a quartz/silicon slide | NPs with different shape: may improve the sensitivity. | [36] |
| lung | Bronchoalveolar fluid | SEC | 200 | N/A | N/A | SVM | N/A | Au nanopyramid | [31] | |
| Melanoma | Cell | UC | N/A | 4.1x10⁵ | EV | PLS-DA | N/A | Au@Ag solution | NPs with core-shell structure: may improve the sensitivity. The magnetic SERS platform integrates exosome isolation and Raman signal enhancement | [38] |
| Nasopharyngeal | Cell | UC | 48± 5 | 4.57 *107 | R6G | Neural network | 92.4% | Au@Ag-Si substrate | [43] | |
| Breast | Cell | Magnetic SERS | 50 | 225 | Exosome | PCA | N/A | Magnetic MNP@Au with antibody | [50] | |
| Breast | Serum from mice | Magnetic SERS | 20 | N/A | N/A | PCA | N/A | Magnetic Fe3O4/AuNPs | [23] | |
| Lung | Fetal bovine serum | UC /commercial kits | N/A | N/A | N/A | PCA | N/A | A hybrid SERS substrate (a graphene covered by Au pyramids) | Tailored substrate materials: relatively complex fabrication, may enhance both the uniformity and sensitivity of SERS substrates. | [54] |
| Multiple | Cell, blood | UC | 60 | 3*104 | MB | Univariate analysis | 93% | Macroporous 3D Au-coated TiO2 MIO structures | [28] | |
| Breast | Cell | UC | 22-63 | 104 to 105 | R6G | PCA | N/A | AgNPs grown in bacterial nanocellulose | [34] | |
| Breast | Cell | UC | 100 | 7.1 | Crystal violet | Random forest analysis | 89.5% | Pt-black SERS template | [35] | |
| Lung | Cell | UC | N/A | 8.68 *106 | R6G | PCA | N/A | 3DOM Ag7O8NO3 micropyramids | [57] | |
| Myeloma | Blood | Commercial kits | < 30 | N/A | N/A | PCA | N/A | Microstructured arrays (Si) containing AuNPs | [52] | |
| Multiple | Plasma | SEC | N/A | 4.28 * 105 | R6G | TOO | 75.9% | AuNPs on APTES glass | Substrates with linking molecules: may enhance the uniformity of the SERS signal. | [45] |
| Lung | Cell | SEC | N/A | N/A | N/A | PCA | >90% | AuNPs on APTES glass | [32] | |
| Lung | Plasma, cell | SEC/ UC | N/A | N/A | N/A | CNN | >90% (cellular) >60% (plasma) | AuNPs on APTES glass | [46] | |
| Head and neck | Blood, cell | UC/SEC | 40-60 | N/A | N/A | PCA-LDA/QCA | >97.8% | AuNPs with cysteamine on the quartz microfiber matrix | [40] | |
| Hepatocellular carcinoma | Blood | UC | N/A | 106 | Exosome | SVM | >97.56 % | AgNPs with biorecepter | [42] | |
| Lung | Blood, cell | SEC kit | N/A | N/A | N/A | CNN | 93% | AuNPs with antibody | [33] | |
| Glioma | Cell | UC/filter | N/A | 3.4 * 105 (Ag) | EV | Univariate analysis | N/A | Nanobowtiefluidic device (Ag, Au, and Al) | Microfluidic device: may achieve high-throughput separation and enrichment of exosomes. | [55] |
NP: Nanoparticle; EF: Enhancement Factor; CNN: Convolutional Neural Network; PCA: Principal Component Analysis; LDA: Linear Discriminant Analysis; SVM: Support Vector Machine; SEC: Size Exclusion Chromatography; UC: Ultracentrifugation; SERS: Surface-Enhanced Raman Spectroscopy; AuNPs: Gold Nanoparticles; AgNPs: Silver Nanoparticles; EV: Extracellular Vesicles; PLS-DA: Partial Least Squares Discriminant Analysis; R6G: Rhodamine 6G;
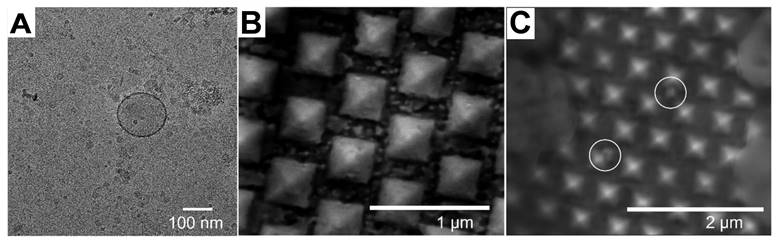
SERS analysis has been performed on exosomes using various shapes of nanoparticles. For instance, Au nano stars with a tip-to-tip size of approximately 71.0 nm were synthesized and utilized for exosome analysis in breast cancer diagnosis and postoperative assessment, taking advantage of their strong plasmonic properties for SERS enhancement [36]. Additionally, inverted Au nanopyramids with sidewalls at specific angles were created, establishing a correlation between the sizes of "hotspots" and the sizes of small EVs (∼80-150 nm), which can be seen the TEM image of EV in Figure 2A [31]. The SEM images in depict the SERS substrate before (Figure 2B) and after (Figure 2C) the introduction of EV, which illustrate that the vesicles are situated between individual nanopyramids. This design enabled the substrate to capture SERS signals from individual vesicles one at a time. Furthermore, a hybrid SERS substrate consisting of graphene covered by Au nanopyramids was developed for the identification of exosomes originating from different sources [54]. In this particular study, a patterning method utilizing a layer of self-assembled polystyrene balls was employed to fabricate a quasi-periodic structure of gold nanopyramids with base dimensions of approximately 200 * 200 nm². Finite-difference time-domain method (FDTD) simulations demonstrated that the nanopyramids' sides contained "hotspots" with significantly enhanced electromagnetic fields.
(A) TEM image of EVs (B) SEM image of the SERS Au nanopyramid substrate. (C) SEM image of the SERS Au nanopyramid substrate after introduction of EV. Adapted with permission from reference [31], copyright 2023 Royal Society of Chemistry.
3.4 Core-shell structure
Core-shell nanostructures comprising multiple components have proven to be exceptionally effective as SERS substrates for sensitive exosome analysis, as they can maintain a robust enhancement effect while exerting minimal influence on the biological activity of exosomes. Among these strategies, the Au@Ag core-shell nanostructure is commonly employed to enhance detection sensitivity [74]. For instance, the Au@Ag substrate exhibits remarkable sensitivity when utilized on a 2D hydrophobic substrate, with an EF of 4.57*107 [43]. In addition to generating higher SERS intensities through the plasmonic properties of the core-shell structure, the silver layer also serves the purpose of eliminating interference from the coating agent molecules in the SERS spectra [38]. In this specific study, AuNPs were functionalized with 4-dimethylaminopyridine (DMAP) molecules to facilitate the attachment of EVs. However, DMAP itself exhibits a significant SERS signal, which can potentially interfere with the SERS signal from the EVs. To mitigate this issue, an additional silver layer was added to form Au@Ag core-shell NPs. This not only eliminates the interference caused by the DMAP molecules in the SERS analysis but also enhances the SERS signal due to the plasmonic properties of the core-shell structure. To be noted, the drying process is not required prior to SERS analysis in this case. Instead, the solution containing SERS-enhanced exosomes can be directly measured using a water dipping objective. In addition to the Au@Ag core-shell structure mentioned earlier, magnetic core-shell structures are also commonly employed in exosome analysis. These structures integrate cancer exosome isolation and Raman signal enhancement into a single system. Typically, the magnetic core-shell structure is used in conjunction with a Raman reporter and antibodies [50]. At the same time, the magnetic core-shell structures are also used in label-free strategy. For instance, superparamagnetic Fe3O4 NPs serve as cores for separation, while the Au layers enable label-free SERS detection [23]. This approach effectively distinguishes exosomes from different cell sources for cancer diagnosis.
3.5 Tailored substrate materials
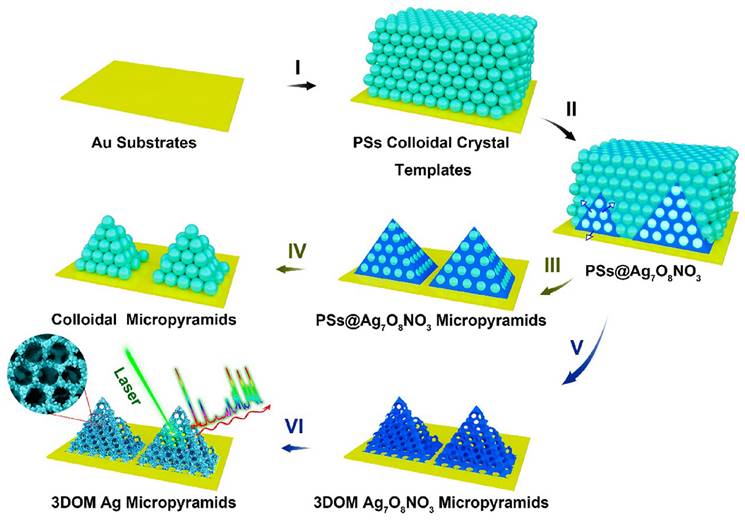
As mentioned before, silicon [37]/CaF2 [39] substrate is a common base used to contain the NPs in SERS analysis. In the same time, to improve uniformity and SERS signal, researchers have developed various bases, such as quartz microfiber matrix [40], hydrophobic substrate [43, 54], bacterial nanocellulose [34], 3D plasmonic ITO glass [49], platinum-black (Pt-black) template [35], and porous substrate [28]. Porous substrate is one of the strategies to improve the SERS signal. An engineered 3D Au-coated TiO2 macroporous inverse opal (MIO) structure was developed, exhibiting an impressive EF of 1.2*105 [28]. The 3D Au-coated TiO2 MIO structure shows advantages of detecting large exosomes, primarily through their interconnected nanoscale pore networks. Additionally, the TiO2 MIO structures demonstrate a remarkable “slow light effect” leading to a substantial enhancement of Raman signals from exosomes. Another example of the porous substrate includes 3D ordered macroporous (3DOM) Ag7O8NO3 micropyramids, which were formed by AgNPs through a chemical reduction process [57] (See Figure 3). The interconnected macropores within these micropyramids play a crucial role in facilitating the transportation and enrichment of analyte molecules. Additionally, the dense distribution of AgNPs on the micropyramid skeletons results in the generation of strong electromagnetic fields. Consequently, the 3DOM Ag micropyramids serve as highly efficient single-particle SERS sensing substrates, showcasing remarkable SERS sensitivity and signal reproducibility. Moreover, employing a photolithography process on Si substrates, a precise hexagonal array of circular holes was fabricated [52]. The primary objective of this process was to construct microstructured arrays that could effectively encapsulate AuNPs. Significantly, these microstructured Au arrays have demonstrated their utility in the stratification of multiple myeloma patients through exosome profiling.
Schematic depicting the electrochemical cementing technique for the synthesis of 3DOM Ag7O8NO3 micropyramids, followed by their shape-preserving conversion into 3DOM Ag micropyramids. Adapted with permission from reference [40], copyright 2021 Royal Society of Chemistry.
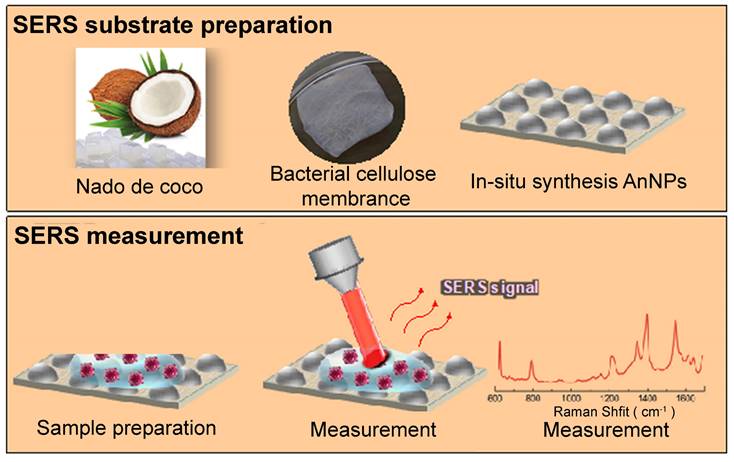
Comparable to a porous structure, a quartz microfiber matrix containing AuNPs was affixed onto a borosilicate glass substrate for the purpose of conducting SERS measurements [40]. Analyzing the SEM images revealed the even distribution of EVs within this matrix, with a specific concentration in close proximity to the plasmonic gold, thus enabling exposure to intense electromagnetic fields resulting from the interaction between the excitation laser and the localized surface. In addition, bacterial nanocellulose produced from commercial nata de coco, combined with in situ synthesized AgNPs, has been tested as a cost-effective and environmentally friendly SERS substrate. In Figure 4, a schematic diagram depicts the process of creating the SERS substrate through the utilization of bacterial cellulose (BC). This approach has yielded impressive EF ranging from 104 to 105 [34]. Besides, a custom Pt-black SERS template has been developed and compared to the commercially available substrate (SERS-Au) [35]. The Pt-black SERS template exhibits stable, consistent, and low background spectra, resulting in the high reproducibility essential for a reliable diagnostic template, even though it achieves a lower EF compared with SERS-Au. In addition to Pt-black, ITO glass has also been utilized to create 3D plasmonic AuNPs nanomembranes as substrates, which have proven to be successful in cancer diagnosis and dynamic monitoring of drug therapeutic processes [49].
Schematic illustration of the SERS substrate fabrication using BC. Upper section: Production of BC membrane using commercially available nata de coco cubes, accompanied by the in-situ synthesis of AgNPs within the BC matrix for generating SERS substrates. Lower section: Preparation of the SERS assay, measurement process, and resulting spectral analysis. Adapted with permission from reference [34], copyright 2019 American Chemical Society.
3.6 Linking molecules
One strategy to enhance the uniformity of the SERS signal is by employing a linking molecule to connect the NPs and exosomes. A highly effective and straightforward approach to achieve a uniform and reproducible SERS substrate is by using the 3-aminopropyl triethoxy silane (APTES)-functionalized SERS substrate [32, 33, 45, 46, 75]. This is because films formed by silane coupling agents allow for the deposition of coatings with adjustable thickness, roughness, and well-defined chemistry.
Antibodies are widely utilized to enhance the binding capability between NPs and exosomes. In many cases, a common strategy involves labeling with specific antibodies and a particular Raman reporter. Additionally, antibodies are also employed for label-free SERS analysis. For instance, a study utilized epidermal growth factor receptor (EGFR) antibody-coated glass to connect AuNPs and exosomes [33]. In this research, APTES was also utilized as a linking molecule. Another example of using antibodies as linking molecules in label-free exosome analysis involves SERS analysis based on AuNPs through polyethylene glycol and bio-receptors [42]. Besides, cysteamine also serves as a valuable biofunctionalization linker. It features a terminal thiol group at one end, facilitating binding to the gold substrate. At the opposite end, there is a free amine that effectively enhances the surface with a positive charge. This charge modification enables the non-specific capture of inherently anionic EVs [40]. In addition, DMAP can also serve as a linking molecule between NPs and exosomes. AuNPs have cationic surface charges attributed to the DMAP coating, allowing them to adsorb onto the anionic EV surface. This association is primarily charge-based, although there is a possibility that DMAP molecules interact with cysteine-rich proteins found on the EV surface [38].
3.7 Microfluidic device
Microfluidic technology can achieve high-throughput separation and enrichment of exosomes, while addressing some core issues in SERS detection [76]. For instance, microfluidic SERS technology can precisely control the aggregation time of SERS NPs and exosomes by adjusting flow rates and designing channel structures, thereby improving their mixing efficiency and addressing the issue of poor reproducibility in SERS analysis [22]. Moreover, it enables high-throughput sample preparation to achieve a more stable and reliable analytical detection [77]. Most of the current microfluidic SERS technology is primarily based on immune probe capture and detection of specific tumor markers in exosomes, unable to obtain a complete fingerprint spectrum [76]. In the context of label-free analysis, Jalali et al. introduced a pioneering method for exosome fingerprinting by innovatively combining a plasmonic nanostructure with a microfluidic sample delivery system [55]. They strategically positioned nanobowties at the bottom of the fluidic chamber, taking advantage of their strong electromagnetic field (EF) enhancement capabilities, which facilitated the uniform distribution of exosomes next to the plasmonic surface (Figure 5A-B). The final panel in Figure 5C illustrates FDTD simulation depicting the distribution of the maximum EF on the surface of a nanobowtie arranged within a honeycomb array. The study successfully demonstrated the synergistic combination of nanosurface microfluidics and the powerful plasmonic effects of suspended nanobowties, leading to the creation of a highly sensitive label-free SERS detection device for exosomes.
Utilizing a spatially suspended nanobowtie surface within a microfluidic device for enhanced SERS-based detection of EVs. (A) Design and prototype of the microfluidic setup. (B) EV detection using SERS methodology. (C) Nanobowtie design and corresponding artificially colored SEM image of the produced nanobowtie structure (Cyan). The final section showcases FDTD simulations displaying the distribution of maximum electromagnetic field intensity on the surface of a nanobowtie within a honeycomb array. Adapted with permission from reference [55], copyright 2021 Royal Society of Chemistry.
4. Data analysis
4.1 Raman peak assignment
The exosome's surface comprises a complex biochemical composition of lipids, nucleic acids, and proteins. The intricacy of this composition is reflected in the complex Raman peaks observed during analysis. Assigning these peaks accurately is crucial for understanding the chemical composition of the sample. These peak assignments are generally based on various references, including Raman analysis of exosomes [60, 78, 79], SERS-based exosome analysis [32, 38, 80], SERS analysis of body fluid [81-88], and some Raman analysis of body fluid/tissue [89-103], and review paper [104-106]. Besides, it is important to note that label-free SERS peak assignments are related to the spontaneous Raman peaks of exosomes. However, several factors such as the type of exosomes, laser wavelength, SERS substrate, solvent, etc., can influence the actual peak assignment. Consequently, Raman profiles and peak assignments may vary across different research studies [38, 39, 54, 55, 58]. Table 3 provides a list of common peak assignments related to important biomolecules used in exosome characterization. Given that the primary composition of the exosome surface is the lipid bilayer, many of the assigned peaks correspond to lipids and related subpopulations, such as fatty acids, cholesterol, and phospholipids. Additionally, proteins, nucleic acids, and related compounds are frequently utilized for exosome characterization in various research studies. Furthermore, glycoproteins [39, 58] and phosphoproteins [28] are used as biomarkers due to their significance in cancer development. Consequently, identifying chemicals like saccharides and phosphate groups becomes crucial. Apart from specific Raman peak assignments, the entire spectrum of certain biomarkers is also employed in exosome characterization. For example, Shin et al. utilized the fingerprint of common protein biomarkers CD9 and CD81, which are expressed on the surfaces of all exosomes, along with cancer-specific protein biomarkers like EGFR expressed in non-small cell lung cancer exosomes [32]. Comparing the spectral similarities between the protein biomarkers and PCA-decomposed spectra of exosomes allowed for the discrimination between normal and cancerous exosomes. It is crucial to relate to biomolecules/biomarker to the corresponding Raman peaks because it provides essential information about the exosome's molecular makeup and can lead to a better understanding of their biological roles, disease biomarkers, and potential therapeutic applications.
An overview or report of the identified peaks or characteristic signals obtained from Raman spectroscopy analysis of exosomes
| Biomolecular | Raman peak (cm-1) |
|---|---|
| Lipid | 1049 (C-N, C-C stretching of lipids) [39], 1449 (CH2 bending mode of lipids) [39], 1066 (Chain C-C stretching in lipids) [58], 1305 (CH3 CH2 twisting) [58],1447 (C-H vibration) [58],1450 (CH2, CH3 def) [58], 970 [54], 1070 ((C-C) stretching) [55], 1395 (CH3 scissoring) [55], 1435 (CH2/CH3 scissoring) [55],1455 [55],1307 ((C-N) stretching) [38], 1381 (CH3 symmetric) [38], 1465 [38] |
| Fatty acids | 1286 [37], 1140 [54] |
| Cholesterol | 867 [37], 864 [37], 1438 [54], 2890 ((CH2)-Chol stretching) [55], 546 [38], 406 [38] |
| Phospholipid | 826 (C-O-O vibration) [37], 716 (CN-(CH3)3) [54], 1179 [38], 1211 [38] |
| Protein | 826 [37], 1145 [37], 1049 (C-N, C-C stretching of Protein) [39], 1149 (CH2 bending mode of protein) [39], 1450 (CH2, CH3 def) [58], 1595 (C = O stretch) [58], 970 [54], 1111 [54], 1592 [54], 1220 (Amide III) [55], 1435 (CH2/CH3 scissoring) [55], 1620 (ν(C=C) [55], 521 [38], 1618 [38], 1542 [38], 1618 (ν(C=C) [38], 1632 [38] |
| Tyrosine | 654 [37], 1571 [37], 638 [39], 835 (Asymmetric O-P-O stretching) [58], 1614 [54], 660 ((C-C) twisting) [55], 830 [55], 1220 [55] |
| Proline | 939 [37],867 [37],930 [39], 947 [58], 1044 (ν3PO4 3-(symmetric stretching vibration)) [54] |
| Phenylalanine | 630 [37], 999 [37], 1580 [37], 1002 (C-C symmetric stretch of Phenylalanine) [39], 1012 [54], 1111 [54] |
| Tryptophan | 867 [37], 1002 (symmetric ring breathing mode) [39], 753 [54], 1566 [54] |
| Nucleic acid | 1100 [39], 1323 (CH2-CH2 of Nucleic Acids) [39], 1577 (guanine) [39], 1655[39], 816 [58],1662 [58], 970 [54], 1254 [55], 1340 (guanine) [55], 786 [38], 1243 [38] |
| Adenine | 631[37], 736 [37], 1571 [37], 722 (ν(CC), ν(CO)) [58], 1578 [58], 1183 [58] |
| Guanine | 654 [37], 1380 [37], 1576 [37], 1577 [2], 1180 [58], 1578 [58], 1183 [54], 1340 [55], 1360 [55] |
| Cytosine | 1180 [58], 1183 [54], 1287 [54] |
| DNA | 722 [58], 1510 (ring-breathing modes in the DNA bases) [54], 1592 [54] 668 [38], 1490 [38], 1664 [38] |
| Saccharide | 460 [39], 593 [39], 835 [58], 947 [58], 1370 [58] |
| Thiocyanate | 443 [39], 533 [39] |
| Phosphate group | 1087 [28] |
4.2 Univariate analysis
Univariate analysis in SERS analysis refers to the interpretation of individual spectral peak independently, without considering the interactions or correlations between different peaks. The first step of the univariate analysis is to assign Raman peaks to specific molecular vibrations and select the characteristic peak of exosome. Once the characteristic peak is selected, statistical methods are generally applied to discriminate the normal and cancerous exosome sample. For instance, research has revealed that the SERS intensity of exosomes at 1087 cm-1, attributed to the P-O bond within phosphoproteins, can serve as a valuable marker for tumor liquid biopsies [28]. A t-test analysis was performed, demonstrating a significant difference in Raman intensity between plasma exosomes from patients with prostate cancer and those without the condition. In addition to utilizing a single peak, univariate analysis can also involve examining the ratio between two peaks. For instance, the ratio R=I2880/I2930 is used to assess the packing density of the lipid membrane in the CH region [55]. This peak intensity ratio serves as an indicator of the lateral packing density of the acyl chain in the CH region and, consequently, reflects the level of conformational arrangement and interchain coupling within the lipid structure. Univariate analysis plays a crucial role as a starting point in SERS studies, and it can be utilized for discrimination analysis in certain cases. However, to achieve a more comprehensive understanding, researchers often turn to multivariate analysis techniques. These methods are employed to explore the interdependencies and correlations among multiple spectral features within complex SERS datasets, particularly due to the intricate SERS fingerprint of exosomes. By utilizing multivariate analysis, researchers can uncover more intricate patterns and extract valuable insights from the data.
4.3 Linear machine learning methods
Principal component analysis (PCA) is a widely employed technique in label-free SERS-based exosome analysis, aimed at reducing data dimensionality while retaining crucial information [23, 32, 34, 50, 54, 57]. By transforming the data into a new set of orthogonal loadings, PCA extracts the essential features from the original spectra. The sample projections on these Principal components (PCs) represent a score matrix, revealing distinct clustering patterns among the samples. For instance, in this study, PCA was performed on SERS analysis to classify A549 cell-derived and BEAS-2B cell-derived exosomes [57]. The loading plot (Figure 6A) indicated that four main SERS peaks (i.e., 1159, 1343, 1557, and 1678 cm-1) with high loading values contributed significantly to PC1, and these peaks were associated with DNA and proteins). This suggests that the unique proteins and DNA found in the A549 cell-derived exosomes played a crucial role in distinguishing between the two groups. Consequently, the PCA score plot (Figure 6B) demonstrated that the two types of exosomes exhibited significant differences and were clustered into separate groups, validating the effectiveness of PCA in accurately classifying the samples based on their molecular content. PCA is a powerful tool in SERS analysis, offering various benefits such as simplifying complex spectral datasets, enabling visualization, improving signal-to-noise ratio, and assisting in feature extraction and pattern recognition tasks. However, it is worth noting that PCA is a relatively simple linear unsupervised method. As a result, it is often utilized primarily for feature extraction and visualization. To achieve more precise classification results, researchers commonly incorporate more sophisticated methods independently or after applying PCA to the data and extracting relevant features. These advanced techniques may include support vector machines [31, 42], linear discriminant analysis (LDA) [39, 40, 42, 49], partial least squares discriminant analysis (PLS-DA) [38, 49]. By leveraging these supervised pattern recognition methods, researchers can capitalize on the simplified and meaningful representations obtained from PCA, allowing for more accurate and comprehensive analyses, especially when PCA is used as an initial step. This integrated approach helps to obtain a more robust and insightful analysis of the SERS data, leading to a deeper understanding of the underlying patterns and structures within the dataset.
(A) PCA score depicting the SERS spectra of exosomes derived from two distinct cell lines. (B) PC1 loading plot of PCA score plot from Figure 6A. The enclosed circles correspond to the 95% confidence ellipses. Adapted with permission from reference [57], copyright 2023 American Chemical Society.
4.4 Deep learning methods
Deep learning use artificial neural networks with multiple layers to learn and represent complex patterns in data, which shown significant promise in SERS analysis, as it can handle large and complex spectral datasets, extract meaningful features, and perform accurate classification or regression tasks [33, 35-37, 41, 43, 45-48]. Convolutional neural network (CNN) is a specialized type of artificial neural network designed which is one of the most popular deep learning methods used in the SERS analysis. One of the CNN architecture was shown in Figure 7 [36]. In this study, CNN successfully predicted whether exosome samples originated from breast cancer patients and accurately assessed different subtypes of breast cancer through the SERS signals of exosomes derived from normal and breast cancer cells, achieving a prediction accuracy of 100%. The increasing number of exosome research samples has enhanced the potential of deep learning for clinical analysis [15]. In their study using 520 test samples, Shin et al. not only detected early cancer but also accurately identified the presence of multiple cancer types based on CNN, including lung, breast, colon, liver, pancreas, and stomach, with an impressive area under the curve value of 0.970 based on the same database. The evidence provided by multiple research studies consistently demonstrates that deep learning consistently outperforms linear analysis methods like PCA, delivering superior and more precise results in various applications [41, 43, 46, 48]. Label-free SERS-based exosome analysis with deep learning exhibits tremendous potential, offering enhanced accuracy, automation, and scalability for processing vast and diverse datasets [33, 35-37, 41, 43-48]. For example, Wu et al. demonstrated higher accuracy using Backpropagation BP neural network models (92.4%) compared to PCA-LDA (64.7%) in their SERS-based analysis for evaluating nasopharyngeal cancer radioresistance [43]. Despite challenges in widespread deep learning adoption, including resource requirements and training data, continuous advancements in techniques and growing SERS-based exosome databases promise significant progress in this field. We have summarized the pros and cons of various data analysis methods in Table 4.
The CNN model's architecture comprises an input layer, four fully connected hidden layers, and an output layer. This arrangement produces a conclusive output which represent the predictive probabilities corresponding to each category of cell-derived exosomes. Adapted with permission from reference [36], copyright 2022 American Chemical Society.
Summary of advantages and disadvantages of various data analysis methods
| Technique | Principle | Advantage | Disadvantage | Example |
|---|---|---|---|---|
| Univariate analysis | Interpretation of individual spectral peak independently | Easy interpretation | Without considering the interactions or correlations between different peaks | Peak: Phosphoproteins peak (1087 cm-1) [28]. Lipid membrane in the CH region (R=I2880/I2930) [55] |
| Linear classification method | Unsupervised method, most of them are based on the projection on new variables | Relatively easy to implement, visualize and interpret | Cannot predict new sample | PCA [23, 28, 32, 54], TSNE [63] |
| Linear Discrimination method | Supervised linear method | Can predict new sample | Relatively low accuracy | LDA [39, 40, 42, 49], PLS-DA [38, 49], SVM [31, 42] |
| Deep learning | Artificial neural networks with multiple layers to learn and represent complex patterns in data | Relatively complicated to implement, visualize and interpret | Relatively high level of accuracy | CNN [33, 35-37, 41, 43-48], ANN [36, 48] |
PCA: Principal Component Analysis; TSNE: t-Distributed Stochastic Neighbor Embedding; LDA: Linear Discriminant Analysis; PLS-DA: Partial Least Squares Discriminant Analysis; SVM: Support Vector Machine; CNN: Convolutional Neural Network; ANN: Artificial Neural Network.
5. Conclusion and outlook
In this comprehensive review, our primary emphasis is placed on label-free SERS-based exosome detection. Our aim is to provide valuable insights into the current endeavors aimed at addressing pivotal challenges and to delve into innovative avenues for SERS-based exosome analysis, particularly within the realm of cancer diagnosis and beyond. The exploration begins with a thorough examination of exosome isolation and characterization methods, emphasizing their importance in SERS analysis due to the influence of exosome concentration and size. The significant and impactful advancements in SERS-based exosome research can only be realized through the development of highly efficient exosome isolation techniques. A meticulous selection of isolation methods tailored to specific biological samples and cargo types being screened will not only enhance the quality of isolated exosomes but also ensure the validity of the SERS results. The integration of microfluidic devices with label-free SERS analysis automation represents a compelling approach to streamline the isolation and analysis process. This integration has the potential to reduce sample volume requirements and significantly improve the overall efficiency and reliability of label-free SERS-based exosome research. Furthermore, the development of magnet SERS substrates presents an intriguing technique that combines exosome isolation and detection. This novel approach holds promise in high-throughput SERS analysis, opening exciting possibilities for advancing exosome research.
However, despite its potential, SERS-based label-free exosome detection faces several significant challenges that must be addressed for it to fully serve clinical and research applications. Exosomes exhibit a remarkable degree of heterogeneity concerning their size, composition, and surface proteins, presenting a formidable obstacle for SERS-based detection. Addressing this challenge necessitates the development of versatile SERS substrates and analytical methodologies capable of accommodating this diversity. Furthermore, while SERS is renowned for its exceptional sensitivity, consistently achieving low detection limits for exosomes remains a daunting task. The inherent low refractive index and weak Raman scattering signal of exosomes render their detection at low concentrations challenging. Consequently, there is a pressing need to explore innovative SERS substrates that offer heightened sensitivity and to devise advanced signal amplification strategies that can push the boundaries of exosome detection. Thus, our review delves into the significant advancements made in SERS substrates, recognizing their pivotal role in enhancing SERS analysis. Overcoming challenges related to reproducibility, signal uniformity, stability, and biocompatibility has been a primary focus, leading to the development of various innovative methods. For instance, extensive research has been conducted on the shape, size, and core@shell structure of NPs to improve SERS signal consistency and efficiency. Additionally, researchers have explored diverse SERS substrate materials, including porous materials, bacterial substrates, Pt-black SERS templates, and ITO glass, each offering unique properties to enhance performance. Moreover, to further boost SERS signal quality, molecular linkers such as ATPES and antibodies have been developed and employed. These molecular linkers play a critical role in facilitating efficient SERS signal transduction and enhancing the sensitivity and specificity of the analysis.
Last but certainly not least, an essential challenge in SERS-based exosome analysis lies in data analysis. To address this concern effectively, we present a comprehensive overview of data analysis methods, with a particular focus on fingerprint analysis techniques. These methods encompass both linear and non-linear machine learning approaches commonly employed in label-free SERS analysis. Linear machine learning methods, such as PCA, offer valuable insights into the SERS data, allowing for a deeper understanding of underlying patterns and structures within the dataset. On the other hand, deep learning presents tremendous potential, providing enhanced accuracy, automation, and scalability for processing vast and diverse datasets. However, the widespread adoption of deep learning faces challenges, notably the requirement for substantial computational resources and extensive training data. Despite these obstacles, continuous advancements in deep learning techniques and the growing availability of comprehensive SERS-based exosome databases are expected to drive significant progress in this field.
For SERS-based label-free exosome detection to evolve into a practical clinical tool, it must surmount various translational hurdles. These encompass the standardization of protocols, validation across substantial patient cohorts, and seamless integration with established diagnostic workflows. Close collaboration between researchers and clinicians is imperative to bridge the divide between laboratory-based research and clinical implementation. Moreover, SERS instrumentation often comes with a high cost and complexity, which can restrict its accessibility in resource-constrained settings. To confront this challenge, proactive measures should be taken to develop cost-effective SERS platforms and user-friendly devices that can be readily deployed in a diverse array of healthcare settings.
Abbreviations
EVs: Extracellular Vesicles
SERS: Surface-Enhanced Raman Spectroscopy
EF: Enhancement Factor
Au: Gold
Ag: Silver
NPs: Nanoparticles
UC: Ultracentrifugation
SEC: Size Exclusion Chromatography
TEM: Transmission Electron Microscopy
NTA: Nanoparticle Tracking Analysis
FDTD: Finite-Difference Time-Domain
LSPRs: Localized Surface Plasmon Resonances
PCA: Principal Component Analysis
LDA: Linear Discriminant Analysis
PLS-DA: Partial Least Squares Discriminant Analysis
CNN: Convolutional Neural Network
SVM: Support Vector Machine
3DOM: 3D Ordered Macroporous
MIO: Macroporous Inverse Opal
APTES: 3-Aminopropyl Triethoxy Silane
EF: Epidermal Growth Factor
BP: Backpropagation
ITO: Indium Tin Oxide
DMAP: 4-Dimethylaminopyridine
MB: Methylene Blue
R6G: Rhodamine 6G
4-MBA: 4-Mercaptobenzoic Acid
Acknowledgements
We thank Biorender for making figures. We are grateful for the publishers for granting us the copyright permissions to reprint the figures.
Funding
This research was supported by the grant from Bureau of Education of Guangzhou Municipality Foundation (No. 202201010404 and No.201831836), the Guizhou Provincial Science and Technology Project (No. ZK2022063), and plan on enhancing scientific research in GMU.
Competing Interests
The authors have declared that no competing interest exists.
References
1. Raposo G, Stahl PD. Extracellular vesicles: A new communication paradigm? Nat Rev Mol Cell Biol. 2019;20:509-10
2. Kalluri R, LeBleu VS. The biology, function, and biomedical applications of exosomes. Science. 2020;367:eaau6977
3. Pegtel DM, Gould SJ. Exosomes. Annu Rev Biochem. 2019;88:487-514
4. Hessvik NP, Llorente A. Current knowledge on exosome biogenesis and release. Cell Mol Life Sci. 2018;75:193-208
5. He C, Zheng S, Luo Y, Wang B. Exosome theranostics: Biology and translational medicine. Theranostics. 2018;8:237
6. Chavda VP, Pandya A, Kumar L, Raval N, Vora LK, Pulakkat S. et al. Exosome nanovesicles: A potential carrier for therapeutic delivery. Nano Today. 2023;49:101771
7. Jeppesen DK, Fenix AM, Franklin JL, Higginbotham JN, Zhang Q, Zimmerman LJ. et al. Reassessment of exosome composition. Cell. 2019;177:428-45 e18
8. Pang B, Zhu Y, Ni J, Thompson J, Malouf D, Bucci J. et al. Extracellular vesicles: The next generation of biomarkers for liquid biopsy-based prostate cancer diagnosis. Theranostics. 2020;10:2309
9. Kar R, Dhar R, Mukherjee S, Nag S, Gorai S, Mukerjee N. et al. Exosome-based smart drug delivery tool for cancer theranostics. ACS Biomater Sci Eng. 2023;9:577-94
10. Dhar R, Devi A, Gorai S, Jha SK, Alexiou A, Papadakis M. Exosome and epithelial-mesenchymal transition: A complex secret of cancer progression. J Cell Mol Med. 2023
11. Lötvall J, Hill AF, Hochberg F, Buzás EI, Di Vizio D, Gardiner C. et al. Minimal experimental requirements for definition of extracellular vesicles and their functions: A position statement from the international society for extracellular vesicles. Taylor & Francis. 2014 p. 26913
12. Ramirez-Garrastacho M, Bajo-Santos C, Line A, Martens-Uzunova ES, de la Fuente JM, Moros M. et al. Extracellular vesicles as a source of prostate cancer biomarkers in liquid biopsies: A decade of research. Br J Cancer. 2022;126:331-50
13. Liang Y, Lehrich BM, Zheng S, Lu M. Emerging methods in biomarker identification for extracellular vesicle-based liquid biopsy. J Extracell Vesicles. 2021;10:e12090
14. Sharma B, Frontiera RR, Henry A-I, Ringe E, Van Duyne RP. Sers: Materials, applications, and the future. Mater Today. 2012;15:16-25
15. Li J, Li Y, Li P, Zhang Y, Du L, Wang Y. et al. Exosome detection via surface-enhanced raman spectroscopy for cancer diagnosis. Acta Biomater. 2022;144:1-14
16. Shin H, Seo D, Choi Y. Extracellular vesicle identification using label-free surface-enhanced raman spectroscopy: Detection and signal analysis strategies. Molecules. 2020;25:5209
17. Liu H, Gao X, Xu C, Liu D. Sers tags for biomedical detection and bioimaging. Theranostics. 2022;12:1870-903
18. Lee JU, Kim S, Sim SJ. Sers-based nanoplasmonic exosome analysis: Enabling liquid biopsy for cancer diagnosis and monitoring progression. Biochip J. 2020;14:231-41
19. Wang Z, Zong S, Wang Y, Li N, Li L, Lu J. et al. Screening and multiple detection of cancer exosomes using an sers-based method. Nanoscale. 2018;10:9053-62
20. Jiang S, Li Q, Wang C, Pang Y, Sun Z, Xiao R. In situ exosomal microrna determination by target-triggered sers and fe3o4@ tio2-based exosome accumulation. ACS sensors. 2021;6:852-62
21. Li T-D, Zhang R, Chen H, Huang Z-P, Ye X, Wang H. et al. An ultrasensitive polydopamine bi-functionalized sers immunoassay for exosome-based diagnosis and classification of pancreatic cancer. Chem Sci. 2018;9:5372-82
22. Han Z, Peng X, Yang Y, Yi J, Zhao D, Bao Q. et al. Integrated microfluidic-sers for exosome biomarker profiling and osteosarcoma diagnosis. Biosens Bioelectron. 2022;217:114709
23. Han L, Zhu C, Tan Z, Wang J, Liao X, Xia X-H. et al. Integrated separation and detection of exosomes via a label-free magnetic sers platform. Chem Commun. 2023;59:7967-70
24. Qi G, Diao X, Hou S, Kong J, Jin Y. Label-free sers detection of protein damage in organelles under electrostimulation with 2d aunps-based nanomembranes as substrates. Anal Chem. 2022;94:14931-7
25. Qi G, Wang D, Li C, Ma K, Zhang Y, Jin Y. Plasmonic sers au nanosunflowers for sensitive and label-free diagnosis of DNA base damage in stimulus-induced cell apoptosis. Anal Chem. 2020;92:11755-62
26. Wang J, Cong L, Shi W, Xu W, Xu S. Single-cell analysis and classification according to multiplexed proteins via microdroplet-based self-driven magnetic surface-enhanced raman spectroscopy platforms assisted with machine learning algorithms. Anal Chem. 2023;95:11019-27
27. Chen I-H, Xue L, Hsu C-C, Paez JSP, Pan L, Andaluz H. et al. Phosphoproteins in extracellular vesicles as candidate markers for breast cancer. Proc Natl Acad Sci U S A. 2017;114:3175-80
28. Dong S, Wang Y, Liu Z, Zhang W, Yi K, Zhang X. et al. Beehive-inspired macroporous sers probe for cancer detection through capturing and analyzing exosomes in plasma. ACS Appl Mater Interfaces. 2020;12:5136-46
29. Choi Y, Park U, Koo H-J, Park J-s, Lee DH, Kim K. et al. Exosome-mediated diagnosis of pancreatic cancer using lectin-conjugated nanoparticles bound to selective glycans. Biosens Bioelectron. 2021;177:112980
30. Brinkman K, Meyer L, Bickel A, Enderle D, Berking C, Skog J. et al. Extracellular vesicles from plasma have higher tumour rna fraction than platelets. J Extracell Vesicles. 2020;9:1741176
31. Jonak ST, Liu Z, Liu J, Li T, D'Souza BV, Schiaffino JA. et al. Analyzing bronchoalveolar fluid derived small extracellular vesicles using single-vesicle sers for non-small cell lung cancer detection. Sens Diagn. 2023;2:90-9
32. Shin H, Jeong H, Park J, Hong S, Choi Y. Correlation between cancerous exosomes and protein markers based on surface-enhanced raman spectroscopy (sers) and principal component analysis (pca). ACS sensors. 2018;3:2637-43
33. Kim S, Choi BH, Shin H, Kwon K, Lee SY, Yoon HB. et al. Plasma exosome analysis for protein mutation identification using a combination of raman spectroscopy and deep learning. ACS sensors. 2023;8:2391-400
34. Ferreira N, Marques A, Águas H, Bandarenka H, Martins R, Bodo C. et al. Label-free nanosensing platform for breast cancer exosome profiling. ACS sensors. 2019;4:2073-83
35. Li X, Keshavarz M, Kassanos P, Kidy Z, Roddan A, Yeatman E. et al. Sers detection of breast cancer-derived exosomes using a nanostructured pt-black template. Adv Sensor Res. 2023: 2200039.
36. Xie Y, Su X, Wen Y, Zheng C, Li M. Artificial intelligent label-free sers profiling of serum exosomes for breast cancer diagnosis and postoperative assessment. Nano Letters. 2022;22:7910-8
37. Ma X, Xiong H, Guo J, Liu Z, Han Y, Liu M. et al. Label-free breast cancer detection and classification by convolutional neural network-based on exosomes surface-enhanced raman scattering. J Innov Opt Health Sci. 2022;16:2244001
38. Fraire JC, Stremersch S, Bouckaert D, Monteyne T, De Beer T, Wuytens P. et al. Improved label-free identification of individual exosome-like vesicles with au@ ag nanoparticles as sers substrate. ACS Appl Mater Interfaces. 2019;11:39424-35
39. Faur CI, Dinu C, Toma V, Jurj A, Mărginean R, Onaciu A. et al. A new detection method of oral and oropharyngeal squamous cell carcinoma based on multivariate analysis of surface enhanced raman spectra of salivary exosomes. J Precis Med. 2023;13:762
40. Koster HJ, Rojalin T, Powell A, Pham D, Mizenko RR, Birkeland AC. et al. Surface enhanced raman scattering of extracellular vesicles for cancer diagnostics despite isolation dependent lipoprotein contamination. Nanoscale. 2021;13:14760-76
41. Qian H, Shao X, Zhang H, Wang Y, Liu S, Pan J. et al. Diagnosis of urogenital cancer combining deep learning algorithms and surface-enhanced raman spectroscopy based on small extracellular vesicles. Spectrochim Acta A Mol Biomol Spectrosc. 2022;281:121603
42. Elkady A, Hassan M, Hagag MF, El-Ahwany E, Helal OM, Zoheiry M. et al. Innovative model of surface-enhanced raman spectroscopy for exosomes identification: An approach for the diagnosis of hepatocellular carcinoma. Clin Chim Acta. 2023: 117228.
43. Wu Q, Ding Q, Lin W, Weng Y, Feng S, Chen R. et al. Profiling of tumor cell-delivered exosome by surface enhanced raman spectroscopy-based biosensor for evaluation of nasopharyngeal cancer radioresistance. Adv Healthc Mater. 2023;12:2202482
44. Zhou J, Lu D, Chen C, Zhang S, Chen J, Lu Y. Gastric cancer diagnosis by deep learning based on variation trend of exosomal sers signals. Available at SSRN 4203355.
45. Shin H, Choi BH, Shim O, Kim J, Park Y, Cho SK. et al. Single test-based diagnosis of multiple cancer types using exosome-sers-ai for early stage cancers. Nat Commun. 2023;14:1644
46. Shin H, Oh S, Hong S, Kang M, Kang D, Ji Y-g. et al. Early-stage lung cancer diagnosis by deep learning-based spectroscopic analysis of circulating exosomes. ACS nano. 2020;14:5435-44
47. Shin H, Kang Y, Choi KW, Kim S, Ham B-J, Choi Y. Artificial intelligence-based major depressive disorder (mdd) diagnosis using raman spectroscopic features of plasma exosomes. Anal Chem. 2023;95:6410-6
48. Huang X, Liu B, Guo S, Guo W, Liao K, Hu G. et al. Sers spectroscopy with machine learning to analyze human plasma derived sevs for coronary artery disease diagnosis and prognosis. Bioeng Transl Med. 2023;8:e10420
49. Diao X, Li X, Hou S, Li H, Qi G, Jin Y. Machine learning-based label-free sers profiling of exosomes for accurate fuzzy diagnosis of cancer and dynamic monitoring of drug therapeutic processes. Anal Chem. 2023;95:7552-9
50. Li G, Zhu N, Zhou J, Kang K, Zhou X, Ying B. et al. A magnetic surface-enhanced raman scattering platform for performing successive breast cancer exosome isolation and analysis. J Mater Chem B. 2021;9:2709-16
51. Ge S, Chen G, Cao D, Lin H, Liu Z, Yu M. et al. Au/sinca-based sers analysis coupled with machine learning for the early-stage diagnosis of cisplatin-induced liver injury. Anal Chim Acta. 2023;1254:341113
52. Russo M, Tirinato L, Scionti F, Coluccio ML, Perozziello G, Riillo C. et al. Raman spectroscopic stratification of multiple myeloma patients based on exosome profiling. ACS omega. 2020;5:30436-43
53. Kim WH, Lee JU, Jeon MJ, Park KH, Sim SJ. Three-dimensional hierarchical plasmonic nano-architecture based label-free surface-enhanced raman spectroscopy detection of urinary exosomal mirna for clinical diagnosis of prostate cancer. Biosens Bioelectron. 2022;205:114116
54. Yan Z, Dutta S, Liu Z, Yu X, Mesgarzadeh N, Ji F. et al. A label-free platform for identification of exosomes from different sources. ACS sensors. 2019;4:488-97
55. Jalali M, Hosseini II, AbdelFatah T, Montermini L, Hogiu SW, Rak J. et al. Plasmonic nanobowtiefluidic device for sensitive detection of glioma extracellular vesicles by raman spectrometry. Lab on a Chip. 2021;21:855-66
56. Back SJ, Kim W, Kim S-J, Hwang SR, Jung GB. Rapid and simple isolation and detection of exosomes using catio3: Eu3+@ fe3o4 multifunctional nanocomposites. Anal Biochem. 2023: 115161.
57. An N, Bi C, Liu H, Zhao L, Chen X, Chen M. et al. Shape-preserving transformation of electrodeposited macroporous microparticles for single-particle sers applications. ACS Appl Mater Interfaces. 2023;15:8286-97
58. Parlatan U, Ozen MO, Kecoglu I, Koyuncu B, Torun H, Khalafkhany D. et al. Label-free identification of exosomes using raman spectroscopy and machine learning. Small. 2023: 2205519.
59. Li Y, Wang Y, Tian J, Huang J-A. Detection of cell-derived exosomes via surface-enhanced raman scattering using aggregated silver nanoparticles. Cell-secreted vesicles: Methods and protocols: Springer. 2023 p. 15-22
60. Zhang P, Wang L, Fang Y, Zheng D, Lin T, Wang H. Label-free exosomal detection and classification in rapid discriminating different cancer types based on specific raman phenotypes and multivariate statistical analysis. Molecules. 2019;24:2947
61. Li P, Kaslan M, Lee SH, Yao J, Gao Z. Progress in exosome isolation techniques. Theranostics. 2017;7:789
62. Yang D, Zhang W, Zhang H, Zhang F, Chen L, Ma L. et al. Progress, opportunity, and perspective on exosome isolation-efforts for efficient exosome-based theranostics. Theranostics. 2020;10:3684
63. Kazemzadeh M, Martinez-Calderon M, Paek SY, Lowe M, Aguergaray C, Xu W. et al. Classification of preeclamptic placental extracellular vesicles using femtosecond laser fabricated nanoplasmonic sensors. ACS sensors. 2022;7:1698-711
64. Kanwar SS, Dunlay CJ, Simeone DM, Nagrath S. Microfluidic device (exochip) for on-chip isolation, quantification and characterization of circulating exosomes. Lab on a Chip. 2014;14:1891-900
65. Tauro BJ, Greening DW, Mathias RA, Ji H, Mathivanan S, Scott AM. et al. Comparison of ultracentrifugation, density gradient separation, and immunoaffinity capture methods for isolating human colon cancer cell line lim1863-derived exosomes. Methods. 2012;56:293-304
66. Wang Y, Li Q, Shi H, Tang K, Qiao L, Yu G. et al. Microfluidic raman biochip detection of exosomes: A promising tool for prostate cancer diagnosis. Lab on a Chip. 2020;20:4632-7
67. Zeng Z, Liu Y, Wei J. Recent advances in surface-enhanced raman spectroscopy (sers): Finite-difference time-domain (fdtd) method for sers and sensing applications. Trends Analyt Chem. 2016;75:162-73
68. Gomez-Cruz J, Bdour Y, Stamplecoskie K, Escobedo C. Fdtd analysis of hotspot-enabling hybrid nanohole-nanoparticle structures for sers detection. Biosensors. 2022;12:128
69. Le Ru EC, Blackie E, Meyer M, Etchegoin PG. Surface enhanced raman scattering enhancement factors: A comprehensive study. J Phys Chem C. 2007;111:13794-803
70. Zhang X, Liu C, Pei Y, Song W, Zhang S. Preparation of a novel raman probe and its application in the detection of circulating tumor cells and exosomes. ACS Appl Mater Interfaces. 2019;11:28671-80
71. Benz F, Chikkaraddy R, Salmon A, Ohadi H, De Nijs B, Mertens J. et al. Sers of individual nanoparticles on a mirror: Size does matter, but so does shape. J Phys Chem Lett. 2016;7:2264-9
72. Bell SE, McCourt MR. Sers enhancement by aggregated au colloids: Effect of particle size. Phys Chem Chem Phys. 2009;11:7455-62
73. He RX, Liang R, Peng P, Norman Zhou Y. Effect of the size of silver nanoparticles on sers signal enhancement. J Nanopart Res. 2017;19:267
74. Wang T, Wang S, Cheng Z, Wei J, Yang L, Zhong Z. et al. Emerging core-shell nanostructures for surface-enhanced raman scattering (sers) detection of pesticide residues. Chem Eng J. 2021;424:130323
75. Pilipavicius J, Kaleinikaite R, Pucetaite M, Velicka M, Kareiva A, Beganskiene A. Controllable formation of high density sers-active silver nanoprism layers on hybrid silica-aptes coatings. Appl Surf Sci. 2016;377:134-40
76. Ngo L, Tukova A, Hassanzadeh-Barforoushi A, Zhang W, Wang Y. Emerging integrated sers-microfluidic devices for analysis of cancer-derived small extracellular vesicles. Lab on a Chip. 2023;23:2899-921
77. Xu H, Ye B-C. Integrated microfluidic platforms for tumor-derived exosome analysis. Trends Analyt Chem. 2022: 116860.
78. Zhang H, Silva AC, Zhang W, Rutigliano H, Zhou A. Raman spectroscopy characterization extracellular vesicles from bovine placenta and peripheral blood mononuclear cells. PLoS One. 2020;15:e0235214
79. Tatischeff I, Larquet E, Falcón-Pérez JM, Turpin P-Y, Kruglik SG. Fast characterisation of cell-derived extracellular vesicles by nanoparticles tracking analysis, cryo-electron microscopy, and raman tweezers microspectroscopy. J Extracell Vesicles. 2012;1:19179
80. Lee C, Carney RP, Hazari S, Smith ZJ, Knudson A, Robertson CS. et al. 3d plasmonic nanobowl platform for the study of exosomes in solution. Nanoscale. 2015;7:9290-7
81. Fălămaș A, Rotaru H, Hedeșiu M. Surface-enhanced raman spectroscopy (sers) investigations of saliva for oral cancer diagnosis. Lasers Med Sci. 2020;35:1393-401
82. Bossuyt PM, Reitsma JB, Bruns DE, Gatsonis CA, Glasziou PP, Irwig L. et al. Stard 2015: An updated list of essential items for reporting diagnostic accuracy studies. Br Med J. 2015;351:h5527
83. Calado G. Development of methodologies for raman spectral analysis of human saliva for detection of oral cancer. 2020.
84. Li X, Yang T, Lin J. Spectral analysis of human saliva for detection of lung cancer using surface-enhanced raman spectroscopy. J Biomed Opt. 2012;17:037003
85. Driskell J, Seto A, Jones L, Jokela S, Dluhy R, Zhao Y-P. et al. Rapid microrna (mirna) detection and classification via surface-enhanced raman spectroscopy (sers). Biosens Bioelectron. 2008;24:917-22
86. Bell SE, Sirimuthu NM. Surface-enhanced raman spectroscopy (sers) for sub-micromolar detection of DNA/rna mononucleotides. J Am Chem Soc. 2006;128:15580-1
87. Jaworska A, Jamieson LE, Malek K, Campbell CJ, Choo J, Chlopicki S. et al. Sers-based monitoring of the intracellular ph in endothelial cells: The influence of the extracellular environment and tumour necrosis factor-α. Analyst. 2015;140:2321-9
88. Tirinato L, Gentile F, Di Mascolo D, Coluccio M, Das G, Liberale C. et al. Sers analysis on exosomes using super-hydrophobic surfaces. Microelectron Eng. 2012;97:337-40
89. Calado G, Behl I, Byrne HJ, Lyng FM. Raman spectroscopic characterisation of non stimulated and stimulated human whole saliva. Clin Spectrosc. 2021;3:100010
90. Cals FL, Bakker Schut TC, Hardillo JA, Baatenburg de Jong RJ, Koljenović S, Puppels GJ. Investigation of the potential of raman spectroscopy for oral cancer detection in surgical margins. Lab Invest. 2015;95:1186-96
91. Movasaghi Z, Rehman S, Rehman IU. Raman spectroscopy of biological tissues. Appl Spectrosc Rev. 2007;42:493-541
92. Buchan E, Kelleher L, Clancy M, Stanley Rickard JJ, Oppenheimer PG. Spectroscopic molecular-fingerprint profiling of saliva. Anal Chim Acta. 2021;1185:339074
93. Chan JW, Taylor DS, Zwerdling T, Lane SM, Ihara K, Huser T. Micro-raman spectroscopy detects individual neoplastic and normal hematopoietic cells. Biophys J. 2006;90:648-56
94. Cheng WT, Liu MT, Liu HN, Lin SY. Micro-raman spectroscopy used to identify and grade human skin pilomatrixoma. Microsc Res Tech. 2005;68:75-9
95. Stone N, Kendall C, Smith J, Crow P, Barr H. Raman spectroscopy for identification of epithelial cancers. Faraday Discuss. 2004;126:141-57
96. Notingher I, Green C, Dyer C, Perkins E, Hopkins N, Lindsay C. et al. Discrimination between ricin and sulphur mustard toxicity in vitro using raman spectroscopy. J R Soc Interface. 2004;1:79-90
97. Huang Z, McWilliams A, Lui H, McLean DI, Lam S, Zeng H. Near-infrared raman spectroscopy for optical diagnosis of lung cancer. Int J Cancer. 2003;107:1047-52
98. Stone N, Kendall C, Shepherd N, Crow P, Barr H. Near-infrared raman spectroscopy for the classification of epithelial pre-cancers and cancers. J Raman Spectrosc. 2002;33:564-73
99. Dukor RK. Vibrational spectroscopy in the detection of cancer. Handbook of vibrational spectroscopy. 2006
100. Naumann D. Infrared and nir raman spectroscopy in medical microbiology. Infrared spectroscopy: new tool in medicine: SPIE. 1998 p. 245-57
101. Frank CJ, McCreery RL, Redd DC. Raman spectroscopy of normal and diseased human breast tissues. Anal Chem. 1995;67:777-83
102. Lakshmi RJ, Kartha V, Murali Krishna C, R. Solomon J, Ullas G, Uma Devi P. Tissue raman spectroscopy for the study of radiation damage: Brain irradiation of mice. Radiat Res. 2002;157:175-82
103. Faolain EO, Hunter MB, Byrne JM, Kelehan P, McNamara M, Byrne HJ. et al. A study examining the effects of tissue processing on human tissue sections using vibrational spectroscopy. Vib Spectrosc. 2005;38:121-7
104. Kho KW, Fu CY, Dinish US, Olivo M. Clinical sers: Are we there yet? J Biophotonics. 2011;4:667-84
105. Derruau S, Robinet J, Untereiner V, Piot O, Sockalingum GD, Lorimier S. Vibrational spectroscopy saliva profiling as biometric tool for disease diagnostics: A systematic literature review. Molecules. 2020;25:4142
106. Ma L, Zhang Z, Li X. Non-invasive disease diagnosis using surface-enhanced raman spectroscopy of urine and saliva. Appl Spectrosc Rev. 2020;55:197-219
Author contact
![]() Corresponding author: Chao Kang; Email: ckangedu.cn. Cheng Wang; Email: wangc4ie, jxwangchengcom.
Corresponding author: Chao Kang; Email: ckangedu.cn. Cheng Wang; Email: wangc4ie, jxwangchengcom.