Impact Factor
- Issue 14; 2026
- Issue 13; 2026
- Issue 12; 2026
- Issue 11; 2026
- Issue 10; 2026
- Volume 16; 2026
- Advance Articles
- Past Issues
- Cover Images
- Cover Suggestion
- Index & Coverage
- Special Issues
1. Introduction
2. Physicochemical properties of...
3. Preparation and usage of...
4. Confirmation of single QD...
5. Measurement techniques for...
6. Analysis of single QD...
7. Applications of single...
8. Challenges and prospects
9. Conclusion
Acknowledgements
References
International Journal of Biological Sciences
International Journal of Medical Sciences
 Global reach, higher impact

Theranostics 2012; 2(7):655-667. doi:10.7150/thno.3890 This issue Cite
Review
Single-Molecule Tracking in Living Cells Using Single Quantum Dot Applications
Koichi Baba ![]() , Kohji Nishida
, Kohji Nishida
Department of Ophthalmology, Osaka University Graduate School of Medicine, 2-2 Yamadaoka, Suita, Osaka 565-0871, Japan.
Received 2011-11-30; Accepted 2012-1-27; Published 2012-7-6
Abstract
Revealing the behavior of single molecules in living cells is very useful for understanding cellular events. Quantum dot probes are particularly promising tools for revealing how biological events occur at the single molecule level both in vitro and in vivo. In this review, we will introduce how single quantum dot applications are used for single molecule tracking. We will discuss how single quantum dot tracking has been used in several examples of complex biological processes, including membrane dynamics, neuronal function, selective transport mechanisms of the nuclear pore complex, and in vivo real-time observation. We also briefly discuss the prospects for single molecule tracking using advanced probes.
Keywords: single molecule tracking, quantum dot, membrane dynamics, neuroscience, nuclear pore complex, in vivo real-time tracking.
1. Introduction
The ability to selectively detect a single molecule or small number of molecules in living cells is a very powerful way to understand the dynamics of cellular organization. Many key cellular processes are mediated by a small number of molecules, and can be regarded as single-molecule events [1]. Therefore, monitoring the behavior of a single molecule, e.g. a single protein, in living cells is a powerful approach for investigating the details of cellular events.
Conventional in vivo imaging methods such as magnetic resonance imaging, computed tomography and positron emission tomography do not have a sufficient resolution level to reveal bioactivity at the single molecule in vivo. Although the use of organic fluorescence or luminescence imaging provides reliable results, the data obtained are mean values from multiple molecular events at a particular point in time. Therefore, such techniques do not provide information about how the activities of single molecules, including proteins, fluctuate within different parts of living cells at different points in time [2-4].
Single particle methods have been under development since the late 1980s in order to enable the imaging of single molecules in cells [5]. Initially, micron-sized latex beads and gold nanoparticles (40-100 nm in size), which could be detected by interference contrast microscopy, were used to follow the movement of single molecules in living cells. Following the demonstration by Shera in the 1990s that single molecules of fluorescent dyes could be detected in solution, single fluorescent dye-based imaging has become a useful and common tool in biophysics [6]. Subsequently, these methods were extended to track single dyes and Green Fluorescent Protein (GFP) in living cells [2]. Following the introduction of GFP, it became possible to monitor the expression and localization of a GFP-tagged protein in living organisms [7-8]. Nowadays, fluorescent proteins (derivatives of GFP) are available with several different excitation/emission spectra that allow for simultaneous observation of more than one protein [9]. Because the fusion of GFP with the protein of interest is achieved at the genetic level, the staining is highly specific and the stoichiometry is well defined at one GFP per protein. For instance, it is possible to observe the relative amount of an expressed protein and its localization throughout the cell's life cycle within a population of cells. In addition, protein translocation within the cell can be tracked by following the movement of a single fluorescent molecule.
However, analysis of the properties of single molecules in living cells using latex beads, gold nanoparticles, fluorescent dyes, and GFP is restricted by either the size of the probe (40 nm gold nanoparticles or 500 nm latex spheres) or the photobleaching of small fluorescent labels (fluorescent dyes and GFP). These restrictions reduce the duration of the measurements and limit the observation of complex dynamics [10]. Although non-fluorescent particle tracking is not limited by such issues, it is not easily amenable to signal multiplexing. Therefore, the correlation of multiple parameters by such techniques is not possible [11].
Quantum dots (QDs) do not possess the limitations of conventional probes (latex beads, gold nanoparticles, fluorescent dyes, GFP). They have therefore become of increasing interest as luminescent tracers in biological applications such as molecular histopathology, disease diagnosis and biological imaging [12-15], including in vivo tumor detection [16-19], stem cell imaging [20-22], and drug delivery [23-25]. Indeed, QDs, which are intermediary in size (2 to 10 nm), are substantially more photostable than conventional fluorophores, and have been vaunted as promising fluorescent probes [26-27].
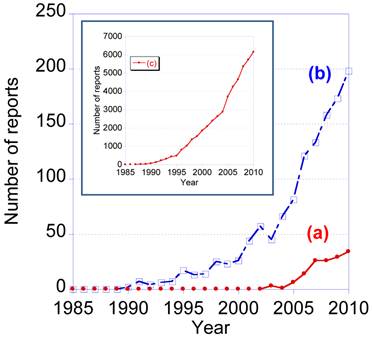
Recently, the number of research reports relating to single molecule tracking using quantum dots has gradually increased. From 1985 to 2010, the total number of reports containing the two key terms, “single molecule tracking” and “quantum dot”, was 156. The number of reports containing only one of these key terms was 1,348 for “single molecule tracking” and 53,424 for “quantum dot” (data from Web of Science). Single molecule tracking using QDs is therefore at the frontiers of research into bioimaging.
In this review, we first introduce the fundamental physicochemical properties of QDs that enable single molecule tracking via a single QD. We then discuss several examples of QD-based single molecule tracking, including membrane dynamics, neuronal function, selective transport mechanisms of the nuclear pore complex, and in vivo real-time observation.
Number of research report from 1985 to 2010 containing the key words (a) “single molecule tracking” and “quantum dot”, (b) “single molecule tracking”, and (c) “quantum dot”. The data are from WEB of KNOWLEDGESM by THOMSON REUTERS (2011).
2. Physicochemical properties of QDs
QDs are semiconductor nanocrystals comprising elements from the periodic groups II-IV, IV-VI, or III-V, which act as a semiconductor core (e.g., CdTe, CdSe, PbSe, GaAs, GaN, InP, and InAs) [28]. In order to minimize the surface defect and increase the quantum yield, the core is surrounded by a semiconductor shell such as ZnS that has wide-bandgap energy [29]. Because the lattice constants of CdSe and ZnS in bulk crystals are 4.30Å (a-axis) and 5.42Å, respectively (Table 1), the lattice mismatch between them is quite large [30]. However, the relatively large surface curvature in the quantum dot enables epitaxial shell growth on the core. The size of QDs ranges between 2 and 10 nm in diameter, which is close to or smaller than the dimensions of the excitation Bohr radius. As a result, the mobility of the electron-charged carrier is restricted in the range of nanoscale dimensions, and this quantum confinement effect provides the QDs with unique optical and electrical properties [31]. The optical properties of QDs include high quantum yields, high molar extinction coefficients (ca. 10-100 times higher than that of organic dyes), broad absorption with narrow (25-40 nm half width), symmetric photoluminescence spectra between UV to near-infrared regions, large effective Stock shifts, and high resistance against photobleaching and photo- and chemical-degradation [32-33].
Lattice constant and bandgap energy of semiconductor.
| Material | crystal structure | lattice constant* (Å) | Eg* (eV) |
|---|---|---|---|
| CdS | Wurtzite | a = 4.16 (c = 6.76) | 2.42 |
| CdSe | Wurtzite | a = 4.30 (c = 7.01) | 1.74 |
| CdTe | Zinc blend | 6.48 | 1.56 |
| ZnS | Zinc blend | 5.42 | 3.54 |
| ZnSe | Zinc blend | 5.67 | 2.67 |
| ZnTe | Zinc blend | 6.1 | 2.24 |
| GaAs | Zinc blend | 5.65 | 1.43 |
| GaP | Zinc blend | 5.45 | 2.26 (indirect) |
| InAs | Zinc blend | 6.06 | 0.36 |
| InP | Zinc blend | 5.87 | 1.29 |
| PbS | Rock salt | 6.1 | 0.27 |
| PbTe | Rock salt | 6.46 | 0.32 |
| Si | Diamond | 5.43 | 1.11 (indirect) |
| Ge | Diamond | 5.65 | 0.66 (indirect) |
Note: the data of Table 1 is obtained from reference 30: Maenosono S. In: Yamamoto S, ed. Application of Quantum Dot in Life Science, 1st ed. Tokyo: CMC International Co., Ltd.; Table 1, 2007: 15-26.
Because QDs are mostly synthesized in the organic solvent phase, the resulting QDs are water-insoluble [12, 34]. Therefore, to make use of their optical properties in biological systems, the surface has to be modified by a hydrophilic coating. QDs obtained in the organic phase are transferred to the aqueous phase by a ligand exchange method [12, 35]. Alternatively, a polymer and lipid coating is another efficient method of providing QDs with good water solubility. Recently, several studies relating to QD surface coating methods that have increased water dispersion have been reported [36]. For instance, QDs (CdTe/ZnTe; core/shell) from a direct one-pot synthesis in the aqueous phase exhibited low toxicity with high quantum yield (52%), and underwent bioconjugation (cystein-capped) with a small particle size (3-5 nm) [37]. To improve their in vitro and in vivo imaging performance, recent efforts have focused mainly on the functionalization of QDs to accommodate the demands of imaging sensitivity and specificity.
3. Preparation and usage of bioconjugated QDs
The method used for bioconjugation of QDs is important for subsequent QD-based target delivery, cellular entrance, and single molecule tracking [38]. QDs used for bioimaging applications are prepared by a variety of steps, including synthesis of core QDs and their shell coating, surface modification, and bioconjugation. In particular, appropriate surface modification enables the successful conjugation of biomolecules with QDs. Reactive functional groups and molecules suitable for the surface coating of core/shell QDs to facilitate subsequent bioconjugation include thiol, streptavidin, biotin, primary amines, maleimide, succinimide, carboxylic acid, or biocompatible polymer [26, 39]. Biomolecules, including antibodies, peptides, proteins, aptamers, nucleic acids, small molecules, and liposomes, are all candidates for bioconjugation to QDs [29, 39]. These biomolecules can be covalently coated onto the surface of QDs if they contain a functional group, otherwise non-covalent coating on the QDs surface is performed. These bioconjugated QDs are extensively used for direct and indirect labeling of extracellular proteins and subcellular organelles. Therefore, bioconjugated QDs are classified as (i) nonspecific extracellular labeling, (ii) nonspecific intracellular delivery, (iii) targeted extracellular labeling, and (iv) targeted intracellular delivery [39]. Several excellent reviews that discuss the various methods of QD bioconjugation have been published [39-43]. Bioconjugated QDs are essential for effective single molecule tracking using QDs.
4. Confirmation of single QD tracking using the antibunching measurement
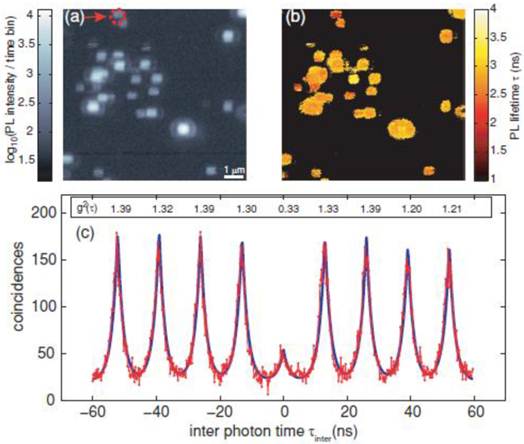
Generally, the antibunching measurement confirms whether the single molecule tracking of single fluorescent molecules is real or not. Also, evidence of single molecule tracking using a single QD is obtained from an antibunching measurement. Indeed, several studies have confirmed that antibunching was observed in single QDs [44-49]. Very recently, antibunching was detected from a single QD that was excited by a multiphoton excitation wavelength (two photon excitation) (Fig. 2) [50]. The multiphoton excitation of QDs has advantages for single molecule tracking. For instance, the excitation wavelength (e.g. using an 800 nm wavelength amplified by Ti:sapphire laser) attains deep tissue penetration, where the light in the range of the so called “transparent window” (700-900 nm) is absorbed less by water and tissues in the in vivo environment. This enables deep tissue imaging with low photodamage to cells, and is thus suitable for long-term tracking studies. Therefore, single QDs excited by the multiphoton excitation wavelength are strong candidates for imaging by single molecule tracking in the near future.
Measurement of QD antibunching. (a) Photoluminescence intensity image of quantum dots via two-photon excitation at room temperature (scale bar 1 μm); (b) corresponding photoluminescence life time information image; and (c) coincidence measurement of PL photon pairs of a single quantum dot (arrow in (a)). Reprinted figure with permission from Matthias D. Wissert, Birgit Rudat, Uli Lemmer, and Hans-Jürgen Eisler, Quantum dots as single-photon sources: Antibunching via two-photon excitation, Fig. 3, Physical Review B Vol 83, 113304 (2011). Copyright (2011) by the American Physical Society. http://link.aps.org/doi/10.1103/PhysRevB.83.113304. Readers may view, browse, and/or download material for temporary copying purposes only, provided these uses are for noncommercial personal purposes. Except as provided by law, this material may not be further reproduced, distributed, transmitted, modified, adapted, performed, displayed, published, or sold in whole or part, without prior written permission from the American Physical Society.
In the following sections, we will describe the measurement and analysis techniques used in single QD-based single molecule tracking.
5. Measurement techniques for single molecule tracking
Many current bioimaging technologies have been developed using GFP. GFP enables real-time observation of the movements of proteins in cells. In particular, endocytosis, endosome tracking and various infective processes have been revealed by means of single molecule measurement techniques using scanning near-field optical microscopy [51-52]. Recently, because GFP has weak fluorescence and a short fluorescent lifetime (a few seconds to tens of seconds), QDs have begun to replace GFP. Compared with GFP, QDs have ~10-100 times higher fluorescence than GFP, and are ~100-1000 times more stable against photobleaching [53].
For single molecule tracking, three-dimensional (3D) observation of proteins is both important and necessary to enable a precise understanding of their movements. However, conventional microscopic observations only obtain two-dimensional (2D) information. To overcome this problem, the superposition of 2D pictures obtained by confocal microscopy has been used to reconstruct 3D images. However, the low resolution time (a few seconds) of conventional microscopy makes it difficult to reveal protein movements that occur within the order of milliseconds. Tracking the movements of single molecules through three dimensions presents a difficult and, until recently, unsolved technical problem [45, 54-60].
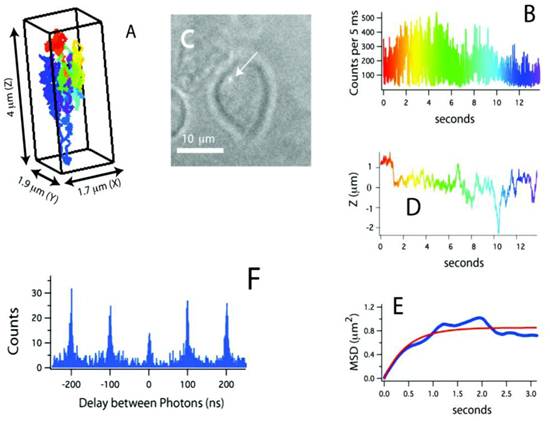
Recently, a method for tracking single proteins labeled with a single QD in living cells was reported, where the 3D molecular movements were followed by active feedback once every 5 ms by using four overlapping confocal volume elements (Fig. 3) [61]. This method has several advantages compared to conventional 3D molecular tracking methods based upon charge-coupled device cameras, including increased Z-tracking range (ca. 10 μm), substantially lower excitation energy (ca. 15 μW), and the ability to perform time-resolved spectroscopy (e.g. fluorescence correlation spectroscopy or fluorescence lifetime measurements) on the molecules being tracked. In particular, fluorescence photon antibunching from the individual QD-labeled proteins in living cells was successfully demonstrated, which showed the tracking of an individual dye-labeled nucleotide (Cy5-dUTP) at biologically relevant transport rates. The trajectories of receptors on the cell membrane revealed the three-dimensional and nanoscale features of cell surface topology. During the later stages of the signal transduction cascade, assembles of QD labeled IgE-FcεRI were captured in the course of ligand-meditated endocytosis and were tracked during vesicular transit through the cell at the rapid speed of ~950 nm/s. In addition to the substantial kinetic data obtained from these three-dimensional trajectories, the individual photon arrival time was recorded with about 400 ps accuracy, thus enabling the implementation of a number of time-resolved analysis methods impossible with camera-based tracking methods.
(A) Three-dimensional trajectory of a single QD-labeled IgE-FcεRI on an unstimulated mast cell at 37˚C. A rainbow color scheme is used to denote the passage of time. (B) Counts used for 3D tracking and feedback. (C) CCD image showing the receptor location relative to the mast cell (arrow points to the QD). (D) Z-position of this receptor, showing over 4 μm of Z-motion that would be missed in CCD-based tracking methods. (E) Mean-squared displacement (blue) and fit (red). The motion is highly compartmentalized. (F) Photon pair correlation measurement derived from this ~14 s long trajectory that shows fluorescence photon antibunching. Reprinted with permission from Nathan P. Wells, Guillaume A. Lessard, Peter M. Goodwin, Mary E. Phipps, Patrick J. Cutler, Diane S. Lidke, Bridget S. Wilson, and James H. Werner, Fig.3, Nano Letters Vol 10, 4732-4737 (2010). Copyright (2010) American Chemical Society.
6. Analysis of single QD tracking data
Single molecule experiments suffer from a lack of statistical data, and single molecule tracking in the cell is no exception. It is necessary to identify the appropriate parameters required to automatically classify and analyze the data. As a result, various analytical techniques have been developed to extract meaningful properties from the trajectories of single molecules. Generally, computing the mean square displacement (MSD) as a function of time can rapidly determine the model of motion and yields associated parameters (diffusion coefficient, transport velocity, size of confinement domains, etc) [4-5, 62-63]. However, this method only gives the averaged motion parameters of the whole trajectory. Thus, MSD analysis might be inadequate to describe transient behaviors when a molecule dynamically interacts with specific molecular partners or directly with its environment. Therefore, it is important to determine how precisely single particle tracking can be performed, and what information can be obtained from the data and how accurately, remain active research topics. Michalet et al used MSD analysis to study simple Brownian diffusion in an isotropic medium [64]. The ability of MSD analysis to extract reliable diffusion coefficient (D) values for a single particle with Brownian motion in an isotropic medium was confirmed, even though its precise localization was uncertain. As a result of simulation-supported theoretical analysis, a simple unweighted least-squares fit of the MSD curve provided the best estimation of the D value, thus enabling an optimal number of MSD points to be used for the fitting.
An alternative approach using image correlation spectroscopy was demonstrated, which did not rely on the formation and analysis of individual trajectories [65]. This method is quicker, but potentially less informative because only the population-average values of the kinetic parameters (diffusion coefficient, velocity and others) are obtained.
Furthermore, in long duration QD tracking experiments, very rare events in the tracks must be spotted from thousands of frames. The increasing amount of data and the low probability of spotting rare events necessitate the development of adapted tools to classify the trajectories. Therefore, finding the right thresholds and the right parameters to discriminate between the physics of the different trajectories are important. These include the time dependent diffusion coefficient, deviation from linearity in the MSD, and asymmetry of the trajectory [66-67].
7. Applications of single molecule tracking in living cells
The direct observation of the movements of individual biological molecules can transform our understanding of important biophysical and cellular processes. For instance, single molecule tracking has enabled an understanding of cellular membrane dynamics [10, 68-69], gene regulation [70], and motor protein kinetics [71-72]. In particular, revealing the activation of molecules and proteins on the membrane is very important in relation to cell signaling. QDs give a reasonable compromise between large beads and small fluorophores for the tracking of single molecules in living cells, and QDs will be useful tools for ultrasensitive studies of the dynamics of cellular processes.
The technical difficulty of QDs diffusing through membranes and into the cytosol is a general concern. QDs can be delivered into the cytosol by physical delivery techniques such as microinjection [73-74] and electroporation [73, 75]. It is difficult to deliver QDs to a number of cells at the same time using microinjection, which is more suited to specifically targeting individual cells. However, microinjection is unique in being able to deliver the QDs directly into nuclei [76]. In the following sections, several interesting topics that demonstrate the attractiveness of single QD-based single molecule tracking, such as membrane dynamics, neuronal function, selective transport mechanisms of the nuclear pore complex, and in vivo real time observation, are introduced.
Membrane dynamics
Recent research developments have required us to revise the classical fluid mosaic model of the plasma membrane proposed by Singer and Nicholoson more than 35 years ago [77]. In particular, it is now known that lipids and proteins diffuse heterogeneously in plasma membranes. A current challenge for cell signaling and its regulation is understanding how the structural organization of plasma membranes affects individual proteins.
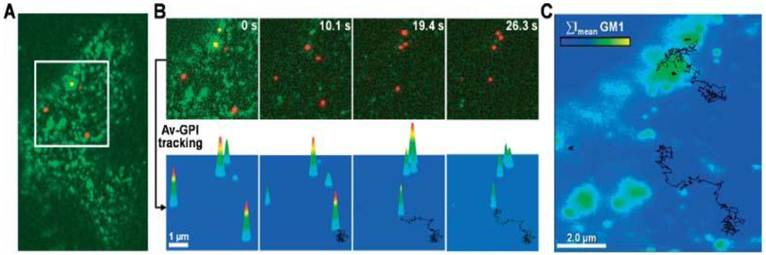
Pinaud et al demonstrated that QD labeling enabled the high resolution and long-term tracking of individual glycosyl-phosphatidyl-inositol anchored avidin test probes (Av-GPI) and their various diffusion behaviors [11]. It was revealed that cholesterol-/sphingolipid-rich microdomains can segment the diffusion of GPI-anchored proteins in living cells, and the dynamic partitioning raft model can precisely describe the diffusive behavior of some raft-associated proteins across the plasma membrane (Fig. 4).
Single QD tracking of Av-GPI by total internal reflection fluorescence (TIRF) microscopy. (A) First frame from a dual-color TIRF movie of a HeLa cell. Av-GPIs in the ventral plasma membrane are labeled with QDs (red) and GM1 molecules are labeled with Alexa-488 CT×B (green). (B) Selected frames from a region of interest (white square in (A)) in which diffusing Av-GPIs are tracked. Diffusion trajectories are determined by the series of fitted positions, connected by a straight line. Notice that Alexa-488 CT×B bleaches fast compared to QDs and the signal was nearly completely lost after 10 s. To facilitate visualization, the QD point-spread-function size was intentionally expanded. Tracking was performed on raw images. (C) Overlay of Av-GPI trajectories with the mean intensity projection image (ΣImean) for the Alexa-488 CT×B channel. This approach allows colocalization studies of Av-GPIs within fixed/slow diffusing GM1-rich domains despite the fast photobleaching of Alexa-488 CT×B. Reprinted with permission from Fabien Pinaud, Xavier Michalet, Gopal Iyer, Emmanuel Margeat, Hsiao-Ping Moore, and Shimon Weiss, Fig.2, Traffic Vol 10, 691-712 (2009). Copyright (2009) John Wiley and Sons.
Another example involves G protein-coupled receptors (GPCRs). GPCRs are the largest protein superfamily in the human genome, comprising 30% of recent drug targets, and they regulate several cellular signaling responses [78]. However, it is very difficult to research the function of GPCRs because it is impossible to distinguish among the trafficking of many individual receptors at the same time in multiple endosomal pathways. Therefore, single molecule imaging of endosomal trafficking enables cellular signaling to be understood, and provides powerful tools for revealing the movements of GPCR targeted therapeutics.
Accurate measurement of the endosomal trafficking and internalization of serotonin (5-hydroxytryptamine, 5-HT) receptors was achieved by using single QD probes and quantitative localization [79]. These results emphasize the future importance of determining the downstream effectors within cells that mediate cell signaling and guide receptor fate. QDs present attractive opportunities for investigating the role of such effectors in receptor regulation. Such single molecule studies of endosomal GPCR tracking will provide unique insights into how receptor targeted therapeutics regulate cellular signaling.
Regarding G protein-coupled receptors [80-81], adenosine-5'-triphosphate (ATP) signaling acts through the membrane-bound purinergic receptor (P2Y). ATP, which is the universal fuel inside cells, also plays a critical role as a singling molecule in a spectrum of cellular functions, including hormone secretion, neurotransmission, proliferation, differentiation, and apoptosis [82]. The physiology of ATP receptors is not fully understood, despite their increased importance in cell biology and disease mechanisms such as inflammation, cardiovascular disease and pain. ATP-conjugated quantum dots (QDATP) were used to specifically and readily label ATP receptors on living neuroendocrine PC12 cells, thus enabling their characterization [83]. This was the first study in which dynamic data on P2Y receptor trafficking with sub-second resolution, in the context of neuronal differentiation and apoptosis, had been obtained. This study demonstrates the potential of QDs as a novel tool to study the physiology of P2Y receptors in relation to various critical diseases and cellular functions.
Application of QDs in neuroscience
In the neuroscience field, the issue of lateral mobility of neurotransmitter receptors has become central to understanding the development and plasticity of synapses. Therefore, the membrane dynamics of glycine receptors have been investigated in transfected neurons by using latex beads. However, because these measurements use beads with 500 nm in size, the analysis of receptor dynamics in the synaptic cleft is restricted [5]. Single QD tracking has successfully allowed the direct measurement of the mobility and entry-exit kinetics of a variety of neuroreceptors in synapses [10]. For example, the peculiarity of QDs enables the recording of individual molecule mobility at the neuron surface, even in confined cellular compartments. The QDs were used to track individual GlyRs and to analyze their lateral dynamics in the membrane of living neurons for periods ranging from milliseconds to minutes. The direct measurement of the mobility and entry-exit kinetics at synapses for several neuroreceptors [84] including NMDA [85], AMPA [86-87], glycine [10, 88-89], cannabinoid [90], GABA [89], and acetyl choline receptors [91] has been reported.
An alternative example of the use of QDs in neuroscience involves their contribution to revealing intractable disease mechanisms in ophthalmology. Coupling QDs to antibodies that recognize molecules associated with age-related macular degeneration (AMD)-induced changes in the Bruch membrane [92-93] might provide a means to image the biochemical and/or structural abnormalities associated with AMD [94]. This data is not obtained at the single molecule tracking level; however, this approach may be crucial for the development of AMD treatments that target early molecular changes and early stages of the disease. Therefore, AMD and other intractable ophthalmology diseases will benefit from QD-based technologies, particularly at the single molecule tracking level, in the near feature.
Characterization of the nuclear pore complex
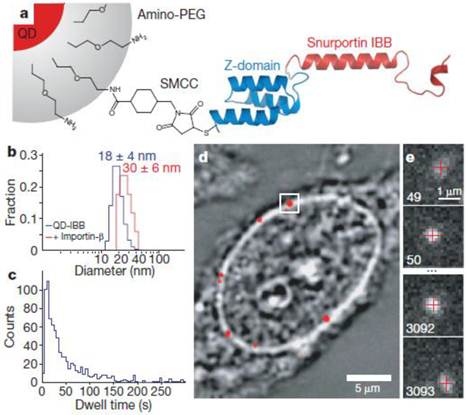
In an exciting recent development, QDs enabled tracking measurements across the nuclear membrane via nuclear pore complexes to be obtained (Fig. 5) [95]. In the cell, proteins required by the nucleus need to be transported through the nuclear membrane in a highly selective manner. The cargo is covered with a class of proteins, the importins/karyopherins, which interact with a steep gradient of RanGTP (a GTPase) across the nuclear envelope to allow passage through the membrane. The diffusive trajectories of importin-coated QDs through the nuclear pore were reported. As a result, it was revealed that cytoplasmic filaments increased the capture area for transport-competent cargoes, although lengthy cytoplasmic docking is not essential. The cargoes encounter size-selective barriers inside the channel; that is, the transport-competent cargos diffuse extraordinarily within the central channels, with more free diffusion of cargoes at higher receptor density, and the central channel is functionally asymmetric. In another example, mRNAs tagged with QDs were microinjected into the nucleus to study their anomalous diffusion through a physical barrier to study protein-DNA interactions in living cells [76].
Experimental design. (a) Diagram of a QD-based cargo. The snurportin-1 importin-β binding (IBB) /Z-domain fusion protein is coupled via a bifunctional succinimidyl-4-(N-maleimidomethyl)cyclohexane-1-carboxylate crosslinker (SMCC) to the amino-PEG polymer coat of a fluorescent QD. The three helix Z-domain acts as a spacer to correctly present the importin-β binding for biological function. Not to scale. (b) Dynamic light scattering size distributions of QD- IBB cargos in the presence and absence of IBB. (c) Dwell time distribution of all QD interactions with the nuclear pore complex. The time axis is truncated at 300 s. (d) Bright-field image of a nucleus with a QD fluorescence image (with background subtraction applied) overlaid in red. A single QD cargo at the nuclear envelope is boxed. (e) Individual consecutive frames from a single-molecule experiment showing the arrival (first frame) from the cytoplasm and departure (final frame) of the cargo into the nucleus. The centroids determined from fitting of the PSF (point spread function) are overlaid as red crosses. Frame numbers are in the bottom left hand corner of each frame. Movies were captured at 40 Hz. Reprinted with permission from Alan R. Lowe, Jake J. Siegel, Petr Kalab, Merek Siu, Karsten Weis, and Jan T. Liphardt, Fig.1, Nature Vol 467, 600-603 (2010). Copyright (2010) Nature Publishing Group. http://www.nature.com/nature/journal/v467/n7315/full/nature09285.html.
In vivo real-time tracking of single quantum dots
Quantitative analysis relating to the dynamics of nanoparticle delivery in vivo is very important to the development of more efficient drug delivery systems. Until recently, the specific processes of nanoparticle delivery in vivo post-injection had not been revealed at the single particle level. To address this issue, QD-based real-time tracking of single particles was used for the study of a drug delivery system [96]. The specific delivery of single QD-complexes to the perinuclear region of cancer cells following their injection into the tail vein of living mice was successfully demonstrated. The in vivo QD imaging system enables single particle tracking with a 30 nm high resolution video rate. Additionally, quantitative and qualitative information relating to the velocity, directionality, and transportation mode of nanoparticles is available from time-resolved tracking. Therefore, this method may provide new insight into the behavior of particles in complex biological environments, and in turn will enable rational progress in particle design to increase the therapeutic index of nanocarriers that target tumors.
8. Challenges and prospects
Overcoming the toxicity and blinking problems associated with QDs
Despite the many advantages of QDs described above, they have several disadvantages that restrict their widespread use. The major concerns of the potential toxicity of II-IV QDs restrict their practical use in biological and medical applications. Certainly, several studies have reported that charge, size, coating ligands, and oxidative, photolytic and mechanical stability can contribute to the cytotoxicity of cadmium-containing QDs [97-104]. Another critical factor that determines the cytotoxicity of QDs is the leakage of heavy metal ions from the core that is caused by photolysis and oxidation. [97, 100]. To overcome the potential toxicities of QDs caused by cadmium, several approaches have been implemented. Although covering the CdSe or CdTe core with a shell layer such as ZnS reduced the cadmium toxicity, the reduction is not yet sufficient. Su et al reported that covering the CdTe core with both CdS and ZnS shell layers (i.e. core-shell-shell structure) reduced the toxicity of QDs, resulting in improved cell viability at high concentrations of QDs during long-term culture of several cell lines in vitro [105]. Alternatively, silica coating of QDs was successful in reducing the toxicity of cadmium [106]. Recently, cadmium-free InP and CuInS2 have become attractive candidates for non-toxic QDs [17, 107-109]. Even though some remarkable progress to overcome the toxicity problems of QDs has been made, there remains no perfect solution for all QDs. This is because a wide range of QDs are made by differing methods, and are used in a variety of cell systems, models and animals. Therefore, it is difficult to evaluate the toxicity of QDs at the universal level. However, continued development of approaches such as coating and the use of cadmium-free compounds should overcome the problems of QD toxicity.
Another problem of using QDs for single molecule imaging is their blinking phenomenon [110-114]. The photoluminescence from individual QDs is defined by the large intensity fluctuations known as blinking, whereby their photoluminescence repeats on and off intermittently, even with successive photoexcitation. Blinking is thought to be an inescapable property of individual QD fluorescence. The high efficiency of non-radiative recombination processes (e.g. Auger ionization) between the extra charge and a subsequently excited electron-hole pair can produce a charged QD whose photoluminescence is temporarily quenched, and which recovers only after the QD becomes neutralized again. The theoretical origins of blinking remain equivocal, and many research models attribute the charging of QDs to their off-state. This blinking phenomenon of individual QDs is not suitable for single molecule tracking. The blinking phenomenon continues from a few milliseconds to several hours [115]. During this period, one will lose the trajectory of QD-based single molecule movements.
To overcome these problems, the suppression of blinking was recently demonstrated by passivation of the surface of QDs with thiol moieties, whereby an emission duty cycle of nearly 100% maintained their biocompatibility. However, the use of thiol in biological systems is not ideal because of its toxicity [116]. Numerous reports agree with the opinion that the accurate control of the inorganic shell will greatly suppress the blinking of QDs. The critical steps to reduce the blinking are to create very thick shells of CdS or CdZnS approaching 20 monolayers, and to reduce the lattice mismatch between the CdSe core and the shell materials [117-119]. This results in fewer charge carrier trap states and limits blinking. Although the blinking probability can be decreased by these approaches, the disadvantage of using this type of single quantum dot tracking is that the final diameter of the inorganic material is 15-20 nm. Such larger-sized QD particles are not suitable for single molecule imaging because of steric hindrance, and the reduced diffusion velocity caused by the QD may affect the intrinsic activation of proteins and molecules in vivo. Recently however, completely non-blinking CdSe-ZnSe QDs with a size of 8 nm were reported, where Zn was gradually alloyed into the core [120]. The small size of these QDs is suitable for single molecule tracking. However, these non-blinking QDs have multi-emission peaks, thus the multicolor imaging experiments may be restricted; in other words, the advantages of QDs with narrow emission spectra may be lost. Nevertheless, this new type of QD represents an attractive option for single QD tracking because it would no longer be necessary to account for blinking during image processing and analysis.
Prospects for single molecule tracking using advanced probes
It was reported recently that heavily doped semiconductor nanocrystal quantum dots were successfully synthesized [121-122]. The method to dope semiconductor nanocrystals with metal impurities enabled control of the band gap and Fermi energy, which enhances their performance in electronic devices. The yielded n- and p-doped semiconductor nanocrystals may now potentially be applied in solar cells, thin-film transistors and optoelectronic devices. They may also be applied as effective single molecule tracking tools in the near future.
Recently, silicon QDs have also attracted considerable attention [123-126]. The main advantages of silicon QDs are low toxicity compared with cadmium-based QDs, and full color with water dispersion. Furthermore, two-photon excitation emission in the aqueous phase, and three-photon excitation emission in the chloroform phase, were successfully observed in silicon QDs [127]. Because silicon QD-based cell imaging has already been reported, safe and effective single molecule tracking using single QDs in vivo is likely to be described in the near future. Additionally, InP and CuInS2 are promising candidate for imaging because they possess several advantageous properties required by bioimaging probes [17, 107-109]. One advantage is the absence of toxic elements such as cadmium, lead, mercury, tellurium, and arsenic. The other advantage regards photoluminescence, in that InP and CuInS2 emit from the visible to near-infrared (NIR) region, with high quantum yield. Bioconjugated InP and CuInS2 that emit at multiphoton excitation (two-photon) wavelengths have already been reported, which will enable deep tissue imaging because of the long wavelength. Bioconjugated InP- and CuInS2 -based QDs are acceptable for single molecule tracking in the near future.
In addition to QDs, organic nanocrystals have also successfully demonstrated their usefulness in both in vitro live cell imaging [128] and in vivo drug delivery systems [129]. Organic nanocrystals are between the size ranges of molecular and bulk crystals (ca. 100 nm), and have unique size-dependent optical properties [130]. This size range is one order of magnitude compared to QDs, where the so-called quantum size confinement effect is observed (2-10 nm). Antibunching was observed in single fluorescent organic nanocrystals [131]. This suggests that single molecule tracking using organic nanocrystals will be demonstrated in the near future, if the organic nanocrystals have the requisite particle size (2-5 nm) and high fluorescence intensity for single molecule tracking in vitro and in vivo.
It was recently reported that nanodiamonds with nitrogen vacancy centers were found to be highly photoluminescent while exhibiting no photobleaching and photoblinking [132-133]. As such, nanodiamonds may be useful as imaging probes for super-resolution optical microscopy. Antibunching and multiphoton excitation emission were demonstrated for nanodiamonds. The smallest nanodiamond particle size is 5 nm [134], and unlike semiconductor QDs they do not present heavy metal ion toxicity. The surface modification of nanodiamonds will allow single molecule tracking by the binding of a single diamond nanocrystal. Therefore, single molecule imaging techniques using nanodiamonds will be developed together with QD techniques.
9. Conclusion
In this review, we have introduced single quantum dot-based single molecule tracking. First, the physicochemical properties of QDs were discussed. QDs have several properties that enable long-lasting single molecule tracking in living cells. We have discussed several examples of how QDs have been used to effectively reveal single molecule tracking in membrane dynamics, neuronal function, selective transport mechanisms of the nuclear pore complex, and in vivo real-time observation. We also briefly discussed the prospects for single molecule tracking using advanced probes. Continued development of the physicochemical properties of QDs, together with imaging techniques and data analysis methods, will provide much insight into the dynamics of molecular processes in live cells. QDs will thus play a key role in the future of cell biology research.
Acknowledgements
This study was partially supported by Health and Labour Science Research Grants for Research on Intractable Diseases from the Ministry of Health, Labour and Welfare of Japan, and a Challenging Exploratory Research (No. 23650287) from the Japan Society for the Promotion of Science.
Competing Interests
The authors have declared that no competing interest exists.
References
1. Li GW, Xie XS. Central dogma at the single-molecule level in living cells. Nature. 2011;475:308-15
2. Joo C, Balci H, Ishitsuka Y, Buranachai C, Ha T. Advances in single-molecule fluorescence methods for molecular biology. Annu Rev Biochem. 2008;77:51-76
3. Weiss S. Fluorescence spectroscopy of single biomolecules. Science. 1999;283:1676-83
4. Wieser S, Schütz GJ. Tracking single molecules in the live cell plasma membrane-Do's and Don't's. Methods. 2008;46:131-40
5. Saxton MJ, Jacobson K. Single-particle tracking: applications to membrane dynamics. Annu Rev Biophys Biomol Struct. 1997;26:373-99
6. Shera EB, Seitzinger NK, Davis LM, Keller RA, Soper SA. Detection of single fluorescent molecules. Chem Phys Lett. 1990;174:553-7
7. Chalfie M, Tu Y, Euskirchen G, Ward WW, Prasher DC. Green fluorescent protein as a marker for gene expression. Science. 1994;263:802-5
8. Shimomura O, Johnson FH, Saiga Y. Extraction, purification and properties of aequorin, a bioluminescent protein from the luminous hydromedusan, Aequorea. J Cell Comp Physiol. 1962;59:223-39
9. Heim R, Prasher DC, Tsien RY. Wavelength mutations and posttranslational autoxidation of green fluorescent protein. Proc Natl Acad Sci U S A. 1994;91:12501-4
10. Dahan M, Levi S, Luccardini C, Rostaing P, Riveau B, Triller A. Diffusion dynamics of glycine receptors revealed by single-quantum dot tracking. Science. 2003;302:442-5
11. Pinaud F, Michalet X, Iyer G, Margeat E, Moore HP, Weiss S. Dynamic partitioning of a glycosyl-phosphatidylinositol-anchored protein in glycosphingolipid-rich microdomains imaged by single-quantum dot tracking. Traffic. 2009;10:691-712
12. Jin S, Hu YX, Gu ZJ, Liu L, Wu HC. Application of quantum dots in biological imaging. J Nanomater. 2011:834139
13. Smith AM, Dave S, Nie SM, True L, Gao XH. Multicolor quantum dots for molecular diagnostics of cancer. Expert Rev Mol Diagn. 2006;6:231-44
14. Xing Y, Chaudry Q, Shen C, Kong KY, Zhau HE, Chung LW. et al. Bioconjugated quantum dots for multiplexed and quantitative immunohistochemistry. Nat Protoc. 2007;2:1152-65
15. Yezhelyev MV, Al-Hajj A, Morris C, Marcus AI, Liu T, Lewis M. et al. In situ molecular profiling of breast cancer biomarkers with multicolor quantum dots. Adv Mater. 2007;19:3146-51
16. Gao X, Cui Y, Levenson RM, Chung LW, Nie S. In vivo cancer targeting and imaging with semiconductor quantum dots. Nat Biotechnol. 2004;22:969-76
17. Bharali DJ, Lucey DW, Jayakumar H, Pudavar HE, Prasad PN. Folate-receptor-mediated delivery of InP quantum dots for bioimaging using confocal and two-photon microscopy. J Am Chem Soc. 2005;127:11364-71
18. Stroh M, Zimmer JP, Duda DG, Levchenko TS, Cohen KS, Brown EB. et al. Quantum dots spectrally distinguish multiple species within the tumor milieu in vivo. Nat Med. 2005;11:678-82
19. Voura EB, Jaiswal JK, Mattoussi H, Simon SM. Tracking metastatic tumor cell extravasation with quantum dot nanocrystals and fluorescence emission-scanning microscopy. Nat Med. 2004;10:993-8
20. Lei Y, Tang H, Yao L, Yu R, Feng M, Zou B. Applications of mesenchymal stem cells labeled with Tat peptide conjugated quantum dots to cell tracking in mouse body. Bioconjug Chem. 2008;19:421-7
21. Schroeder T. Imaging stem-cell-driven regeneration in mammals. Nature. 2008;453:345-51
22. Slotkin JR, Chakrabarti L, Dai HN, Carney RS, Hirata T, Bregman BS. et al. In vivo quantum dot labeling of mammalian stem and progenitor cells. Dev Dyn. 2007;236:3393-401
23. de la Zerda A, Gambhir SS. Drug delivery: keeping tabs on nanocarriers. Nat Nanotechnol. 2007;2:745-6
24. Medintz IL, Pons T, Delehanty JB, Susumu K, Brunel FM, Dawson PE. et al. Intracellular delivery of quantum dot-protein cargos mediated by cell penetrating peptides. Bioconjug Chem. 2008;19:1785-95
25. Derfus AM, Chen AA, Min DH, Ruoslahti E, Bhatia SN. Targeted quantum dot conjugates for siRNA delivery. Bioconjug Chem. 2007;18:1391-6
26. Chan WC, Maxwell DJ, Gao X, Bailey RE, Han M, Nie S. Luminescent quantum dots for multiplexed biological detection and imaging. Curr Opin Biotechnol. 2002;13:40-6
27. Empedocles S, Bawendi M. Spectroscopy of single CdSe nanocrystallites. Accounts Chem Res. 1999;32:389-96
28. Michalet X, Pinaud FF, Bentolila LA, Tsay JM, Doose S, Li JJ. et al. Quantum dots for live cells, in vivo imaging, and diagnostics. Science. 2005;307:538-44
29. Chan WC, Nie S. Quantum dot bioconjugates for ultrasensitive nonisotopic detection. Science. 1998;281:2016-8
30. Maenosono S. Core/shell quantum dots adapting to biological applications (translated title from Japanese). In: (ed.) Yamamoto S. Application of Quantum Dot in Life Science, 1 st ed. Tokyo: CMC International Co, Ltd. 2007:15-26
31. Nirmal M, Brus L. Luminescence photophysics in semiconductor nanocrystals. Acc Chem Res. 1999;32:407-14
32. Alivisatos P. The use of nanocrystals in biological detection. Nat Biotechnol. 2004;22:47-52
33. Murphy CJ. Optical sensing with quantum dots. Anal Chem. 2002;74:520A-6A
34. Murray CB, Norris DJ, Bawendi MG. Synthesis and characterization of nearly monodisperse Cde (E = S, Se, Te) semiconductor nanocrystallites. J Am Chem Soc. 1993;115:8706-15
35. Rajh T, Micic OI, Nozik AJ. Synthesis and characterization of surface-modified colloidal cadmium telluride quantum dots. J Phys Chem. 1993;97:11999-2003
36. Wang Y, Chen L. Quantum dots, lighting up the research and development of nanomedicine. Nanomedicine. 2011;7:385-402
37. Law WC, Yong KT, Roy I, Ding H, Hu R, Zhao W. et al. Aqueous-phase synthesis of highly luminescent CdTe/ZnTe core/shell quantum dots optimized for targeted bioimaging. Small. 2009;5:1302-10
38. Bruchez Jr M, Moronne M, Gin P, Weiss S, Alivisatos AP. Semiconductor nanocrystals as fluorescent biological labels. Science. 1998;281:2013-6
39. Biju V, Itoh T, Ishikawa M. Delivering quantum dots to cells: bioconjugated quantum dots for targeted and nonspecific extracellular and intracellular imaging. Chem Soc Rev. 2010;39:3031-56
40. Erathodiyil N, Ying JY. Functionalization of inorganic nanoparticles for bioimaging applications. Acc Chem Res. 2011;44:925-35
41. Medintz IL, Uyeda HT, Goldman ER, Mattoussi H. Quantum dot bioconjugates for imaging, labelling and sensing. Nat Mater. 2005;4:435-46
42. Biju V, Itoh T, Anas A, Sujith A, Ishikawa M. Semiconductor quantum dots and metal nanoparticles: syntheses, optical properties, and biological applications. Anal Bioanal Chem. 2008;391:2469-95
43. Oh EJ, Park K, Kim KS, Kim J, Yang JA, Kong JH. et al. Target specific and long-acting delivery of protein, peptide, and nucleotide therapeutics using hyaluronic acid derivatives. J Control Release. 2010;141:2-12
44. Fore S, Laurence TA, Hollars CW, Huser T. Counting constituents in molecular complexes by fluorescence photon antibunching. Ieee J Sel Top Quant. 2007;13:996-1005
45. McHale K, Berglund AJ, Mabuchi H. Quantum dot photon statistics measured by three-dimensional particle tracking. Nano Lett. 2007;7:3535-39
46. Lounis B, Bechtel HA, Gerion D, Alivisatos P, Moerner WE. Photon antibunching in single CdSe/ZnS quantum dot fuorescence. Chem Phys Lett. 2000;329:399-404
47. Zwiller V, Blom H, Jonsson P, Panev N, Jeppesen S, Tsegaye T. et al. Single quantum dots emit single photons at a time: antibunching experiments. Appl Phys Lett. 2001;78:2476-8
48. Nathan P. Wells NP, Lessard GA, Werner JH. Confocal, three-dimensional tracking of individual quantum dots in high-background environments. Anal Chem. 2008;80:9830-34
49. Yuan CT, Yu P, Ko HC, Huang J, Tang J. Antibunching single-photon emission and blinking suppression of CdSe/ZnS quantum dots. ACS NANO. 2009;3:3051-56
50. Wissert MD, Rudat B, Lemmer U, Eisler HJ. Quantum dots as single-photon sources: Antibunching via two-photon excitation. Phys Rev B. 2011;83:113304
51. de Lange F, Cambi A, Huijbens R, de Bakker B, Rensen W, Garcia-Parajo M. et al. Cell biology beyond the diffraction limit: near-field scanning optical microscopy. J Cell Sci. 2001;114:4153-60
52. Sako Y, Yanagida T. Single-molecule visualization in cell biology. Nat Rev Mol Cell Bio. 2003:SS1-SS5
53. Ho YP, Leong KW. Quantum dot-based theranostics. Nanoscale. 2010;2:60-8
54. Cang H, Xu CS, Montiel D, Yang H. Guiding a confocal microscope by single fluorescent nanoparticles. Opt Lett. 2007;32:2729-31
55. Holtzer L, Meckel T, Schmidt T. Nanometric three-dimensional tracking of individual quantum dots in cells. Appl Phys Lett. 2007;90:053902
56. Lessard GA, Goodwin PM, Werner JH. Three-dimensional tracking of individual quantum dots. Appl Phys Lett. 2007;91:224106
57. Ram S, Prabhat P, Chao J, Ward ES, Ober RJ. High accuracy 3D quantum dot tracking with multifocal plane microscopy for the study of fast intracellular dynamics in live cells. Biophys J. 2008;95:6025-43
58. Thompson MA, Lew MD, Badieirostami M, Moerner WE. Localizing and tracking single nanoscale emitters in three dimensions with high spatiotemporal resolution using a double-helix point spread function. Nano Lett. 2010;10:211-8
59. Toprak E, Balci H, Blehm BH, Selvin PR. Three-dimensional particle tracking via bifocal imaging. Nano Lett. 2007;7:2043-5
60. Wells NP, Lessard GA, Werner JH. Confocal, three-dimensional tracking of individual quantum dots in high-background environments. Anal Chem. 2008;80:9830-4
61. Wells NP, Lessard GA, Goodwin PM, Phipps ME, Cutler PJ, Lidke DS. et al. Time-resolved three-dimensional molecular tracking in live cells. Nano Lett. 2010;10:4732-7
62. Qian H, Sheetz MP, Elson EL. Single particle tracking. Analysis of diffusion and flow in two-dimensional systems. Biophys J. 1991;60:910-21
63. Pinaud F, Clarke S, Sittner A, Dahan M. Probing cellular events, one quantum dot at a time. Nat Methods. 2010;7:275-85
64. Michalet X. Mean square displacement analysis of single-particle trajectories with localization error: brownian motion in an isotropic medium. Phys Rev E Stat Nonlin Soft Matter Phys. 2010;82:041914
65. Durisic N, Bachir AI, Kolin DL, Hebert B, Lagerholm BC, Grutter P. et al. Detection and correction of blinking bias in image correlation transport measurements of quantum dot tagged macromolecules. Biophys J. 2007;93:1338-46
66. Huet S, Karatekin E, Tran VS, Fanget I, Cribier S, Henry JP. Analysis of transient behavior in complex trajectories: application to secretory vesicle dynamics. Biophys J. 2006;91:3542-59
67. Pierobon P, Cappello G. Quantum dots to tail single bio-molecules inside living cells. Adv Drug Deliver Rev. 2012;64:167-78
68. Fujiwara T, Ritchie K, Murakoshi H, Jacobson K, Kusumi A. Phospholipids undergo hop diffusion in compartmentalized cell membrane. J Cell Biol. 2002;157:1071-81
69. Andrews NL, Lidke KA, Pfeiffer JR, Burns AR, Wilson BS, Oliver JM. et al. Actin restricts Fc epsilon RI diffusion and facilitates antigen-induced receptor immobilization. Nat Cell Biol. 2008;10:955-63
70. Elf J, Li GW, Xie XS. Probing transcription factor dynamics at the single-molecule level in a living cell. Science. 2007;316:1191-4
71. Gelles J, Schnapp BJ, Sheetz MP. Tracking kinesin-driven movements with nanometre-scale precision. Nature. 1988;331:450-3
72. Yildiz A, Forkey JN, McKinney SA, Ha T, Goldman YE, Selvin PR. Myosin V walks hand-over-hand: single fluorophore imaging with 1.5-nm localization. Science. 2003;300:2061-5
73. Derfus AM, Chan WCW, Bhatia SN. Intracellular delivery of quantum dots for live cell labeling and organelle tracking. Adv Mater. 2004;16:961-6
74. Dubertret B, Skourides P, Norris DJ, Noireaux V, Brivanlou AH, Libchaber A. In vivo imaging of quantum dots encapsulated in phospholipid micelles. Science. 2002;298:1759-62
75. Keren K, Yam PT, Kinkhabwala A, Mogilner A, Theriot JA. Intracellular fluid flow in rapidly moving cells. Nat Cell Biol. 2009;11:1219-24
76. Ishihama Y, Funatsu T. Single molecule tracking of quantum dot-labeled mRNAs in a cell nucleus. Biochem Biophys Res Commun. 2009;381:33-8
77. Singer SJ, Nicolson GL. The fluid mosaic model of the structure of cell membranes. Science. 1972;175:720-31
78. Hopkins AL, Groom CR. The druggable genome. Nat Rev Drug Discov. 2002;1:727-30
79. Fichter KM, Flajolet M, Greengard P, Vu TQ. Kinetics of G-protein-coupled receptor endosomal trafficking pathways revealed by single quantum dots. P Natl Acad Sci USA. 2010;107:18658-63
80. Hussl S, Boehm S. Functions of neuronal P2Y receptors. Pflugers Arch. 2006;452:538-51
81. Surprenant A, North RA. Signaling at purinergic P2X receptors. Annu Rev Physiol. 2009;71:333-59
82. Khakh BS. Molecular physiology of P2X receptors and ATP signalling at synapses. Nat Rev Neurosci. 2001;2:165-74
83. Jiang S, Liu A, Duan H, Soo J, Chen P. Labeling and tracking P2 purinergic receptors in living cells using ATP-conjugated quantum dots. Adv Funct Mater. 2011;21:2776-80
84. Triller A, Choquet D. New concepts in synaptic biology derived from single-molecule imaging. Neuron. 2008;59:359-74
85. Groc L, Heine M, Cousins SL, Stephenson FA, Lounis B, Cognet L. et al. NMDA receptor surface mobility depends on NR2A-2B subunits. Proc Natl Acad Sci U S A. 2006;103:18769-74
86. Heine M, Groc L, Frischknecht R, Beique JC, Lounis B, Rumbaugh G. et al. Surface mobility of postsynaptic AMPARs tunes synaptic transmission. Science. 2008;320:201-5
87. Groc L, Lafourcade M, Heine M, Renner M, Racine V, Sibarita JB. et al. Surface trafficking of neurotransmitter receptor: comparison between single-molecule/quantum dot strategies. J Neurosci. 2007;27:12433-7
88. Ehrensperger MV, Hanus C, Vannier C, Triller A, Dahan M. Multiple association states between glycine receptors and gephyrin identified by SPT analysis. Biophys J. 2007;92:3706-18
89. Levi S, Schweizer C, Bannai H, Pascual O, Charrier C, Triller A. Homeostatic regulation of synaptic GlyR numbers driven by lateral diffusion. Neuron. 2008;59:261-73
90. Mikasova L, Groc L, Choquet D, Manzoni OJ. Altered surface trafficking of presynaptic cannabinoid type 1 receptor in and out synaptic terminals parallels receptor desensitization. Proc Natl Acad Sci U S A. 2008;105:18596-601
91. Geng L, Qian YK, Madhavan R, Peng HB. Transmembrane mechanisms in the assembly of the postsynaptic apparatus at the neuromuscular junction. Chem Biol Interact. 2008;175:108-12
92. Zarbin MA, Montemagno C, Leary JF, Ritch R. Nanomedicine in ophthalmology: the new frontier. Am J Ophthalmol. 2010;150:144-62
93. Zarbin MA. Current concepts in the pathogenesis of age-related macular degeneration. Arch Ophthalmol. 2004;122:598-614
94. Takeda A, Baffi JZ, Kleinman ME, Cho WG, Nozaki M, Yamada K. et al. CCR3 is a target for age-related macular degeneration diagnosis and therapy. Nature. 2009;460:225-30
95. Lowe AR, Siegel JJ, Kalab P, Siu M, Weis K, Liphardt JT. Selectivity mechanism of the nuclear pore complex characterized by single cargo tracking. Nature. 2010;467:600-3
96. Tada H, Higuchi H, Wanatabe TM, Ohuchi N. In vivo real-time tracking of single quantum dots conjugated with monoclonal anti-HER2 antibody in tumors of mice. Cancer Research. 2007;67:1138-44
97. Bottrill M, Green M. Some aspects of quantum dot toxicity. Chem Commun. 2011;47:7039-50
98. Hoshino A, Hanada S, Yamamoto K. Toxicity of nanocrystal quantum dots: the relevance of surface modifications. Arch Toxicol. 2011;85:707-20
99. Hardman R. A toxicologic review of quantum dots: toxicity depends on physicochemical and environmental factors. Environ Health Perspect. 2006;114:165-72
100. Rzigalinski BA, Strobl JS. Cadmium-containing nanoparticles: perspectives on pharmacology and toxicology of quantum dots. Toxicol Appl Pharmacol. 2009;238:280-8
101. Fowler BA. Monitoring of human populations for early markers of cadmium toxicity: a review. Toxicol Appl Pharmacol. 2009;238:294-300
102. Derfus AM, Chan WCW, Bhatia SN. Probing the cytotoxicity of semiconductor quantum dots. Nano Lett. 2004;4:11-8
103. Lin CH, Chang LW, Chang H, Yang MH, Yang CS, Lai WH. et al. The chemical fate of the Cd/Se/Te-based quantum dot 705 in the biological system: toxicity implications. Nanotechnology. 2009;20:215101
104. Sanvicens N, Marco MP. Multifunctional nanoparticles - properties and prospects for their use in human medicine. Trends in Biotechnology. 2008;26:425-33
105. Su Y, He Y, Lu H, Sai L, Li Q, Li W. et al. The cytotoxicity of cadmium based, aqueous phase - synthesized, quantum dots and its modulation by surface coating. Biomaterials. 2009;30:19-25
106. Selvan ST, Patra PK, Ang CY, Ying JY. Synthesis of silica-coated semiconductor and magnetic quantum dots and their use in the imaging of live cells. Angew Chem Int Ed. 2007;46:2448-52
107. Tamang S, Beaune G, Texier I, Reiss P. Aqueous phase transfer of InP/ZnS nanocrystals conserving fluorescence and high colloidal stability. ACS Nano. 2011;5:9392-402
108. Yong KT, Ding H, Roy I, Law WC, Bergey EJ, Maitra A. et al. Imaging pancreatic cancer using bioconjugated InP quantum dots. ACS Nano. 2009;3:502-10
109. Yong KT, Roy I, Hu R, Ding H, Cai H, Zhu J. et al. Synthesis of ternary CuInS(2)/ZnS quantum dot bioconjugates and their applications for targeted cancer bioimaging. Integr Biol. 2010;2:121-9
110. Banin U, Bruchez M, Alivisatos AP, Ha T, Weiss S, Chemla DS. Evidence for a thermal contribution to emission intermittency in single CdSe/CdS core/shell nanocrystals. J Chem Phys. 1999;110:1195-201
111. Basche T. Fluorescence intensity fluctuations of single atoms, molecules and nanoparticles. J Lumin. 1998;76-7:263-9
112. Neuhauser RG, Shimizu KT, Woo WK, Empedocles SA, Bawendi MG. Correlation between fluorescence intermittency and spectral diffusion in single semiconductor quantum dots. Phys Rev Lett. 2000;85:3301-4
113. Sugisaki M, Ren HW, Nishi K, Masumoto Y. Fluorescence intermittency in self-assembled InP quantum dots. Phys Rev Lett. 2001;86:4883-6
114. Nirmal M, Dabbousi BO, Bawendi MG, Macklin JJ, Trautman JK, Harris TD. et al. Fluorescence intermittency in single cadmium selenide nanocrystals. Nature. 1996;383:802-4
115. Fomenko V, Nesbitt DJ. Solution control of radiative and nonradiative lifetimes: a novel contribution to quantum dot blinking suppression. Nano Lett. 2008;8:287-93
116. Hohng S, Ha T. Near-complete suppression of quantum dot blinking in ambient conditions. J Am Chem Soc. 2004;126:1324-5
117. Chen Y, Vela J, Htoon H, Casson JL, Werder DJ, Bussian DA. et al. "Giant" multishell CdSe nanocrystal quantum dots with suppressed blinking. J Am Chem Soc. 2008;130:5026-7
118. Mahler B, Spinicelli P, Buil S, Quelin X, Hermier JP, Dubertret B. Towards non-blinking colloidal quantum dots. Nat Mater. 2008;7:659-64
119. Vela J, Htoon H, Chen Y, Park YS, Ghosh Y, Goodwin PM. et al. Effect of shell thickness and composition on blinking suppression and the blinking mechanism in 'giant' CdSe/CdS nanocrystal quantum dots. J Biophotonics. 2010;3:706-17
120. Wang X, Ren X, Kahen K, Hahn MA, Rajeswaran M, Maccagnano-Zacher S. et al. Non-blinking semiconductor nanocrystals. Nature. 2009;459:686-9
121. Cao YC. Impurities enhance semiconductor nanocrystal performance. Science. 2011;332:48-9
122. Mocatta D, Cohen G, Schattner J, Millo O, Rabani E, Banin U. Heavily doped semiconductor nanocrystal quantum dots. Science. 2011;332:77-81
123. Choi J, Wang NS, Reipa V. Conjugation of the photoluminescent silicon nanoparticles to streptavidin. Bioconjug Chem. 2008;19:680-5
124. Erogbogbo F, Tien CA, Chang CW, Yong KT, Law WC, Ding H. et al. Bioconjugation of luminescent silicon quantum dots for selective uptake by cancer cells. Bioconjug Chem. 2011;22:1081-8
125. Erogbogbo F, Yong KT, Roy I, Xu G, Prasad PN, Swihart MT. Biocompatible luminescent silicon quantum dots for imaging of cancer cells. ACS Nano. 2008;2:873-8
126. Shiohara A, Prabakar S, Faramus A, Hsu CY, Lai PS, Northcote PT. et al. Sized controlled synthesis, purification, and cell studies with silicon quantum dots. Nanoscale. 2011;3:3364-70
127. He GS, Zheng Q, Yong KT, Erogbogbo F, Swihart MT, Prasad PN. Two- and three-photon absorption and frequency upconverted emission of silicon quantum dots. Nano Lett. 2008;8:2688-92
128. Baba K, Kasai H, Masuhara A, Oikawa H, Nakanishi H. Organic solvent-free fluorescence confocal imaging of living cells using pure nanocrystal forms of fluorescent dyes. Jpn J Appl Phys. 2009;48:117002
129. Baba K, Pudavar HE, Roy I, Ohulchanskyy TY, Chen Y, Pandey RK. et al. New method for delivering a hydrophobic drug for photodynamic therapy using pure nanocrystal form of the drug. Mol Pharm. 2007;4:289-97
130. Kasai H, Nalwa HS, Okada S, Oikawa H, Nakanishi H. Fabrication and spectroscopic characterization of organic nanocrystals. In: (ed.) Nalwa HS. Handbook of Nanostructured Materials and Nanotechnology, Organics, Polymers, and Biological Materials, 1st ed. Sandego: Academic Press. 1999:433-73
131. Masuo S, Masuhara A, Akashi T, Muranushi M, Machida S, Kasai H. et al. Photon antibunching in the emission from a single organic dye nanocrystal. Jpn J Appl Phys. 2007;46:L268-L270
132. Aharonovich I, Castelletto S, Simpson DA, Su CH, Greentree AD, Prawer S. Diamond-based single-photon emitters. Rep Prog in Phys. 2011;74:076501
133. Faklaris O, Joshi V, Irinopoulou T, Tauc P, Sennour M, Girard H. et al. Photoluminescent diamond nanoparticles for cell labeling: study of the uptake mechanism in mammalian cells. ACS Nano. 2009;3:3955-62
134. Mochalin VN, Gogotsi Y. Wet chemistry route to hydrophobic blue fluorescent nanodiamond. J Am Chem Soc. 2009;131:4594-5
Author contact
![]() Corresponding author: Tel: +81-6-6879-3456; Fax: +81-6-6879-3458; E-mail: koichi.babamed.osaka-u.ac.jp.
Corresponding author: Tel: +81-6-6879-3456; Fax: +81-6-6879-3458; E-mail: koichi.babamed.osaka-u.ac.jp.