Impact Factor
 Global reach, higher impact
Theranostics 2014; 4(3):267-279. doi:10.7150/thno.7323 This issue Cite
Research Paper
Imaging the Urokinase Plasminongen Activator Receptor in Preclinical Breast Cancer Models of Acquired Drug Resistance
Aaron M. LeBeau1 ![]() , Natalia Sevillano2, Mandy L. King3, Sai Duriseti2, Stephanie T. Murphy1, Charles S. Craik2, Laura L. Murphy3, Henry F. VanBrocklin1
, Natalia Sevillano2, Mandy L. King3, Sai Duriseti2, Stephanie T. Murphy1, Charles S. Craik2, Laura L. Murphy3, Henry F. VanBrocklin1
1. Center for Molecular and Functional Imaging, Department of Radiology and Biomedical Imaging, University of California, San Francisco, San Francisco, CA 94118.
2. Department of Pharmaceutical Chemistry, University of California, San Francisco, San Francisco, CA 94118.
3. Department of Physiology, Southern Illinois University School of Medicine, Carbondale, IL 62901.
Received 2013-8-2; Accepted 2013-12-15; Published 2014-1-18
Abstract

Subtype-targeted therapies can have a dramatic impact on improving the quality and quantity of life for women suffering from breast cancer. Despite an initial therapeutic response, cancer recurrence and acquired drug-resistance are commonplace. Non-invasive imaging probes that identify drug-resistant lesions are urgently needed to aid in the development of novel drugs and the effective utilization of established therapies for breast cancer. The protease receptor urokinase plasminogen activator receptor (uPAR) is a target that can be exploited for non-invasive imaging. The expression of uPAR has been associated with phenotypically aggressive breast cancer and acquired drug-resistance. Acquired drug-resistance was modeled in cell lines from two different breast cancer subtypes, the uPAR negative luminal A subtype and the uPAR positive triple negative subtype cell line MDA-MB-231. MCF-7 cells, cultured to be resistant to tamoxifen (MCF-7 TamR), were found to significantly over-express uPAR compared to the parental cell line. uPAR expression was maintained when resistance was modeled in triple-negative breast cancer by generating doxorubicin and paclitaxel resistant MDA-MB-231 cells (MDA-MB-231 DoxR and MDA-MB-231 TaxR). Using the antagonistic uPAR antibody 2G10, uPAR was imaged in vivo by near-infrared (NIR) optical imaging and 111In-single photon emission computed tomography (SPECT). Tumor uptake of the 111In-SPECT probe was high in the three drug-resistant xenografts (> 46 %ID/g) and minimal in uPAR negative xenografts at 72 hours post-injection. This preclinical study demonstrates that uPAR can be targeted for imaging breast cancer models of acquired resistance leading to potential clinical applications.
Keywords: urokinase plasminogen activator receptor, single-photon emission computed tomography, human antibody, drug-resistant breast cancer, tamoxifen resistance, phage display.
Introduction
The treatment of breast cancer is a clinically daunting task due to the diverse nature of the multiple breast cancer subtypes that each respond differently to the oncologist's armamentarium. Several targeted therapeutics have demonstrated promise in the clinic at reducing mortality associated with select subtypes of breast cancer. The antibody Herceptin has had a major impact on treating subtypes that over-express the human epidermal growth factor receptor 2 (HER2) on the cell surface [1, 2]. The selective estrogen receptor modulator tamoxifen is currently used for the adjuvant and neo-adjuvant treatment of estrogen receptor (ER) positive luminal breast cancers [3, 4]. Despite the implementation of these targeted therapies, drug-resistance and clinical recurrence occur in 30-50% of all women receiving them as primary treatment [5, 6]. The triple-negative breast cancer (TNBC) subtype has not shared the decrease in mortality seen in the other subtypes. Lacking expression of the progesterone receptor (PR), the ER and HER2, few therapeutic options exist for TNBC [7]. TNBC patients respond well to initial anthracycline or taxane-based therapies, but relapse quickly and drug resistance arises [8]. A common characteristic of drug resistance is increased cancer aggressiveness and metastatic potential, both factors that lead to poor clinical outcome [4, 9, 10]. A major hurdle in the development of new therapeutics for drug-resistant breast cancer is the inability to evaluate therapeutic efficacy in vivo. Sensitive non-invasive imaging probes that identify aggressive lesions and measure cancer cell viability post-therapy would allow physicians to rapidly assess treatment efficacy and tailor therapy accordingly. New imaging probes are needed and biomarkers indicative of aggressive drug-resistant breast cancer need to be targeted.
The urokinase plasminogen activator receptor (uPAR) is an attractive target for the development of imaging probes for drug-resistant breast cancer. uPAR is a three domain GPI-anchored outer-leaflet membrane protein and is central to the plasminogen activation axis [11]. This axis consists of the secreted protease uPA, uPAR and the inhibitor of uPA, PAI-1. The plasminogen activation axis promotes cancer invasiveness and metastasis by converting plasminogen into proteolytically active plasmin [12]. uPAR acts as the central coordinator of this axis by binding uPA and restricting plasminogen activation to the immediate vicinity of the cell surface. Once active, plasmin can activate a number of other proteases resulting in degradation of the extra-cellular matrix, cancer growth and metastasis. Over-expression of the plasminogen activation axis has been found in a number of cancers and is common to breast cancer with aggressive phenotypes [11, 13]. In healthy mammary tissue, uPAR is virtually non-existent and its expression appears to be restricted only to diseased tissue [14, 15]. The expression of uPAR has also been documented in components of the reactive stroma, including cancer-associated fibroblasts, tumor-associated macrophages and tumor endothelial cells [16, 17]. The presence of uPAR in breast cancer tissue is also a strong indicator of drug resistance. Increased levels of uPAR directly correlated with resistance to tamoxifen and low progression free survival for patients who developed tamoxifen resistance [18].
The orientation of uPAR on the outer-leaflet of the cancer cell membrane makes it a particularly accessible target for imaging probes. Previously, we detailed the characterization of human antibodies for uPAR that were discovered from a fragment antigen binding phage display library derived from human B cells [19]. Two of these antibodies, 2G10 and 3C6 were found to be antagonistic to the function of uPAR. 2G10 prevented binding of uPA to uPAR and 3C6 inhibited the association of uPAR with integrin on the surface of cancer cells. In TNBC animal models, both antibodies were excellent 111In-SPECT probes with 2G10 resulting in greater tumor uptake than 3C6. In this report, we detail the use of our antagonistic antibodies for imaging uPAR in preclinical models of acquired drug resistance that mirror resistance observed in the clinic. A tamoxifen resistant version of the luminal A cell line MCF-7 (MCF-7 TamR) was generated. While MCF-7 did not express uPAR, MCF-7 TamR expressed high levels of uPAR mRNA and had receptor density levels comparable to MDA-MB-231 cells. Taxol and doxorubicin resistant variants of MDA-MB-231 (MDA-MB-231 TaxR and MDA-MB-231 DoxR) were generated and found to also express high levels of uPAR compared to the parental cell line. NIR optical and 111In-SPECT/CT imaging documented high tumor localization in the MCF-7 TamR, MDA-MB-231 TaxR and MDA-MB-231 DoxR xenografts using the 2G10 antibody. The preclinical data presented here support future studies to further credentialize uPAR as a marker of drug resistance.
Materials and Methods
Cell Culture All cancer cells lines used in this study were purchased from American Type Culture Collection (ATCC) and were maintained in DMEM media, supplemented with 10% FBS, 100 U/ml penicillin, and 100 µg/ml streptomycin at 37oC. The cell lines were authenticated using short-tandem repeat profiling provided by the vendor. The uPAR knockout cell line was generated using uPAR shRNA Plasmid (h): sc-36781-SH from Santa Cruz as previously described. Gene expression of the clone used for the xenograft study was analyzed using qPCR and flow cytometry. The MCF-TamR cells were established by culturing MCF-7 cells in the above media in the presence of progressively increasing concentrations of tamoxifen (100nM to 10 µM in ethanol) and then maintaining them in 10 µM tamoxifen for ten months. The MDA-MB-231 TaxR and MDA-MB-231 DoxR were cultured in a similar manner. MDA-MB-231 cells were maintained at the IC50 of each drug (based on a 6 day proliferation assay) until the cell lines achieved a growth rate similar to the parental lines. The maintenance dose was then doubled each time the growth rate reached at least that of the parental cells.
Cell Line Studies The clonogenic survival and matrigel invasion assays were conducted as previously described [19, 20]. For the qPCR analysis RNA was prepared from each cell line (~ 2 x 10⁶ cells/cell line) using an RNEasy kit (Qiagen). Following RNA isolation, each sample was treated with Turbo DNA-free (Ambion) to remove any residual DNA. RNA was synthesized to cDNA using the High Capacity RNA-to-cDNA kit (Applied Biosystems). For each gene, Taqman qPCR was performed in quadruplicate using the Taqman Universal PCR Master Mix (Applied Biosystems). The following Taqman Gene Expression Assay probes were used: uPAR - Hs00182181_m1 PLAUR and 18s ribosomal 1 (reference gene) Hs03928985_g1 RN18S1. All qPCR was performed on an ABI 7300 Real Time PCR system instrument. qPCR raw data (Ct) for each sample was normalized to the reference gene. Data was analyzed using the comparative Ct method (fold change = 2-ΔΔCt) with data normalized to normal human mammary epithelial cells (HMEC).
IgG Production 2G10, 3C6 and 1A8 IgG were produced as previously described [19] and the IgGs were purified on a Protein A FF column (GE Life Sciences), and then on an S75 HiLoad Prep column.
Internalization and Cell Binding Cancer cell lines (30,000 cells per well in 12-well plates in triplicate) were incubated in conditioned media (protein concentration of 5μg/ml) with 10 nM (0.1μCi) 111In-2G10 IgG for 0 to 2 hr at 37oC. At the indicated time, the media was removed and the cells were washed with a mild acid buffer [50 mM glycine, 150 mM NaCl (pH 3.0)] at 4oC for 5 min. Cells were tryspinized and pelleted at 20,000g for 5 min. The supernatant (containing cell surface bound radioactivity) and the cell pellet (containing internalized radioactivity) were counted on a Gamma counter. The number of receptor binding sites per cell and binding affinity were calculated according to a previous publication using cancer cell lines incubated at 4oC [21]. The data were analyzed using GraphPad Prism 3.0.
Flow Cytometry The breast cancer cell lines were cultured in DMEM-H21 supplemented with 10% heat-inactivated FBS. Cells were washed with DPBS and harvested with TrypLE (Gibco). 1×10⁶ cells were incubated with 10 nM 2G10 or 3C6 IgG for 20 minutes at 4°C, followed by FITC-labeled anti-human IgG antibody (BD) for another 20 minutes at 4°C. Stained samples and controls were assayed on a BD Facscalibur. Samples and controls were probed with a phycoerythrin-labeled anti-human Fcγ and assayed on an LSRII flow cytometer (BD). All experiments were performed in triplicate.
Animal Models The animal work was performed in accordance with a UCSF Institutional Animal Care and Use Committee protocol. Six to seven-week-old severe combined immunodeficiency mice were purchased from Taconic Farms. Xenografts were generated by subcutaneous injection of each cell line (1 x 10⁶ cells/ml; 100 µl per site/mouse) in mammary fat pad number four of the mouse.
Near Infrared Optical Imaging 2G10 was labeled with AlexaFluor 680 for NIR imaging using a previously published protocol [22]. This protocol resulted in the conjugation of 2.1 molecules of fluorophore per antibody. Images were collected in fluorescence mode on an IVIS 50 (Caliper/Xenogen) using Living Image 2.50.2 software at 24 hour intervals out to 120 hours. Using the software, region of interest measurements were made and the fluorescence emission images were normalized to reference images and the unitless efficiency was computed.
SPECT/CT Imaging The chelate group for 111In, 1,4,7,10-Tetraazacyclododecane-1,4,7,10-tetraacetic acid N-hydroxysuccinimide ester (DOTA-NHS) (Macrocyclics), was attached to lysine residues on the IgG using a 25:1 molar excess of chelate in a 0.1 M NaHCO3, pH 9.0 buffer with an antibody concentration of 6 mg/ml. After two hours of labeling at room temperature, the antibody-DOTA conjugate was purified using a PD-10 size-exclusion column with PBS buffer to remove unreacted DOTA-NHS. For 111In radiolabeling, 111InCl3 was purchased from Perkin Elmer (Shelton, CT). To radiolabel the IgG, 50 µg of DOTA conjugate in 0.2 M ammonium acetate (pH 6.0) was incubated with 12µl of InCl3 (2.10 mCi) in 0.1 N HCl for 60 minutes at 40oC. The labeled products were purified using a PD-10 column pre-equilibrated with PBS buffer. Labeling efficiency and purity of the product were determined using thin-layer chromatography. For imaging, 2.5 - 5.0 µg of probe, corresponding to 275 - 360 µCi of activity, were injected into the tail vein. The mice were imaged using a Gamma Medica Ideas XSPECT SPECT/C system. Reconstructed data were analyzed with AMIDE software.
Probe quality control After labeling with AlexaFluor 680, DOTA and 111In, the antibodies were tested for their ability to retain affinity for uPAR using ELISA. Recombinant soluble uPAR was immunosorbed onto a Nunc Maxisorp plate using 50µl of 1µg/ml uPAR. Labeled antibodies and unlabeled controls were added to wells. The highest concentration of the antibodies tests was 651nM, and was decreased in two-fold increments to 5.1 nM.. Binding was probed with a biotinylated anti-Fc receptor antibody, followed with an avidin-HRP conjugate. Reactions were stopped with sulfuric acid after five minutes and read on a UV-Vis microplate reader. Values (done in quadruplicate) for wells with the respective labeled antibody were averaged and normalized by the average measurement for the wells probed with unlabeled antibody. Decreased affinity was never observed for any of the labeled antibodies.
Biodistribution study Mice (n = 3 / time point) bearing the drug-resistant breast cancer xenografts were injected with 25 µCi (2.5 µg) of 111In-2G19. At 24, 48 and 72hrs, the animals were euthanized for analysis in accordance with UCSF Animal Care and Use Committee guidelines. Blood was collected by cardiac puncture. The tumor, heart, lung, spleen, kidneys, and muscle were harvested, weighed and counted in an automated γ-counter (Wizard2; Perkin Elmer). The percentage injected dose per gram (% ID/g) of tissue was calculated by comparison with standards of known radioactivity. For the blocking study, the mice selected were tail-vein injected with 200µg of cold 2G10 30 minutes prior to injection with the radiolabelled agent. After the biodistribution studies, the cells from the excised tumor tissues were passaged and challenged with tamoxifen, doxorubicin and paclitaxel to ensure drug resistance was maintained during their growth in vivo. All of the cell lines maintained resistance resulting in similar clonogenic survival compared to the cell lines prior to implantation. The measurement of uPAR by ELISA in tumor lysates from the xenografts used in the biodistribution study was performed using the monoclonal antibody R2, generous gift from Gunilla HØyer-Hansen of the Finsen Laboratory in Copenhagen, Denmark. The R2 antibody has high affinity for the for domain 3 of human uPAR. ELISA protocol used was previously published [23].
Statistical Analysis Data were analyzed using the unpaired, 2-tailed Student t test. Differences at the 95% confidence level (P < 0.05) were considered to be statistically significant.
Results
Cell Line Characterization
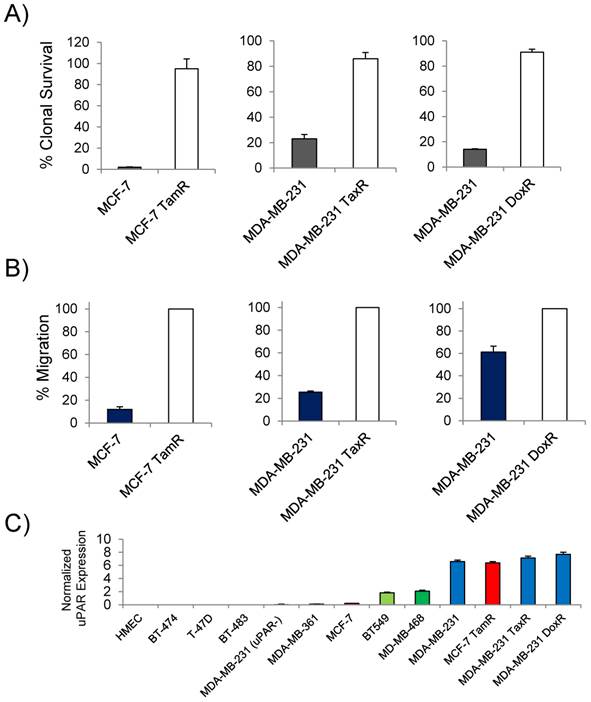
Previous studies reported that uPAR expression was high in the commonly used TNBC cell line MDA-MB-231 and that expression in the luminal A subtype cell line MCF-7 was non-existent [24]. Based on the clinical findings that uPAR expression correlated with tamoxifen resistance in patients with luminal subtype breast cancer, MCF-7 cells resistant to tamoxifen were generated for this study. Doxorubicin and paclitaxel resistant MDA-MB-231 cells were generated to determine the presence of uPAR in models of drug resistant TNBC. The cell lines developed for this study demonstrated marked acquired resistance by clonogenic survival (Figure 1A). At 10µM of tamoxifen, the MCF-7 TamR cells maintained 95% clonal survival while the parental MCF-7 cells maintained only 2%. The MCF-7 TamR cells used in this study also underwent significant morphological changes acquiring a more mesenchymal phenotype commonly associated with tamoxifen resistant MCF-7 sub-lines [25]. MDA-MB-231 TaxR and MDA-MB-231 DoxR demonstrated increased clonal survival over the parental MDA-MB-231 when challenged with 250nM of paclitaxel or 300nM doxorubicin respectively. The cell lines were characterized for their ability to invade though matrigel. Using a matrigel invasion model, the MCF-7 TamR cells displayed a 9 fold increase in cell invasion over non-resistant MCF-7 cells (Figure 1B). A similar trend was observed in the MDA-MB-231 drug-resistant cell lines. MDA-MB-231 TaxR were 3.8 fold more invasive, while the MDA-MB-231 DoxR was 1.6 fold more invasive over the parental control. Quantitative PCR (qPCR) was next used to document the expression of uPAR in the drug resistant cell lines and in other commonly used cell lines used for preclinical studies (Figure 1C). Compared to normal human mammary epithelial cells, MDA-MB-231 cells had the highest uPAR expression of the commonly used TNBC and luminal subtype derived cell lines. The parental MCF-7 expressed virtually no uPAR, however, qPCR found the level of uPAR expression in MCF-7 TamR to be comparable to that of the parental MDA-MB-231 cells. The expression of uPAR was maintained in both MDA-MB-231 TaxR and MDA-MB-231 DoxR cell lines with no significant difference in expression levels when compared to the parental cell line (P > 0.05). An uPAR knock out cell line, MDA-MB-231 (uPAR-), was generated for this study and found to express minimal levels of uPAR mRNA. These data documented that uPAR was expressed in our preclinical models of acquired drug resistance justifying further investigation in vitro and in vivo.
In vitro characterization of the drug-resistant cancer cell lines. (A) Clonogenic survival assay of the drug-resistant and the parental cell lines challenged with drug (10µM of tamoxifen; 250nM paclitaxel; 300nM doxorubicin). (B) Matrigel invasion assays comparing the ability of the drug-resistant cells lines to invade through matrigel to the parental. (C) Quantitative PCR analysis of breast cancer cell lines expressing uPAR normalized to normal human mammary epithelial cells. The cell lines analyzed included representative cell lines of each breast cancer subtype in addition to the drug-resistant variants.
In Vitro Characterization of uPAR Antibodies in Drug-Resistant Cell Lines
The internalization and the epitope availability of the three anti-uPAR antibodies 2G10, 3C6 and 1A8 were investigated prior to imaging the drug-resistant cell lines in vivo. The locations of the antibody epitopes on the structure of uPAR are unknown. 2G10 is known to bind to a region of uPAR that prevents uPA binding, while 3C6 binds to an epitope that competes with β1 integrins for uPAR binding [19]. From the same study, 1A8 antibody was found to bind to an unknown domain on uPAR in a non-antagonistic manner [19]. The antibodies were labeled with 111In via a DOTA chelate and internalization using MDA-MB-231 cells was studied at 37oC. Both 2G10 and 3C6 were rapidly internalized after one hour of incubation with 85% and 69.4% of the total radioactivity of 2G10 and 3C6 internalized after two hours in MDA-MB-231 cells expressing uPAR (Figure 2A). No significant internalization of 1A8 was observed, with minor cellular uptake resulting from membrane turnover. Internalization via an uPAR dependent mechanism was confirmed for 2G10 and 3C6 because no internalization was observed for these antibodies in the MDA-MB-231 (uPAR-) cell line at the three time points tested. Because of its higher internalization rate in MDA-MB-231 cells, the internalization of 2G10 was further investigated at the two hour time point for specificity. Internalization was high in the drug-resistant cell lines with percent radioactivity internalized values similar to the MDA-MB-231 (Figure 2B). No internalization was observed in the uPAR negative MCF-7 cell line and uptake was blocked in MDA-MB-231, MDA-MB-231 DoxR and MCF-7 TamR by adding an excess of cold 2G10.
In vitro characterization of the antagonistic uPAR antibodies. (A) Internalization of 2G10, 3C6 and 1A8 labeled with 111In at 37oC. MDA-MB-231 expressing uPAR and MDA-MB-231 (uPAR-) cells with expression knocked out were incubated with 10 nM of radiolabeled antibody at the indicated time points and were washed and treated with an acidic buffer to remove non-covalently bound and non-internalized antibody. Each time point was performed in triplicate. (B) Internalization of 111In-2G10 at the 120 min time point by the drug-resistant and parental cell lines cells lines. Blocking was performed by adding 1 µM of cold 2G10 IgG or 1 µM of 2G10 prior to addition of radiolabeled antibody. (C) Staining of different breast cancer cell lines with FITC labeled 2G10 as analyzed by flow cytometry.
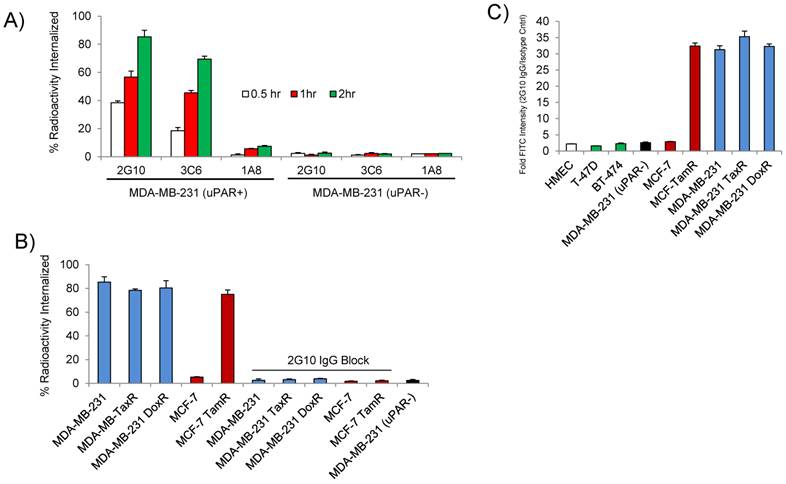
The receptor density of uPAR was measured on MDA-MB-231 cells using the three antibodies to assess the availability of their individual epitopes. The uPAR density on the cell surface calculated using 2G10 and 1A8 were remarkably similar (P = 0.5) with values of 1.26 x 10⁶ receptors / cell for 2G10 and 1.29 x 10⁶ receptors / cell for 1A8 (Table 1). The 3C6 epitope was notably less accessible with only 0.78 x 10⁶ receptors / cell. The decreased accessibility for the 3C6 epitope was significant when compared to 2G10 (P = 0.025) and 1A8 (P = 0.002). The quantitative data demonstrating a more accessible 2G10 epitope and an occluded 3C6 epitope was in concordance with our previous imaging results showing greater tumor uptake and retention of 2G10 compared to 3C6 [13]. In the drug resistant cell lines, a similar trend in receptor density and epitope availability was observed - the receptor number calculated using 2G10 and 1A8 were similar while 3C6 was always much lower. The MCF-7 TamR cells had high uPAR density, closely resembling the triple negative MDA-MB-231 cells. The MDA-MB-231 DoxR cells had the highest uPAR density of the cell lines surveyed with 1.52 x 10⁶ receptors / cell as determined with 2G10. No significant uPAR was found on the surface of the MCF-7 cells or the MDA-MB-231 (uPAR-) cells using the three antibodies. The internalization properties and epitope availability made 2G10 the most desirable antibody for further study in vivo. The binding affinity of 2G10 for the cell lines was calculated by incubating the cells with increasing concentrations of 2G10. The apparent binding affinity of 2G10 for MDA-MB-231 was found to be 10.4 ± 1.6 nM (Table 2). The values for the drug resistant cell lines ranged from 7.4 ± 1.2 nM to 9.3 ± 2.3 nM. 2G10, directly labeled with FITC, was used for flow cytometry to assess selectivity. 2G10 selectively labeled MCF-TamR, MDA-MB-231 TaxR and MDA-MB-231 DoxR, but not the uPAR negative cell lines MDA-MB-231 (uPAR-), MCF-7, BT-474, T47D or normal human mammary epithelial cells (Figure 2C).
uPAR density on the cell lines calculated by the three antibodies reported as 106 receptors / cell
| 2G10 IgG | 3C6 IgG | 1A8 IgG | |
|---|---|---|---|
| MDA-MB-231 | 1.26 ± 0.11 | 0.78 ± 0.04 | 1.29 ± 0.13 |
| MCF-7 | < 0.1 | < 0.1 | < 0.1 |
| MCF-7 TamR | 1.06 ± 0.08 | 0.63 ± 0.03 | 1.11 ± 0.10 |
| MDA-MB-231 TaxR | 1.23 ± 0.09 | 0.88 ± 0.02 | 1.24 ± 0.12 |
| MDA-MB-231 DoxR | 1.52 ± 0.12 | 0.84 ± 0.05 | 1.56 ± 0.09 |
| MDA-MB-231 (uPAR-) | < 0.1 | < 0.1 | < 0.1 |
Apparent affinity constants of the 2G10 for the different cell lines
| 2G10 IgG Kdapp (nM) | |
|---|---|
| MDA-MB-231 | 10.4 ± 1.6 |
| MCF-7 | ND |
| MCF-7 TamR | 8.2 ± 1.4 |
| MDA-MB-231 TaxR | 9.3 ± 2.3 |
| MDA-MB-231 DoxR | 7.4 ± 1.2 |
| MDA-MB-231 (uPAR-) | ND |
In Vivo Imaging of uPAR in Drug-Resistant Breast Cancer Xenografts
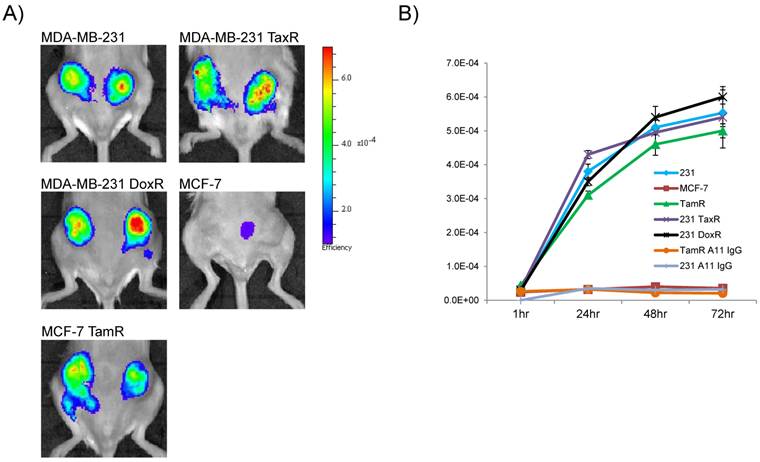
Encouraged by the in vitro data demonstrating internalization, high receptor density and selective labeling by flow cytometry in the drug-resistant cell lines, 2G10 was next tested for its ability to detect uPAR in vivo using NIR optical imaging. 2G10 labeled with AlexaFluor 680 (AF680-2G10) allowed for the non-invasive detection of uPAR in orthotopic bilateral xenografts of the drug-resistant breast cancer cell lines (Figure 3a). Maximum probe localization was achieved at 72hr in the MCF-7 TamR, MDA-MB-231 TaxR and MDA-MB-231 DoxR xenografts demonstrating high tumor uptake and retention. Graphing the fluorescence efficiency of the regions of interest for each of the mice imaged as a function of time highlighted the uptake kinetics and selectivity (Figure 3B). The tumor localization of AF680-2G10 in the four uPAR expressing xenografts was very similar with only slight differences in values. No significant probe uptake, other than non-specific uptake resulting from the enhanced permeability retention (EPR) effect, was observed in the parental MCF-7 xenograft. Both MDA-MB-231 and MCF-7 TamR were injected with an AF680 labeled isotype control antibody (A11 IgG) resulting in no specific localization (Figure 3B).
Near-infrared (NIR) optical imaging of drug-resistant cancer xenografts using AF680-2G10. (A) Mice bearing MDA-MB-231, MDA-MB-231 TaxR, MDA-MB-231 DoxR, MCF-7 and MCF-7 TamR xenografts were tail-vein injected with 2 nmol of AF680-2G10 and imaged using NIR optical imaging. The images shown are representative of n=3 mice/xenograft and were acquired 72hrs post-injection. (B) Graph depicting the localization of AF680-2G10 as fluoresence efficiency of the tumor ROIs for the mice imaged using NIR optical imaging. Included in the graph are the data for the mice imaged with the isotype control AF680-A11 IgG in the MCF-7 TamR (TamR A11 IgG) and MDA-MB-231 (231 A11 IgG) xenografts.
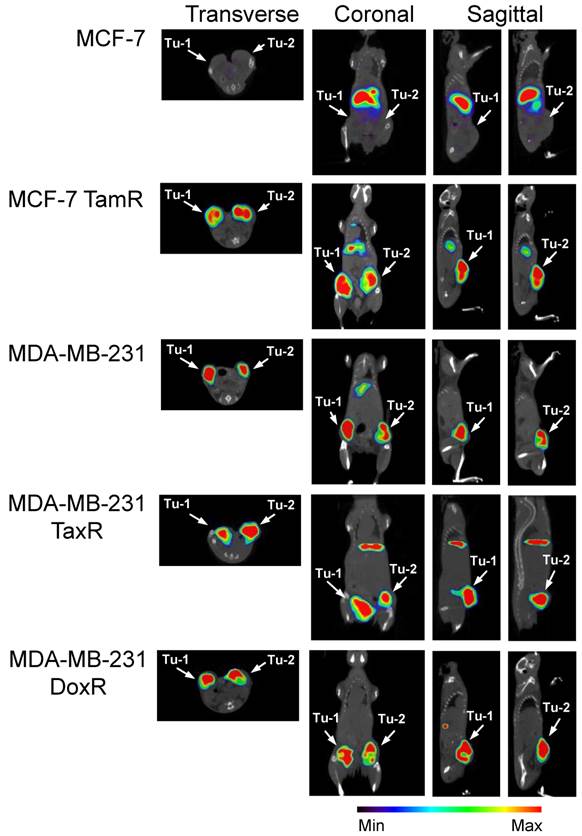
The clinically relevant imaging modality SPECT/CT was next used to acquire three dimensional tomographic data. Tumor uptake was high in the uPAR expressing xenografts. 111In-2G10 localization was evident 72hr post-injection in MCF-7 TamR, MDA-MB-231 TaxR and MDA-MB-231 DoxR xenografts by the fused SPECT/CT images (Figure 4). No tumor uptake was present in the MCF-7 parental control mice with only hepatic clearance of the immunoglobulin visualized in the reconstructed images. This was in direct contrast to the imaging data acquired in the MCF-7 TamR xenograft mice displaying high tumor uptake with some hepatic clearance of the probe, but little secondary accumulation in other locations. The drug-resistant MDA-MB-231 variants also showed pronounced tumor uptake in accordance with the parental xenograft. In the MDA-MB-231 TaxR images, tumor localization was prominent with some hepatic clearance detected. The MDA-MB-231 DoxR demonstrated high tumor uptake with the only observable uptake in the images occurring in the tumors.
SPECT/CT imaging reveals that 111In-2G10 localizes to the tumor interior of the uPAR expressing drug-resistant xenografts preferentially. SCID mice bearing bilateral orthotopic xenograft tumors were injected with 111In-DOTA-labeled 2G10. Each animal (n=3 /xenograft/probe) received an injected dose of 2.5 - 3.8 ug of radiolabeled antibody corresponding to an activity of 230 - 290 µCi. Transverse, coronal and sagittal views of co-registered SPECT/CT images depict 111In-2G10 localizing to the two tumors (Tu-1 and Tu-2) in the MCF-7 TamR, MDA-MB-231 TaxR and MDA-MB-231 DoxR xenografts. Secondary hepatic uptake of the probe is visible MCF-7 TamR, MDA-MB-231, and MDA-MB-231 TaxR. No localization of 111In-2G10 is observed in the MCF-7 xenograft with only hepatic uptake present. The images presented here were acquired 72 hours post-injection and are representative of n = 3 mice imaged/xenograft.
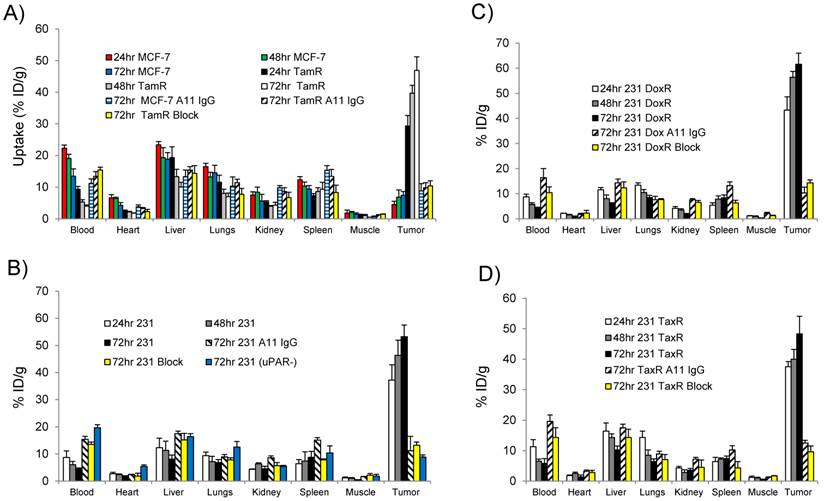
The ability of 111In-2G10 to localize and be retained by uPAR expressing xenografts was assessed by performing biodistribution studies in the imaged xenografts 24, 48, and 72hr after intravenous administration of the imaging probe (Figure 5). The biodistribution data revealed that high MCF-7 TamR tumor uptake was present 24hr post-injection (29.3 ± 3.3 percent injected dose per gram [%ID/g]) with a continued accumulation up to the 72hr time point of 46.9 ± 4.2 %ID/g (P = 0.001 between MCF-7 TamR uptake at 24hr versus 72hr) (Figure 5A). The high tumor uptake of MCF-7 TamR is consistent with the NIR and SPECT/CT imaging data (Figure 3 & 4) and the in vitro results demonstrating internalization and sequestration of 111In-2G10 by the uPAR expressing MCF-7 TamR cells (Figure 2C). The high uptake of 111In-2G10 by the MCF-7 TamR tumors was consistent with extraction of the probe from the blood (24hr, 9.3 ± 0.9 %ID/g; 48hr, 5.3 ± 0.7 %ID/g; and 72hr, 3.9 ± 0.4 %ID/g). By comparison, 111In-2G10 uptake in the uPAR negative parental MCF-7 tumors was significantly lower at all of the time points investigated with a maximum uptake at 72hr of 7.4 ± 1.2 %ID/g (P = 0.005) (Figure 6A). 111In-2G10 activity in the blood remained 3.4 fold higher at 72hr (13.5 ± 2.3 %ID/g, P = 0.03) in the mice bearing MCF-7 tumors compared to the MCF-7 TamR mice. The organs with the highest uptake in the MCF-7 mice at 72hr were the liver (18.8 ± 2.1 %ID/g) and the lungs (14.5 ± 2.4 % ID/g) directly correlating with SPECT/CT imaging results. Uptake of 111In-2G10 by the MCF-7 TamR tumors was blocked by injecting 200µg of cold 2G10 prior to administration of the probe (Figure 5A). At the 72hr time point, the tumor uptake in the blocked group was 4.5 fold lower than the non-blocked with an uptake of 10.4 ± 1.6 %ID/g (P = 0.006) (Figure 6A). The 111In labeled control antibody, A11 IgG, also demonstrated insignificant tumor localization in the MCF-7 TamR mice at 72hr with a %ID/g of 9.8 ± 1.6 (P = 0.006). The high tumor uptake and clearance from the blood of 111In-2G10 in the MCF-7 TamR mice resulted in tumor to blood (T/B) and tumor to muscle (T/M) ratios of 12 and 94, significantly higher than the MCF-7 mice, the blocked MCF-7 TamR mice and the non-targeted MCF-7 TamR A11 IgG mice (Figure 6A & B).
Biodistribution data for (A) MCF-7 and MCF-7 TamR (TamR); (B) MDA-MB-231 (231) and MDA-MB-231 (uPAR-): (C) MDA-MB-231 DoxR (DoxR); and (D) MDA-MDA-231 TaxR (TaxR). Mice (n = 3 mice for each time point per xenograft) were injected with 25 µCi of 111In-2G10 via tail vein. Tissues were harvested at 24, 48 and 72hr post-injection and analyzed. In addition to 111In-2G10, mice (n = 3 mice per xenograft) were injected with 111In-A11 IgG (A11 IgG) to assess the level of non-specific tumor uptake contributed by the EPR effect at 72hr post-injection of A11 IgG. Tumor uptake was also blocked in uPAR expressing xenografts by i.v. pre-injection of 200 µg of cold 2G10 IgG (Block) prior to probe administration and uptake was analyzed 72hr post-injection.
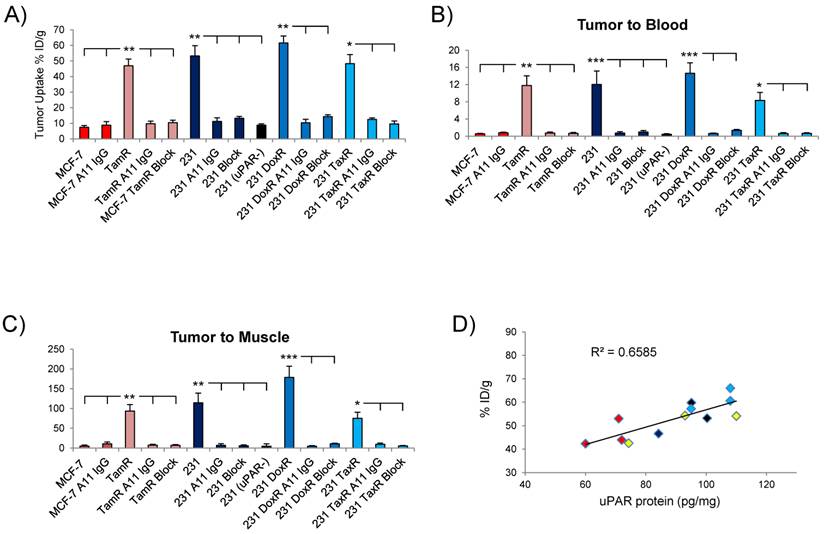
(A) Graph of the tumor uptake of each xenograft analyzed in the biodistribution study at 72hr. Depiction of the tumor/blood (B) and tumor/muscle (C) ratios of in the different xenografts. (D) Correlation between tumor uptake of 111In-2G10 in the xenografts at 72hr and uPAR protein level. Shown are MCF-7 TamR (red), MDA-MB-231 (black), MDA-MB-231 DoxR (blue) and MDA-MB-231 TaxR (yellow).
The MDA-MB-231 drug resistant xenografts MDA-MB-231 DoxR and MDA-231 TaxR exhibited 111In-2G10 localization characteristics similar to the parent xenograft. The biodistribution of 111In-2G10 in MDA-MB-231 mice was typical of a targeted probe in vivo (Figure 6B). Tumor uptake of 111In-2G10 was high at 24hr (37.2 ± 5.6 %ID/g) and increased to 53.2 ± 6.6 %ID/g at 72hr, although this increase was not statistically significant (P = 0.15). 111In-2G10 cleared from the blood (24hr, 8.7 ± 2.4 %ID/g; 48hr, 6.1 ± 1.2 %ID/g; and 72hr, 4.4 ± 0.9 %ID/g) and other background organs resulting in T/B and T/M ratios of 12 and 115 at 72hr (Figure 6B & C). Uptake in this model was blocked with excess cold 2G10 yielding an uptake of 13.2 ± 1.2 %ID/g at 72hr (P = 0.006, blocked compared to non-blocked) (Figure 6A). The blocked uptake of 111In-2G10 resulted in increased probe in the blood (13.5 ± 0.9 %ID/g) and liver (15.2 ± 2.4 %ID/g) at 72hr (Figure 5B). Decreased tumor uptake and increased 111In-2G10 in the blood and liver were observed at 72hr in MDA-MB-231 (uPAR-) mice with uPAR expression knocked out. This model demonstrated tumor uptake of 8.8 ± 0.8 %ID/g (P = 0.005, compared to parental MDA-MB-231), blood activity of 19.7 ± 1.1 %ID/g (P = 5.7 x 10⁻⁵) and liver uptake of 16.4 ± 1.1 %ID/g (P = 0.04). Likewise, in the MDA-MB-231 mice treated with non-targeted A11 IgG, only non-specific tumor accumulation was observed at 72hr (11.2 ± 2.3 %ID/g). As with the blocked mice and the MDA-MB-231 uPAR- mice, the mice in this arm demonstrated increased blood retention and liver uptake of 111In-2G10.
The biodistribution data from the MDA-MB-231 DoxR mice also found that initial probe uptake was high at 24hr with a significant increase in uptake observed at 72hr (43.3 ± 5.3 %ID/g versus 61.6% ± 4.4 %ID/g, P = 0.008) (Figure 5C). Over the time points analyzed, 111In-2G10 cleared quickly from the blood (24hr, 8.7 ± 1.1 %ID/g; 48hr, 5.7 ± 0.7 %ID/g; and 72hr, 4.2 ± 0.4 %ID/g) and secondary organs resulting in high T/B and T/M muscle ratios at 72hr (Figure 6 B & C). Tumor uptake in the MDA-MB-231 DoxR mice could also be blocked by excess cold 2G10 with an uptake of 14.3 ± 1.2 %ID/g (P = 0.004) at 72hr. The non-targeted A11 IgG only demonstrated non-specific tumor localization with an uptake of 10.3 ± 2.6 %ID/g (P = 0.002) after 72hr. The MDA-MB-231 TaxR mice showed a similar biodistribution pattern, however, the tumor uptake between 24hr and 72hr was not statistically significant (P = 0.13). The tumor uptake at 72hr for MDA-MB-231 TaxR (48.3 ± 5.8 %ID/g) was lower than the uptake values for both MDA-MB-231 and MDA-MB-231 DoxR. The MDA-MB-231 TaxR mice did have consistently higher hepatic uptake compared to the other MDA-MB-231 variants reflecting the SPECT/CT imaging data displaying more liver uptake. The MDA-MB-231 TaxR mice had T/B and T/M ratios of 8 and 75 at 72hr, lower than the other uPAR expressing xenografts in this study (Figure 6B & C). Tumor uptake in this model was blocked at 72hr by injecting excess cold 2G10 (9.6 ± 1.9 %ID/g, P = 0.01). Additionally, A11 IgG resulted in non-specific tumor localization in this xenograft at 72hr (12.5 ± 0.9 %ID/g, P = 0.01). Both the blocked and A11 IgG injected mice resulted in higher blood activities compared to the targeted mice (P = 0.02 and P = 0.03). It should be noted that the tumor uptake values at 72hr in the MDA-MB-231, MDA-MB-231 DoxR and MDA-MB-231 TaxR differed, but these differences were not significant (MDA-MB-231 versus MDA-MB-231 DoxR, P = 0.27; MDA-MB-231 versus MDA-MB-231 TaxR, P = 0.56; and MDA-MB-231 TaxR versus MDA-MB-231 DoxR, P = 0.06). The uPAR protein levels in the xenografts used for the biodistribution study were determined by performing ELISA on the detergent extracts of the tumor lysates. This analysis determined that uPAR was expressed at high levels by the drug-resistant xenografts. uPAR expression levels in MCF-7 TamR, MDA-MB-231, MDA-MB-231 DoxR and MDA-MB-231 TaxR were found to be 67 ± 4 pg/mg, 93 ± 8 pg/mg, 103 ± 8 pg/mg and 92 ± 11 pg/mg. The uPAR protein levels in the tumors were found to correlate with the %ID/g of 111In-2G10 in the biodistribution study (Figure 6D).
Discussion
The treatment of breast cancer has become increasingly aimed at molecular targets known to drive or be associated with tumorigenesis and metastasis. This aimed approach towards breast cancer treatment has increased dramatically over the past few years with the implementation of subtype-targeted agents such as Herceptin and tamoxifen leading to improved clinical response rates. As targeted therapy becomes standard of care, acquired resistance becomes more common selecting for breast cancers that are aggressive and metastatic through a number of mechanisms. None of the targeted agents, thus far, have resulted in a cure for the majority of patients with metastatic breast cancer. Once breast cancer has metastasized beyond the primary site of disease, it is uniformly lethal and subsequent treatment options are palliative in nature. The ability to quantify therapeutic response in breast cancer patients is central to the development of novel therapies and personalized medicine. Imaging probes targeting biomarkers that accurately reflect tumor attrition and acquired resistance to therapy are needed for the informed treatment of patients with metastatic drug-resistant breast cancer.
The link between uPAR expression and aggressive cancer phenotypes has been well documented [11, 26]. uPAR over-expression is associated with poor disease free and overall survival in a number of cancers. Environmental stress factors, such as hypoxia, have also been known to induce uPAR expression in cancer cells leading to increased aggressiveness [27]. Previously, we found that uPAR mRNA expression in a patient dataset correlated strongly with TNBC compared to other breast cancer subtypes [13]. Pursuing the clinical association between uPAR expression and tamoxifen resistance in patients undergoing SERM treatment, we sought to define uPAR as a marker for drug resistance and image uPAR in vivo. Cell lines that mimic acquired drug resistance in the clinic were developed for the in vivo uPAR imaging studies. Luminal A subtype derived MCF-7 breast cancer cells were cultured to acquire resistance to high doses of tamoxifen. Two drug resistant variants of the TNBC cell line MDA-MB-231 were generated to mirror anthracycline and taxane based resistance. MCF-7 TamR, MDA-MB-231 TaxR and MDA-MB-231 DoxR all expressed high levels of uPAR. It is worth noting that as drug-resistance was acquired in the MDA-MB-231 cells, uPAR expression was maintained, it did not decrease, suggesting that the presence of uPAR could be a common trait of drug-resistant TNBC.
Previously, we imaged uPAR in a MDA-MB-231 xenograft using the two antagonistic antibodies 2G10 and 3C6 in a SPECT/CT study. The imaging properties of 2G10 were superior to 3C6 based on tumor uptake and retention. In this study, the epitope availability of three uPAR antibodies was investigated to select a lead antibody for in vivo imaging. The uPAR density was calculated for each antibody using MDA-MB-231 cells and it was discovered that 2G10 had 60% more available binding sites compared to 3C6. This finding validated the earlier work demonstrating the superior imaging characteristics of 2G10. 2G10 was subsequently used to quantify uPAR density on the surface of the drug-resistant cell lines. All of the cell lines expressed over a million copies of uPAR on each cell, even the MCF-7 TamR cells. 2G10 was also quickly and selectively internalized by the uPAR expressing drug-resistant cell lines through an uPAR mediated endocytosis pathway. The high number and availability of the epitope allowed for 2G10 labeled with the near-infrared fluorophore AlexaFluor 680 to image uPAR in vivo in the drug resistant xenografts. Tumor localization was high in all of the xenografts after 72hr post-injection, which is typical with full length immunoglobulin antibodies possessing long circulating half-lives. The non-targeted antibody A11 IgG labeled with AlexaFluor 680 did not localize to the tumors of the MCF-7 TamR and MDA-MB-231 xenografts suggesting that uptake of 2G10 in the tumors of these models was the direct result of targeting uPAR and not simply due to non-specific hemodynamic forces such as the EPR effect.
The images of the xenografts acquired using 111In-2G10 with the clinically relevant modality SPECT/CT correlated with the optical imaging and in vitro assay results. All of the uPAR expressing xenografts internalized 111In-2G10 to a high degree in vitro. This uPAR mediated internalization and sequestration mechanism resulted in the tumor localization of 111In-2G10 in the drug-resistant xenografts by SPECT/CT 72hr post-injection. The parental MCF-7 xenograft demonstrated no specific localization of 111In-2G10 to the tumor tissue. Even by increasing the threshold to saturate the scintigraphic signal from the lungs and liver, no localization of the probe was detected in the tumors. The ability of 111In-2G10 to localize to uPAR expressing drug-resistant xenografts was further analyzed by biodistribution studies at three different time points. The biodistribution data of the MCF-7 TamR xenograft compared to the parental MCF-7 provided an excellent example of targeted versus non-targeted probe localization in tumor tissue and secondary tissues. Over the three time points examined, 111In-2G10 uptake in the MCF-7 TamR tumors steadily increased and the probe cleared from the blood pool and other secondary organs such as the liver, lung, and heart. As a direct result of this, 111In-2G10 had low background as measured by the T/B and T/M ratios. Blocking tumor uptake in MFC-7 TamR with excess cold 2G10 proved that that probe localization was indeed the result of 111In-2G10 binding to uPAR on the surface of the cancer cells. In the MCF-7 xenograft with no uPAR present for 111In-2G10 to bind, the probe remained in the blood pool and localized to the liver, the main organ for antibody clearance, at high levels. The tumor uptake observed in the MCF-7 xenograft was 7.4 ± 1.2 %ID/g at 72hr. By comparison, when treated with non-targeted 111In labeled A11 IgG, the MCF-7 TamR and MCF-7 xenografts had tumor uptake of 9.8 ± 1.6 and 8.8 ± 2.3 %ID/g respectively. We can conclude from these data that 111In-2G10 localization in the MCF-7 xenograft was entirely due to the EPR effect. As expected the parental and drug-resistant MDA-MB-231 xenografts demonstrated high tumor uptake as revealed by the biodistibution study. Blocking experiments and the use an uPAR knockout cell line documented that 111In-2G10 tumor uptake observed was the consequence of targeting uPAR and not passive diffusion. Additionally, we also found by ELISA that the drug-resistant xenografts used in this study continued to express high levels of uPAR protein and that these expression levels correlated with tumor uptake of 111In-2G10 in vivo.
In this study, we have laid the ground work for the claim uPAR expression could be used as a marker of acquired drug resistance in breast cancer. This claim is provocative and further studies need to be conducted to support this belief. Clinical tumor samples of drug-resistant breast cancer from different subtypes need to be analyzed by ELISA and immunohistochemistry for uPAR expression and the appropriate in vitro models need to be developed. One main drawback is the length of time required to generate drug-resistant cell lines. Often, in the case of the MCF-7 TamR cell line, it can months to create the appropriate cell line models for in vitro and preclinical analysis. Once such models have been created, only then can we thoroughly and definitively understand the potential clinical value of imaging uPAR in drug-resistant breast cancer. uPAR targeted imaging probes can be also turned into radiotherapeutics and drug conjugates for the therapeutic targeting of uPAR. Thus, there is the possibility for uPAR targeted antibodies, peptides, and small molecules to be used to treat drug-resistant breast cancer patients when all other treatments have failed. Since uPAR has been documented in a number of cancers, uPAR could act as a marker of acquired drug resistance in cancers other than breast.
Acknowledgements
This work was supported by the Rogers Family Award (to C.S.C. and H.F.V.). A.M. LeBeau was supported by a DOD Prostate Cancer Postdoctoral Award PC094386 and a Prostate Cancer Foundation Young Investigator Award. S. Duriseti received predoctoral funding from the Chih Foundation Award, the UC Cancer Research Coordinating Committee, and NIH training grant T32 GM008284-25.
Competing Interests
The authors have declared that no competing interest exists.
References
1. Tsang RY, Finn RS. Beyond trastuzumab: novel therapeutic strategies in HER2-positive metastatic breast cancer. Br J Cancer. 2012;106:6-13 doi:10.1038/bjc.2011.516 bjc2011516 [pii]
2. Nahta R, Esteva FJ. HER-2-targeted therapy: lessons learned and future directions. Clin Cancer Res. 2003;9:5078-84
3. Gutierrez MC, Detre S, Johnston S, Mohsin SK, Shou J, Allred DC. et al. Molecular changes in tamoxifen-resistant breast cancer: relationship between estrogen receptor, HER-2, and p38 mitogen-activated protein kinase. J Clin Oncol. 2005;23:2469-76 doi:JCO.2005.01.172 [pii] 10.1200/JCO.2005.01.172
4. Boyle DP, Mullan P, Salto-Tellez M. Molecular mapping the presence of druggable targets in preinvasive and precursor breast lesions: a comprehensive review of biomarkers related to therapeutic interventions. Biochim Biophys Acta. 2013;1835:230-42 doi:10.1016/j.bbcan.2013.01.004 S0304-419X(13)00005-X [pii]
5. van Agthoven T, Sieuwerts AM, Meijer-van Gelder ME, Look MP, Smid M, Veldscholte J. et al. Relevance of breast cancer antiestrogen resistance genes in human breast cancer progression and tamoxifen resistance. J Clin Oncol. 2009;27:542-9 doi:10.1200/JCO.2008.17.1462 JCO.2008.17.1462 [pii]
6. Lan KH, Lu CH, Yu D. Mechanisms of trastuzumab resistance and their clinical implications. Ann N Y Acad Sci. 2005;1059:70-5 doi:1059/1/70 [pii] 10.1196/annals.1339.026
7. Hudis CA, Gianni L. Triple-negative breast cancer: an unmet medical need. Oncologist. 2011;16(Suppl 1):1-11 doi:10.1634/theoncologist.2011-S1-01 16/suppl_1/1 [pii]
8. Andre F, Zielinski CC. Optimal strategies for the treatment of metastatic triple-negative breast cancer with currently approved agents. Ann Oncol. 2012;23(Suppl 6):vi46-51 doi:mds195 [pii] 10.1093/annonc/mds195
9. Gottesman MM. Mechanisms of cancer drug resistance. Annu Rev Med. 2002;53:615-27 doi:10.1146/annurev.med.53.082901.103929 53/1/615 [pii]
10. Singh A, Settleman J. EMT, cancer stem cells and drug resistance: an emerging axis of evil in the war on cancer. Oncogene. 2010;29:4741-51 doi:10.1038/onc.2010.215 onc2010215 [pii]
11. Sidenius N, Blasi F. The urokinase plasminogen activator system in cancer: recent advances and implication for prognosis and therapy. Cancer Metastasis Rev. 2003;22:205-22
12. Li Y, Cozzi PJ. Targeting uPA/uPAR in prostate cancer. Cancer Treat Rev. 2007;33:521-7 doi:S0305-7372(07)00076-X [pii] 10.1016/j.ctrv.2007.06.003
13. LeBeau AM, Duriseti S, Murphy ST, Pepin F, Hann B, Gray JW. et al. Targeting uPAR with antagonistic recombinant human antibodies in aggressive breast cancer. Cancer Res. 2013;73:2070-81 doi:10.1158/0008-5472.CAN-12-3526 0008-5472.CAN-12-3526 [pii]
14. Bianchi E, Cohen RL, Thor AT, Todd RF 3rd, Mizukami IF, Lawrence DA. et al. The urokinase receptor is expressed in invasive breast cancer but not in normal breast tissue. Cancer Res. 1994;54:861-6
15. Pyke C, Graem N, Ralfkiaer E, Ronne E, Hoyer-Hansen G, Brunner N. et al. Receptor for urokinase is present in tumor-associated macrophages in ductal breast carcinoma. Cancer Res. 1993;53:1911-5
16. Christensen L, Wiborg Simonsen AC, Heegaard CW, Moestrup SK, Andersen JA, Andreasen PA. Immunohistochemical localization of urokinase-type plasminogen activator, type-1 plasminogen-activator inhibitor, urokinase receptor and alpha(2)-macroglobulin receptor in human breast carcinomas. Int J Cancer. 1996;66:441-52 doi:10.1002/(SICI)1097-0215(19960516)66:4<441::AID-IJC6>3.0.CO;2-W [pii] 10.1002/(SICI)1097-0215(19960516)66:4<441::AID-IJC6>3.0.CO;2-W
17. Carriero MV, Franco P, Del Vecchio S, Massa O, Botti G, D'Aiuto G. et al. Tissue distribution of soluble and receptor-bound urokinase in human breast cancer using a panel of monoclonal antibodies. Cancer Res. 1994;54:5445-54
18. Meijer-van Gelder ME, Look MP, Peters HA, Schmitt M, Brunner N, Harbeck N. et al. Urokinase-type plasminogen activator system in breast cancer: association with tamoxifen therapy in recurrent disease. Cancer Res. 2004;64:4563-8 doi:10.1158/0008-5472.CAN-03-3848 64/13/4563 [pii]
19. Duriseti S, Goetz DH, Hostetter DR, LeBeau AM, Wei Y, Craik CS. Antagonistic anti-urokinase plasminogen activator receptor (uPAR) antibodies significantly inhibit uPAR-mediated cellular signaling and migration. J Biol Chem. 2010;285:26878-88 doi:M109.077677 [pii] 10.1074/jbc.M109.077677
20. Dalrymple SL, Becker RE, Zhou H, DeWeese TL, Isaacs JT. Tasquinimod prevents the angiogenic rebound induced by fractionated radiation resulting in an enhanced therapeutic response of prostate cancer xenografts. Prostate. 2012;72:638-48 doi:10.1002/pros.21467
21. He J, Wang Y, Feng J, Zhu X, Lan X, Iyer AK. et al. Targeting prostate cancer cells in vivo using a rapidly internalizing novel human single-chain antibody fragment. J Nucl Med. 2010;51:427-32 doi:10.2967/jnumed.109.069492 jnumed.109.069492 [pii]
22. LeBeau AM, Lee M, Murphy ST, Hann BC, Warren RS, Delos Santos R. et al. Imaging a functional tumorigenic biomarker in the transformed epithelium. Proc Natl Acad Sci U S A. 2013;110:93-8 doi:10.1073/pnas.1218694110 1218694110 [pii]
23. Persson M, Madsen J, Ostergaard S, Jensen MM, Jorgensen JT, Juhl K. et al. Quantitative PET of human urokinase-type plasminogen activator receptor with 64Cu-DOTA-AE105: implications for visualizing cancer invasion. J Nucl Med. 2012;53:138-45 doi:10.2967/jnumed.110.083386 53/1/138 [pii]
24. Sliutz G, Eder H, Koelbl H, Tempfer C, Auerbach L, Schneeberger C. et al. Quantification of uPA receptor expression in human breast cancer cell lines by cRT-PCR. Breast Cancer Res Treat. 1996;40:257-63
25. Hiscox S, Jiang WG, Obermeier K, Taylor K, Morgan L, Burmi R. et al. Tamoxifen resistance in MCF7 cells promotes EMT-like behaviour and involves modulation of beta-catenin phosphorylation. Int J Cancer. 2006;118:290-301 doi:10.1002/ijc.21355
26. Blasi F, Carmeliet P. uPAR: a versatile signalling orchestrator. Nat Rev Mol Cell Biol. 2002;3:932-43 doi:10.1038/nrm977 nrm977 [pii]
27. Jo M, Lester RD, Montel V, Eastman B, Takimoto S, Gonias SL. Reversibility of epithelial-mesenchymal transition (EMT) induced in breast cancer cells by activation of urokinase receptor-dependent cell signaling. J Biol Chem. 2009;284:22825-33 doi:M109.023960 [pii] 10.1074/jbc.M109.023960
Author contact
![]() Corresponding author: Aaron M. LeBeau, Ph.D. Department of Radiology and Biomedical Imaging, University of California, San Francisco, 185 Berry Street, Suite 350, San Francisco, CA, 94143-2280. Phone: (415) 476-8147 Fax: (415) 514-8242 Email: Aaron.Lebeauedu.
Corresponding author: Aaron M. LeBeau, Ph.D. Department of Radiology and Biomedical Imaging, University of California, San Francisco, 185 Berry Street, Suite 350, San Francisco, CA, 94143-2280. Phone: (415) 476-8147 Fax: (415) 514-8242 Email: Aaron.Lebeauedu.