Impact Factor
- Issue 14; 2026
- Issue 13; 2026
- Issue 12; 2026
- Issue 11; 2026
- Issue 10; 2026
- Volume 16; 2026
- Advance Articles
- Past Issues
- Cover Images
- Cover Suggestion
- Index & Coverage
- Special Issues
Introduction
Experimental
Results and Discussion
Conclusion
Supplementary Material
Acknowledgements
References
International Journal of Biological Sciences
International Journal of Medical Sciences
 Global reach, higher impact

Theranostics 2014; 4(3):307-315. doi:10.7150/thno.8007 This issue Cite
Research Paper
Simple and Sensitive Detection of HBsAg by Using a Quantum Dots Nanobeads Based Dot-Blot Immunoassay
Pengfei Zhang1, Huiqi Lu1, Jia Chen1, Huanxing Han1 ![]() , Wei Ma2
, Wei Ma2
1. Translational Medicine Center, Changzheng Hospital, The Second Military Medical University, 800 Xiangyin Road, Shanghai 200433, P.R. China.
2. State Key Laboratory of Bioreactor Engineering & Department of Chemistry, East China University of Science and Technology, 130 Meilong Road, Shanghai 200237, P.R. China.
Received 2013-10-29; Accepted 2013-12-24; Published 2014-1-25
Abstract

Simple and sensitive detection of infectious disease at an affordable cost is urgently needed in developing nations. In this regard, the dot blot immunoassay has been used as a common protein detection method for detection of disease markers. However, the traditional signal reporting systems, such as those using enzymes or gold nanoparticles lack sensitivity and thus restrict the application of these methods for disease detection. In this study, we report a simple and sensitive detection method for the detection of infectious disease markers that couples the dot-blot immunoassay with quantum dots nanobeads (QDNBs) as a reporter. First, the QDNBs were prepared by an oil-in-water emulsion-evaporation technique. Because of the encapsulation of several QDs in one particle, the fluorescent signal of reporter can be amplified with QDNBs in a one-step test and be read using a UV lamp obviating the need for complicated instruments. Detection of disease-associated markers in complex mixture is possible, which demonstrates the potential of developing QDNBs into a sensitive diagnostic kit.
Keywords: dot-blot immunoassay, HBsAg, quantum dots, nanobeads.
Introduction
In resource-limited settings wherein health-care infrastructure is weak, there is an urgent need for rapid, sensitive and cost affordable point-of-care tests (POCT) for the detection of diseases [1-3]. This challenge is particularly important for preventing the transfer of infectious diseases such as hepatitis B virus infection and for improving the standards of living [4-6]. However, the current technology for sensitive and rapid detection of disease often requires sophisticated instruments that are not readily available in developing countries [7, 8]. Immunoassays such as the enzyme-linked immunosorbent assay (ELISA) are very reliable and are widely used methods for disease biomarker detection via the antibody-antigen interactions [9, 10]. However, traditional ELISA requires hours of incubation for diffusion limited reactions that occur on the surface as well as many steps of pipetting in a standard lab setting. Such disadvantages prevent the use of ELISA for the detection of disease in developing countries.
The dot-blot immunoassay is suitable for POCT because of the simple and rapid processes involved [11-13]. Moreover, the extremely low amount of sample used in the assay makes this method superior for testing trace samples. Nevertheless, the traditional dot-blot immunoassay, which uses enzymatic labeling, requires multiple incubation steps to allow the enzyme to react with unstable substrates [11]. The key challenge of successful immunoassay application is to transform the binding activities of antibody-antigen into physically detectable signals [14]. Quantum dots (QDs) are a novel class of fluorescent nanoparticle label that has attracted considerable interest in immunoassays area for their unique optical properties [15-23], including high quantum yields (QYs), large molar extinction coefficients, exceptional photostability, tunable emission wavelength, and broad absorption cross section. However, further improved sensitivity of fluorescent sensors based on QDs remains challenging for the detection of ultralow amounts of proteins. A major approach for improving the sensitivity of immunoassay detection is to amplify the reporting signals by increasing the quantity of nanoparticles in each binding event [24-27]. For example, signal amplification of electrochemiluminescent and square-wave voltammetric immunosensors has been demonstrated using QDs-coated silica nanospheres as the label [28, 29]. Poly-QDs probes prepared by the biotin-avidin system have also been employed to improve proteins detection sensitivity by western blot [30]. Furthermore, QDs functionalized polystyrene microbeads prepared by layer-by-layer self-assembly method have also been proposed for the construction of a carrier-amplified platform with enhanced detection sensitivity [31]. Nevertheless, the above-mentioned signal amplification strategies were generally suffering from sophisticated and multi-steps process, which blocks their development into POCT diagnostic reagent kits.
In this study, we present a simple and effective method to improve the detection sensitivity of dot-blot immunoassay by amplifying the reporting fluorescent signals with QDs-nanobeads (QDNBs). Using the prepared QDNBs as amplified signal indicators, as low as 78 pg hepatitis B surface antigen (HBsAg) proteins could be detected in a one-step test. In addition, the results are readable under a standard UV lamp illustration conditions. This obviates the need for complicated instrumentation, and thereby provides the possibility for the development of QDNBs based POCT devices.
Experimental
Materials
Cadmium oxide (CdO, 99.99%), trioctylphosphine oxide (TOPO, 90%), trioctylphosphine (TOP, 90%), octadecylamine (ODA, 90%), bovine serum albumin (BSA), poly(styrene-co-maleic anhydride) (PSMA) and α,ω-Bis{2-[(3-carboxy-1-oxopropyl)amino]ethyl} polyethylene glycol (COOH-PEG2k-COOH) were purchased from Sigma-Aldrich. Sulfo-N-hydroxysuccinimide (sulfo-NHS, 98.5%) and 1-ethyl-3-(3-di-methylaminopropyl) carbodiimide hydrochloride (EDC, 99%) were purchased from Thermo Scientific. Selenium (Se, 99.99%), stearic acid (SA, 99%), sulfur powder (99.9%), zinc oxide (ZnO, 99%), oleic acid (OA, 99%), liquid paraffin, sodium dodecyl sulfate, and glutathione were obtained from Sinopharm Chemical Reagent. Deactivated hepatitis B-virus surface antigen (HBsAg) and monoclonal mouse-anti-HBsAg antibody were provided by Shanghai Yemin Biotech. All the reagents were used as received without further purification.
Preparation of QDs nanobeads
CdSe/ZnSe/ZnS core/shell/shell QDs were used for QDNBs preparation, because of their improved quantum yield (QYs) and photo stability when compared to core/shell QDs [32-34]. The typical procedure of QDs synthesis was as follows. Briefly, CdSe QDs were firstly synthesized according to previously reported procedures [35, 36], in which a constant initial ratio of Cd to Se of 1:4 was used. For subsequent multi-shell coating, aliquots of Zn and Se/S precursor solutions were alternately introduced into the core QDs solution at 200 °C, starting with the Zn precursor and waiting for 20 min between each of subsequent addition. After shell coating, QDs were annealed at 260 °C for another 20 min, and then cooled to room temperature. Finally, core-shell QDs were isolated from solution with chloroform and methanol via centrifugation, washed three times, and stored in chloroform.
Preparation of QDNBs was typically performed as follows. One milliliter of chloroform solution containing PSMA (10 mg) and QDs (16 nmol) was added into 4 mL aqueous solution containing sodium dodecyl sulfate (11.5 mg). After magnetic stirring for 0.5 h at 300 rpm, the miniemulsion was prepared by ultrasonication for 100 s (10 s pulse, 10 s pause) at 50% amplitude with a sonicator (Fisher Sonic Dismembrator Model 500, USA) under ice cooling to prevent the evaporation of chloroform. Afterwards, the prepared miniemulsion was magnetically stirred at 300 rpm overnight in an open container to evaporate chloroform. The resulting nanobeads with PSMA as matrix polymer were pelleted at 12,000 rpm for 10 min and the supernatant was discarded. The pellet of nanobeads was washed with deionized water for 3 times and dried in a vacuum at room temperature.
Antibody conjugation
Covalent conjugation of antibody onto QDNBs was achieved by the classic EDC coupling reaction of carboxyl groups on the surface of QDNBs and amino groups in antibodies. Typically, QDNBs (0.2 mg) in 400 μL of PBS buffer (10 mM, pH 6.0), sulfo-NHS (500 nmol) and EDC (500 nmol) were added in to a tube, and incubated for 30 min to activate carboxyl groups. Excess crosslinkers were removed by centrifugation at 12,000 rpm for 10 min and decantation of supernatant. Then, monoclonal mouse-anti-HBsAg antibodies (120 μg) were added into activated QDNBs and the mixture was incubated at room temperature for 2 h. In order to block unreacted carboxyl groups on the surface of QDNBs, BSA (0.5 mg) was added into the tube, and incubated for another 30 min. The mixture was purified by centrifugation at 10,000 rpm for 0.5 h and washed with PBST buffer (PBS with 0.05% Tween-20) twice to remove free antibodies and small molecules. The purified QDNBs-antibody conjugates were dispersed in PBS buffer and stored at 4 ºC.
Surface modification and antibody conjugation of QDs
Water-soluble QDs prepared according to our previous report were also used for antibody conjugation [37, 38], and compared with QDNBs conjugates for protein detection. Briefly, oil-soluble QDs were transferred into water phase by replacing hydrophobic coating with glutathione (GSH) molecules containing thiol groups. To improve the colloidal stability of QDs, GSH-coated QDs were further modified with COOH-PEG2k-COOH, as per the detailed procedure described previously [37]. For antibody conjugation, carboxyl-capped PEG modified QDs were firstly activated with EDC and sulfo-NHS for 0.5 h. Then excess crosslinkers were removed using a Sephadex G-25 desalting column (GE Healthcare, USA). Monoclonal anti-HBsAg antibodies were mixed with activated QDs, incubated at room temperature for 1 h, and then BSA was added at 1% concentration to block excess activated sites. Unconjugated antibody was removed by centrifugation (20,000 rpm for 1 h) of the conjugated nanoparticles, and washed with PBST buffer for 3 times. The purified QDs-antibody conjugates were dispersed in PBS buffer and stored at 4 ºC.
Dot-blot immunoassays
The dot-blot immunoassays were performed on a hydrophobic polyvinylidenedifluoride (PVDF) membrane (Millipore Immobilon-P, USA). Double dilution of HBsAg proteins solution in PBS buffer (pH 7.4) was made in a series of tubes, and spotted on the membrane by placing a pipette tip and injecting 1 μL of antigen solution through it. After drying at room temperature for 1 h, the membrane was blocked by incubation in a solution of 5% nonfat dry milk in PBST buffer for 2 h. The blocked membrane was then incubated with fluorescent antibody conjugates in PBST buffer with 2% bovine serum albumin for 2 h and washed twice with PBST buffer.
Characterization
The morphology and size of QDNBs were analyzed with a transmission electron microscope (TEM, Hitachi-7650, Japan) at an accelerating voltage of 100 kV. The hydrodynamic diameters and size distribution of QDNBs were determined by a dynamic light scattering (DLS) system (Malvern Zetasizer Nano ZS, UK). Absorption (Ab) spectra were acquired with a UV-vis spectrophotometer (Shimadzu 2450, Japan), and fluorescent spectra were recorded on a fluorescence spectrometer (PerkinElmer LS-55, USA). Fluorescent micrographs were captured with a digital camera (Olympus DP-70, Japan) on a fluorescent microscope (Olympus BX-51, Japan) using WB mirror unit to adjust the excitation wavelength to 470-490 nm and oil immersion objective lens. The relative fluorescent intensity and intensity distribution of single QDNB were analyzed by measuring over 120 individual QDBNs from the fluorescent micrographs using Cell Sensing software (Olympus Japan). Fluorescent intensity polydispersity index (FPDI) of QDNBs was calculated using the equation FPDI = (σ/I)2, where I is the average fluorescent intensity of QDNBs, and σ is the standard deviation. Fluorescent images of dots on the PVDF membrane were recorded on a Gel Image System (Biorad ChemiDoc, USA) with 590 nm band filter under 365 nm ultraviolet lamp illuminations. The fluorescent intensity of the dot-blot immunoassay was measured by capturing fluorescent images with a CCD camera and quantified with Image Lab software (Bio-rad, USA) [39, 40]. Fourier transform infrared (FTIR) spectra of PMSA and QDNBs were respectively recorded on an FTIR spectrometer (Shimadzu 8400, Japan) using KBr pellets.
Results and Discussion
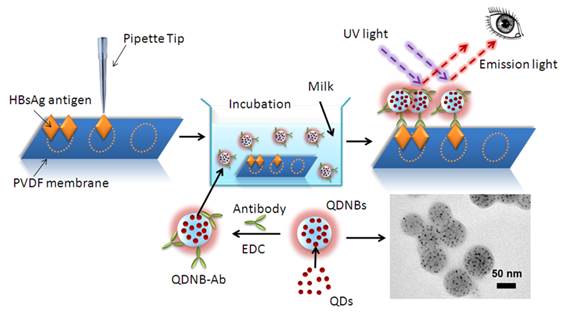
The process of QDNBs-based dot-blot immunoassay for HBsAg is illustrated in Scheme 1 (Figure A). Initially, the antigens were immobilized on a porous PVDF membrane via hydrophobic and electrostatic interactions between the negatively charged proteins and positively charged membrane. This technology is widely used for protein immobilization in protein analysis, such as western blot analysis [41, 42]. The remaining binding sites of the PVDF membrane were blocked by nonfat dry milk. QDNBs coated with carbonyl groups were prepared by emulsion-evaporation techniques [43, 44]. The prepared QDNBs were used as molecular probes through covalent immobilization of antibody onto the QDNBs surface under the activation of carbodiimide. Then, the well-blocked membranes were respectively incubated with the QDs and QDNBs bioconjugates. Compared with single QDs particle, enhanced immunoassay sensitivity with QDNBs was achieved since the increased QDs tagging amount per antibody-antigen binding event. The fluorescent dots were clearly visible on the membrane under the UV lamp illumination, and they were captured with a CCD camera. On the basis of the immunoassay with QDs or QDNBs as labels, we conclude that the immobilized proteins were able to capture antibody conjugated-particles because of the antigen-antibody interaction. Thus, the more proteins spotted on the membrane, the greater number of particles that will accumulate on the spot, and the fluorescent intensity of the spots is thus dependent on the concentration of proteins.
(Scheme 1). Schematic illustration of fluorescent detection of HBsAg proteins by dot-blot immunoassay with QDNBsantibody conjugates.
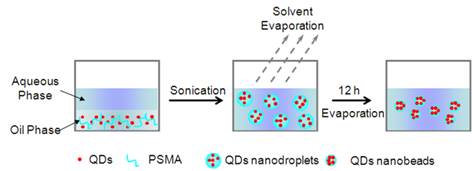
Fluorescent nanobeads encapsulated with QDs were prepared by an oil-in-water (o/w) emulsion-evaporation technique, which is commonly used for the preparation of nano-drug delivery systems. Poly(styrene-co-maleic anhydride) (PSMA) was selected as the matrix material for nanobeads because it is initially oil soluble and then can be transferred into a charged hydrophilic surface after nanobeads formation [45]. In Scheme 2 (Figure B), the oil-soluble QDs and polymers dissolved in chloroform were used as the dispersed phase, and added into the continuous phase. Subsequently, an o/w miniemulsion was formed with stirring and ultrasonication. At this point, solvent in the obtained minidroplets containing both QDs and polymer equilibrated between aqueous phase and oil phase. Gradual removal of chloroform from the aqueous phase by evaporation was compensated by transferring of chloroform from the minidroplets to the aqueous phase. Finally, the polymer precipitated into the form of nanobeads and entrapped QDs nanoparticles inside polymer nanobeads.
(Scheme 2). Schematic illustration of QDs encapsulation into PSMA nanobeads by miniemulsion and solvent evaporation techniques.
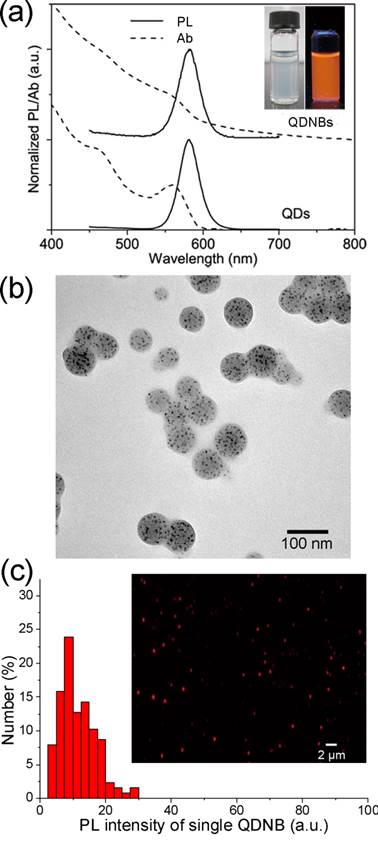
The optical properties of the resultant QDNBs were characterized by UV-vis absorption and fluorescence spectroscopy. As shown in Figure 1a, the absorption peak of QDNBs is broader than that of the bare QDs because of the light scattering introduced by the composite particles. However, the first excitonic transition of QDs is still nearly identical. Additionally, the fluorescent spectrum of QDNBs maintains identical to that of the bare QDs, which implies that the QD particles were well isolated from each other inside the nanobeads. The photos of QDNBs solutions under room light and UV illumination (inset in Figure 1a) and fluorescent micrograph (Figure 1c) showed that the prepared QDNBs were well dispersed in aqueous suspension and they were highly fluorescent under UV illumination. The obtained fluorescent intensity distribution (FPDI = 0.221) of single QDNBs is larger than the size distribution, which is largely attributed to uneven distribution of QDNBs on the focal plane of microscope. TEM images (Figure 1b) showed that the morphology of QDNBs was nearly spherical and was fairly monodispersed; this could facilitate their further application as biomolecular beacons. Additionally, the successful encapsulation of QDs into PSMA nanobeads is readily visible in the TEM image of QDNBs, where QDs were evenly dispersed in each nanobead. Well dispersing of QDs inside nanobeads is critical for obtaining highly fluorescent QDNBs. Anhydride groups on the surface of QDNBs are sufficiently active to be hydrolyzed when dispersed in water. From the FTIR spectra of PMSA and QDNBs in Supplementary Material: Figure S2, the absorption peak around 1720 cm-1 in QDNBs was assigned to stretching vibrations of C=O in carboxyl groups. In contrast, the characteristic stretching vibrations peaks of C=O in cyclic anhydride are around 1857 and 1780 cm-1.
(a) Normalized absorption and fluorescent spectra of QDs and QDNBs. Inset in (a) shows the aqueous solution of QDNBs under room light (left) and UV light (right). (b) TEM micrographs of QDNBs. (c) The fluorescent intensity distribution and epifluorescent micrographs (inset) of prepared QDNBs.
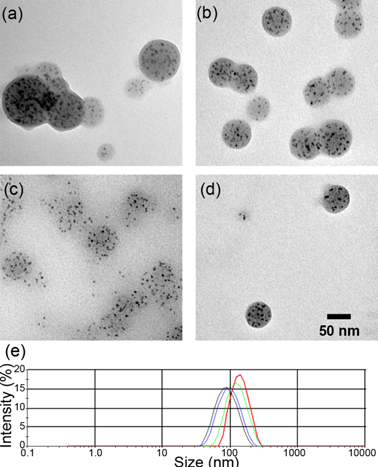
The particle size of QDNBs can be controlled through adjustment of the polymer concentration in the oil phase (Table 1). The average diameter of QDNBs measured from TEM images (Figure 2) is in the range of 86.4 to 51.3 nm. In addition to TEM analysis, the hydrodynamic diameter and size distribution of QDNBs aqueous dispersion were also investigated with a DLS system. As shown in Figure 2e, the Z-average hydrodynamic diameters of QDNBs determined by DLS were slightly larger than those obtained from TEM images. The polydispersity index (PDI) of prepared QDNBs size distribution measured by DLS was ≤ 0.1, suggesting that the size distribution of QDNBs is narrow. Finally, QDNB2 was chosen for further antibody conjugation because of its relatively narrow size distribution and spherical morphology.
Influence of polymer and QD concentration on the properties of QDNBs.
| NO. | [QDs] (µM)a | [polymer] (mg/mL)a | TEM diameter (nm) | DLS diameter (nm) | PDI | NsQDNB (QDs/Bead) |
|---|---|---|---|---|---|---|
| QDNB1 | 8.0 | 10 | 86.4 | 134.4 | 0.063 | 1238.4 |
| QDNB2 | 4.0 | 5 | 74.2 | 118.4 | 0.096 | 841.5 |
| QDNB3 | 2.0 | 2.5 | 63.6 | 91.82 | 0.100 | 529.9 |
| QDNB4 | 1.0 | 1.25 | 51.3 | 83.41 | 0.105 | 278. 1 |
aPolymer and QDs concentration in the oil phase. The aqueous phase consists of 1% SDS, and oil/water phase volume ratio is 1:6. The amplitude of the sonicator was set at 50%, the sonication cycle was 10 s sonication, 10 s pause, and repeat for 10 times. NsQDNB is the number of QDs in each nanobead.
Typical TEM images (a-d respectively corresponding to QDNB 1-4) and DLS size plots (d Line red: QDNB1; green: QDNB2, blue: QDNB3; black: QDNB4) of QDNB prepared under different conditions.
Our probes have the following advantages over previously detection methodologies [28-31]. First, the one-step fabrication is simple and mild with solvent evaporation technique, and in contrast to polymerization methods the process has little influence on the fluorescent properties of QDs [46, 47]. More importantly, the QDs are well dispersed inside polymer nanobeads. The polymer matrix material not only prevents QDs from self-aggregation, but also protects the fragile optical properties of QDs from environments perturbation. The functional groups provided by the polymer matrix also facilitate the conjugation of biomolecules to the probes. Finally, by the encapsulation of several QDs into one nanobead as a single probe, the reporting signal of each binding event can be directly amplified, without the need for additional signal-enhancing steps.
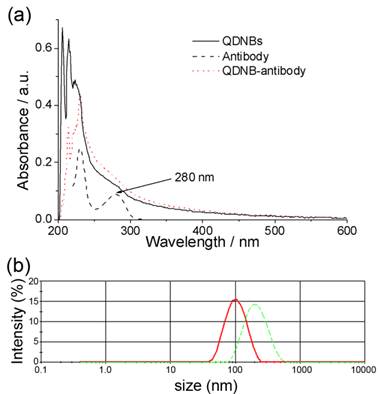
Anti-HBsAg antibodies were covalently immobilized on carboxyl-capped QDNBs via the EDC/NHS strategy. After conjugation, the obtained bioconjugates were purified by centrifugation and washing steps. Comparison of the UV-vis absorption spectra of bare QDNBs and QDNBs-antibody conjugates, as shown in Figure 3a, suggests that the increased absorption intensity around 280 nm is due to the presence of IgG molecules in the conjugates. Further, according to the DLS results (Figure 3b), the hydrodynamic size of the composite particles obtained after the conjugation reaction increased by 94 nm in comparison with the bare particles. More importantly, the particle size distribution of conjugated QDNBs remains almost monodispersed and no additional light scattering peaks of particles appeared. This homogeneous increase of particle size also indicates that antibodies were immobilized on the surface of nanobeads, and no unwanted agglomeration of the nanobeads occurred during the conjugation process.
(a)UV-vis absorption spectra of QDNBs (solid line), antibody (dash line), and QDNB-antibody conjugates (dot line). (b) DLS plots of QDNBs (solid line) and after conjugating with antibody (dash line).
The number of antibodies conjugated per nanoparticle (N) was calculated (described in Supporting Information). For conjugation of antibody onto QDs, the feed ratio of IgG to nanoparticles was 4:1. The corresponding conjugation efficiency and yield were determined and the results are listed in Supplementary Material: Figure S4. The average number of IgG antibody attached on each QDs was 0.45, consistent with previous report [48]. The average numbers of IgG anchored on QDNBs conjugates, with feed ratios of IgG to QDNBs 50:1, 100:1 and 200:1, respectively were 35.8, 38.1, and 59.6. This result reflected the fact that a greater number of IgG molecules can be conjugated on QDNBs nanoparticles, largely due to the bigger size of QDNBs compared with single QDs. Increasing the number of antibodies attached on the surface of nanoparticles may improve the biological affinity of nanoparticles, and potentially improve the detection sensitivity of immunoassay [49]. Additionally, the signal of each antigen-antibody binding event can be amplified by the larger size of QDNBs containing several QDs in one particle and more antibodies anchored on QDNBs.
In a comparision with the bare QDs probes, the fluorescent dot-blot immunoassay was first demonstrated using QDs-antibody conjugates as the label. The insert in Figure 4a shows that the intensity of the fluorescent spots increased proportionally as the level of HBsAg proteins on the PVDF membrane increase. As the level of HBsAg decreases, the fluorescent intensity of the spot is reduced until no fluorescence can be distinguished from the background membrane fluorescence (i.e., when 1.56ng or less of HBsAg is spotted). Furthermore, the levels of proteins on each spot can be quantified using Image Lab software (Biorad, USA). The fluorescent intensity of each spot was calculated using the same size region of interest, and the background intensity was subtracted from each measurement. The quantification is plotted, in which the relationship between fluorescent intensity and the proteins levels is evident. The analytical sensitivity of assay, calculated from the concentration corresponding to 3 times of the standard deviation (SD) of the background signal [50, 51], is 1.72 ng.
Dot-blot immunoassay for fluorescent detection of HBsAg with (a) QDs and (b) QDNB conjugates for different levels of antigen proteins. The levels of HBsAg proteins potted on membrane (a) and (b) were 2-fold dilutions starting at 50 and 5 ng, respectively. Corresponding fluorescent intensity as a function of the level of HBsAg proteins detected with QDs and QDNBs as labels. The error bars are standard deviations (n = 3).
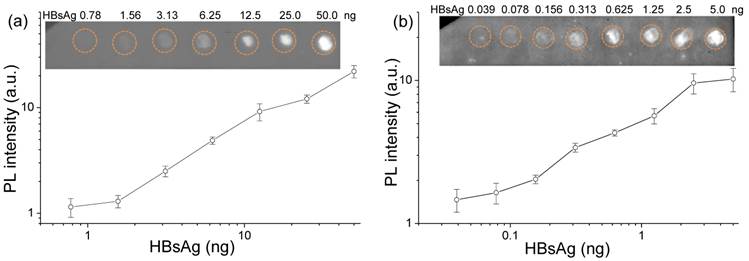
To improve the detection sensitivity, QDNBs-antibody bioconjugates were employed as a reporter by another dot-blot immunoassay group. The dot images are presented in Figure 4b, and are quantifiable even when the level of HBsAg is as little as 0.078 ng. The analytical sensitivity of assay determined from 3×SD of background is 0.133 ng, which is one order lower than the assay in which QDs are used as the label. The detection curve for HBsAg is shown in Figure 4b, revealing the dynamic range of the assay ranges from 0.133 to 2.5 ng. The above studies provide experimental evidence that QDNB-conjugates outperform their single QD counterparts in terms of improved detection sensitivity. Theoretically, the amount of nanoparticle label binding is proportional to the amount of antigen immobilized on PVDF membrane. However, due to the steric hindrance of nanoparticles, a lower number of larger nanoparticles are bound to the immobilized antigen when compared to smaller nanoparticles. Thus, the upper detection limit of dot-blot immunoassay when QDNBs are used as labels is lower than that of the QD-based dot-blot immunoassay.
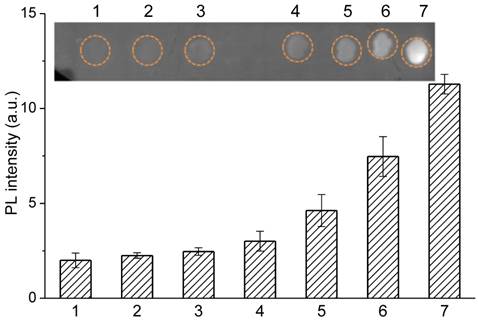
Moreover, control experiments were carried out to analyze the selectivity and specificity of the immunoassay for the detection of bovine serum albumin (BSA) and healthy human serum, as shown from dots 1 to 3 in Figure 5. No fluorescence signal was detected when QDNB-antibody probes were incubated with background proteins, indicating almost no nonspecific binding occurred. In order to evaluate the detection ability of QDNBs conjugates in complex biological samples, a dot blot immunoassay was conducted with HBsAg proteins dispersed in 1% healthy human serum. Subsequently, 1 µL of the complex mixture of proteins were immobilized on the PVDF membrane, and then incubated with QDNBs bioconjugates. The fluorescent intensity of spots with HBsAg proteins increased proportionally with the concentration of HBsAg, suggesting that the dot-blot immunoassay can be used to detect relevant samples in a complex protein mixture.
Dot-blot immunoassay for fluorescent detection of HBsAg in 1% human serum and the control samples. Control experiments were carried out on 1, 2 and 3 dots with 10% serum, 1% serum and 0.1% BSA, respectively. The levels of HBsAg in 1% human serum from 4 to 7 respectively are 0.313, 0.625, 1.25 and 2.5ng.
Conclusion
In conclusion, we have developed a simple and sensitive fluorescent detection for proteins by using a dot-blot immunoassay with QD nanobeads as a signal amplification strategy. The uniform nanobeads incorporated with QDs were fabricated by a simple oil-water emulsion-evaporation technique. The new material was successfully developed as a proteins detector by covalent immobilization of antibody on nanobeads. Compared with the detection sensitivity using QD antibody bioconjugates, the detection limit of the immunoassay using QDNBs was greatly improved, and it could detect as little as 0.078 ng of the antigen. Furthermore, the fluorescent immunoassay that we developed can be used to detect proteins in complex biological samples and thus it has the potential for the development of diagnostic reagents.
Supplementary Material
Figs. S1 - S7, Table S1.
Acknowledgements
This study was supported by funds from Shanghai STCSM Project (no. 09441900700, 10dz1910302 and 11DZ1921805), and International Science & Technology Cooperation Program of China (no. S2014ZR0042). P.-F. Zhang would like to acknowledge the support from Shanghai Upper Bio-Tech Pharma Co. Ltd and the helpful discussion with Yitao Long in ECUST.
Competing Interests
The authors have declared that no competing interest exists.
References
1. Burbelo PD, Issa AT, Ching KH, Cohen JI, Iadarola MJ, Marques A. Rapid, Simple, Quantitative, and Highly Sensitive Antibody Detection for Lyme Disease. Clin Vaccine Immunol. 2010;17:904-9
2. Rica dlR, Stevens MM. Plasmonic ELISA for the ultrasensitive detection of disease biomarkers with the naked eye. Nat Nanotechnol. 2012;7:821-4
3. Klostranec JM, Xiang Q, Farcas GA, Lee JA, Rhee A, Lafferty EI. et al. Convergence of Quantum Dot Barcodes with Microfluidics and Signal Processing for Multiplexed High-Throughput Infectious Disease Diagnostics. Nano Lett. 2007;7:2812-8
4. Tang S, Hewlett I. Nanoparticle-based immunoassays for sensitive and early detection of HIV-1 capsid (p24) antigen. J Infect Dis. 2010;201:S59-S64
5. Wasley A, Kruszon-Moran D, Kuhnert W, Simard EP, Finelli L, McQuillan G. et al. The Prevalence of Hepatitis B Virus Infection in the United States in the Era of Vaccination. J Infect Dis. 2010;202:192-201
6. Villar LM, Oliveira dJC, Cruz HM, Yoshida CFT, Lampe E, Lewis-Ximenez LL. Assessment of dried blood spot samples as a simple method for detection of hepatitis B virus markers. J Med Virol. 2011;83:1522-9
7. Apple FS, Murakami MM, Ler R, Walker D, York M. et al. Analytical Characteristics of Commercial Cardiac Troponin I and T Immunoassays in Serum from Rats, Dogs, and Monkeys with Induced Acute Myocardial Injury. Clin Chem. 2008;54:1982-9
8. Mueller T, Gegenhuber A, Poelz W, Haltmayer M. Comparison of the Biomedica NT-proBNP Enzyme Immunoassay and the Roche NT-proBNP Chemiluminescence Immunoassay: Implications for the Prediction of Symptomatic and Asymptomatic Structural Heart Disease. Clin Chem. 2003;49:976-9
9. Lequin RM. Enzyme Immunoassay (EIA)/Enzyme-Linked Immunosorbent Assay (ELISA). Clin Chem. 2005;51:2415-8
10. Rennard SI, Berg R, Martin GR, Foidart JM, Robey PG. Enzyme-linked immunoassay (ELISA) for connective tissue components. Anal Biochem. 1980;104:205-14
11. Madhusudana SN, Paul JPV, Abhilash VK, Suja MS. Rapid diagnosis of rabies in humans and animals by a dot blot enzyme immunoassay. Int J Infect Dis. 2004;8:339-45
12. Wang C, Liu D, Wang Z. Gold nanoparticle based dot-blot immunoassay for sensitively detecting Alzheimer's disease related β-amyloid peptide. Chem Commun. 2012;48:8392-4
13. Jana NR, Ying JY. Synthesis of Functionalized Au Nanoparticles for Protein Detection. Adv Mater. 2008;20:430-4
14. Zhang Y, Wang T-H. Quantum Dot Enabled Molecular Sensing and Diagnostics. Theranostics. 2012;2:631-54
15. Medintz IL, Uyeda HT, Goldman ER, Mattoussi H. Quantum dot bioconjugates for imaging, labelling and sensing. Nat Mater. 2005;4:435-46
16. Han MY, Gao XH, Su JZ, Nie SM. Quantum-dot-tagged microbeads for multiplexed optical coding of biomolecules. Nat Biotechnol. 2001;19(7):631-5
17. Li DW, Qin LX, Li Y, Nia RP, Long YT, Chen HY. CdSe/ZnS quantum dot-Cytochrome c bioconjugates for selective intracellular O2- sensing. Chem Commun. 2011;47:8539-41
18. Ma W, Qin LX, Liu FT, Gu Z, Wang J, Pan ZG. et al. Ubiquinone-quantum dot bioconjugates for in vitro and intracellular complex I sensing. Sci Rep-UK. 2013;3:1537
19. Wu X, Liu H, Liu J, Haley KN, Treadway JA, Larson JP, Ge N, Peale F, Bruchez MP. Immunofluorescent labeling of cancer marker Her2 and other cellular targets with semiconductor quantum dots. Nat Biotechnol. 2002;21(1):41-6
20. Yang J, Dave SR, Gao X. Quantum Dot Nanobarcodes: Epitaxial Assembly of Nanoparticle- Polymer Complexes in Homogeneous Solution. J Am Chem Soc. 2008;130(15):5286-92
21. Zhao Y, Chen W, Peng C, Liu L, Xue F, Zhu S, Kuang H, Xu C. Facile preparation of fluorescence-encoded microspheres based on microfluidic system. J Colloid Interf Sci. 2010;352(2):337-42
22. Zhao Y, Hao C, Ma W, Yong Q, Yan W, Kuang H, Wang L, Xu C. Magnetic Bead-Based Multiplex DNA Sequence Detection of Genetically Modified Organisms Using Quantum Dot-Encoded Silicon Dioxide Nanoparticles. J Phys Chem C. 2011;115(41):20134-40
23. Kuang H, Zhao Y, Ma W, Xu L, Wang L, Xu C. Recent developments in analytical applications of quantum dots. TrAC-Trends Anal Chem. 2011;30(10):1620-36
24. Lei J, Ju H. Signal amplification using functional nanomaterials for biosensing. Chem Soc Rev. 2012;41:2122-34
25. Liu H, Wu X, Zhang X, Burda C, Zhu J-J. Gold Nanoclusters as Signal Amplification Labels for Optical Immunosensors. J Phys Chem C. 2011;116:2548-54
26. Liu C, Jia Q, Yang C, Qiao R, Jing L, Wang L. et al. Lateral Flow Immunochromatographic Assay for Sensitive Pesticide Detection by Using Fe3O4 Nanoparticle Aggregates as Color Reagents. Anal Chem. 2011;83:6778-84
27. Choi DH, Lee SK, Oh YK, Bae BW, Lee SD, Kim S. et al. A dual gold nanoparticle conjugate-based lateral flow assay (LFA) method for the analysis of troponin I. Biosens Bioelectron. 2010;25:1999-2002
28. Qian J, Zhang C, Cao X, Liu S. Versatile Immunosensor Using a Quantum Dot Coated Silica Nanosphere as a Label for Signal Amplification. Anal Chem. 2010;82:6422-9
29. Yuan L, Hua X, Wu Y, Pan X, Liu S. Polymer-Functionalized Silica Nanosphere Labels for Ultrasensitive Detection of Tumor Necrosis Factor-alpha. Anal Chem. 2011;83:6800-9
30. Chen W, Xu D, Liu L, Peng C, Zhu Y, Ma W. et al. Ultrasensitive Detection of Trace Protein by Western Blot Based on POLY-Quantum Dot Probes. Anal Chem. 2009;81:9194-8
31. Dong H, Yan F, Ji H, Wong DKY, Ju H. Quantum-Dot-Functionalized Poly(styrene-co-acrylic acid) Microbeads: Step-Wise Self-Assembly, Characterization, and Applications for Sub-femtomolar Electrochemical Detection of DNA Hybridization. Adv Funct Mater. 2010;20:1173-9
32. Talapin DV, Mekis I, Gotzinger S, Kornowski A, Benson O, Weller H. CdSe/CdS/ZnS and CdSe/ZnSe/ZnS Core Shell Shell Nanocrystals. J Phys Chem B. 2004;108:18826-31
33. Kim JI, Lee JK. Sub-kilogram-Scale One-Pot Synthesis of Highly Luminescent and Monodisperse Core/Shell Quantum Dots by the Successive Injection of Precursors. Adv Funct Mater. 2006;16:2077-82
34. Fitzmorris BC, Pu YC, Cooper JK, Lin YF, Hsu YJ, Li Y, Zhang JZ. Optical Properties and Exciton Dynamics of Alloyed Core/Shell/Shell Cd1-xZnxSe/ZnSe/ZnS Quantum Dots. ACS Appl Mater Inter. 2013;5:2893-900
35. Xing B, Li W, Dou H, Zhang P, Sun K. Systematic Study of the Properties of CdSe Quantum Dots Synthesized in Paraffin Liquid with Potential Application in Multiplexed Bioassays. J Phys Chem C. 2008;112:14318-23
36. Xie R, Kolb U, Li J, Basché T, Mews A. Synthesis and Characterization of Highly Luminescent CdSe-Core CdS/Zn0.5Cd0.5S/ZnS Multishell Nanocrystals. J Am Chem Soc. 2005;127:7480-8
37. Zhang P, Han H. Compact PEGylated polymer-caged quantum dots with improved stability. Colloid Surface A. 2012;402:72-9
38. Zhang P-F, Jie S, Jia C, Lu H-Q, Han H-X. Study on Conjugation of Quantum Dot with Anti-Hepatitis B Surface Antigen Antibody. Chinese J Anal Chem. 2013;41:846-50
39. Gilda JE, Gomes AV. Stain-Free total protein staining is a superior loading control to β-actin for Western blots. Anal Biochem. 2013;440(2):186-8
40. Hawkes WC, Alkan Z. Delayed Cell Cycle Progression in Selenoprotein W-depleted Cells Is Regulated by a Mitogen-activated Protein Kinase Kinase 4-p38/c-Jun NH2-terminal Kinase-p53 Pathway. J Biolog Chem. 2012;287:27371-9
41. Burnette WN. “Western Blotting”: Electrophoretic transfer of proteins from sodium dodecyl sulfate-polyacrylamide gels to unmodified nitrocellulose and radiographic detection with antibody and radio iodinated protein A. Anal Biochem. 1981;112(2):195-203
42. Bakalova R, Zhelev Z, Ohba H, Baba Y. Quantum Dot-Based Western Blot Technology for Ultrasensitive Detection of Tracer Proteins. J Am Chem Soc. 2005;127(26):9328-9
43. Mistlberger G, Medina-Castillo A, Borisov S, Mayr T, Fernández-Gutiérrez A, Fernandez-Sanchez J. et al. Mini-emulsion solvent evaporation: a simple and versatile way to magnetic nanosensors. Microchim Acta. 2011;172:299-308
44. Yin W, Liu H, Yates MZ, Du H, Jiang F, Guo L. et al. Fluorescent Quantum Dot-Polymer Nanocomposite Particles by Emulsification/Solvent Evaporation. Chem Mater. 2007;19:2930-6
45. Zhang P, He Y, Ruan Z, Chen FF, Yang J. Fabrication of quantum dots-encoded microbeads with a simple capillary fluidic device and their application for biomolecule detection. J Colloid Interf Sci. 2012;385:8-14
46. Fleischhaker F, Zentel R. Photonic Crystals from Core-Shell Colloids with Incorporated Highly Fluorescent Quantum Dots. Chem Mater. 2005;17:1346-51
47. Joumaa N, Lansalot M, Théretz A, Elaissari A, Sukhanova A, Artemyev M. et al. Synthesis of Quantum Dot-Tagged Submicrometer Polystyrene Particles by Miniemulsion Polymerization. Langmuir. 2006;22:1810-6
48. Smita P, Davidson MC, Silva GA. Characterization of the functional binding properties of antibody conjugated quantum dots. Nano Lett. 2007;7(7):1839-45
49. Tero S, Härmä H, Paukkunen J, Lövgren T. Utilization of kinetically enhanced monovalent binding affinity by immunoassays based on multivalent nanoparticle-antibody bioconjugates. Anal Chem. 2001;73(10):2254-60
50. Rundström G, Jonsson A, Mårtensson O, Mendel-Hartvig I, Venge P. Lateral Flow Immunoassay Using Europium (III) Chelate Microparticles and Time-Resolved Fluorescence for Eosinophils and Neutrophils in Whole Blood. Clin Chem. 2007;53:342-8
51. Swanson C, D'Andrea A. Lateral Flow Assay with Near-Infrared Dye for Multiplex Detection. Clin Chem. 2013;59:641-8
Author contact
![]() Corresponding author: hanhuanxingcom
Corresponding author: hanhuanxingcom