Impact Factor
- Issue 14; 2026
- Issue 13; 2026
- Issue 12; 2026
- Issue 11; 2026
- Issue 10; 2026
- Volume 16; 2026
- Advance Articles
- Past Issues
- Cover Images
- Cover Suggestion
- Index & Coverage
- Special Issues
Introduction
Materials and methods
Results and Discussion
Conclusion
Supplementary Material
Acknowledgements
References
International Journal of Biological Sciences
International Journal of Medical Sciences
 Global reach, higher impact

Theranostics 2015; 5(1):62-70. doi:10.7150/thno.10145 This issue Cite
Research Paper
An Array-Based Approach to Determine Different Subtype and Differentiation of Non-Small Cell Lung Cancer
Chao Li1*, Yucai Yang2*, Luming Wei1, Xiaoying Wang3, Zhaoxia Wang2 ![]() , Yongmei Yin3
, Yongmei Yin3 ![]() , Genxi Li1
, Genxi Li1 ![]()
1. State Key Laboratory of Pharmaceutical Biotechnology, Department of Biochemistry,Nanjing University, Nanjing 210093, China
2. Department of Oncology, The Second Affiliated Hospital of Nanjing Medical University, Nanjing 210011, China
3. Department of Oncology, The First Affiliated Hospital of Nanjing Medical University, Nanjing 210029, China
* These two authors contributed equally.
Received 2014-7-19; Accepted 2014-9-16; Published 2015-1-1
Abstract

Simple and accurate methods of discriminating subtype or differentiation of human tumor are critical for designing treatment strategies and predicting disease prognosis, and the currently used method to determine the two important factors mainly depends on histological examination by microscopy observation, which is laborious, highly trained operator required, and prone to be disruptive due to individual-to-individual judgment. Here we report a novel array-based method based on the interaction of graphene oxide (GO) and single-strand DNA modified gold nanoparticles (ssDNA-AuNPs) to distinguish between different subtypes and grades of tumors through their overall intracellular proteome signatures. Strategically, we first select eight proteins at 0.5 nM concentration in buffer or 10 nM in human serum to verify the discriminant ability of our method, then choose adenocarcinoma and squamous-cell carcinoma that account for 90% non-small cell lung cancer, as well as their respective three tumor grades as model system to provide a realistic testing ground for clinical cancer analysis. Consequently, total differentiation between different subtype and grade of tumor tissues has been achieved with as little as 100 ng of intracellular protein, suggesting the high sensitivity and selectivity of this sensor array. Overall, this array-based approach may provide the possibility for unbiased and simplified personalized tumor classification diagnostics in the future.
Keywords: array-based sensor, gold nanoparticle, graphene, protein classification, tumor tiusse
Introduction
The use of nanomaterials for analytical science has catalyzed the development of novel strategies for detecting biomacromolecules. Combining nanomaterials with recognition molecules such as monoclonal antibody [1-6], DNA aptamer [7-12], and small peptide [13-16], some biomarker proteins can be analyzed in small quantities. However, the reported methods are limited to the selection of certain disease-related molecules and corresponding ligands. Moreover, when an assay involves complex analytes (cells or tissues) that do not always express unique biomarkers or require several targets to analysis, the measurement has to be further complicated by coupling multiple sophisticated instruments and complex operational procedures.
Array-based biosensor that uses differential binding interactions with a set of selective receptors may provide a powerful tool for discriminating subtly different targets and preclude the use of specific biomarkers or ligands. In this study, we demonstrate that different single strand DNA modified gold nanoparticles (ssDNA-AuNPs) can be precipitated by graphene oxide (GO) with controllable affinities because of the π-stacking interaction between the DNA shell of the AuNPs and the surface of GO [17,18], while the introduction of certain proteins can differentially accelerate or slow the formation of the aggregate. Motivated by these observations, here we present a novel array-based approach that can discriminate different species of protein molecules at sub-nanomolar level and further be successfully used to classify subtype [adenocarcinoma (Ade) and squamous-cell carcinoma (SCC)] as well as differentiated degree of non-small cell lung cancer (NSCLC). Our choice to take NSCLC for example is based on its major form of lung cancer (about 85% of all lung cancers) [19,20] and accurate tumor classification can provide the foundation for tumor diagnosis and a critical basis for determining management.
In our system, both of DNA-AuNPs and GO are full of functional groups, which can provide a number of intermolecular forces, including hydrogen bonding attraction, electrostatic interaction, hydrophobic force, DNA base stacking, and chemical bonding [21]. Therefore, it is reasonable to consider that these characteristics will provide these elements for selective binding properties and hence differential interactions with different targets. In addition, the ultrahigh extinction coefficient of AuNPs and the efficient cross-linking effect of AuNPs on GO endows the method excellent sensitivity. On the other hand, different subtype and differentiated degree of NSCLC may have its unique intracellular proteome signature [22-24], so one may predict that such proteome profiles difference might be detected by an array-based sensor that relies on selective interactions between multiple reporter elements and the analytes. More importantly, the utilization of sensor array to discriminate between tissue lysates would minimize the influence of person-to-person deviation upon observation by light microscopy. Overall, we demonstrate for the first time the utility of array based strategy using functionalized nanomaterials for human tumors classification, providing a promising tool for NSCLC diagnostics.
Materials and methods
Materials
All of the oligonucleotides were synthesized and purified by TaKaRa Inc. (Dalian, China). Bovine serum albumin (BSA), cytochrome c (Cyto), hemoglobin (Hb), lysozyme (Lyso,), horseradish peroxidase (HRP), myoglobin (Mb) transferrin (Tf) and thrombin (Th) were purchased from Sigma. HAuCl4•3H2O was obtained from Sinopharm Chemical Reagent Co. Ltd. (Shanghai, China). Graphene oxide was purchased from Nanjing XFNano Materials Tech Co. Ltd. (Nanjing, China). Other chemicals used in this work were of analytical grade and directly used without additional purification.
Nanoparticle Synthesis
Nanoparticles were synthesized following previous reports [18]. Citrate-capped GNPs with an average diameter of 13 nm were synthesized by the citrate reduction method. The procedures are briefly described as follows: trisodium citrate (5 mL, 38.8 mM) was added rapidly to boiling solution of HAuCl4 (50 mL, 1 mM) with fierce stirring. Within 1 min, the color of the solution changed from pale yellow to deep red. The solution was boiled while stirring for another 30 min to ensure complete reaction, and was slowly cooled to room temperature for use. The DNA-modified GNPs were synthesized by incubating the as-prepared GNPs colloid with activated DNA (the final concentrations is 3 μM) at room temperature for 16 h. After that, the mixture was aged with 0.1 M NaCl through a stepwise process, and “ageing” lasted at room temperature for another 24 h. To remove the excess DNA, the solution was centrifuged for 30 min at 13500 rpm. The red oily precipitate was washed, re-centrifuged, and then dispersed in 1 mL solution (20 mM Tris-HCl buffer with 100 mM NaCl at pH 7.2). The solution was stored at 4 °C when not in use.
Histopathology
The tissues of patients were obtained from Nanjing Medical University. Written informed consent was obtained from all donors prior to the study, and the study was approved by the ethics committee of Nanjing University and Nanjing Medical University, China. To present the subtypes and degrees of differentiations of different patient samples, collected tissues were processed and paraffin embedded before sectioning (5 μm) and staining with H&E. Representative histological images were recorded with a charge-coupled device (CCD) digital camera fixed to a microscope.
Preparation of the Lysates
Tissue homogenates (10% w/v) were prepared in lysis buffer (Beyotime Institute of Biotechnology, plus a tablet of complete protease inhibitor cocktail). Next, whole tissue lysates were centrifuged for 15 min at 14 000 rpm (4 °C), and the supernatants were used for protein quantification and further sensing experiments.
Absorbance titration
In the absorbance titration experiment, UV-Vis spectra were collected using UV-vis spectroscopy (UV 2450, Shimadzu, Japan). During the titration, the initial spectrum was measured for ssDNA-AuNPs elements (NP1-NP6, 3.7 nM) at 520 nm. Aliquots of a solution of GO (0.5 mg/mL) were subsequently added to the solution of each receptors. After each addition, an absorption spectrum was recorded at room temperature (25 °C). The Stern-Volmer binding constant (Ks-v) as well as the nanoparticle effective footprint using a calculation model in which assuming that GO was absolutely dispersed and had independent binding sites with each ssDNA-AuNPs.
Sensing Studies
For performing the array-based sensor, ssDNA-AuNPs (NP1-NP6) and GO were diluted with Tris-HCl (pH 7.4). Then, each NPs elements were incubation with GO, and the final concentrations of ssDNA-AuNPs elements and GO were 3.7 nM and 10 μg/mL, respectively. After incubation of 1 h, the supernatants without precipitation (200 μL of each well) were carefully loaded into a 96-well microplate (Corining Inc., America). The initial absorption intensifies (A0) were measured by Safire microplate reader (Tcan, Austria) at 520 nm. While in the presence of analytes, GO and kinds of analytes were simultaneously introduced into each sensor elements, and the absorption intensities (A) were recorded after incubation of 1 h. The difference between the A0 and A of each analytes was used as the absorbance response. Finally, the raw data matrix was subjected using linear discriminant analysis (LDA) in Xlstat (version 2010).
Results and Discussion
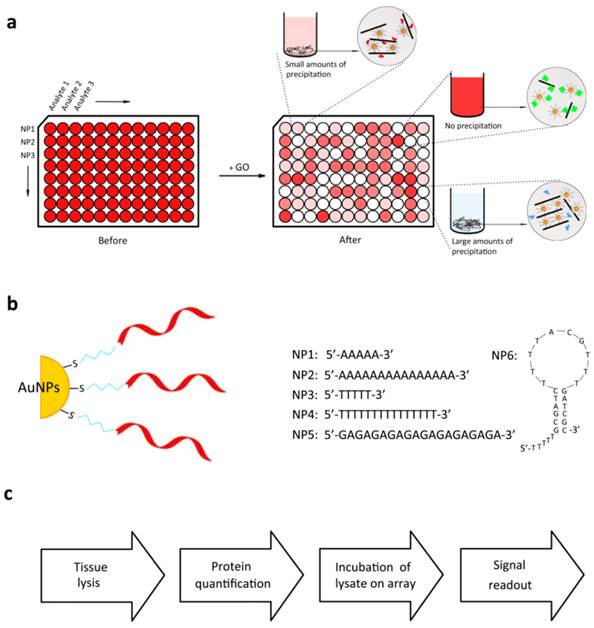
Figure 1a may illustrate the principle of our method. The detection mechanism of our strategy is based on our previous finding that ssDNA-AuNPs (core diameter ∼13 nm) can cross-link different layers of GO to form a soft complex. On the other hand, as is reported by the colleagues, when nanomaterials such as AuNPs or GO are exposed to biological fluids via in vitro or in vivo incubation, they easily interact with proteins to form a biological coating (protein corona) on the nanomaterials, which dictates the physical properties and chemical response of nanomaterials [25-28]. In this work, we use six kinds of AuNPs prepared by decorating with different ssDNA sequences (NP1-NP6) as sensor elements (Figure 1b). These nanoparticles can provide an appropriate scaffold for the selective sensor array, which may hold controllable binding affinities to GO owing to simple and tunable variation of the DNA length, sequence, and secondary structure. Once corresponding tissue lysates are introduced, the cellular proteins adsorb to the AuNPs or GO surface and affect the interaction between GO and DNA shell of AuNPs, causing concomitant alternation in aggregate efficiency. The differential interactions between various cellular proteins in the lysates and ssDNA-AuNPs or GO will generate colorimetric patterns characteristic of the different tumor tissues, thus enabling us to discern between the tumor subtypes based on these lysate composition.
Modes of sensor response and different DNA shell modified NPs. (a) Scheme illustration of different binding events between ssDNA-AuNPs and GO arising from protein corona of nanomaterials. (b) DNA sequences of the AuNPs used in this study. Due to the differential binding affinities of DNA bases to GO (G > A > C > T), it is reasonable to design a set of DNA sequences as sensor receptors. (c) Overall flow diagram of analysis trial.
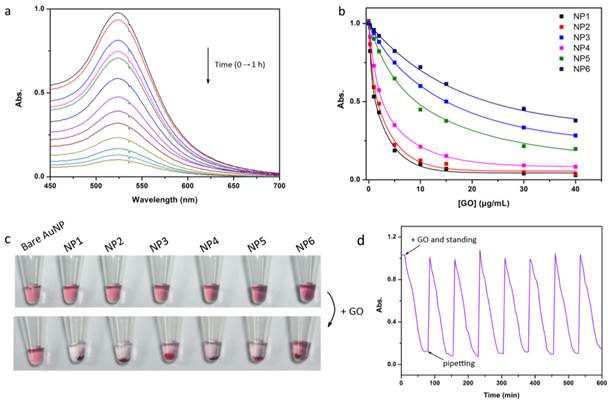
Absorption titrations of these sensor probes have been performed in the presence of GO (Figure 2). As a general trend (Figure 2b), adenine-containing probes modified AuNPs (NP1 and NP2) have higher affinity for GO than thymine-containing ones (NP3 and NP4), which are consistent with the previously reported binding affinities of DNA bases to GO [21]. Meanwhile, NP5 and NP6 indicate that the overlong sequence and the secondary structure modified AuNPs are unfavorable for their adsorption onto GO. Taken together, the affinity of DNA-AuNPs to GO is sensitively dependent on the sequence and structural diversity. The Stern-Volmer binding constants (Ks-v) and the effective DNA-AuNPs footprint (β), which may provide quantitative parameters of the interactions between AuNPs and GO, have been obtained by nonlinear least-squares curve-fitting analysis. The variation in complex stabilities and the footprint have demonstrated the significant effect of DNA sequence on NPs-GO affinity (Supplementary Material: Table S1). Similar with the previous report [29], despite the polydispersity of GO (Supplementary Material: Figure S1), the values of both Ks-v and β keep highly reproducible for each given DNA-AuNPs which may ensure unbiased screening.
Interrogation of the interaction between ssDNA-AuNPs and GO. (a) The absorbance of ssDNA-AuNPs (NP1) mixed with GO in Tris-HCl buffer for 1 h, and the spectra are recorded at time intervals of 5 min from 0 to 60 min (from top to bottom). (b) Absorbance titration of NP1-NP6 with GO. (c) Corresponding color change of NP1-NP6 after incubation with GO. (d) The proof of reversibility of the interaction between ssDNA-AuNPs and GO resulted from dominated non-covalent binding force. Once introduction of GO, the flocculent precipitate can gradually form during 1 h, however, the formed precipitate is also easily re-dispersed with mechanical agitation.
After the different binding characteristics of ssDNA-AuNPs with GO are established, we have then selected five different DNA sequences modified AuNPs (NP1-NP5) as sensor elements and eight different kinds of proteins as targets that have noticeable pairs in isoelectric point (pI) and molecular weight (MW) to identify the discriminant ability of our method on the molecular level. For example, bovine serum albumin and hemoglobin share a MW of ∼ 65 kDa, and cytochrome c and lysozyme both share a similar pI of 11. Thereafter, by making use of linear discriminant analysis (LDA) [30], we can quantitatively differentiate proteins at a concentration as low as 0.5 nM, which is much lower than recently proposed pattern array based on DNA receptors [31,32]. Moreover, in the process of examining the consistency and reproducibility of our method, blind sample testing has also been performed (25 unknowns).
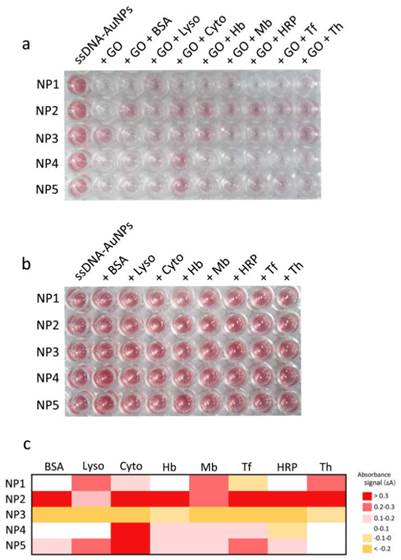
As illustrated in Figure 3a, assay of the eight proteins (all at 500 pM) results in a variety of colorimetric responses due to their different interactions with GO and DNA-AuNPs. By contrast, the direct introduction of proteins into DNA-AuNPs without the involvement of GO cannot induce any color changes (Figure. 3b), confirming the disruption of DNA-AuNPs-GO interactions by proteins. To distinctly visualize the fingerprint-like response pattern of the NP1-NP5 array to each protein, we have also provided a heat map corresponding to the change of absorbance (Figure 3c). Consequently, absorbance enhancement has been observed for most of the elements (Figure 4a), which indicates that the assayed protein molecules may adsorb to the surface the nanomaterials, prevent the interaction between GO and the DNA shell of AuNPs and leave large numbers of AuNPs in the supernatant. The absorbance response patterns from the different protein types are found to be distinctive, reproducible, and specific. Such an outcome confirms our expectation, because each protein has its unique surface characteristics. For each protein, we test its absorbance response against the five DNA-AuNPs assemblies six times, generating a 5 × 8 × 6 matrix. Then, the raw data are subjected to LDA to generate four canonical factors (62.9, 30.3, 6.3, and 0.5% of the variation), which represent linear combinations of the absorption response matrix (four factors × eight proteins × six replicates). The first two factors are employed to generate a two-dimensional plot as presented in Figure 4b.
Corresponding color response matrix obtained from different sensor elements (NP1-NP5) toward the analytes. (a) Color changes of NP1-NP5 incubation with eight proteins (0.5 nM) and GO for 1 h. (b) Color changes of NP1-NP5 direct incubation without GO for the assay of eight proteins (c) Heat map derived from the absorbance signal responses of NP1-NP5 against 8 proteins after introduction of GO.
Array-based sensing of eight proteins in 10 mM Tris-HCl (pH 7.4) and five proteins in human serum. (a) Absorbance response (ΔA, A - A0) patterns of the ssDNA-AuNPs-GO sensor array (NP1-NP5) against various proteins at 0.5 nM concentration: bovine serum albumin (BSA), cytochrome c (Cyto), hemoglobin (Hb), lysozyme (Lyso), horseradish peroxidase (HRP), myoglobin (Mb), transferrin (Tf) and thrombin (Th). Error bars represent standard deviations of six parallel measurements. (b) Canonical score plot for the absorbance response patterns as obtained from LDA against eight proteins at a constant concentration of 0.5 nM, with 95% confidence ellipses. (c) Absorbance response (ΔA) patterns of the ssDNA-AuNPs-GO sensor array (NP1-NP5) against five proteins (BSA, Lyso, Cyto, Hb, and Mb) spiked in human serum at 10 nM concentration. Error bars represent standard deviations of six parallel measurements. (d) Canonical score plot for the absorbance response patterns as obtained from LDA against five proteins at a fixed concentration of 10 nM, with 95% confidence ellipses. All five proteins can be well-separated and properly identified.
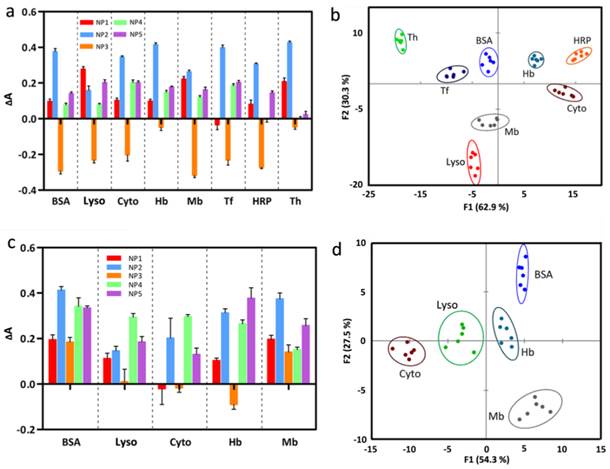
In this plot, each point represents the response pattern for an individual protein sample against the sensor array. Importantly, we are able to cluster the 48 canonical absorbance response patterns (8 proteins × 6 replicates) into eight distinct groups (Figure 4b), and all of the protein targets are clearly identified in this pattern recognition using five sensor elements without overlap between the 95% confidence ellipses. What's more, we can observe that these proteins can be simply classified into two groups: those containing heme (Cyto, Hb, Mb, HRP) located into the right quadrant and others (BSA, Lyso, Tf, Th) located at the left quadrant. These results indicate that LDA allows the discrimination of very subtle differences in protein structure. Furthermore, the robust ness of our strategy is tested by the identification of 25 unknown protein samples from eight kinds of proteins, which the operator performing the analysis does not know the identity of the solutions. After LDA analysis, the new cases are classified to the groups generated from our training matrix judging by their Mahalonobis distance and return the nearest samples to the respective groups. In our studies, all of unknown specimens are identified with 96% accuracy (24/25 samples, Supplementary Material: Table S5).
To further test the ability of our sensor array to analyze the analytes in complex samples, the sensor array has been used in human serum. Because of the presence of the high interference of serum proteins (~ 1 mM, 71 mg mL-1), higher concentration of GO (50 μg/mL) are employed to obtain reliable responses. Under the same methodology, high sensing reproducibility can also be obtained, and a precise identification of 5 proteins with 100% identification accuracy can be achieved. Meanwhile, no essential overlap is observed in the canonical score plot (Figure 4c, d).
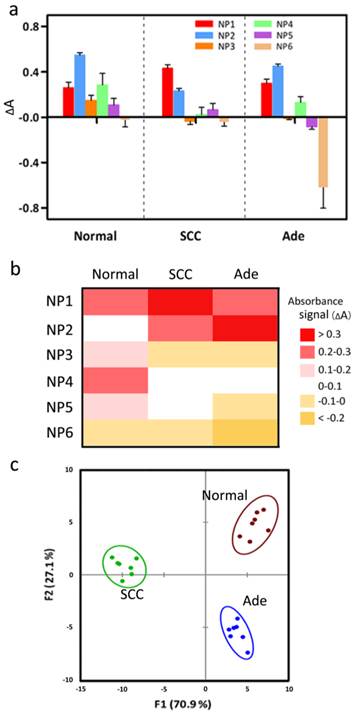
After having verified the impressive discriminant ability of our array-based method toward the analysis of protein analytes, we next keep our eye on the tissue sensing as a clinically relevant sensing target, relying on the differential protein expression patterns of different tissues. For these studies, we have first collected tissues from normal, Ade and SCC individuals, and conventional histopathology images of corresponding samples are presented in Supplementary Material: Figure S2. Next, in order to carry out the following studies at the same protein concentration, tissue lysates are prepared and protein contents are quantified by bicinchoninic acid (BCA) assays. After incubation of different concentrations of lysate proteins, we find that our assay method can give a completely differentiation with as low as 100 ng of intracellular proteins, the cellular protein content of ∼500 cells. Such a small sample size may also have the advantage to be easily combined with the currently used clinical technology such as fine needle aspirates [33]. Considering the heterogeneity of human disease in practical tests, we select 7 patient samples for each tissue type, and each complex response is the average obtained by analyzing the samples for five parallel times. Moreover, to further control the disease heterogeneity, only patients with stage I to IIIa of Ade and SCC are included for this study. Figure 5a shows the change of the absorption intensities of the three tissue lysates (SCC, Ade, and normal) to NP1-NP6. The most absorbance signals with standard deviation < 7% between patients in the same tissue group indicate the robustness of our method for different individuals analysis as the protein concentration of each lysate is kept constant, while the differential responses in different tissue groups reveal that our sensor can detect differences in intracellular protein ratios in diverse tumor tissues. LDA classifies the tissues into three distinct clusters through three canonical factors (containing 70.9, 27.1, and 2% of the variation), with 100% identification accuracy among these tissues (Figure 5c). It can be observed that the three groups separately locate into three different quadrants, indicating underlying differences on protein expression. Taken together, these studies demonstrate that our method can simply and effectively differentiate subtype tumor tissues of NCSLC based on their lysate compositions.
Detection of subtype of NSCLC tissue lysates, where we choose well-differentially Ade and SCC tissues due to their high similarity to normal epithelium under a microscope. (a) Change in absorption intensities for three different tissue lysates (normal, Ade and SCC) using the ssDNA-AuNPs-GO sensor array (NP1-NP6). (b) Heat map derived from absorbance response pattern for three human tissue lysates. (c) Canonical score plot for the two factors of absorbance response patterns against human tissue lysates, with 95% confidence ellipses. The canonical scores are calculated by LDA for the identification of three tissue lysates.
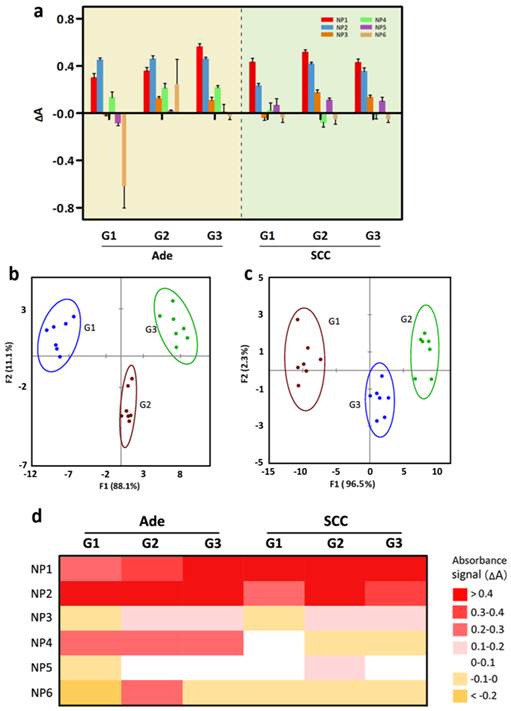
To provide a test bed for more thoroughly analyzing tumor classification, we prepare tissue lysates from three tumor grades (G1: well-differentiated, G2: moderately-differentiated, and G3: poorly-differentiated) of Ade and SCC individuals. Due to their high genetic similarity, tumor grade classifications are expected to present a particularly stringent test for detection assays. The same sensing assays are performed using 100 ng of proteins. A distinct and reproducible absorbance response pattern is observed for the three grades of two tumor tissues (Figure 6a). In the canonical score plots obtained from LDA, the different grades of two tumors are clustered into non-overlapping groups, respectively (95% confidence ellipses).
Detection of three grades of Ade and SCC tissue lysates. (a) Change in absorption intensities for three different tissue lysates (normal, Ade and SCC) using the ssDNA-AuNPs-GO sensor array (NP1-NP6). (b) Canonical score plot of the absorbance patterns as obtained from LDA against the three grades of Ade patients. (c) LDA score plot derived from the absorbance changes for the three grades of SCC patients. (d) Heat map derived from absorbance response pattern for different grades of Ade and SCC patients.
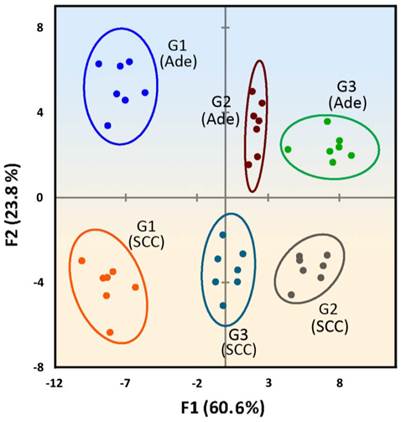
Significantly, when the absorbance response data from the different degrees of differentiation of Ade and SCC tissue lysates are combined and analyzed by LDA, the Ade and SCC tissues cluster into two completely separate regions along the F1 and F2 axes (Figure 7), suggesting a dramatic difference between the fingerprint-like response patterns. In addition, no overlap is observed in the 2D plot, and 100% classification accuracy of all six analytes is obtained. A general trend is also found, where the well-differentiated of Ade and SCC are located on the left side and the moderately or poorly-differentiated tumor are located on the right side. To confirm the detection efficiency of our sensitive array-based strategy, we have also performed blind experiments to identify unknown samples from patients chosen from the training matrix. Of 30 cases, 27 are correctly classified with an identification accuracy of 90% (Table S9 in the Supplementary Material). All in all, the developed array-based sensing approach can completely identify healthy and tumor tissue, as well as discriminating between tumor grades, providing a promising strategy for tumor classification in cancer diagnosis.
Two-dimensional LDA score plot derived from combining the absorbance response patterns of different grades of two tumor types, with 95% confidence ellipses. The color shading is drawn to show the distinct regions between Ade and SCC tissues.
Conclusion
In the current study, we have presented an array-based colorimetric method for analyzing different tumorous subtypes and grades based on the phenotypic differences within the overall proteomic signatures of the respective tissues by using DNA-AuNPs and GO. The method is robust, fast (~ 1 h), sensitive (100 ng protein), accurate and potentially adaptable to provide a generalizable platform for other tumor classification. Moreover, the color change of each sensor elements may provide both simple and cost-effective visual readout. It thus may bring out new complementary opportunities for identification of different subtype or degree of differentiation of human tumor in resource-constrained countries. In the future, the method can be improved even further if appropriate nanomaterials were to be integrated with sophisticated microfluidic devices for high throughput screening of complex samples.
Supplementary Material
Figure S1, S2; Table S1-S10.
Acknowledgements
This work is supported by the National Science Fund for Distinguished Young Scholars (Grant No. 20925520), and the National Natural Science Foundation of China (Grant No. 21235003).
Competing Interests
The authors have declared that no competing interest exists.
References
1. Nam JM, Thaxton CS, Mirkin CA. Nanoparticle-based bio-bar codes for the ultrasensitive detection of proteins. Science. 2003;301:1884-6
2. De La Rica R, Stevens MM. Plasmonic ELISA for the ultrasensitive detection of disease biomarkers with the naked eye. Nat Nanotechnol. 2012;7:821-4
3. Nam J-M, Stoeva SI, Mirkin CA. Bio-bar-code-based DNA detection with PCR-like sensitivity. J Am Chem Soc. 2004;126:5932-3
4. Rissin DM, Kan CW, Campbell TG. et al. Single-molecule enzyme-linked immunosorbent assay detects serum proteins at subfemtomolar concentrations. Nat Biotechnol. 2010;28:595-9
5. Lee H, Sun E, Ham D. et al. Chip-NMR biosensor for detection and molecular analysis of cells. Nat Med. 2008;14:869-4
6. Osterfeld SJ, Yu H, Gaster RS. et al. Multiplex protein assays based on real-time magnetic nanotag sensing. Proc Natl Acad Sci USA. 2008;105:20637-40
7. Wilner OI, Willner I. Functionalized DNA nanostructures. Chem Rev. 2012;112:2528-56
8. Willner I, Zayats M. Electronic Aptamer-Based Sensors. Angew Chem Int Ed. 2007;46:6408-18
9. Freeman R, Liu X, Willner I. Chemiluminescent and chemiluminescence resonance energy transfer (CRET) detection of DNA, metal ions, and aptamer-substrate complexes using hemin/G-quadruplexes and CdSe/ZnS quantum dots. J Am Chem Soc. 2011;133:11597-604
10. Wang J, Wang L, Liu X. et al. A Gold Nanoparticle-Based Aptamer Target Binding Readout for ATP Assay. Adv Mater. 2007;19:3943-6
11. Zhang L, Zhu J, Guo S. et al. Photoinduced Electron Transfer of DNA/Ag Nanoclusters Modulated by G-Quadruplex/Hemin Complex for the Construction of Versatile Biosensors. J Am Chem Soc. 2013;135:2403-6
12. Wang J, Meng W, Zheng X. et al. Combination of aptamer with gold nanoparticles for electrochemical signal amplification: application to sensitive detection of platelet-derived growth factor. Biosens. Bioelectron. 2009;24:1598-602
13. Feng L, Wu L, Wang J, Ren J. et al. Detection of a Prognostic Indicator in Early-Stage Cancer Using Functionalized Graphene-Based Peptide Sensors. Adv Mater. 2012;24:125-31
14. Wang X, Wang C, Qu K, Song Y, Ren J, Miyoshi D, Sugimoto N, Qu X. Ultrasensitive and Selective Detection of a Prognostic Indicator in Early-Stage Cancer Using Graphene Oxide and Carbon Nanotubes. Adv Funct Mater. 2010;20:3967-71
15. Scarberry KE, Dickerson EB, McDonald JF. et al. Magnetic nanoparticle- peptide conjugates for in vitro and in vivo targeting and extraction of cancer cells. J Am Chem Soc. 2008;130:10258-62
16. Thornton PD, Heise A. Highly specific dual enzyme-mediated payload release from peptide-coated silica particles. J Am Chem Soc. 2010;132:2024-8
17. He S, Song B, Li D, Zhu C. et al. A graphene nanoprobe for rapid, sensitive, and multicolor fluorescent DNA analysis. Adv Funct Mater. 2010;20:453-9
18. Li C, Yang Y, Zhang B. et al. Conjugation of Graphene Oxide with DNA-Modified Gold Nanoparticles to Develop a Novel Colorimetric Sensing Platform. Part Part Syst Charact. 2014;31:201-8
19. Arya SK, Bhansali S. Lung Cancer and Its Early Detection Using Biomarker-Based Biosensors. Chem Rev. 2011;111:6783-809
20. Herbst RS, Heymach JV, Lippman SM. Molecular origins of cancer: Lung cancer. N Engl J Med. 2008;359:1367-80
21. Liu J. Adsorption of DNA onto gold nanoparticles and graphene oxide: surface science and applications. Phys Chem Chem Phys. 2012;14:10485-96
22. Yanagisawa K, Shyr Y, Xu BJ. et al. Proteomic patterns of tumour subsets in non-small-cell lung cancer. The Lancet. 2003;362:433-9
23. Hou J, Lambers M, den Hamer B. et al. Expression profiling-based subtyping identifies novel non-small cell lung cancer subgroups and implicates putative resistance to pemetrexed therapy. J Thorac Oncol. 2012;7:105-14
24. Petty RD, Nicolson MC, Kerr KM. et al. Gene Expression Profiling in Non-Small Cell Lung Cancer From Molecular Mechanisms to Clinical Application. Clin cancer Res. 2004;10:3237-48
25. Lynch I, Dawson KA. Protein-nanoparticle interactions. Nano Today. 2008;3:40-7
26. Hu W, Peng C, Lv M. et al. Protein corona-mediated mitigation of cytotoxicity of graphene oxide. Acs Nano. 2011;5:3693-700
27. Monopoli MP, Åberg C, Salvati A. et al. Biomolecular coronas provide the biological identity of nanosized materials. Nat Nanotechnol. 2012;7:779-86
28. Wei H, Wang Z, Zhang J. et al. Time-dependent, protein-directed growth of gold nanoparticles within a single crystal of lysozyme. Nat Nanotechnol. 2011;6:93-7
29. Pei H, Li J, Lv M. et al. A graphene-based sensor array for high-precision and adaptive target identification with ensemble aptamers. J Am Chem Soc. 2012;134:13843-9
30. Jurs P, Bakken G, McClelland H. Computational methods for the analysis of chemical sensor array data from volatile analytes. Chem Rev. 2000;100:2649-78
31. Lu Y, Liu Y, Zhang S. et al. Aptamer-Based Plasmonic Sensor Array for Discrimination of Proteins and Cells with the Naked Eye. Anal Chem. 2013;85:6571-4
32. Yang X, Li J, Pei H. et al. Pattern Recognition Analysis of Proteins Using DNA-Decorated Catalytic Gold Nanoparticles. Small. 2013;9:2844-9
33. Lee H, Yoon TJ, Figueiredo JL. et al. Rapid detection and profiling of cancer cells in fine-needle aspirates. Proc Natl Acad Sci USA. 2009;106:12459-64
Author contact
![]() Corresponding authors: Genxi Li, Fax: +86-25-83592510, E-mail: genxiliedu.cn; Zhaoxia Wang, Fax: +86-25-58509994, E-mail: zhaoxiawang88com; Yongmei Yin, Fax: +86-25-83710040, E-mail: ym.yincom
Corresponding authors: Genxi Li, Fax: +86-25-83592510, E-mail: genxiliedu.cn; Zhaoxia Wang, Fax: +86-25-58509994, E-mail: zhaoxiawang88com; Yongmei Yin, Fax: +86-25-83710040, E-mail: ym.yincom