Impact Factor
- Issue 13; 2026
- Issue 12; 2026
- Issue 11; 2026
- Issue 10; 2026
- Issue 9; 2026
- Volume 16; 2026
- Advance Articles
- Past Issues
- Cover Images
- Cover Suggestion
- Index & Coverage
- Special Issues
Introduction
Results
Discussion
Materials and Methods
Supplementary Material
Acknowledgements
References
International Journal of Biological Sciences
International Journal of Medical Sciences
 Global reach, higher impact

Theranostics 2015; 5(3):289-301. doi:10.7150/thno.10155 This issue Cite
Research Paper
Prediction of Tumor Recurrence and Therapy Monitoring Using Ultrasound-Guided Photoacoustic Imaging
Srivalleesha Mallidi1, Kohei Watanabe1,2, Dmitriy Timerman1, David Schoenfeld3, Tayyaba Hasan1 ![]()
1. Wellman Center for Photomedicine, Massachusetts General Hospital, Boston, MA 02114;
2. Healthcare Optics Research Laboratory, Canon USA, Inc., Cambridge, MA 02139;
3. Biostatistics Department, Massachusetts General Hospital, Boston, MA 02114.
Received 2014-7-21; Accepted 2014-11-21; Published 2015-1-1
Abstract

Selection and design of individualized treatments remains a key goal in cancer therapeutics; prediction of response and tumor recurrence following a given therapy provides a basis for subsequent personalized treatment design. We demonstrate an approach towards this goal with the example of photodynamic therapy (PDT) as the treatment modality and photoacoustic imaging (PAI) as a non-invasive, response and disease recurrence monitor in a murine model of glioblastoma (GBM). PDT is a photochemistry-based, clinically-used technique that consumes oxygen to generate cytotoxic species, thus causing changes in blood oxygen saturation (StO2). We hypothesize that this change in StO2 can be a surrogate marker for predicting treatment efficacy and tumor recurrence. PAI is a technique that can provide a 3D atlas of tumor StO2 by measuring oxygenated and deoxygenated hemoglobin. We demonstrate that tumors responding to PDT undergo approximately 85% change in StO2 by 24-hrs post-therapy while there is no significant change in StO2 values in the non-responding group. Furthermore, the 3D tumor StO2 maps predicted whether a tumor was likely to regrow at a later time point post-therapy. Information on the likelihood of tumor regrowth that normally would have been available only upon actual regrowth (10-30 days post treatment) in a xenograft tumor model, was available within 24-hrs of treatment using PAI, thus making early intervention a possibility. Given the advances and push towards availability of PAI in the clinical settings, the results of this study encourage applicability of PAI as an important step to guide and monitor therapies (e.g. PDT, radiation, anti-angiogenic) involving a change in StO2.
Keywords: photoacoustic imaging, photodynamic therapy
Introduction
The structural, vascular, and metabolic heterogeneity of cancer biology confers substantial limitations to the effectiveness of standard cancer treatments, such as radiotherapy or chemotherapy [1] resulting frequently in tumor recurrences. The recurrent disease can be aggressive and is often resistant to standard treatments. For example, in malignant glioblastoma, 90-95% of tumors recur locally, and less than 15% of these recurrent tumors show response to standard chemotherapy [2]. Indeed, there is no standard of care for recurrent glioblastoma [3]. The cause of local recurrence is not entirely established and probably reflects the heterogeneity in tumor cells, tumor vasculature and hypoxia—all of which may play a major role, either individually or collectively, in resistance to standard therapies [4]. Given these heterogeneities, information on change in tumor volume alone post-therapy is not predictive of therapy response or recurrence. Surrogate functional markers such as change in tumor vascular density, perfusion and metabolic activity occurring in the tumor due to therapy could provide better prediction of therapy response, aid in stratification of subjects and design of subsequent therapeutic interventions earlier in the disease management.[5] Therefore, the importance of non-invasive imaging modalities that provide functional information in predicting therapy response is irrefutable [6].
Amongst the emerging vascular-targeted therapies, photodynamic therapy (PDT) is gaining popularity because it causes spatially localized tumor vascular destruction with minimal side effects [7]. In PDT, photosensitizer (PS) preferentially accumulates in malignant tissue as a result of increased tumor vascular permeability, and wavelength-specific light-activation of the PS generates cytotoxic reactive species including reactive oxygen species (ROS). ROS subsequently induce tumor cell and vascular destruction. PDT has temporal and spatial selectivity because 1. PS is accumulated in tumor tissue and its associated vasculature in a time-dependent manner and 2. Light illumination can be regionally localized to the area of malignancy [7, 8]. Additional tumoral selectivity for the PS can be achieved through liposomal encapsulation [9] or PS conjugation to targeting moieties such as antibodies [10]. Currently, PDT is approved for several applications [7] malignancies such as cholangiocarcinoma (NCT01524146), oropharyngeal cancer (NCT01718223), glioma (NCT01682746)[11] and locally advanced pancreatic cancer (NCT01770132) [12].
As with radio- and chemotherapy, heterogeneity in tumor oxygenation can result in variable PDT outcomes [8, 13]. Besides the inherent erratic nature of tumor vasculature, the heterogeneity of tumor oxygenation is attributed to variations in inter-capillary distance, intra-vascular oxygen partial pressure (pO2), blood flow rates and vascular permeability [14]. Studies, such as those by Pogue et al., have shown that as a consequence of this variability, response to PDT treatment is also not homogeneous [15]. Vascular-targeted PDT effectiveness depends, amongst other parameters, on the availability and consumption of oxygen in the target tissue during light delivery and its subsequent effect on vascular destruction. Therefore, monitoring of tumor oxygenation before, during and after PDT could provide an early indication of the long-term treatment outcome. Direct measurements of tissue oxygenation status during PDT have been obtained with pO2 histography [16, 17]. However, microelectrodes are invasive and only sample volume adjacent to the electrode. Non-invasive optical imaging techniques, such as reflectance spectroscopy and diffuse optical tomography, used to monitor changes in blood oxygen saturation (StO2), an indirect method representing tissue oxygenation status [13, 18-21], post therapy have shown promise. However, these techniques have not provided 3D spatial information on the heterogeneous change in tumor StO2 post therapy. Blood oxygenation level dependent (BOLD) contrast MRI was also demonstrated for use in PDT [22], however it was sensitive only to deoxygenated hemoglobin changes in T2* relaxation time and has ~1 mm spatial resolution. Advances in optical and acoustic technologies have led to an increased interest in the use of photoacoustic phenomena for biomedical imaging. This is due to the fact that photoacoustic imaging (PAI) has the sensitivity of optical imaging and yields a 3D atlas of the tumor blood oxygenation status at resolutions equal to ultrasound imaging [23-25]. PAI uses a pulsed laser to induce localized thermo-elastic expansion of optical absorbers (such as hemoglobin) that generate acoustic waves. The generated photoacoustic waves are detected using an ultrasound transducer. Multi-wavelength PAI can provide StO2 and total hemoglobin concentration (HbT) maps without the use of exogenous contrast agents as oxygenated and deoxygenated hemoglobin have different optical absorption properties [23-26].
In this study we hypothesize that mapping the change in StO2 with PDT within the 3D tumor volume could act as a surrogate marker to predict the likelihood of PDT success and could identify regions of local tumor recurrence within the 3D tumor volume. We tested this hypothesis by using, for the first time, PAI monitoring of benzoporphyrin-derivative (BPD) based PDT-induced change in tumor StO2 in a murine model of GBM. We demonstrate that a ~95% and ~85% decrease in StO2 at 6- and 24-hrs post-therapy, respectively, were predictive of tumors responding to the treatment (i.e., no palpable tumor was observed up to a month post therapy) while no significant change in StO2 at post-therapy was observed in the non-responding tumors. Based on these findings, a “prediction map” was deduced from the PAI StO2 images post-therapy to predict non-treated and regrowth areas within the 3D volume of the tumor. Finally, our prediction map was validated with blinded caliper measurements and photographs of the recurred tumor.
Results
Photoacoustic imaging for StO2 does not photobleach photosensitizer
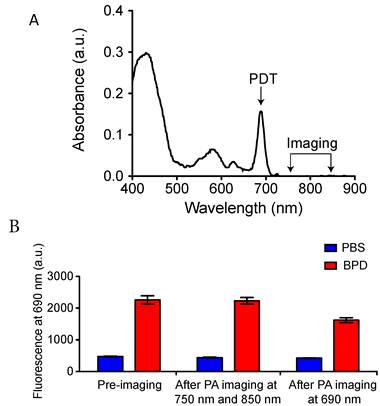
The FDA-approved photosensitizer benzoporphryin derivative (BPD-MA) with absorption peaks at 405 nm (Soret-band) and 690 nm (Q-band) was used for all PDT experiments. To achieve better depth of light penetration, 690 nm light was used for PDT. PAI was performed at 750 nm and 850 nm wavelength illumination to deduce StO2 from the oxygenated and deoxygenated hemoglobin signal as described by Needles et al [26]. At these wavelengths, the absorbance of BPD is minimal (Fig. 1A). PAI was performed using pulsed nanosecond laser (10 ns pulse width) illumination. PAI on phantom tubes (approximately 500 μm inner diameter) loaded with BPD helped gauge the photobleaching effects that might emanate from the measurement due to the pulsed nanosecond laser irradiation. Fluorescence imaging experiments on the tubes were performed using a Maestro imaging system (CRI Inc.) with an excitation at 405 nm and emission at 690 nm. Fluorescence from the tubes at 690 nm prior to PAI and post-PAI imaging is displayed in Fig. 1B. There was no significant change in the fluorescence signal in the tube compared to the pre-imaging value with PAI at 750 nm followed by 850 nm irradiation. However, we observe reduced fluorescence in the tubes post-PAI at 690 nm due to photobleaching effects on BPD at this wavelength. Overall these results indicate PAI for StO2 has minimal photobleaching effect on BPD and no PDT effects occur due to the imaging procedure.
Photoacoustic imaging for StO2 does not photobleach photosensitizer. A. Optical absorption properties of the photosensitizer BPD. PDT was performed at 690 nm and PAI was performed at 750 and 850 nm wavelength illumination. (B) Fluorescence from tubes containing PBS or BPD before and after PAI at 750 nm, 850 nm and after PAI at 690 nm. There is no significant difference between the BPD fluorescence (no photobleaching) before and after PAI at 750 nm and 850 nm. However, PAI at 690 nm photobleached the BPD, causing a significant decrease in the fluorescence.
Effect of drug-light-interval (DLI) on PDT treatment response
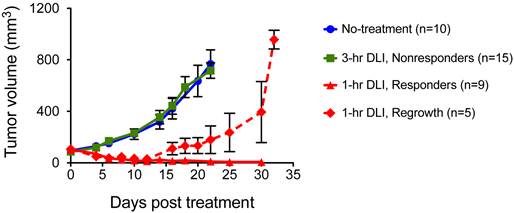
Our previous studies established that PDT was more effective when light is initiated 1-hr post I.V. injection of PS (1-hr DLI) compared to 3-hr DLI [27]. We postulated in our previous work that at 1-hr the PS localizes to both cellular and vascular compartments of the tumor; while at 3-hrs most of the PS is extra-vascular and primarily cellular, and is therefore less likely to impact the tumor oxygenation status. Identical results were obtained in the U87 glioma model in the current study with a BPD dose of 0.5 mg/kg and light dose of 100 J/cm2 at 100 mW/cm2 irradiance as shown in Figure 2. The 3-hr DLI group tumors (Fig. 2, green line) showed approximately six-fold increase in volume at three weeks following PDT. There was no significant difference (p>0.05, Students t-test) between the no-treatment group (Fig. 2, blue line) and the 3-hr DLI group (Fig. 2, green line). Amongst the mice that underwent PDT with 1-hr DLI, there was no regrowth for ~two weeks. After approximately two weeks, 35% of the mice started to show recurrence and an increase in tumor volume (Fig. 2, dashed red line) while 65% of mice had no palpable tumor 30 days after therapy (Fig. 2, solid red line). To test if PAI could monitor the changes in StO2 in the tumor due to PDT, we designated the 1-hr DLI group with a sustained absence of palpable tumors up to 30 days post treatment (Fig. 2, triangles joined by solid red line) as our “PDT responding group,” and the mice in the 3-hr DLI group (Fig. 2, squares joined by solid green line) were considered the “PDT non-responding group.”
Longitudinal volume monitoring of subcutaneous U87 tumors that underwent no-treatment (circles, blue line), BPD-PDT with 3-hr DLI (squares, green line), BPD-PDT with 1-hr DLI showing complete response (triangles, solid red line) and BPD-PDT treatment with 1-hr DLI showing regrowth (diamonds, dashed red line). The error bars indicate SEM.
Pre-PDT and immediate post-PDT StO2 and HbT values do not predict treatment response
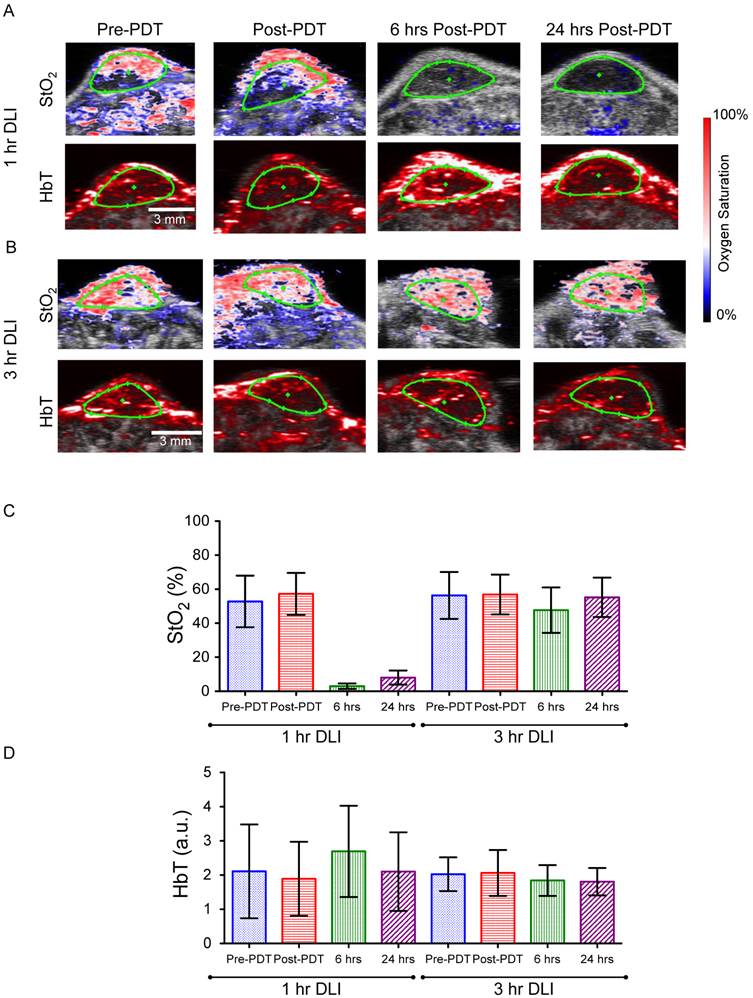
We measured StO2 and HbT content in both the 1-hr DLI responding group and 3-hr DLI (non-responders) group of mice (n=6 per group) at 4 time points (before PDT (pre-PDT), immediately post-PDT, 6-hrs and 24-hrs post-PDT) to determine if PAI could predict treatment response. Figures 3A and 3B show representative images of the StO2 and HbT content at various time points in a responding and non-responding tumor, respectively. Ultrasound imaging identified regions of interest (ROI) (green ROI in Figs. 3A and 3B is the tumor region). Fig. 3C and Fig. 3D represent the average of StO2 values and HbT values in the tumor ROI from ~350 B-scans per mouse (6 mice in each group, ~55-75 B-scans per 3D tumor volume). Prior to PDT, there was no statistically significant difference between the StO2 of the 1-hr DLI and 3-hr DLI groups (Table S1). There was no statistically significant difference between the pre-PDT and post-PDT values in the 3-hr DLI group, however the difference was significant (p<0.001) in the 1-hr DLI group, indicating an increase in oxygenation immediately post-PDT. This phenomenon is in agreement with the literature [15, 19] and is attributed to cell death and a decrease in the metabolic consumption of oxygen in the tumor area. We observed no significant difference in the post-PDT StO2 between the 1-hr and 3-hr DLI groups. These results are in agreement with Wang et al [19]. who utilized broad-band reflectance spectroscopy to evaluate StO2 in the PDT responders and control tumors. We also observed no statistically significant difference between the HbT values of the 1-hr DLI and 3-hr DLI groups prior to PDT (Additional File 1: Table S2). Furthermore, there was no statistically significant difference between the pre-PDT and post-PDT values in these groups amongst themselves or compared to their respective pre-PDT values (Table S2). Indeed, the photoacoustic images also do not show any observable changes in the HbT images (Figs 3A and 3B). Based on these results, the pre-PDT StO2 and HbT values and the immediately post-PDT StO2 and HbT values cannot by themselves be reliably used to predict PDT treatment response and differentiate the 1-hr and 3-hr DLI groups.
(A&B) Combined ultrasound and photoacoustic images of responders in 1-hr DLI group and non-responder from 3-hr DLI group. The top panel represents ultrasound image in grayscale overlaid with oxygen saturation (StO2) map where blue and red represent hypoxic and oxygenated regions, respectively. Bottom panel represents ultrasound image in grayscale overlaid with total hemoglobin image (HbT). The green ROI indicates the tumor region identified using ultrasound image. C & D. Mean StO2 and HbT values at various time points (Pre-PDT, Post-PDT, 6-hrs and 24-hrs post-PDT) in the 1-hr DLI and 3-hr DLI groups. Error bars indicate standard deviation. Additional File 1: Table S1 and Table S2 provide the p-values of the comparisons among two groups at different time points performed using one way ANOVA (with Tukey's multiple comparison test).
Six and 24-hrs post-PDT StO2 values predict treatment response
The StO2 values decreased in the responding 1-hr DLI group 6-hrs post-PDT to 2.9% ± 1.65% (~94.3% lower than Pre-PDT StO2 value), i.e., the tumor has become hypoxic due to PDT induced vasoconstriction (Additional File 1: Fig. S1), consistent with prior reports [15, 18, 28, 29]. At 24-hrs post treatment, the StO2 in the tumors was 8.03% ± 4.13% (~84.8% lower than its pre-PDT value compared to the 94% at 6-hrs post therapy). A statistically significant increase in average StO2 was observed at 24-hrs post-PDT compared to values at 6-hrs post-PDT. In the non-responding 3-hr DLI group, StO2 values were 47.6% ± 13.4% and 55.3% ± 11.6% at 6-hrs and 24-hrs post-PDT respectively. No statistically significant difference was observed between the pre-PDT values and 24-hrs post-PDT StO2 values in the 3-hr DLI group (Table S2). The decrease in StO2 at 6-hrs in the 3-hr DLI group is statistically significant when compared to pre-PDT StO2 value (~18% change) and could be due to PDT action with available BPD not cleared from the tumor at this time point. Indeed, a study by Osaki et al and Chen et al showed less disruption of vasculature at 3-hr DLI and therefore less change in StO2 at this time point was observed [27, 28].
The StO2 maps by PAI clearly show hypoxic areas at both 6- and 24-hrs in the 1-hr DLI group (Fig. 3A). Interestingly, the HbT value at 6-hrs is significantly higher than the pre-PDT value in the 1-hr DLI group (Table S2). The increase in HbT in the responders can be attributed to erythema caused by PDT [30]. The inflammation response due to PDT recruits additional red blood cells into the tumor region causing an increase in the HbT signal. There was no statistical difference in the HbT signal at 6-hrs and 24-hrs post-PDT in the 3-hr DLI group (Table S2). Overall, PAI performed at 6-hrs and 24-hrs post-PDT was predictive of PDT treatment response and differentiated between the responding 1-hr DLI group and non-responding 3-hr DLI group based on the StO2 values. Receiver-operating-curve analysis on the two parameters StO2 at 6-hrs and StO2 at 24-hrs suggested no significant difference in their treatment success predictive capability (Tables S3 and S4).
Validation of tumor hypoxia with immunofluorescence
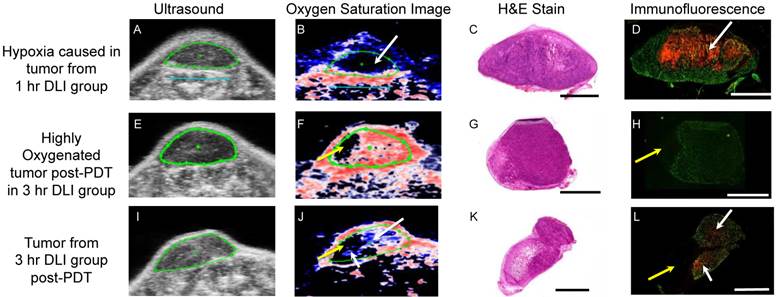
We next validated the hypoxic conditions observed in photoacoustic images with pimonidazole stain for hypoxia [31]. Tumors were sectioned in a similar orientation as the imaging cross-section. CD31 stain was utilized to depict the tumor vasculature while pimonidazole stained the hypoxic regions. In the 1-hr DLI group (Figs 4A-4D), Immunofluorescence (IF) images show hypoxia adjacent to the vasculature depicted by the CD31 stain in green color (Fig. S1 shows zoomed insets of these hypoxic regions). The hypoxia is due to the vascular damage caused by PDT and disruption of the blood flow in these vessels. Zoomed images of the H&E stain of the adjacent cross section show vascular congestions (Additional File 1: Fig. S2). This phenomenon of vascular disruption due to PDT agrees with previous study by van Geel et al.,[32] and the presence of vascular congestion in tumors that responded to PDT treatment agrees with study by Maas et al [33]. Moreover, Busch et al. have shown that PDT can create significant hypoxia in tissue adjacent to perfused blood vessels [34]. The oxygen saturation maps by PAI clearly show a hypoxic region (Fig. 4B, top left region of the tumor shown by white arrow) in the areas where high pimonidazole stain was observed (Fig. 4D, top left region of the tumor shown by white arrow). Sections from two different tumors in the 3-hr DLI group are shown in the center and bottom panel of Fig. 4. In the center panel, the tumor is highly oxygenated, and hence, no pimonidazole stain was observed in this tumor section (Fig. 4H). The PAI image (Fig. 4F) also shows a highly oxygenated tumor. The yellow arrow in Fig. 4F and Fig. 4H points to a non-vascular region within the tumor where PAI lacks contrast due to lack of blood vessels in this region. A similar hypo-vascular region was observed in the bottom panel tumor (Fig. 4J and Fig. 4L, yellow arrows) as well. These hypo-vascular areas existed prior to PDT as shown by PAI. The tumor in the bottom panel has a few hypoxic regions (Fig. 4J and Fig. 4L, white arrows) and the hypoxia pattern correlated with the PAI. It is not unusual for tumors of 5-8 mm diameter to possess a hypoxia region due to necrosis. It is also to be noted that the fluorescence of the pimonidazole stain is stronger in the 1-hr DLI (responding group) tumor than in the 3-hr DLI (non-responding) group given the severe hypoxic conditions created by PDT.
Validation of hypoxic conditions observed in photoacoustic images with immunofluorescence. Ultrasound, Oxygen saturation photoacoustic image, H&E and immunofluorescence image of a representative tumor cross-section is shown from the 1-hr DLI group (A-D), highly oxygenated tumor from the 3-hr DLI group (E-H) and tumor with few hypoxic regions in the 3-hr DLI group (I-L). White arrows indicate hypoxic areas. CD31 stain depicting tumor microvasculature is shown in green and pimonidazole stain indicating hypoxia is show in red in the immunofluorescence images. Yellow arrows indicate hypo-vascular area. Due to hypo-vascularity, no signal is observed in the photoacoustic image. The blue scale bar on the ultrasound and photoacoustic image represents 5 mm and the black and white scale bars on the H&E and immunofluorescence images respectively represents 1 mm.
Tumor regrowth prediction with 6-hr post-PDT and 24-hr post-PDT StO2 values
Within the 1-hr DLI responding group, we noticed ~35% tumors had local recurrence (Fig. 2, dashed red line) while the rest of the mice showed no visible or measurable tumor mass 30 days post treatment. Mice with recurrent tumors showed regrowth post-treatment after an initial decrease in tumor volume up to ~two weeks post treatment. Our results in Fig. 3 suggest that the StO2 reduced to 2.97 ± 1.6% 6-hrs post-PDT and 8.03% ± 4.13% 24-hrs post-PDT in tumors that responded to treatment. Based on these results, we devised an algorithm to analyze the StO2 images of the recurrent tumors obtained at various time points post therapy. First, ultrasound and photoacoustic image B-scans were acquired at 0.152 mm step size to obtain 3D maps of the anatomy and StO2. At every B-scan, the tumor region was mapped using ultrasound imaging and the average StO2 in the region was calculated. If the average StO2 at 6-hrs post-PDT and 24-hrs post-PDT at the particular B-scan frame was less than 6.2% and 16.3%, (mean + 2 x standard deviation to include 95% of the data obtained from the responding group) the B-scan region was considered treated and pseudo-colored as green, otherwise the regions were pseudo-colored red to indicate no treatment (Fig. 5). The algorithm was repeated for all the B-scans in the 3D tumor volume. This methodology will aid us in differentiating treatment responders and non-responders and also aid in predicting the regions of the tumor that did not receive complete treatment and could have the potential to regrow.
Schematic algorithm to obtain PDT treatment prediction map from the ultrasound (US) and photoacoustic (PA) images for identifying treatment responders from non-responders and for prediction of tumor regrowth.
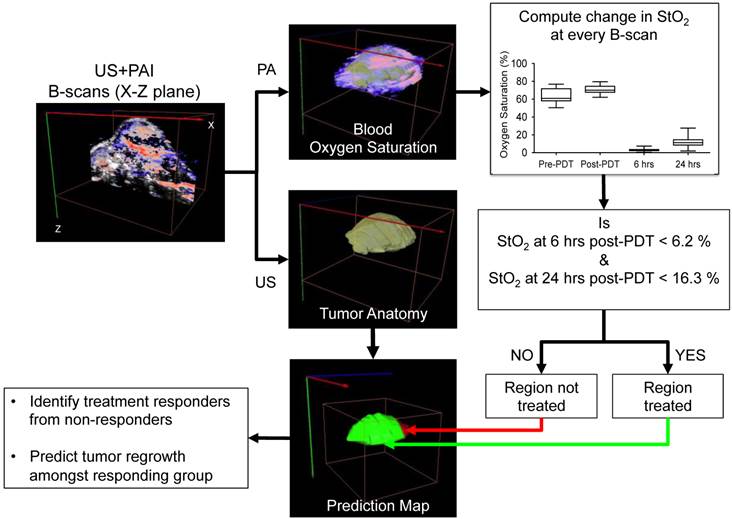
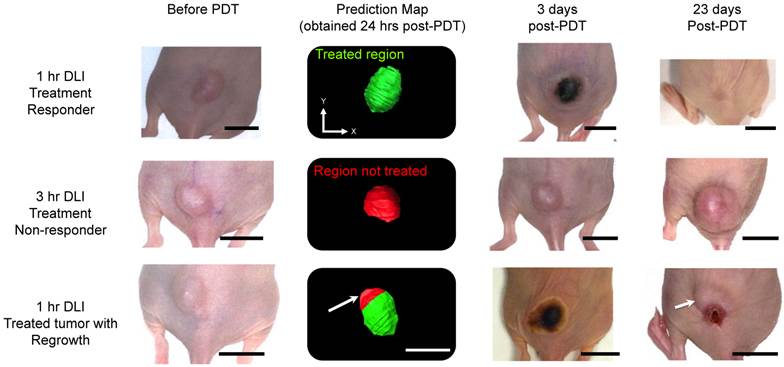
Figure 6 shows representative photographs of subcutaneous tumors at various time points post-treatment and their respective “prediction” map. The photographs of the 1-hr DLI responding group showed bluish black necrosis of the tumor within 3 days post-PDT and no visible or palpable signs of tumor 23 days post-PDT. The treatment prediction algorithm yielded a green-colored tumor region indicating that the tumor was completely treated and the StO2 values in the tumor were below 6.2% and 16.3% at 6-hrs and 24-hrs post-PDT. The 3-hr DLI non-responding tumor showed no visible signs of damage 3 days post-PDT and the tumor volume continued to increase. The map yielded a red-colored tumor indicating the tumor was not treated. In the case of tumor that had regrowth (Fig. 6, bottom panel), 3 days post treatment, the complete tumor appeared to be necrosed and visibly no tumor was observable until 18 days post treatment. Measurable tumor was observed only around day 20 post-treatment. The prediction map showed that the region of this tumor (indicated by a white arrow) did not have sufficient decrease in StO2 to cause complete tumor necrosis. These results suggest that the oxygen saturation levels need to decrease significantly post-PDT and sustain these hypoxic conditions for a period of 24-hrs post-treatment for complete tumor necrosis.
Treatment prediction map calculated 24-hrs post-PDT from photoacoustic StO2 maps in three different groups. Photographs of the same tumor are shown at different time points: before PDT, 3 days post-treatment and 23 days post-treatment. The scale bars in the photographs represent 1 cm. The green region in the prediction map indicates treated regions and the red areas represent non-treated regions. Top panel represents mouse in the 1-hr DLI group (treatment responders) that showed no visible tumor regrowth at 23 days post-PDT. Center panel shows a mouse in the 3-hr DLI group. This mouse did not show any necrosis at 3 days post-treatment and continued to grow. The prediction map clearly shows that this tumor was not treated. The bottom panel shows a representative mouse in the 1-hr DLI group that had tumor regrowth. 3 days post-therapy the tumor appeared to have complete necrosis; however, the prediction map indicated a non-treated region in the top half of the tumor (indicated by white arrow). 23 days post therapy we observe regrowth from the same region of the tumor as shown by the prediction map.
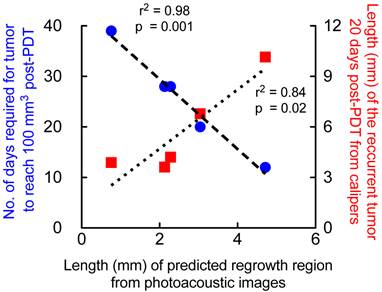
We validated the results obtained from the prediction map with caliper measurements (measured by two observers blinded to the study) of the recurred tumor. The measurements were obtained 20 days post-PDT where palpable regrowth was reliably observed (Fig 7, red squares). The major axis length of the regrowth region obtained from prediction map positively correlated (r2=0.84) with the recurred tumor size 20 days post-therapy, i.e., the greater the predicted “non-treated” region within the tumor the greater the size of the recurred tumor. We also observed strong negative correlation (r2=0.98) between the major-axis length obtained from the prediction map with the number of days taken by the tumor post-therapy (Fig. 7, blue circles) to reach 100 mm3. These results indicate that the greater the predicted “non-treated” region where StO2 did not sufficiently become hypoxic, faster the tumor regrowth rate occurs. Tumors that had very small “non-treated” regions as predicted by the PAI images took longer to regrow back to 100 mm3 and vice versa.
The higher the diameter of prediction region, the higher the diameter of the recurrent tumor at 20 days post-PDT and lower the number of days required for the tumor to reach 100mm3 volume post-PDT. Correlation of major-axis length (mm) of regrowth region obtained from PAI prediction map in mice that underwent 1-hr DLI and had local tumor recurrence with 1. Major-axis length of recurrent tumor measured 20 days post-PDT (red squares) via calipers and 2. Number of days the tumor required to reach 100 mm3 after photodynamic therapy on Day 0 (blue circles).
Discussion
The current study is motivated by the complexity of cancer biology necessitating individualized treatments for effective outcome. Prediction of response and tumor recurrence following a given therapy provides a basis for subsequent personalized treatment design and early interventions. In that context, appropriate surrogate markers could prove extremely useful. This study is a step towards this goal with the example of PDT as the treatment modality and PAI as a non-invasive, response and disease recurrence monitor in a murine model of GBM. PDT is a clinically used technique that consumes oxygen to generate cytotoxic species causing cell death and vascular shutdown. The vascular damage lowers the blood oxygen saturation (StO2). Here we interrogated whether this change in StO2 measured by PAI post-PDT could act as a surrogate marker for predicting treatment efficacy and tumor recurrence. PAI is a technique that can provide a 3D atlas of tumor StO2 by measuring oxygenated and deoxygenated hemoglobin. The non-invasive and non-ionizing PAI provided changes in StO2 due to therapy within the tumor region at ultrasonic resolution. The observation that the reduction in StO2 at 6-hrs and 24-hrs post-PDT enabled identification of treatment responders from non-responders is encouraging, paving the way for investigations in other cancer models and therapies that might impact StO2. We performed imaging at 750 nm and 850 nm to obtain StO2 values, and any effects of edema caused due to PDT on the photoacoustic signals are minimal due to low water absorption at these wavelengths. The threshold-based algorithm developed using 3D tumor StO2 maps allowed for the prediction of potential “tumor regrowth” areas, i.e. regions that had no significant change in StO2 pre and post-therapy had local recurrence. The prediction map was obtained within 24-hours post-therapy and could possibly be used to target and design secondary therapeutic interventions to this location for effective outcome. Furthermore, by obtaining images at early time points, changes in tissue optical properties due to eschar and granular tissue formation (results of PDT) that occur 3-4 days post PDT can be avoided. Given the advances and availability of PAI in clinical settings and the move toward endoscopic PAI, the findings of this study could possibly be used guide and monitor several treatment modalities such as PDT, radiation, anti-angiogenic therapy that involve a change in StO2.
Consistent with previous reports, pre-PDT and post-PDT StO2 values by themselves did not predict the efficacy of the treatment. Wang et al monitored StO2 with broadband reflectance spectroscopy in tumors treated with photofrin based PDT and concluded that the absolute values of StO2 were not predictive of the treatment effectiveness in tumor eradication [19]. However they showed that the relative change in StO2 immediately post-treatment is positively correlated with better treatment response. In contrast, we observed no statistically significant difference in the mean relative-StO2 values (StO2 post-PDT/StO2 pre-PDT). Furthermore, in our study, the relative StO2 between the treated regions and regrowth regions was not statistically significant (p>0.001, one way ANOVA). In another study by Pham et al.,[20] significant decreases in tumor HbT and StO2 were observed post-therapy using frequency-domain photon migration spectroscopy BPD-PDT. These results are at variance with our data that show tumor HbT values measured immediately before and after PDT do not have treatment prediction capability. Any discrepancies between this study and others [19, 20] are attributed to the different types of photosensitizer and doses used. Several reports have established that a change in fluence rate and photosensitizer type and concentration could affect the tumor StO2 and therefore affect the PDT treatment response.[8] Given the fact that tumors of different origin have variable PDT sensitivity [35] and the deposited dose is a complex interaction between the PS concentration, light dose and available oxygen [8], it is possible to obtain model-specific observations using PAI. These data suggest that comprehensive information about StO2 and HbT under different illumination conditions could be a promising approach towards predictive PDT and that PAI can play a major role towards this goal in understanding 3D changes in StO2 and HbT at ultrasonic resolution post-therapy.
We analyzed our 3D HbT maps of the mice from the recurrent tumor group to deduce if the region that regrew had different HbT levels prior to the treatment. For the group of mice that showed regrowth, we plotted the HbT values at various time points in the regrowth regions (51 B-scans) and the treated regions (138 B-scans) as shown in Additional File 1: Fig. S3. Regrowth and treated regions within a tumor were identified based on StO2 values at 6 hours and 24 hours post-PDT as shown in Fig. 6. The HbT values pre-PDT were not statistically significant in both the treated and regrowth regions within the tumor (Additional File 1: Table S5). However, when the significance level is lowered to 0.05, pre-PDT HbT in the regrowth region was significantly higher than the rest of the bars in Fig. S3. These results point towards the possibility that the tumor regions that regrew could had have higher HbT and further studies are required to confirm this observation, i.e., regions with higher HbT prior to PDT are indicative of more blood volume, and hence, it is likely that not all the vessels were completely congested due to PDT in this region. This insufficient treatment could have led to recuperation and subsequent regrowth in this region.
Recurrences could also occur due to insufficient deposition of light dose for PDT at the boundary of the tumor. The laser beam profile used for PDT in our study has a Gaussian profile, and hence, sufficient light dose might not have been deposited in the tumor boundary causing insufficient treatment. Indeed a recent clinical study of PDT in Barrett's esophagus showcased that insufficient light dose did not treat the lesion completely [36]. To evaluate the effect of light, we performed PDT on mice with approximately half the tumor covered with black cloth. The prediction map (Additional File 1: Fig. S4) clearly identified the covered part of the tumor as region not treated. However, the prediction maps (Fig. S4) also showed another region of the tumor as “not-treated”. This particular region recurred post-therapy as shown in the associated photographs of the tumor showcasing the utility of PAI in identifying non-treated regions and regrowth regions.
In our study we measure PDT-induced change in StO2 in the blood vessels. Avascular regions lack photoacoustic contrast due to the lack of blood vessels (Figs. 4F &4H). Tumor tissue pO2 can be measured in avascular regions utilizing the spectroscopic pump-probe PAI method developed by Ashkenazi et al [37], and this technique adds another dimension to the potential use of PAI in oncology. Utilizing multi-wavelength PAI, simultaneous information on changes in StO2 and tumor tissue pO2 in both vascular and non-vascular regions can be obtained. The change in vascular StO2 and tissue pO2 in PDT is also dependent on the type of photosensitizer and photosensitizer concentration at the treatment site [20]. PAI could monitor photosensitizer uptake [38, 39], but the photosensitizer would require a high absorption coefficient and relatively low photobleaching tendency so as to avoid measurement induced-PDT. Dye-based micro- and nanoparticles such as methylene blue microbubbles [40], and porphysomes [41] are good photoacoustic contrast agents and can be used to monitor photosensitizer delivery to the tumors using PAI. Moreover, multi-modal plasmonic metal nanoagents such as photosensitizer-conjugated silica-coated gold nanoclusters [42] and photosensitizer-loaded gold vesicles [43] could be used to monitor photosensitizer uptake. Given these capabilities of PAI to monitor photosensitizer uptake, vascular damage due to PDT [44] and changes in overall StO2 and pO2 with the tumor, PAI can play a major role in personalizing PDT dosimetric parameters.
The current algorithm to calculate the prediction map uses a StO2 threshold of 6.2% and 16.3% for 6-hrs and 24-hrs post-PDT, respectively. We chose the threshold values of 6.2% and 16.3% for the StO2 at 6-hrs post-PDT and 24-hrs post-PDT parameters as they represent 95%(mean + 2*standard deviation (STD)) of the data obtained from the tumors that completely responded responding group. The average StO2 values in tumors that completely responded to 1-hr DLI PDT are 2.9% ± 1.65% (mean + 2*STD= 6.2%) at 6 hours post-PDT and 8.03% ± 4.13% (mean + 2*STD = 16.3%). These limits are based on the average StO2 in U87 glioma tumors treated with BPD-PDT (0.5 mg/kg BPD and 100 J/cm2 light dose) as shown in Fig 3C. Depending on the vascular status, hypoxic conditions and the pathology of the tumors, these threshold levels need to be established in other tumor models and combined with algorithms similar to that shown in this study to obtain prediction maps for patient customized monitoring and treatment design.
In-vivo photoacoustic imaging and its biological applications have gained momentum within the past decade. Several reviews on its clinical applicability have been published [23-25, 45] Currently, a number of research groups are moving towards translation of PAI into the clinic for endoscopic applications [46] and intravascular applications[47], in addition to breast tumor and ocular imaging [48, 49]. It is well known that vascular-targeted therapies drive the tumor towards hypoxia (i.e. lower oxygen saturation), and these changes in oxygen saturation post-treatment can be determined at ultrasonic resolution with no use of exogenous contrast agents using PAI. In view of advances and heightened interest in the clinical translatability of PAI, the results of this study are an important step, towards individualized monitoring of vascular-targeted therapies (e.g. PDT, radiation, anti-angiogenic) and merit further investigation.
Materials and Methods
Cell Line
Human glioblastoma cell line, U87 was obtained from American Type Culture Collection (ATCC, Rockville, MD). Cells were cultured in Minimum Essential Medium Eagle (MEM; Mediatech, Manassas, VA), supplemented with 10% fetal bovine serum (FBS; Life Technologies, Carlsbad, CA) and 1% Antibiotic-Antimycotic Solution (Mediatech, Manassas, VA).
Animal Model
All animal experiments were approved by the Subcommittee on Research Animal Care of Massachusetts General Hospital. Female athymic Swiss nude mice (Cox, Cambridge, MA), 6-8 weeks old, were anesthetized with isoflurane USP (Baxter, Deerfield, IL) and inoculated subcutaneously with 3 x 10⁶ U87 cells in 300 μL of Matrigel (BD Bioscience, San Jose, CA). Tumor volumes were measured using calipers by two researchers separately. Tumor volume was calculated using the formula; π/6 × Length × Width × Height and photographs of the tumors were obtained at different time points of the study.
Photosensitizer
Photosensitizer, benzoporphyrin derivative monoacid ring-A (BPD-MA), also known as verteporfin was obtained from USP (Rockville, MD). Dipalmitoylphosphatidylcholine (DPPC), N-[1-(2,3-Dioleoyloxy)propyl]-N, N, N-trimethylammonium methyl-sulfate (DOTAP), cholesterol, and DSPE-PEG were obtained from Avanti Polar Lipids (Alabaster, AL). Liposomal formulation of BPD-MA was prepared as follows; 200 nmole of BPD-MA, 20 μmole of DPPC, 2.5 μmole of DOTAP, 10 μmole cholesterol, and 1 μmole of DSPE-PEG were mixed in round-bottom glass tube and film of the mixture was formed on the surface of glass tube by evaporating the solvent. Phosphate buffered saline (PBS) was added to dissolve the lipid film and incubated at 42 oC for 10 min followed by incubation on ice for 10 min (freeze and thaw cycle). After 5 cycles of freeze and thaw, lipid solution was warmed at 42 oC and extruded through 0.1-μm-pore filter (Whatman, Pittsburgh, PA) using extrusion device (Avanti Polar Lipids, Alabaster, AL) for 5 cycles. After the extrusion, liposomal BPD was dialyzed with dialysis membrane (MWCO = 300kD, Float-A-Lyzer G2, Spectrum Laboratories, Rancho Dominguez, CA) for 24-hrs. Size distribution and zeta potential (Table S6) were measured using dynamic light scattering (DLS; Malvern Zetasizer Nano Series; Malvern Instruments, Malvern, UK) and shown in Table S6. The concentration of BPD-MA was quantified using its UV-Vis absorbance spectrum measured with Evolution 300 UV-Vis spectrometer (Thermo Fisher Scientific, Waltham, MA).
PDT Treatment
Mice were injected intravenously with 0.5 mg/kg of BPD-MA, then PDT was performed either 1 hour or 3 hours post photosensitizer administration. Mice were placed under the laser light source and covered with black cloth except the tumor area. The tumors were irradiated with a 690 nm laser diode source (Model 7401; Intense, North Brunswick, NJ) at a fluence rate of 100 mW/cm2 as measured via a VEGA laser power energy meter (Ophir Laser Measurement Group, LLC) for a dose of 100 J/cm2.
Fluorescence imaging
Fluorescence images of two phantom tubes (500 μm inner diameter) containing phosphate buffered saline (PBS) and liposomal BPD were acquired using a CRi Maestro system. A 465 nm bandpass excitation filter and a 515 nm long-pass emission filter were used. Fluorescence images at 690 nm were acquired. A custom Matlab routine was used to quantify fluorescence signals in the tubes. After fluorescence imaging, the tubes were irradiated with pulsed laser (Vevo LAZR system operating at 10 Hz repetition rate and 10 ns pulse width) continuously for 15 minutes (approximately the time required to obtain 3D image of the tumor) alternately at 750 nm (45 mJ/cm2 fluence) and 850 nm (36 mJ/cm2 fluence). Fluorescence images of the tubes were acquired and the tubes were again irradiated with the laser of the Vevo LAZR system operating at 690 nm (10 ns pulse width at 10 Hz, 44.5 mJ/cm2 fluence). Fluorescence images of the tubes were acquired after pulsed laser irradiation and analyzed for photobleaching of the photosensitizer BPD.
Ultrasound and Photoacoustic Imaging
Image acquisition and quantitation were performed using an ultrasound and photoacoustic imaging system (Vevo LAZR, FUJIFILM VisualSonics, Inc.). Mice were anesthetized under isoflurane and were placed on a heat pad with ECG leads. The ECG, respiration rate, and body temperature of the mice were closely monitored during the imaging sessions. Bubble-free, clear ultrasound gel (Aquasonic 100 Ultrasound Transmission Gel, Parker Laboratories, Inc.) was placed on the tumor to facilitate acoustic contact between the transducer and the tumor. A linear array transducer (LZ-250, 21 MHz) was utilized to obtain spatially co-registered ultrasound and photoacoustic images. Light generated by a tunable laser operating at either 750 nm or 850 nm, required for photoacoustic imaging of StO2, was delivered through fiber optic bundles integrated into the transducer. The acquisition parameters, such as the gain (18 dB for ultrasound images and 45 dB for photoacoustic images) and persistence (i.e., no. of averages is 10), were constant for all the imaging sessions. The commercially available Vevo LAZR system that was used in this study has been thoroughly calibrated on in-vivo animal models by Needles et al [26]. The utility of the Vevo LAZR system in measuring StO2 and HbT has been demonstrated in breast [50] and pancreatic cancer [31] models recently. The system is capable of providing near real-time single-wavelength images at 10 frames per second. However, in our study we took an average of 10 images at the two wavelengths (750 nm and 850 nm respectively), hence a B-scan image of StO2 was acquired within ~5 seconds. A 3D map of the tumor StO2 was obtained within 10-15 minutes.
To facilitate comparison of StO2 patterns at different time points, the tumor position was adjusted to be as close as possible to its pre-PDT position using the “split screen” feature of the Vevo LAZR system. The “split screen” feature, as the name suggests, displays the previously acquired pre-PDT ultrasound image of the tumor on the left half of the screen while the right half of the screen shows the current ultrasound image to allow “real-time” adjustment of the tumor position (Additional File 1: Fig. S5). Once a satisfactory position was determined based on the pre-PDT image, 3D scans were performed on the tumors (Additional File 2: Movie S1). A 3D scan comprises several B-scans acquired at a step size of 0.152 mm. The Vevo LAZR workstation software was utilized to mark the tumor region of interest (ROI) on every B-scan ultrasound image (Additional File 3: Movie. S2). The ROI area (A), average StO2 and HbT values within the ROI (Additional File 1: Fig. S6), were calculated using the OxyZatedTM tool and the HemoMeaZureTM tool of the Oxy-Hemo feature of the Vevo LAZR software (FUJIFILM VisualSonics, Inc., Canada) (Movie S2). Additional File 1: Figure S7 shows an example of the tumor ROI area as a function of 3D scan distance at different time points. To demonstrate the similarity in the orientation and position of the tumor at different time points, we performed a correlation of the pre-PDT area curve with post-PDT, 6 hours and 24 hours area curves. A high correlation coefficient of 0.93, 0.89 and 0.9 (for n=13 mice in each group) was observed for the post-PDT, 6 hours and 24 hours, respectively, indicating that the B-scans obtained at various time points are approximately oriented in a similar position to the pre-PDT time point.
The Vevo workstation allowed export of the average StO2 and HbT values in the ROI at each B-scan. A graph showing StO2 values in ROI for a tumor at different time points is shown in Additional File 1: Fig. S8. A customized MATLAB routine was written to verify that the StO2 values in the ROI on a B-scan image of the 3D scan were less than 6.2% and 16.3% at 6 hours and 24 hours post-PDT. For a particular B-scan image, if the algorithm yielded a value of 1 (true case), the tumor ROI of that image was pseudo-colored green (representing a treated region) in the 3D visualization software AMIRA; if the algorithm yielded a value of 0 (false case), the ROI was pseudo-colored red (representing a non-treated region) as shown in Fig. 5. The pseudo-colored ROIs were then reconstructed into a 3D map using AMIRA software.
Immunohistochemistry
Pimonidazole (Hypoxyprobe Inc) at 60mg/kg is injected via tail vein 1-hr prior to euthanasia of the mouse for hypoxia staining. Post-euthanasia, the tumors were extracted, skin removed and embedded in optimal cutting temperature compound and kept on dry ice for solidification. A cryotome was used to cut the tumor into 5-μm-thick cryo-sections. The sections were fixed in a precooled mixture of 1∶1 acetone to methanol for 15 min on ice, (2) air dried for 30 min at room temperature, and (3) washed three times for 5 minutes in PBS with gentle agitation. A blocking solution (Dako Protein Block Reagent) was applied for 1-hr at room temperature, followed by application of the antibody at ∼10 μg/mL overnight at 4 °C. Mouse CD31/PECAM-1 Affinity Purified Polyclonal Ab (R&D Systems Inc) and HP-Red549 (Hypoxyprobe Inc) were used for staining the microvasculature and hypoxic areas in the tumor section. The slides were washed in PBS and secondary antibody (Donkey Anti-Goat IgG NL493 Affinity Purified PAb (R&D systems Inc) was applied for 2-hrs at room temperature. Finally the slides were washed and sealed with coverslips. A whole-slide scanning fluorescence imaging system (Hamamatsu NanoZoomer 2.0-RS) at 40X magnification was used to image the slides.
Statistics
Statistical analysis was performed using Graphpad Prism (La Jolla, CA). One-way ANOVA Tukey's multiple comparison test was used to statistically compare HbT and StO2 values amongst different groups and time points. A p-value less than 0.001 was considered to be significant unless specified. Prognostic utility of the parameters StO2 at 6-hrs and StO2 at 24-hrs was investigated using Receiver-Operating-Curve (ROC) analysis. Specifically, tumors in the 1-hr DLI group that showed no palpable tumor by 30 days post-PDT were assigned to be a responder group (assigned value of 1) and 3-hr DLI group (non-responders) were assigned to be a non-responder group (assigned 0). Photoacoustic B-scans of the mice that had average StO2 values at 6-hrs post-PDT less than 6.2% were assigned 1, else were assigned a value of 0. StO2 values at 24-hrs post-PDT in all the group of mice were assigned 1 if the value was less than 16.3% else assigned 0. ROC analysis was performed using MedCalc (Ostend, Belgium) software.
Supplementary Material
Additional File 1Figures S1-S8, Tables S1-S6.
Movie S1.
Movie S2.
Acknowledgements
This work was supported by NIH grants F32CA165881 (Mallidi), 5R01CA156177 and S10 ODO1232601 (Hasan) and funds from Canon USA Inc. The authors thank Dr. Jie Zhao and Mrs. Winxing Lin at the Wellman Center Photopathology core for cryo-cutting the samples and Dr. Bryan Spring for discussion on immunofluorescence stains.
Competing Interests
The authors have declared that no competing interest exists.
References
1. Marusyk A, Almendro V, Polyak K. Intra-tumour heterogeneity: a looking glass for cancer? Nat Rev Cancer. 2012;12:323-34
2. Norden AD, Young GS, Setayesh K, Muzikansky A, Klufas R, Ross GL. et al. Bevacizumab for recurrent malignant gliomas: efficacy, toxicity, and patterns of recurrence. Neurology. 2008;70:779-87
3. Weller M, Cloughesy T, Perry JR, Wick W. Standards of care for treatment of recurrent glioblastoma--are we there yet? Neuro Oncol. 2013;15:4-27
4. Vartanian A, Singh SK, Agnihotri S, Jalali S, Burrell K, Aldape KD. et al. GBM's multifaceted landscape: highlighting regional and microenvironmental heterogeneity. Neuro Oncol. 2014;16:1167-75
5. Zhao B, Schwartz LH, Larson SM. Imaging surrogates of tumor response to therapy: anatomic and functional biomarkers. J Nucl Med. 2009;50:239-49
6. Tirkes T, Hollar MA, Tann M, Kohli MD, Akisik F, Sandrasegaran K. Response criteria in oncologic imaging: review of traditional and new criteria. Radiographics. 2013;33:1323-41
7. Celli JP, Spring BQ, Rizvi I, Evans CL, Samkoe KS, Verma S. et al. Imaging and photodynamic therapy: mechanisms, monitoring, and optimization. Chem Rev. 2010;110:2795-838
8. Wilson BC, Patterson MS, Lilge L. Implicit and explicit dosimetry in photodynamic therapy: a New paradigm. Lasers Med Sci. 1997;12:182-99
9. Rai P, Mallidi S, Zheng X, Rahmanzadeh R, Mir Y, Elrington S. et al. Development and applications of photo-triggered theranostic agents. Adv Drug Deliv Rev. 2010;62:1094-124
10. Solban N, Rizvi I, Hasan T. Targeted photodynamic therapy. Lasers Surg Med. 2006;38:522-31
11. Bechet D, Mordon SR, Guillemin F, Barberi-Heyob MA. Photodynamic therapy of malignant brain tumours: A complementary approach to conventional therapies. Cancer Treat Rev. 2014;40:229-41
12. Huggett MT, Jermyn M, Gillams A, Illing R, Mosse S, Novelli M. et al. Phase I/II study of verteporfin photodynamic therapy in locally advanced pancreatic cancer. Br J Cancer. 2014;110:1698-704
13. Woodhams JH, MacRobert AJ, Bown SG. The role of oxygen monitoring during photodynamic therapy and its potential for treatment dosimetry. Photochem Photobiol Sci. 2007;6:1246-56
14. Höckel M, Vaupel P. Tumor hypoxia: definitions and current clinical, biologic, and molecular aspects. J Natl Cancer Inst. 2001;93:266-76
15. Pogue BW, Chen B, Zhou X, Hoopes PJ. Analysis of sampling volume and tissue heterogeneity on the in vivo detection of fluorescence. J Biomed Opt. 2005;10:41206 -
16. Sitnik TM, Hampton JA, Henderson BW. Reduction of tumour oxygenation during and after photodynamic therapy in vivo: effects of fluence rate. Br J Cancer. 1998;77:1386-94
17. Coutier S, Bezdetnaya LN, Foster TH, Parache R-M, Guillemin F. Effect of irradiation fluence rate on the efficacy of photodynamic therapy and tumor oxygenation in meta-tetra (hydroxyphenyl) chlorin (mTHPC)-sensitized HT29 xenografts in nude mice. Radiat Res. 2002;158:339-45
18. Yu G, Durduran T, Zhou C, Wang H-W, Putt ME, Saunders HM. et al. Noninvasive monitoring of murine tumor blood flow during and after photodynamic therapy provides early assessment of therapeutic efficacy. Clin Cancer Res. 2005;11:3543-52
19. Wang H-W, Putt ME, Emanuele MJ, Shin DB, Glatstein E, Yodh AG. et al. Treatment-induced changes in tumor oxygenation predict photodynamic therapy outcome. Cancer Res. 2004;64:7553-61
20. Pham TH, Hornung R, Berns MW, Tadir Y, Tromberg BJ. Monitoring tumor response during photodynamic therapy using near-infrared photon-migration spectroscopy. Photochem Photobiol. 2001;73:669-77
21. Robinson DJ, Karakullukçu MB, Kruijt B, Kanick SC, van Veen RPL, Amelink A. et al. Optical spectroscopy to guide photodynamic therapy of head and neck tumors. IEEE J Select Topics Quantum Electron. 2010;16:854-62
22. Gross S, Gilead A, Scherz A, Neeman M, Salomon Y. Monitoring photodynamic therapy of solid tumors online by BOLD-contrast MRI. Nat Med. 2003;9:1327-31
23. Wang LV. Prospects of photoacoustic tomography. Med Phys. 2008;35:5758
24. Ntziachristos V, Razansky D. Molecular Imaging by Means of Multispectral Optoacoustic Tomography (MSOT). Chem Rev. 2010;110:2783-94
25. Mallidi S, Luke GP, Emelianov SY. Photoacoustic imaging in cancer detection, diagnosis, and treatment guidance. Trends Biotechnol. 2011;29:213-21
26. Needles A, Heinmiller A, Sun J, Theodoropoulos C, Bates D, Hirson D. et al. Development and initial application of a fully integrated photoacoustic micro-ultrasound system. IEEE Trans Ultrason Ferroelectr Freq Control. 2013;60:888-97
27. Chen B, Pogue BW, Hoopes PJ, Hasan T. Combining vascular and cellular targeting regimens enhances the efficacy of photodynamic therapy. Int J Radiat Oncol Biol Phys. 2005;61:1216-26
28. Osaki T, Takagi S, Hoshino Y, Okumura M, Fujinaga T. Antitumor effects and blood flow dynamics after photodynamic therapy using benzoporphyrin derivative monoacid ring A in KLN205 and LM8 mouse tumor models. Cancer Lett. 2007;248:47-57
29. Becker TL, Paquette AD, Keymel KR, Henderson BW, Sunar U. Monitoring blood flow responses during topical ALA-PDT. Biomed Opt Express. 2011;2:123-30
30. Mallidi S, Anbil S, Lee S, Manstein D, Elrington S, Kositratna G. et al. Photosensitizer fluorescence and singlet oxygen luminescence as dosimetric predictors of topical 5-aminolevulinic acid photodynamic therapy induced clinical erythema. J Biomed Opt. 2014;19:028001
31. Gerling M, Zhao Y, Nania S, Norberg KJ, Verbeke CS, Englert B. et al. Real-time assessment of tissue hypoxia in vivo with combined photoacoustics and high-frequency ultrasound. Theranostics. 2014;4:604-13
32. van Geel IP, Oppelaar H, Rijken PF, Bernsen HJ, Hagemeier NE, van der Kogel AJ. et al. Vascular perfusion and hypoxic areas in RIF-1 tumours after photodynamic therapy. Br J Cancer. 1996;73:288-93
33. Maas AL, Carter SL, Wileyto EP, Miller J, Yuan M, Yu G. et al. Tumor vascular microenvironment determines responsiveness to photodynamic therapy. Cancer Res. 2012;72:2079-88
34. Busch TM, Wileyto EP, Emanuele MJ, Del Piero F, Marconato L, Glatstein E. et al. Photodynamic therapy creates fluence rate-dependent gradients in the intratumoral spatial distribution of oxygen. Cancer Res. 2002;62:7273-9
35. Celli JP, Solban N, Liang A, Pereira SP, Hasan T. Verteporfin-based photodynamic therapy overcomes gemcitabine insensitivity in a panel of pancreatic cancer cell lines. Lasers Surg Med. 2011;43:565-74
36. Pech O, Behrens A, May A, Nachbar L, Gossner L, Rabenstein T. et al. Long-term results and risk factor analysis for recurrence after curative endoscopic therapy in 349 patients with high-grade intraepithelial neoplasia and mucosal adenocarcinoma in Barrett's oesophagus. Gut. 2008;57:1200-6
37. Ashkenazi S. Photoacoustic lifetime imaging of dissolved oxygen using methylene blue. J Biomed Opt. 2010;15:040501
38. Hirao A, Sato S, Saitoh D, Shinomiya N, Ashida H, Obara M. In vivo photoacoustic monitoring of photosensitizer distribution in burned skin for antibacterial photodynamic therapy. Photochem Photobiol. 2010;86:426-30
39. Ho CJH, Balasundaram G, Driessen W, McLaren R, Wong CL, Dinish US. et al. Multifunctional photosensitizer-based contrast agents for photoacoustic imaging. Sci Rep. 2014;4:5342-6
40. Jeon M, Song W, Huynh E, Kim J, Kim J, Helfield BL. et al. Methylene blue microbubbles as a model dual-modality contrast agent for ultrasound and activatable photoacoustic imaging. J Biomed Opt. 2014;19:16005
41. Lovell J, Jin CS, Huynh EE, Jin H, Kim C, Rubinstein J. et al. Porphysome nanovesicles generated by porphyrin bilayers for use as multimodal biophotonic contrast agents. Nat Mater. 2011;10:324-32
42. Huang P, Lin J, Wang S, Zhou Z, Li Z, Wang Z. et al. Photosensitizer-conjugated silica-coated gold nanoclusters for fluorescence imaging-guided photodynamic therapy. Biomaterials. 2013;34:4643-54
43. Lin J, Wang S, Huang P, Wang Z, Chen S, Niu G. et al. Photosensitizer-loaded gold vesicles with strong plasmonic coupling effect for imaging-guided photothermal/photodynamic therapy. ACS Nano. 2013;7:5320-9
44. Xiang L, Da X, Gu H, Yang D, Yang S, Zeng L. et al. Real-time optoacoustic monitoring of vascular damage during photodynamic therapy treatment of tumor. J Biomed Opt. 2007;12:014001
45. Zackrisson S, van de Ven SMWY, Gambhir SS. Light in and sound out: emerging translational strategies for photoacoustic imaging. Cancer Res. 2014;74:979-1004
46. Yoon T-J, Cho Y-S. Recent advances in photoacoustic endoscopy. World J Gastrointest Endosc. 2013;5:534-9
47. Wang B, Su JL, Karpiouk AB, Sokolov KV, Smalling RW, Emelianov SY. Intravascular photoacoustic imaging. IEEE J Quantum Electron. 2010;16:588-99
48. Heijblom M, Piras D, Xia W, van Hespen JCG, Klaase JM, van den Engh FM. et al. Visualizing breast cancer using the Twente photoacoustic mammoscope: What do we learn from twelve new patient measurements? Opt Express. 2012;20:11582
49. de la Zerda A, Paulus YM, Teed R, Bodapati S, Dollberg Y, Khuri-Yakub BT. et al. Photoacoustic ocular imaging. Opt Lett. 2010;35:270-2
50. Wilson KE, Bachawal SV, Tian L, Willmann JK. Multiparametric spectroscopic photoacoustic imaging of breast cancer development in a transgenic mouse model. Theranostics. 2014;4:1064-71
Author contact
![]() Corresponding author: thasanharvard.edu.
Corresponding author: thasanharvard.edu.