Impact Factor
- Issue 14; 2026
- Issue 13; 2026
- Issue 12; 2026
- Issue 11; 2026
- Issue 10; 2026
- Volume 16; 2026
- Advance Articles
- Past Issues
- Cover Images
- Cover Suggestion
- Index & Coverage
- Special Issues
Introduction
Material and methods
Results and Discussion
Conclusions
Supplementary Material
Acknowledgements
References
International Journal of Biological Sciences
International Journal of Medical Sciences
 Global reach, higher impact

Theranostics 2015; 5(12):1419-1427. doi:10.7150/thno.13033 This issue Cite
Research Paper
High Efficiency Molecular Delivery with Sequential Low-Energy Sonoporation Bursts
Kang-Ho Song1, Alexander C. Fan1, John T. Brlansky2, Tammy Trudeau3, Arthur Gutierrez-Hartmann3, Michael L. Calvisi2, Mark A. Borden1 ![]()
1. Department of Mechanical Engineering, University of Colorado, Boulder, CO 80309
2. Department of Mechanical and Aerospace Engineering, University of Colorado, Colorado Springs, CO 80918
3. Department of Medicine, University of Colorado Anschutz Medical Center, Aurora, CO 80045
Received 2015-6-24; Accepted 2015-8-19; Published 2015-10-18
Abstract

Microbubbles interact with ultrasound to induce transient microscopic pores in the cellular plasma membrane in a highly localized thermo-mechanical process called sonoporation. Theranostic applications of in vitro sonoporation include molecular delivery (e.g., transfection, drug loading and cell labeling), as well as molecular extraction for measuring intracellular biomarkers, such as proteins and mRNA. Prior research focusing mainly on the effects of acoustic forcing with polydisperse microbubbles has identified a “soft limit” of sonoporation efficiency at 50% when including dead and lysed cells. We show here that this limit can be exceeded with the judicious use of monodisperse microbubbles driven by a physiotherapy device (1.0 MHz, 2.0 W/cm2, 10% duty cycle). We first examined the effects of microbubble size and found that small-diameter microbubbles (2 µm) deliver more instantaneous power than larger microbubbles (4 & 6 µm). However, owing to rapid fragmentation and a short half-life (0.7 s for 2 µm; 13.3 s for 6 µm), they also deliver less energy over the sonoporation time. This translates to a higher ratio of FITC-dextran (70 kDa) uptake to cell death/lysis (4:1 for 2 µm; 1:2 for 6 µm) in suspended HeLa cells after a single sonoporation. Sequential sonoporations (up to four) were consequently employed to increase molecular delivery. Peak uptake was found to be 66.1 ± 1.2% (n=3) after two sonoporations when properly accounting for cell lysis (7.0 ± 5.6%) and death (17.9 ± 2.0%), thus overcoming the previously reported soft limit. Substitution of TRITC-dextran (70 kDa) on the second sonoporation confirmed the effects were multiplicative. Overall, this study demonstrates the possibility of utilizing monodisperse small-diameter microbubbles as a means to achieve multiple low-energy sonoporation bursts for efficient in vitro cellular uptake and sequential molecular delivery.
Keywords: microbubbles, ultrasound contrast agents, drug delivery, drug release, cell uptake, cell viability
Introduction
Sonoporation uses acoustically mediated cavitation of microbubbles to porate nearby cells through the induction of micro/nanoscale ruptures in the plasma membrane for intracellular delivery of diverse payloads, such as nucleic acids and nanoparticles (1). Unlike electroporation, which uses strong electric field gradients that act on all structures throughout the sample volume, sonoporation generates localized thermal and mechanical effects that function on cells regardless of cell-media composition. Engineering of the microbubbles allows for more advanced effects, such as targeting of surface proteins and co-imaging with diagnostic ultrasound.
One popular application of in vitro sonoporation has been cellular transfection with pDNA (2,3). However, sonoporation offers many more theranostic applications, such as ex vivo transfer of therapeutic and imaging molecules for in vivo transplantation (4-7) (i.e., cell labeling), and transient pore formation for the release and detection of intracellular proteins and mRNA (8,9). Additionally, in vitro sonoporation can serve as a surrogate for drug testing on in vivo disease models (10,11).
One major challenge for sonoporation has been increasing cell uptake efficiency. A review by Liu et al. revealed that out of 26 in vitro sonoporation studies spanning over a decade, none had demonstrated cellular uptake in excess of 50% when accounting for cell lysis and death in their measurements (12). The goal of our study was to surpass this “soft limit” by achieving at least 50% uptake efficiency with monodisperse microbubbles, while properly accounting for cells that were lysed or otherwise lost during handling.
Prior in vitro sonoporation studies have focused mainly on optimization of acoustic parameters with commercially available ultrasound contrast agents, which are highly polydisperse in size (13-16). Recent studies, however, have demonstrated microfluidic (17-24) and centrifugal size sorting (25) methods to produce monodisperse microbubbles of select size. In vivo studies have shown dramatic effects of monodisperse microbubble size on imaging (26) and therapeutic (27) performance. This is not surprising: microbubble size is known to affect resonance, oscillation power and stability (28-30). We therefore chose to focus on microbubble size as the key parameter to optimize in vitro sonoporation efficiency, using a new high-throughput cartridge/bracket system with commonly employed ultrasound parameters (1 MHz, 0.53 MPa peak negative pressure) delivered by an inexpensive physiotherapy device.
Currently, the effect of microbubble size on sonoporation is limited to observations on individual cells. For example, research by Zhou et al. (31,32) demonstrated that larger microbubbles formed larger pores, potentiating the possibility of delivering larger drug molecules than previously possible with commercially available small-diameter microbubble formulations (33). For cell suspensions, however, the situation is made more complex by the three dimensional structure of the cell/microbubble suspension, the transient nature of microbubbles and other effects. We thus structured the first part of our study to examine the influence of microbubble size (2, 4 and 6 µm diameter) on dynamics and stability, and then explore the effects on cell uptake (% treated cells; live, FITC positive), death (% lysine-binding-dye stained cells), lysis (% reduction in total cell count) and unaffected cells. In the second part, we used this knowledge to engineer a method of sequential sonoporations to overcome the 50% soft limit on uptake efficiency.
Material and methods
Materials
1,2-distearoyl-sn-glycero-3-phosphocholine (DSPC) and 1,2-distearoyl-sn-glycero-3-phosphoethanolamine-N-[(polyethylene glycol)-2000] (DSPE-PEG2000) lipid powder was obtained from Avanti Polar Lipids (Alabaster, AL, USA) for microbubble preparation. Perfluorobutane (PFB) gas was obtained from FluoroMed (Round Rock, TX, USA). HeLa cells (ATCC, Manassas, VA, USA) were cultured in DMEM solution (Fisher Scientific, Hampton, NH, USA). 70 kDa FITC-dextran (Sigma-Aldrich, St. Louis, MO, USA) was used for sonoporation assays. Plasmid EGFP-C3 (Clontech, Mountain View, CA, USA) was used for transfection assays, and dead cells were stained with ethidium homodimer-1 or lysine-binding dye (Invitrogen, Grand Island, NY, USA).
Microbubble preparation and characterization
Lipid-encapsulated perfluorocarbon microbubbles were generated via sonication of DSPC and DSPE-PEG2000 lipid suspension at a concentration of 2 mg/mL and molar ratio of 9:1 in phosphate buffered saline (PBS) solution, in the presence of PFB gas. Microbubbles with median diameters of 2, 4 and 6 µm were separated based on size using differential centrifugation (25,26). Microbubble size and concentration were measured with an Accusizer 780 (PSS Nicomp, Santa Barbara, CA, USA) and a Multisizer 3® (Beckman Coulter, Brea, CA, USA).
In vitro sonoporation system
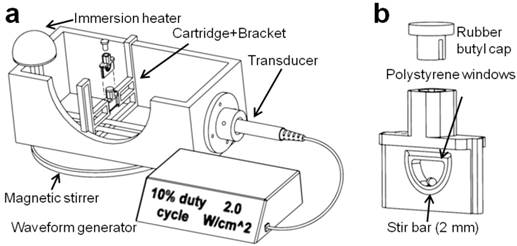
A sonoporation system was constructed to incorporate a 1-inch diameter ultrasound transducer from a Dynatron® 125 (Dynatronics, Salt Lake City, Utah) applying acoustic pulses to a removable 3-D printed sample holder held at a fixed location by a bracket assembly (34) (Fig. 1). The ultrasonic output from the transducer was characterized by a needle hydrophone (HNC-0200, Onda Corp., Sunnyvale, CA) and shown to output a 1.0 MHz, 0.53 ± 0.03 MPa peak negative pressure sound wave at a setting of 2.0 W/cm2, and 1000 cycles per pulse at 100 Hz pulse repetition frequency at a setting of 10% duty cycle (Fig. S1). The cartridge was designed with two acoustically transparent polystyrene windows and an interior bevel to minimize cell retention, as well as a 2-mm magnetic stir bar. Window attenuation and waveform distortion were inspected and found to be minimal at a distance of 5 mm from the trailing acoustic window. The polypropylene bracket was designed for immersion in water up to 40 °C and allowed for the exchange of cartridges with minimal variation in cartridge position relative to the transducer. De-ionized and de-gassed water held at a temperature of 37 °C was used as an acoustic medium.
(a) The in vitro sonoporation apparatus comprised an immersed, sealed treatment cartridge, placed a fixed distance from the ultrasonic transducer. (b) The chamber volume was 0.2 mL, with a total transverse internal width of 2.5 mm. Placement of acoustically transparent polystyrene windows (0.1-mm thick, ~2% reduction in PNP) on the front and back of the chamber allowed ultrasound to travel through with minimal reflections, and a 2-mm magnetic stir bar maintained constant fluid flow in the chamber.
Microbubble survival during exposure to ultrasound
Microbubble concentration over time was measured under typical sonoporation conditions (37 °C, 1.0 MHz, 2.0 W/cm2, 10% duty cycle, 0-2 min exposure time) with experimental groups of 2, 4 and 6-µm diameter microbubbles at an initial concentration of 108/mL. Three 2-μL microbubble samples were taken for each size at 0, 5, 30 and 120 s for a total of 12 samples measured. A mono-exponential function was fit to the resulting concentration-time curves to determine half-life and to estimate concentrations between the measured time points.
Calculation of microbubble oscillation power and energy
Doinikov's equation for the time-averaged non-dimensional power output was used to estimate the relative power delivered by each microbubble per second under these acoustic forcing conditions (30):
(1)
where Δt is one second (1000 cycles per pulse at 100 Hz pulse repetition frequency), R0 is the initial microbubble radius (1, 2 or 3 µm), C(t) is the dynamic microbubble concentration obtained from persistence data and R(t) is the dynamic radius, which was obtained from Marmottant's model for the experimental acoustic driving conditions (Supplemental: Theoretical radial dynamics calculations). These power values for each microbubble size were then integrated over time to obtain the energy delivered to each cell suspension, using the following equation:
(2)
where Δt is the time step (1.0 s) and T is the total exposure time of 120 s.
Cell culture and handling
HeLa cells were procured from ATCC (Cat no. CCL-2) and thawed from 10% DMSO solution. Thawed cells were cultured at 37 oC, 5% CO2 in DMEM with 10% fetal bovine serum supplement (Fisher Scientific, Hampton, NH) and 1% penicillin/streptomycin (Sigma-Aldrich, St. Louis, MO) and passaged until healthy growth patterns were observed. Cells were trypsinized and harvested at 70% confluence for use in sonoporation studies. Cell concentrations during sonoporation were held constant at 5x10⁶ ± 2.5x10⁵ for each experimental group.
Cellular sonoporation assay
FITC-dextran (70 kDa, 0.77 mg/mL, Sigma-Aldrich, St. Louis, MO), a long-chain sugar with a fluoroscein isothiocyanate moiety, was chosen as the indicator of cell permeabilization and uptake (33). 20 µL of FITC-dextran (7.7 mg/mL) was added to 180 µL of microbubble/cell suspension (11 μM final concentration). The sonoporated volume remained 200 µL for all sonoporation conditions. Microbubble concentration was fixed at 5x10⁷ for each group size (2, 4 and 6 μm diameter). Higher microbubble concentrations were avoided due to the high viscosity exhibited by larger size groups. Cell/microbubble/FITC-dextran suspensions were then subjected to ultrasound (1 MHz, 2.0 W/cm2, 10% duty cycle) in the sonoporation system. Treated cell samples were removed from the cartridges and washed three times at 500 RCF in 15-mL cell media tubes. Anti-fluorescein (Invitrogen, Grand Island, NY) was added at a volume fraction of 2 μL in 1 mL (2 μg/mL) to quench residual fluorescence on exterior cell surfaces after the third wash to eliminate FITC fluorescence from non-permeabilized cells. Finally, ethidium homodimer-1 was applied at 0.2 M quantity to each sample to identify dead cells and minimize false positives from auto-fluorescence.
Sequential sonoporations
Separate samples were prepared for each number of sequential sonoporations (n=3); thus, three samples were prepared for one sonoporation and analyzed, then three more samples were prepared for two sonoporations and analyzed after the second sonoporation, and so on. Total cell count was obtained before the first sonoporation and after the last sonoporation by removing 50 µL aliquots for flow cytometric measurement. For a single sonoporation, the samples were sonicated for ten seconds with 2-µm microbubbles (108/mL in 200 µL). For additional sonoporations, 2×10⁷ microbubbles were added to the 200 µL sonoporation volume (108 microbubbles/mL). The total volume of microbubbles added after the fourth sonoporation (<12 µL) was considered minimal compared to the total sonoporation volume (200 µL). Sonoporations were repeated up to four times, then cells were removed from the cartridge and washed three times at 500 RCF in 1.5-mL tubes to remove excess dye. Lysine-binding dye was applied at 0.2 M quantity to each sample to identify dead cells. Any surviving microbubbles were destroyed by transferring samples to a 12-mL syringe and pressurizing the sample to 10 atm for 5 s.
Multi-color sonoporations
To further characterize the effect of the second sonoporation in a double-sonoporated sample, we used a three-color assay. The first sonoporation was conducted with green FITC-dextran and cells were washed and treated with anti-FITC, and TRITC-dextran (7.5 mg/mL) was then substituted for FITC-dextran in the second sonoporation. Washed cells were treated with anti-tetramethylrhodamine (20 µg/mL) before far-red lysine-binding dye was added to stain dead cells.
Flow cytometric analysis
A flow cytometer (Accuri C5, Ann Arbor, MI) was used to count and analyze populations of fluorescent cells. Cells were gated in the forward-vs-side scatter plot and were isolated from the serpentine pattern of microbubbles (35). Once gated in the scatter plot, cells were analyzed for fluorescence by plotting FL1 (520 nm, FITC) vs. FL2 (585 nm, TRITC, ethidium homdimer-1) and gating for dead cells (FL4, 630 nm, far-red lysine-binding dye) (Fig. S2, Flow cytometric analysis).
Data analysis
Comparison of sonoporation and transfection results was conducted through unpaired Student's t-tests between size groups in Prism software (GraphPad, La Jolla, CA, USA). Significant differences were determined for two sample groups if the p-value was found to be smaller than 0.05 (n ≥ 3).
Results and Discussion
Characterization of size-isolated microbubbles
Each sample of size-isolated microbubbles was shown to maintain a consistent median diameter over the course of experimentation, with average median diameters of 1.7, 4.1 and 6.4 μm, and average mode diameters of 1.7, 4.3 and 6.5 μm (Table 1). These three sizes are referred to as 2, 4 and 6 μm microbubble groups, respectively.
Size characteristics of microbubbles used in this study.
| MB size class | Mean (μm)* | Median (μm) | Mode (μm) | |
|---|---|---|---|---|
| 2-µm | Accusizer | 1.53 ± 0.16 | 1.44 ± 0.06 | 1.70 ± 0.19 |
| Multisizer | 1.80 ± 0.02 | 1.73 ± 0.03 | 1.74 ± 0.12 | |
| 4-µm | Accusizer | 3.50 ± 0.25 | 3.67 ± 0.15 | 4.20 ± 0.20 |
| Multisizer | 4.07 ± 0.09 | 4.13 ± 0.05 | 4.33 ± 0.07 | |
| 6-µm | Accusizer | 5.58 ± 0.28 | 5.67 ± 0.22 | 6.36 ± 0.79 |
| Multisizer | 6.24 ± 0.11 | 6.36 ± 0.05 | 6.46 ± 0.14 |
*Measurements were made for n ≥ 3 batches, with at least 3 measurements per batch. All size groups were found to be significantly different from each other for both sizing systems (p < 0.01).
Microbubble dynamics and persistence
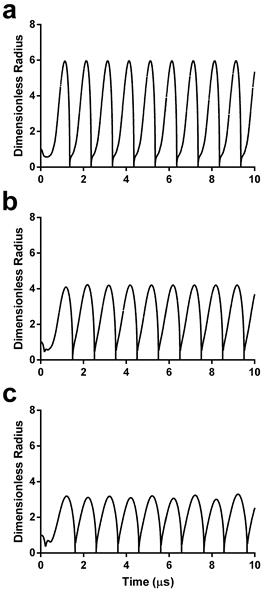
Sonoporation involves mechanical rupture of the cell membrane owing to the local stresses applied by the oscillating microbubble. In previous studies, this stress was modeled as a function of wall velocity (36-38). We therefore calculated the theoretical radius-time curves for the three microbubble sizes using the experimentally validated model by Marmottant et al. for large-amplitude oscillations (39). Under the acoustic driving conditions employed in this study, theory predicts that smaller microbubbles should experience more severe oscillations, i.e., larger relative expansion ratios and wall velocities (Fig. 2).
Dimensionless radius-time curves during acoustic forcing for initial microbubble diameters of 2 µm (a), 4 µm (b) and 6 µm (c). See supplemental information for details on the numerical simulations.
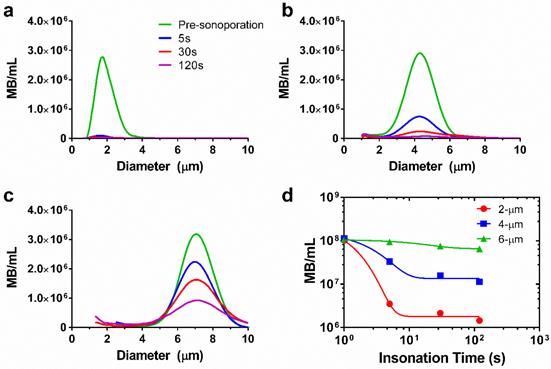
However, the theory does not account for microbubble instabilities, such as dissolution and fragmentation, which may limit the lifetime. We therefore measured microbubble persistence under these acoustic conditions. Our results showed that larger microbubbles were more stable to sonication than smaller ones (Fig. 3, supplemental Table S1). For 2-μm bubbles, a 97% reduction in concentration was observed after five seconds of sonoporation. The 4-μm bubbles demonstrated a 67% reduction in concentration over the same timespan. The 6-μm microbubbles showed the greatest stability, dropping only 7% after five seconds of ultrasonic stimulation. A monoexponential function was fit to the concentration-time data to determine the half-life for each size group and to interpolate concentrations between the experimental measurement times (Fig. 3d). Half-lives of the microbubbles were 0.7, 1.7 and 13.2 s, respectively. These results were consistent with high-speed imaging results of microbubble destruction by Chomas et al. (28), who showed that smaller microbubbles with higher expansion ratios are more likely to experience fragmentation.
Microbubble size distributions and concentrations during ultrasonic stimulation. Electric impedance measurements with the Multisizer III for (a) 2-μm, (b) 4-μm and (c) 6-μm diameter bubbles over the 2-min insonation at 37 °C. The initial concentration for each sample was 108/mL, and concentration measurements were taken at 5, 30 and 120 seconds (n=3). Size distributions were processed using a fourth-order smoothing function. d) The results were aggregated to obtain microbubble concentration over time for each size group. Significant differences were found between all sizes at 5, 30 and 120 s (p < 0.05). The lines are fits to a mono-exponential function.
Theoretical power and energy output
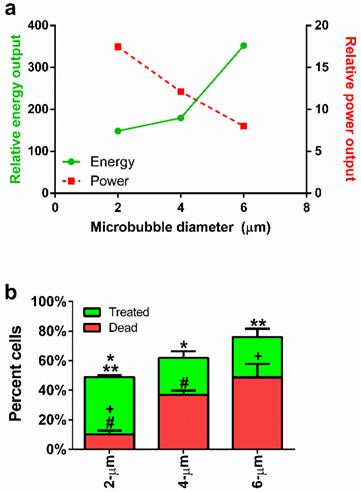
With knowledge of the experimental lifetimes and theoretical dynamics, we were able to compute theoretical power and energy outputs for each microbubble size from equations 1 and 2, respectively. Our modeling results predicted that increasing microbubble size would reduce the instantaneous power output of each microbubble, but increase the total energy delivered owing to longer persistence (Fig. 4a). This presented an interesting dichotomy: small microbubbles provide high-intensity bursts, whereas large microbubbles produce greater overall exposure at a lower intensity. Our next experiment was designed to examine the relative importance of power and energy to sonoporation by measuring the effects on uptake, death and lysis.
(a) Microbubble size vs. calculated power (dotted line) and energy (solid line), obtained from Doinikov's non-dimensional power equation (Equation 1) and an energy model incorporating time and observed concentration values (Equation 2), respectively. (b) Percentage of sonoporated and dead cells in treated samples comparing 2-, 4- and 6-µm microbubbles. Statistical significance: * p < 0.05; ** p < 0.05; + p < 0.05; # p < 0.01.
Effect of microbubble size on sonoporation
Flow cytometry was used to quantify cell uptake, death and lysis (supplemental Fig. S2). Cell uptake of the fluorescence probe was confirmed by fluorescence microscopy (supplemental Fig. S3). Our results are summarized in Figure 4b. Live cells sonoporated with the largest (6-µm) microbubbles displayed lower numbers of live sonoporated cells (27.3 ± 5.6%) and the highest cell death (48.7 ± 9.0%) compared to the smallest microbubbles. Medium-sized (4-µm) microbubbles produced the lowest numbers of sonoporated cells (25.0 ± 4.4%) and an intermediate number of dead cells (36.9 ± 2.9%). Use of the smallest (2-µm) microbubbles resulted in the highest percentage of sonoporated cells (38.8 ± 1.3%) with the lowest percentage of dead cells (10.2 ± 2.5%).
These results indicated that the smallest microbubbles produced enough sonication power to induce cell membrane rupture, but the total energy delivered was relatively nonlethal. This suggests a new paradigm for understanding and controlling in vitro sonoporation: that high-intensity bursts are more effective than high-energy exposures. Thus, small-diameter (2 µm) microbubbles are desirable due to their ability to induce high uptake (49.7%) and low cell death (9.9%) after a single sonoporation. Their primary deficiency is the large number of unaffected cells (>39%) remaining after a single sonoporation. In order to overcome this limitation, we next investigated the use of sequential sonoporations.
Sequential sonoporations
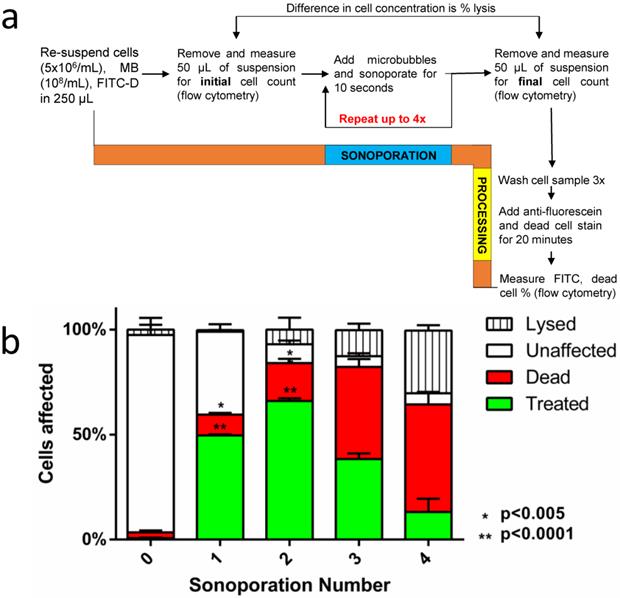
The second goal of this study was to optimize cellular uptake in context of minimizing cell death and lysis over multiple sonoporations. As implemented, sequential sonoporation retains the high-power, low-energy nature of 2-µm bubbles while multiplying the energy output in relatively small increments. Figure 5a illustrates the methodology, and Figure 5b shows the effect of sequential sonoporation: that increasing the number of sonoporations resulted in increased number of live fluorescent (“treated”) cells, as well as an increase in cell death and lysis. Importantly, FITC-dextran uptake peaked at 66.1 ± 1.2% after two sonoporations, when including lysis. In this fashion, we were able to exceed the previously reported soft limit of 50% uptake when including both lysed and dead cells in the total count (supplemental Table S2). Omitting lysed cells from the total cell count, sonoporation efficiency was found to be 71.1 ± 1.3%. Corresponding to the decrease in uptake between sonoporation #2 and 3 was a significant increase in cell death (17.9 ± 2.0 → 43.8 ± 3.8%). This increase was less pronounced between #3 and 4 (43.8 ± 5.1% → 51.2 ± 6.0%). Instead, cell lysis increased significantly between the third and fourth sonoporations (12.4 ± 3.1% → 29.9 ± 2.6%).
(a) A flow diagram of the methodology used in sequential sonoporations. (b) The effect of sequential sonoporations on cell uptake, death and lysis, as measured by flow cytometry. The initial microbubble concentration for each sample was 108/mL, and cell counts were obtained before and after sonoporation to determine cell loss (n=3). FITC-Dextran uptake peaked at the second sonoporation (p<0.05), with cell death and lysis increasing disproportionately over subsequent sonoporations.
While it is still possible that microbubble and acoustic parameters could be optimized for high-efficiency single sonoporations, there appears to be an intrinsic interaction limit stemming from the transient nature of microbubbles, which restricts the number of cells the microbubble suspension can affect before clearance. It is therefore advantageous to use sequential sonoporations. Our results suggested that sonoporations are multiplicative out to the second sonoporation under these conditions (supplemental Fig. S4), beyond which the cell death and lysis rates increase disproportionately. A second potential advantage of sequential sonoporation is multi-drug delivery, which we examined next with the use of two different fluorescent probes.
Multi-color sonoporations
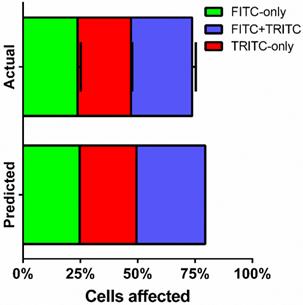
Fractions of live cells were analyzed by multi-color sonoporation in order to separate uptake from the effects of cell death. Fluorescent marker uptake from the first sonoporation indicated that approximately 55% of live cells were treated after each sonoporation. Changing the fluorescent uptake marker from FITC to TRITC for the second sonoporation resulted in three distinct fluorescent populations: FITC-only (23.8 ± 1.3%), TRITC-only (23.3 ± 0.5%), and FITC+TRITC co-fluorescent (26.6 ± 1.6%) cells (Fig. 6, supplemental Table S3). Cell death in multi-color experiments were similar to those found in FITC-only trials (22.1 ± 1.4% vs. 17.9 ± 2.0%). Indeed, dual-color sonoporations produced multiplicative trends similar to predicted values (see supplemental information): a single sonoporation induced FITC-dextran uptake in 49.7% of the cells, and the second sonoporation resulted in 66% uptake (73.7% when not counting dead or lysed cells). Substituting TRITC for the second sonoporation further supported multiplicative uptake, with 25-30% co-fluorescent (FITC and TRITC-present) cells resulting from two sonoporations.
FITC- and TRITC-dextran uptake over two sonoporations. FITC-dextran was used as an uptake marker in the first sonoporation, and cells were washed and processed before a second sonoporation in the presence of TRITC-dextran (n=3).
As an investigative tool, sequential sonoporation may yield further insight into cellular stress and mortality to supplement single-cell sonoporation studies done under the microscope (32). In our study, further analyses of cell populations revealed that after two sonoporations, the number of dead co-fluorescent cells was not significantly higher than dead single-sonoporated cells, suggesting that cell stress thresholds were only exceeded after cells were sonoporated three times. Future studies could investigate the effect of cellular resting periods between sonoporations to further reduce cell stress and improve therapeutic efficiency.
Combined with systematic identification of cell stress thresholds, sequential sonoporation allows for predictable and sequential delivery of multiple drugs to cell populations, facilitating the study of interdependent drug effects. Further optimization of the sequential sonoporation methodology could employ microbubbles of various concentrations, diameters and shell compositions in each sonoporation (as well as various ultrasound parameters) to achieve the desired percentage, magnitude and specificity of effect for each drug type.
Conclusions
We conclude that microbubble size is an important parameter for in vitro sonoporation, markedly affecting microbubble persistence and sonoporation mechanics. While acoustic parameters and microbubble concentration certainly play significant roles, size appears to provide additional control over the power and energy delivered to cells. Our data indicate that the prolonged persistence of larger microbubbles delivers more total energy to the cell membrane, increasing cell death. In contrast, owing to a drastically larger expansion ratio, smaller microbubbles deliver high power and a short half-life, porating cells with minimal loss of viability. By extending this efficiency gain through multiple bursts of low-energy sonoporation, we were able to further augment cellular uptake - above the putative 50% limit - without excessive cell death and lysis. Indeed, two sequential sonoporations with 2-μm bubbles induced the highest FITC-dextran uptake. Our multi-color sonoporation assay utilizing FITC- and TRITC-dextran confirmed that this gain proceeds in a multiplicative fashion. Further treatments resulted in diminished viability, indicating a finite energy threshold for cell death. This general strategy to first explore the effects of power and energy on cell uptake and viability, followed by optimization of multiple treatments, can be applied to diagnostic and therapeutic treatment of other cell types in vitro and in vivo to further enhance the utility of sonoporation for future theranostic applications.
Supplementary Material
Figures S1-S5.
Acknowledgements
The authors would like to thank Dr. Shashank Sirsi for help with experimental methodology and insightful discussions. Funding was provided by NSF grant DMR 1409972 to M.A.B., Colorado Clinical and Translational Sciences Institute (CCTSI) grant to M.A.B. and A.G.H., and the UCCS Center for the Biofrontiers Institute to M.L.C.
Competing Interests
The authors have declared that no competing interest exists.
References
1. Husseini GA, Pitt WG. Micelles and nanoparticles for ultrasonic drug and gene delivery. Adv Drug Deliv Rev. 2008Jun;60(10):1137-52
2. Miller DL, Bao S, Morris JE. Sonoporation of cultured cells in the rotating tube exposure system. Ultrasound Med Biol. 1999;25(1):143-9
3. Christiansen JP, French BA, Klibanov AL, Kaul S, Lindner JR. Targeted tissue transfection with ultrasound destruction of plasmid-bearing cationic microbubbles. Ultrasound Med Biol. 2003;29(12):1759-67
4. Partlow KC, Brant JA, Marsh JN, Nolta JA, Hughes MS, Lanza GM. et al. Ultrasound energy rapidly labels stem/progenitor cells with nanoparticle beacons without disrupting membrane integrity. 2007 Ieee Ultrasonics Symposium Proceedings, Vols 1-6. New York: Ieee. 2007:1768-71
5. Mo R, Lin S, Wang G, Wang Y, Wu EX. Preliminary in vitro study of ultrasound sonoporation cell labeling with superparamagnetic iron oxide particles for MRI cell tracking. Conf Proc Annu Int Conf IEEE Eng Med Biol Soc IEEE Eng Med Biol Soc Annu Conf. 2008;2008:367-70
6. Skachkov I, Luan Y, van Tiel S, van der Steen T, Kooiman K, Bernsen M. et al. Ultrasound contrast agents mediated cell labeling for MRI tracking. New York: Ieee. 2012
7. Kolarova M, Polakova K, Tomankova K, Havrdova M, Markova Z, Zboril R. Rapid Cellular Uptake of Superparamagnetic Iron Oxide Nanoparticles by Using Low-Intensity Ultrasound. Nanocon 2013 5th Int Conf. 2014:578-83
8. D'Souza AL, Tseng JR, Pauly KB, Guccione S, Rosenberg J, Gambhir SS. et al. A strategy for blood biomarker amplification and localization using ultrasound. Proc Natl Acad Sci. 2009;106(40):17152-7
9. Forbrich A, Paproski R, Hitt M, Zemp R. Microbubble-Enhanced Ultrasound Liberation of mRNA Biomarkers In Vitro. Ultrasound Med Biol. 2013Jun;39(6):1087-93
10. Li YS, Davidson E, Reid CN, McHale AP. Optimising ultrasound-mediated gene transfer (sonoporation) in vitro and prolonged expression of a transgene in vivo: Potential applications for gene therapy of cancer. Cancer Lett. 2009Jan;273(1):62-9
11. Iwanaga K, Tominaga K, Yamamoto K, Habu M, Maeda H, Akifusa S. et al. Local delivery system of cytotoxic agents to tumors by focused sonoporation. Cancer Gene Ther. 2007;14(4):354-63
12. Liu Y, Yan J, Prausnitz MR. Can Ultrasound Enable Efficient Intracellular Uptake of Molecules? A Retrospective Literature Review and Analysis. Ultrasound Med Biol. 2012
13. Hallow DM, Mahajan AD, Prausnitz MR. Ultrasonically targeted delivery into endothelial and smooth muscle cells in< i> ex vivo</i> arteries. J Controlled Release. 2007;118(3):285-93
14. Reslan L, Mestas J-L, Herveau S, Béra J-C, Dumontet C. Transfection of cells in suspension by ultrasound cavitation. J Controlled Release. 2010;142(2):251-8
15. Qiu Y, Zhang C, Tu J, Zhang D. Microbubble-induced sonoporation involved in ultrasound-mediated DNA transfection in vitro at low acoustic pressures. J Biomech. 2012May;45(8):1339-45
16. Escoffre J, Novell A, Piron J, Zeghimi A, Doinikov A, Bouakaz A. Microbubble attenuation and destruction: are they involved in sonoporation efficiency?. IEEE Trans Ultrason Ferroelectr Freq Control [Internet]. 2013:60 (1). http://ieeexplore.ieee.org/lpdocs/epic03/wrapper.htm?arnumber=6396485
17. Hettiarachchi K, Talu E, Longo ML, Dayton PA, Lee AP. On-chip generation of microbubbles as a practical technology for manufacturing contrast agents for ultrasonic imaging. Lab Chip. 2007;7(4):463-8
18. Talu E, Hettiarachchi K, Powell RL, Lee AP, Dayton PA, Longo ML. Maintaining Monodispersity in a Microbubble Population Formed by Flow-Focusing. Langmuir. 2008Mar;24(5):1745-9
19. Talu E, Hettiarachchi K, Zhao S, Powell RL, Lee AP, Longo ML. et al. Tailoring the size distribution of ultrasound contrast agents: possible method for improving sensitivity in molecular imaging. Mol Imaging. 2007;6(6):384
20. Dollet B, van Hoeve W, Raven J-P, Marmottant P, Versluis M. Role of the Channel Geometry on the Bubble Pinch-Off in Flow-Focusing Devices. Phys Rev Lett [Internet]. 2008:100 (3). http://link.aps.org/doi/10.1103/PhysRevLett.100.034504
21. Van Hoeve W, Dollet B, Versluis M, Lohse D. Microbubble formation and pinch-off scaling exponent in flow-focusing devices. Phys Fluids 1994-Present. 2011;23(9):092001
22. Chen C, Zhu Y, Leech PW, Manasseh R. Production of monodispersed micron-sized bubbles at high rates in a microfluidic device. Appl Phys Lett. 2009;95(14):144101
23. Parhizkar M, Edirisinghe M, Stride E. Effect of operating conditions and liquid physical properties on the size of monodisperse microbubbles produced in a capillary embedded T-junction device. Microfluid Nanofluidics. 2013May;14(5):797-808
24. Parrales MA, Fernandez JM, Perez-Saborid M, Kopechek JA, Porter TM. Acoustic characterization of monodisperse lipid-coated microbubbles: Relationship between size and shell viscoelastic properties. J Acoust Soc Am. 2014;136(3):1077-84
25. Feshitan JA, Chen CC, Kwan JJ, Borden MA. Microbubble size isolation by differential centrifugation. J Colloid Interface Sci. 2009;329(2):316-24
26. Sirsi S, Feshitan J, Kwan J, Homma S, Borden M. Effect of microbubble size on fundamental mode high frequency ultrasound imaging in mice. Ultrasound Med Biol. 2010;36(6):935-48
27. Choi JJ, Feshitan JA, Baseri B, Shougang Wang, Yao-Sheng Tung, Borden MA. et al. Microbubble-Size Dependence of Focused Ultrasound-Induced Blood-Brain Barrier Opening in Mice In Vivo. IEEE Trans Biomed Eng. 2010Jan;57(1):145-54
28. Chomas JE, Dayton P, May D, Ferrara K. Threshold of fragmentation for ultrasonic contrast agents. J Biomed Opt. 2001;6:141
29. Postema M, van Wamel A, Lancée CT, de Jong N. Ultrasound-induced encapsulated microbubble phenomena. Ultrasound Med Biol. 2004Jun;30(6):827-40
30. Doinikov AA, Haac JF, Dayton PA. Resonance frequencies of lipid-shelled microbubbles in the regime of nonlinear oscillations. Ultrasonics. 2009;49(2):263-8
31. Zhou Y, Kumon RE, Cui J, Deng CX. The size of sonoporation pores on the cell membrane. Ultrasound Med Biol. 2009;35(10):1756-60
32. Zhou Y, Yang K, Cui J, Ye JY, Deng CX. Controlled permeation of cell membrane by single bubble acoustic cavitation. J Controlled Release [Internet]. 2011 [cited. 2012 Aug 21]; Available from: http://www.sciencedirect.com/science/article/pii/S0168365911008534
33. Karshafian R, Bevan PD, Williams R, Samac S, Burns PN. Sonoporation by ultrasound-activated microbubble contrast agents: effect of acoustic exposure parameters on cell membrane permeability and cell viability. Ultrasound Med Biol. 2009;35(5):847-60
34. Song KH, Fan A, Brlansky J. et al. Efficient microbubble-assisted sonoporation for in vitro applications. Manuscript.
35. Satinover SJ, Dove JD, Borden MA. Single-Particle Optical Sizing of Microbubbles. Ultrasound Med Biol. 2014Jan;40(1):138-47
36. Lewin PA, Bjørnø L. Acoustically induced shear stresses in the vicinity of microbubbles in tissue. J Acoust Soc Am. 1982;71:728
37. Wu J. Theoretical study on shear stress generated by microstreaming surrounding contrast agents attached to living cells. Ultrasound Med Biol. 2002;28(1):125-9
38. Doinikov AA, Bouakaz A. Theoretical investigation of shear stress generated by a contrast microbubble on the cell membrane as a mechanism for sonoporation. J Acoust Soc Am. 2010;128(1):11
39. Marmottant P, Meer S van der, Emmer M, Versluis M, Jong N de, Hilgenfeldt S. et al. A model for large amplitude oscillations of coated bubbles accounting for buckling and rupture. J Acoust Soc Am. 2005Dec1;118(6):3499-505
Author contact
![]() Corresponding author: Mark A Borden, PhD, Department of Mechanical Engineering, University of Colorado, 1111 Engineering Drive, Boulder, CO 80309-0427. Phone: 303.492.7750; Fax: 303.492.3498; Email: mark.bordenedu
Corresponding author: Mark A Borden, PhD, Department of Mechanical Engineering, University of Colorado, 1111 Engineering Drive, Boulder, CO 80309-0427. Phone: 303.492.7750; Fax: 303.492.3498; Email: mark.bordenedu