Impact Factor
- Issue 14; 2026
- Issue 13; 2026
- Issue 12; 2026
- Issue 11; 2026
- Issue 10; 2026
- Volume 16; 2026
- Advance Articles
- Past Issues
- Cover Images
- Cover Suggestion
- Index & Coverage
- Special Issues
1. Introduction
2. Results
3. Discussion
4. Conclusion
5. Experimental Section
Supplementary Material
Acknowledgements
References
International Journal of Biological Sciences
International Journal of Medical Sciences
 Global reach, higher impact

Theranostics 2015; 5(12):1444-1455. doi:10.7150/thno.13398 This issue Cite
Research Paper
Noninvasive Dynamic Imaging of Tumor Early Response to Nanoparticle-mediated Photothermal Therapy
Fan Zhang1 ![]() , Jianbo Cao1#, Xiao Chen2, Kai Yang3, Lei Zhu1, Guifeng Fu1, Xinglu Huang4
, Jianbo Cao1#, Xiao Chen2, Kai Yang3, Lei Zhu1, Guifeng Fu1, Xinglu Huang4 ![]() , Xiaoyuan Chen4
, Xiaoyuan Chen4 ![]()
1. State Key Laboratory of Molecular Vaccinology and Molecular Diagnostics & Center for Molecular Imaging and Translational Medicine, School of Public Health, Xiamen University, Xiamen, Fujian, 361005, China.
2. Department of Pathology, Xinjiang Medical University, Urumqi, Xinjiang 830011, China.
3. Jiangsu Key Laboratory for Carbon-Based Functional Materials and Devices, Institute of Functional Nano and Soft Materials Laboratory (FUNSOM), Soochow University, Suzhou, Jiangsu, 215123, China.
4. Laboratory of Molecular Imaging and Nanomedicine (LOMIN), National Institute of Biomedical Imaging and Bioengineering (NIBIB), National Institutes of Health (NIH), Bethesda, Maryland 20892, United States.
#These authors contributed equally to this work.
Received 2015-7-30; Accepted 2015-9-12; Published 2015-10-18
Abstract

In spite of rapidly increasing interest in the use of nanoparticle-mediated photothermal therapy (PTT) for treatment of different types of tumors, very little is known on early treatment-related changes in tumor response. Using graphene oxide (GO) as a model nanoparticle (NP), in this study, we tracked the changes in tumors after GO NP-mediated PTT by magnetic resonance imaging (MRI) and quantitatively identified MRI multiple parameters to assess the dynamic changes of MRI signal in tumor at different heating levels and duration. We found a time- and temperature-dependent dynamic change of the MRI signal intensity in intratumor microenvironment prior to any morphological change of tumor, mainly due to quick and effective eradication of tumor blood vessels. Based on the distribution of GO particles, we also demonstrated that NP-medited PTT caused heterogeneous thermal injury of tumor. Overall, these new findings provide not only a clinical-related method for non-invasive early tracking, identifying, and monitoring treatment response of NP-mediated PTT but also show a new vision for better understanding mechanisms of NP-mediated PTT.
Keywords: Photothermal therapy, nanoparticles, magnetic resonance imaging, tumor blood vessels
1. Introduction
In recent years, photothermal therapy (PTT) combined with nanotechnology has attracted tremendous attention[1-4]. A large number of researchers are engaging in design and development of novel nanoparticles (NPs) that possess high tumor uptake and photo-heat transfer efficiency for achieving a relative high temperature (i.e. higher than 60 ºC), which is much more than the temperature of hyperthermia in clinical trial (40-44 ºC). Up to now, however, several important aspects about nanoparticles-meditate photothermal therapy (NP-mediated PTT) are still unclear: (i) which temperature is suitable for effective tumor ablation; (ii) what happens in intratumor microenvironment after NP-mediated PTT; and (iii) whether tumor therapeutic outcomes can be tracked early and monitored by noninvasive imaging techniques. A better understanding of these questions will contribute to the guidance of nanoparticles design, dose optimization, and improvement of treatments on an individual level.
Treatment accuracy is enhanced by incorporating different imaging techniques for monitoring and evaluation. Magnetic resonance imaging (MRI) is an excellent clinically technique for the in vivo noninvasive evaluation of tissue changes. The regions of thermal damage can be visualized shortly after treatment with MRI[5, 6]. Considering potential tissue damage following focal hyperthermia, multi-parametric magnetic resonance imaging (MP-MRI) is more desirable for early monitoring of treatment response[7]. For example, the current MRI technique for evaluating vascular injury is Contrast-enhanced T1-weighted MR imaging (CE-MRI), in which tissue lacking blood perfusion appears as an area lacking signal enhancement[8]. A subset of thermal therapy cases may result in hemorrhage within the tumor. The breakdown products of hemoglobin exert a paramagnetic effect which shortens T2 relaxation times, resulting in the presence of a characteristic hypointenseonin T2-weighted (T2WI) or T2-star weighted (T2*WI) imaging which is important prognostic marker that can be used for detection of intramyocardial hemorrhage[9]. Diffusion-weighted imaging (DW-MRI) is highly sensitive to factors that affect microscopic water motion, for detecting early ischemic changes in injury[10]. Apparent diffusion coefficient (ADC) changes, the quantitative parameter of DW-MRI, have been proposed to evaluate brain tumor response to radiation[11], to predict rectal cancer response to radiochemotherapy[12], to monitor prostate thermal therapy [5] and to assess tissue damage under HIFU[13].
The intrinsic high absorption of near-infrared light by GO has contributed to increasing interest in PTT[14, 15]. In others and our studies, we have reported the nanographene sheets conjugated with polyethylene glycol (PEG) showed highly passive tumor targeting and low retention in reticuloendothelial systems (RES)[16-19]. The functionalized GO anchored with magnetic nanoparticles (MNPs)[20] and semiconductor quantum dots[21] makes it feasible for imaging guided PTT. Based on these promising applications, in this study, we chose graphene oxide (GO) as a model NP. The over-arching objective of this study is to use non-invasive MP-MRI to investigate intratumor variation after GO-meditate PTT and to understand the effect of heating levels and duration on tumor ablation. We also examined whether tumor therapeutic outcome can be early tracked and monitored by noninvasive imaging techniques.
2. Results
2.1 Preparation and characterization of GO-PEG and GO-PEG-Cy5.5
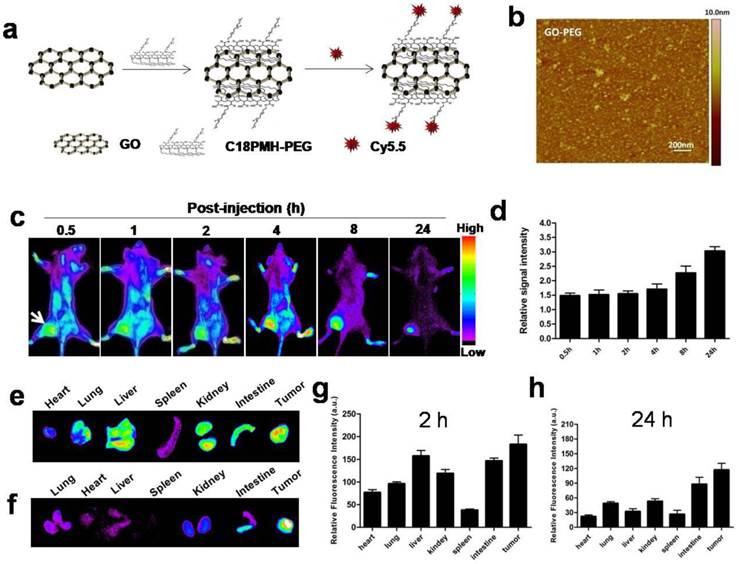
GO-PEG was prepared from graphene oxide (GO) following previous protocol[18]. Atomic force microscope (AFM) images showed that GO-PEG were very small sheets with a size range of 10-30 nm (Fig. 1b). In order to track graphene in vivo, we labeled GO-PEG with Cy5.5. The UV-vis spectra confirmed the existence of Cy5.5 in our labeled GO-PEG sample (Supplementary Fig. 1a). A rapid elevation of temperature for GO-PEG solution was observed when exposed to the laser irradiation for 3 min (Supplementary Fig. 1b-c).
In vivo tumor targeting and biodistribution of GO-PEG-Cy5.5.(a) Schematic illustration of the preparation of GO-PEG-Cy5.5. (b) Atomic force microscopy (AFM) image of GO-PEG. (c) In vivo NIRF imaging of 4T1 tumor-bearing mice injected with GO-PEG-Cy5.5 over time. The images were acquired at the indicated time points. (d) Quantification analysis of the tumor-to-background ratio (TBR; defined as the signal from the tumor divided by the signal from nearby normal tissue) at different time points (n = 5). Ex vivo imaging of GO-PEG-Cy5.5 in heart, lung liver, spleen, kidney, intestine and tumor at (e) 2 h and (f) 24 h post injection, respectively. (g, h) Quantitative analysis of the signal from (e) and (f).
2.2 In vivo near infrared (NIR) fluorescence imaging of tumor uptake of GO-PEG
Achieving an adequate tumor accumulation is a challenge for systemic delivery of nanomaterials. Before testing photothermal cancer therapeutic effect, we confirmed in vivo tumor-targeting capability of GO-PEG by NIR fluorescence imaging. GO-PEG labeled with Cy5.5 (GO-PEG-Cy5.5) (Fig. 1a) was injected via tail vein into 4T1 tumor-bearing mice, and the images were acquired at the indicated time points postinjection (p.i.). As shown in Fig. 1c and d, signal intensity of the tumor (116.6 ±17.4) was clearly visualized with a high contrast to the background (36.0 ±5.3) at 24 h in vivo. Quantitative analysis of the tumor-to-background ratio (TBR; defined as the signal from the tumor divided by the signal from nearby normal tissue) was about 1.5 ± 0.2 at 30 min p.i., which increased to 3.0 ± 0.5 at 24 h. Significant particle accumulation in the tumor was further confirmed by ex vivo imaging of organs obtained by sacrificing the mice at 2 h (Fig. 1e and 1g) and 24 h (Fig. 1f and 1h) time points, respectively. Tumor signal intensity of GO-PEG-Cy5.5, at both 2 h (361.7±43.3) and 24 h (295.3± 55.7), were higher than those of reticuloendothelial system (RES) organs, such as liver (at 246.6 ± 35.4 at 2 h; 69.6 ± 12.3 at 24 h ), lung (176.5 ± 25.2 at 2 h; 42.3 ± 9.6 at 24 h) and spleen (59.8 ±10.3 at 2 h; 36.3 ± 7.6 at 24 h), indicating that GO-PEG is capable of adequate tumor accumulation with limited RES capture. Furthermore, the tumor signal at 24 h was only slightly less than that at 2 h, which indicates a long circulation time of GO-PEG in vivo[22], and thus provides a broad time-window for laser irradiation in the later experiment.
2.3 Non-invasive MRI monitoring of early changes in tumor
As tumor responds to PTT, changes occur within the tumor. MRI is an effective imaging procedure that depicts physiological and molecular processes before morphological changes are visible in conventional imaging[23]. In this study, besides that of T2WI and T2* WI, we also utilized DW-MRI as MR imaging techniques for monitoring tumor responses to PTT at early stages. To explore what happened upon laser irradiation, we hypothesized that these MRI tools could detect early changes in the tumor prior to any morphological change in the tumor. After i.v. injections of GO-PEG (200 μL of 2 mg/mL solution for each mouse) for 24 h, the 4T1 tumors implanted BALB/C mice were irradiated by adjusting laser power (1.5-3 W/cm2) until temperatures reached the expected temperature (about 1.5 min) and keeping this temperature for 15 min. Mapping and quantifying the rising tumor temperatures was monitored by real-time thermal imaging using a thermal camera. Finally, four representative temperatures (42 ºC, 48 ºC, 53 ºC and 58 ºC) were determined, and subsequently the changes in the tumor region 30 min after irradiation were observed with T2WI, T2* WI, and DW-MRI.
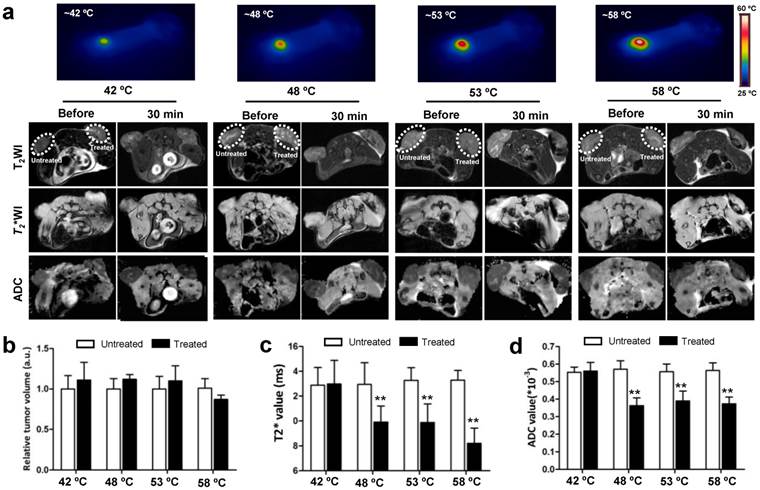
As shown in Fig. 2a, compared to before irradiation, the morphologies of tumors were not altered after irradiation at four temperatures. T2WI quantification analysis of tumor volumes also revealed no obvious change before and after irradiation (Fig.2b). However, under T2* WI and ADC map observation after irradiation, we found well-defined hypo-intensities at the host-tumor interface, especially under 48 ºC, 53 ºC and 58 ºC. The mean baseline ADC value in the tumor was 0.593×10⁻³ mm/sec2 ± 0.178 and T2* value was 13.488 ms ± 2.41 (n=6). The mean ADC value and T2* values was significantly reduced in the post-treated tumor under 48 ºC (0.358×10⁻³ mm/sec2±0.098, 10.542 ms±0.93), 53ºC (0.351×10⁻³ mm/sec2±0.121, 9.395 ms±1.15) and 58 ºC (0.339×10⁻³ mm/sec2±0.105, 9.198 ms±1.24) irradiation compared to those without and before treatment (p<0.01) (Fig. 2c and d). For the untreated tumor, no detectable signal change in T2*WI and ADC map was observed. The results demonstrated that MRI monitors early changes in the tumor upon laser irradiation in a non-invasive manner, which provides a potential tool for early and non-invasive prediction of therapeutic response to NP-mediated PTT.
In vivo MRI analysis of 4T1 tumor response to graphene oxide (GO) nanoparticle-mediated PTT. (a) Representative MRI of 4T1 tumor-bearing mice before and 30 min after PTT at four different temperatures of 42, 48, 53 and 58 ºC, respectively (n=5/group). T2 WI, T2* WI, and DW-MRI were acquired and the tumor volumes (b) T2*values (c) and ADC values (d) were analyzed, respectively. Left tumor, untreated; right tumor, PTT treated. Data show mean ± S.E.M. (n=5/group, **p < 0.01, vs. corresponding untreated tumors)
2.4 Longitudinal monitoring of therapeutic response to different heating levels
Encouraged by the above results, we attempted next to detect such dynamic changes after NP-mediated PTT at different temperatures over time, using T2WI, T2*WI, and DW-MRI acquired before and after PTT under the different levels of heating (Supplementary Fig.2a). The size of the tumors with 42 ºC treatment gradually increased over time, as shown by the analysis of T2 images, and had absolutely no significant change at each of the indicated time points when compared to untreated tumor (Fig.3, left lane). However, as temperature increased to 58 ºC, an obvious decrease of tumor size was observed as early as 24 h after treatment, which was two days in advance of 48 ºC and 53 ºC treatment. Moreover, unlike the treatment at 58 ºC, the treatment at temperatures of 48 ºC and 53 ºC did not entirely erase the tumor and tumor recurrence was found 5 days after treatment. These results suggest that the tumor ablation effect under laser irradiation increases as levels of heating increases. It also seems that higher temperatures easily cause obvious morphological changes in the tumor, but no earlier than 24 h after treatment.
Kinetics of changes in tumor volume, T2 values and ADC values without and with 15 min PTT at different temperatures. Left lane, normalized tumor volume calculated from MRI. Middle lane, kinetic of changes in T2 values from MRI. Right lane, kinetic of changes in ADC values from DW-MRI. The T2 and ADC values at 58 ºC were not presented due to the tumors were completely ablated 5 d after PTT. Data shown are mean ± S.E.M. (n=5/group. Gray area, p<0.05; red, orange and purple area, p<0.01 vs corresponding untreated tumor for that time point).
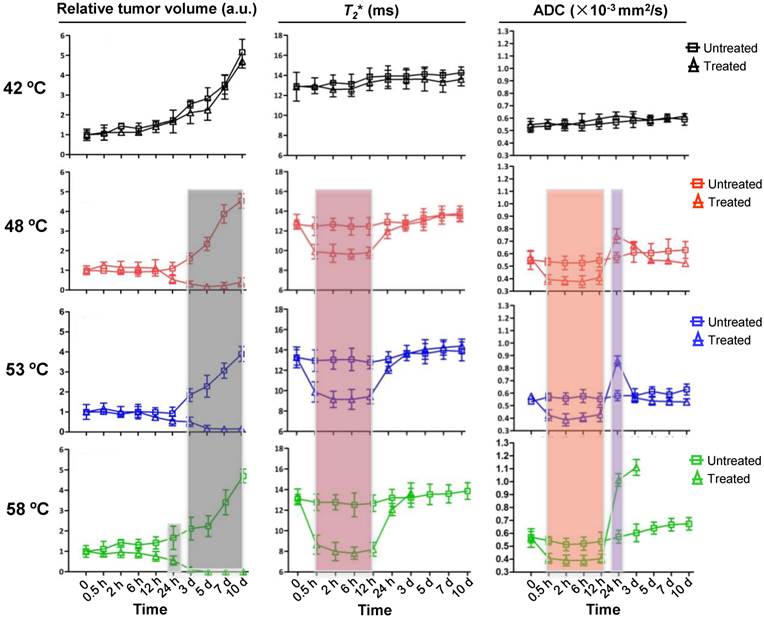
We next determined whether the dynamic change of tumor was earlier than that of the change in tumor morphology under different treatment temperatures, as manifested in T2* WI and ADC map signal intensity under the same conditions (Fig.3, middle and right lane). No significant dynamic changes of the T2* values and ADC values upon 42 ºC treatment were found by whole tumor ROI analysis at each indicated time point within 10 days of observation, which agreed with the results of Fig. 1a and b. For the treatments at 48 ºC, 53 ºC and 58 ºC, T2* values from 0.5 h to 12 h were apparently lower than those of the untreated groups, and the decrease in amplitude was amplified with the rising of temperature. In addition, the ADC map signal intensity also decreased in this time-window, showing a similar dynamic pattern with T2* values. Different from the T2* values, however, the ADC values were suddenly increased at 24 h (0.781×10⁻³mm/sec2±0.231 at 48ºC, 0.781×10⁻³mm/sec2±0.259 at 53ºC, 1.109×10⁻³mm/sec2±0.334 at 58ºC) time point in comparison to those of untreated tumors. At day 3, the ADC values of residual tumor reached peak at 58ºC treatment (1.284×10⁻³mm/sec2±0.425) and return to baseline at 48ºC and 53ºC treatment. The above results show an interesting outcome where the non-invasive imaging time-window of tumor microenvironment changes prior to any morphological change.
We then evaluated the treatment efficacy of PTT at different heating levels. The median survival time of mice without treatment was only 7 days, which increased to 9 days at 42 ºC (p>0.05). In contrast, treatment under 48 ºC and 53 ºC increased median survival to 23 and 26 days (p<0.001), respectively. Particularly for 58 ºC treatment, a 60% survival rate was recorded within 45 days of the experiment (Supplementary Fig. 2b). The mice survival percentage matched with the change in amplitude of ADC value, suggesting ADC measurements may be used as a non-invasive tool to evaluate response to PTT.
2.5 NP-mediated PTT cause acute hemorrhage and necrosis
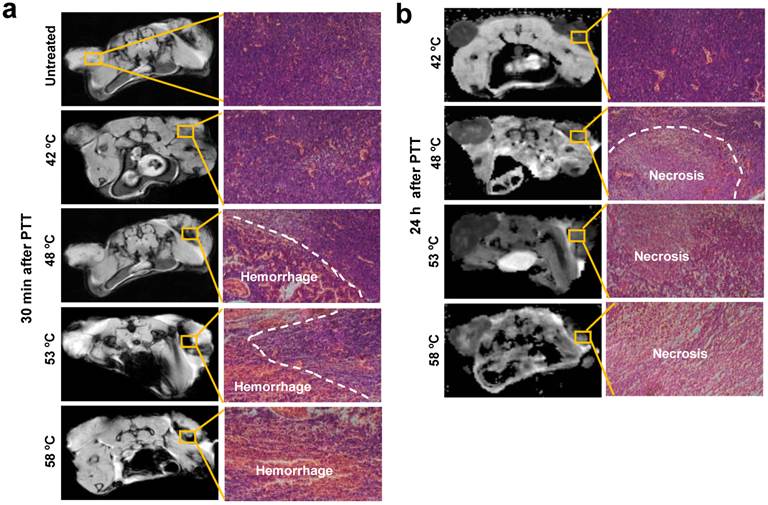
To understand the reasons for changes of the tumor microenvironment, we compared tumor histological changes before and after PTT. As observed in Fig. 4 and Supplementary Fig. 2a, the major varied region of T2* and DW-MRI signal distributed in the host-tumor interface. Thus, the tumor tissue slices of this region were prepared at the indicated time points and were observed after application of hematoxylin and eosin (H&E) histological staining. As displayed in Fig. 4a, compared to untreated tumor tissues, a minor hemorrhage was seen 30 min after treatment at 42 ºC, whereas a large area of acute hemorrhage was found at 48 ºC, 53 ºC and 58 ºC, respectively. Further analysis of tumor tissue changes was executed through observation of the tumor tissues 24 h after irradiation. In agreement with acute hemorrhage, the treatment at 42 ºC caused slight necrosis of tumor tissue, and the area of necrosis tissue was expanded with the rising of temperatures. It has been reported by others that acute hemorrhage and tissue necrosis significantly induce changes of MRI signal intensity[24].
H&E histological staining of tumor area without and with 15 min PTT at different temperatures. (a) Acute hemorrhage was observed 30 min after PTT. (b) PTT caused a large area of tumor cell necrosis 24 h after PTT. Representative specimens are shown. Left tumor, untreated; right tumor, treated.
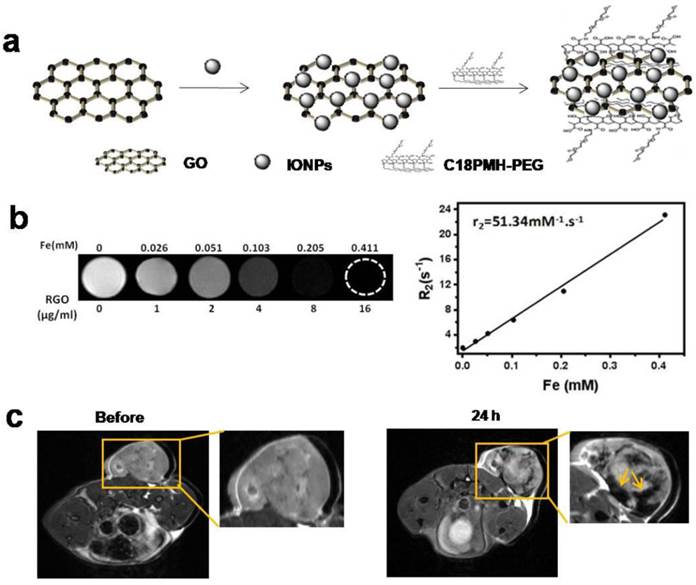
To explain why acute hemorrhage was easier to occur in the host-tumor interface, we prepared PEGylated GO-iron oxide NPs (GO-IONP-PEG) for understanding the in vivo biodistribution of particles (Fig. 5a). As shown in Fig.5b, T2-weighted MR images of GO-IONP-PEG solutions display the signal intensity of 1/T2 was increased as particle concentration increased, and the transverse relaxivity (R2) was about 51.34 mM-1·s-1. Then we conducted MRI 24 h after injection of GO-IONP-PEG into 4T1 tumor-bearing mice under a 9.4T MR scanner. Fig. 5c shows accumulation of a large amount of GO-IONP-PEG in the host-tumor interface (arrow), where acute hemorrhage easily appeared. The results revealed the temperature changes of tumor microenvironment were GO-mediated, which plays a main role in inducing acute hemorrhage after laser irradiation.
Magnetic property of GO-IONP-PEG and in vivo biodistribution of particles. (a) Schematic illustration of the preparation of GO-IONP-PEG. (b) T2-weighted MR images and T2 transverse relaxivity (R2) of GO-IONP-PEG solutions at different iron concentrations. (c) T2-weighted MR images of 4T1 tumor-bearing mice before and 24 h after intravenous injection of GO-IONP-PEG. GO-IONP-PEG is abundant in the host-tumor interface (arrow).
2.6 Thermal effect on blood vessels
Thermal effect on blood vessels is assessed immediately after treatment, which is visualized with CE-MRI. We first explored whether acute changes to tumor vascular occurred after PTT in this study. Following treatment at 42 ºC, 48 ºC, 53 ºC and 58 ºC, a series of CE-MR images were immediately acquired after the administration of gadolinium. Fig. 6 a-b and Supplementary Fig. 3 show the strong signal enhancement at the region of untreated tumor due to the abundance of blood perfusion, while the signal intensity in the irradiated tumor was obviously lower than the untreated tumor, especially at 48 ºC, 53 ºC and 58 ºC.
Changes of blood flow and vessels in tumors without and with 15 min PTT. (a) Representative CE-MRI maps of the blood flow changes in untreated and treated tumors, which were magnified from the whole tumor area images shown in Supplementary Fig. 3. The color scale represents the different enhancement effect of gadolinium in tumors. (Yellow represents highest and white represents lowest gadolinium enhancement effect.) (b) Quantification analysis of gadolinium signal intensity in tumor regions. High gadolinium enhanced signal intensity represents high tumor blood perfusion. (c) Immunohistochemical CD31 staining of tumor blood vessels before and after PTT at different temperatures. (d) Quantitative analysis of relative CD31-positive area for untreated and treated tumors. Data are presented as mean ± S.E.M. (n=3/group, **p < 0.01, ***p < 0.001vs. corresponding untreated tumor for that temperature).
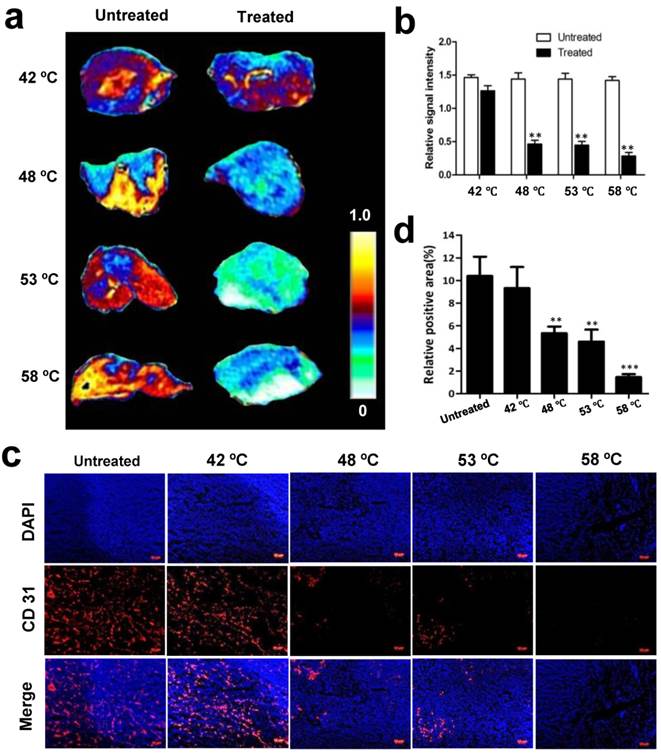
Based on the above results, we next investigated whether tumor blood vessels were destroyed after PTT. Tumors with and without treatment were isolated 30 min after irradiation at different temperatures and subsequently CD 31, a marker of tumor angiogenic blood vessels, was immunostained and observed. As demonstrated by immunofluorescence in frozen tissue slices, the untreated tumor exhibited significantly more blood vessels than the treated (Fig. 6c). Quantification analysis of CD 31-positive area fractions found that compared with 10.5 ± 3.5 % positive area of untreated tumor, the positive area of CD 31 was decreased to 9.4 ± 3.8 %, 5.3 ± 1.1 %, 4.6 ± 1.8 %, and 1.47 ± 0.5% at 42 ºC, 48 ºC, 53 ºC and 58 ºC, respectively (Fig. 6d). These results demonstrate that NP-mediated PTT causes acute damage of tumor angiogenic blood vessels and increases the damage in amplitude as the temperature increases.
2.7 Rapid noninvasive assessment of tumor response to PTT with different heating duration
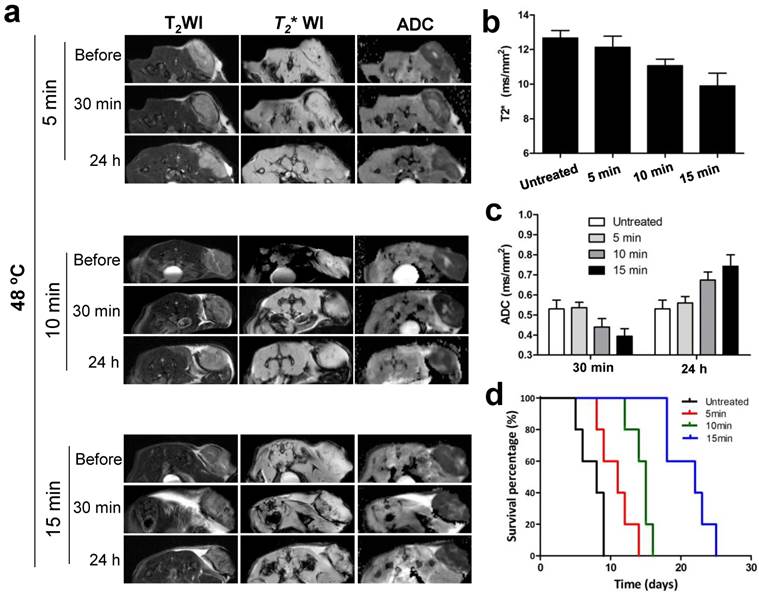
To confirm whether the signal changes of MRI in tumor were corresponding to treatment outcomes of NP-mediated PTT, we further evaluated therapeutic response to different heating duration with noninvasive MRI treatment. Different PTT were introduced by adjusting irradiation duration at 48 ºC including 5 min, 10 min and 15 min. As shown in Fig. 7a-c, T2* and ADC values in tumor were decreased 30 min after treatment compared to before, and the reduced values in amplitude was amplified as duration time increases. On the contrary, at 24 h post-treatment, ADC values were elevated in a heating time dependent manner. According to these results, we hypothesized the extent of the changes on MRI signal determined the mice survival. The survival rate of mice was subsequently evaluated, and as expected, showed that the survival curve was highly correlated with the reduced values in amplitude of MRI signal (Fig. 7d).
In vivo MRI prediction and assessment of tumor therapeutic response to different PTT at 48 ºC. (a) Exemplary T2, T2* and ADC images of mice before and after three different PTT treatment durations of 5, 10, and 15 min, respectively. Quantification analysis of T2* values and ADC values from (a) were shown in (b) and (c), respectively. (d) Kaplan-Meier survival curves of untreated and treated mice with different PTT treatment durations (n=5/group).
3. Discussion
Focal hyperthermia has shown to be effective for cancer treatment. It is a well-known fact that focal hyperthermia effects depend on tissue temperatures attained. Classical hyperthermia depends on a temperature of 40°C to 44°C to cause irreversible cellular damage.The effects of hyperthermia tumors have been extensively presented in previous reports[25, 26]. Focal hyperthermia injury includes direct thermal injury and indirect thermal injury. The mechanisms of direct thermal injury involve complex interactions within tumor tissue at cellular and subcellular levels. Indirect thermal injury is progressive an injury which may involve microvascular damage, apoptosis, ischemia-reperfusion injury, alterations in the immune response and altered cytokine expression, usually with minimal injury to normal tissues[27-31]. In our study, the treatment at 42 ºC did not significantly inhibit tumor growth and therefore did not prolong survival of mice (Fig. 3). It is possible that surface temperature measurement we used did not reflect the temperature of tumor core. Furthermore, hyperthermia in clinical trials tends to be applied as an adjunctive with various established cancer treatment modalities such as radiotherapy and chemotherapy due to its limited therapeutic outcomes in mild heat treatment[32], especially for rapid growth of malignant tumor used in this study. As nanotechnology develops, treatment with higher temperatures (even more than 60 ºC), named “superthermia” here, is beginning to become a popular strategy for addressing this issue by combining physiochemical properties and tumor targeting of nanoparticles. Our results support that higher temperatures such as 58 ºC effectively erase tumor and avoid tumor recurrence. In addition, prolonged irradiation treatment time at 48 ºC significantly improved the treatment response (Fig. 7). The results suggest that thermal temperature and irradiation duration play important role in determining therapeutic outcomes of NP-mediated PTT. It also implies that establishing individual approaches is necessary for effective tumor treatment in PTT, thereby non-invasive in vivo monitoring of early treatment response, can potentially be used to guide personalized therapy.
In this study, for the first time, we demonstrated that MP-MRI provides a direct, non-invasive method for in vivo monitoring of the kinetics of early treatment response to NP-mediated PTT. CE-MR images showed a perfused tumor 0.5 h after PTT, which demonstrates the vascular occlusion, an indirect indicator of tissue necrosis. At 0.5 h to 12 h, the ADC value within tumor was lower, on average, than that of the pre-treatment tumor, as a result of restricted waterflow due to ischemia and cellular disruption which may involve protein denaturation[13]. This outcome is consistent with previous studies which have been verified with pathologic examination[5, 13]. At the later time points, the average ADC value was increased within the ablated tumor, which presumably reflected that the barriers to restricted diffusion of water are removed by cell membrane breakdown and result in a corresponding increase in the ADC. In our study, at one to three days, the mean ADC value of the tumor reaching the peak (>1×10⁻³ mm2/s) when heating levels is 58ºC in our MRI set condition, and then the tumor is completely cured. As shown in this study, tumor recurrence was observed at 42-53 ºC when the average ADC value of the tumor was lower than 1×10⁻³ mm2/s at 24 h and returned to baseline level later. The exact mechanism for the change of the ADC in tissue treated with NP-mediated PTT is unknown at present, but this change undoubtedly provides a technique parameter to noninvasively evaluate treatment response.
Many factors in tumor microenvironment have big influence on direct thermal injury. Among them, tumor blood flow is a major determinant of direct thermal injury[31, 33]. Usually in focal hyperthermia, heat is absorbed by hemoglobin and transferred away from the region of focal hyperthermia. Thus, due to the heat dissipating, a lower thermal injury should exist in the host-tumor interface where blood vessels are abundant [31, 34, 35]. However, in NP-mediated PTT, the phenomenon is quite different. In our case, the acute hemorrhage were found in the host-tumor interface (Fig. 4) at 30 min after treatment. According to our findings, we suggest that this phenomenon may be relative to the distribution of the NPs, since most non-targeting nanoparticles penetrate into the tumor tissue based on enhanced permeability and retention (EPR) effect. Prior to tumor injury, more particles induce higher temperature which may lead to endothelial cell damage, increase of vessel wall adhesiveness and vascular leakage. These changes rapidly result in the decrease of MRI signal intensity in T2*WI and variation of ADC values. Additionally, hemorrhage causes a dark signal in T2*WI by hemosiderin deposition due to a significant shorten in T2* relaxation time. After initial NP-mediated PTT induced vascular damage, there was a progressive tissue necrosis which cause ADC values increase over the course of 24 to 48 h. It seems that these processes are closely related to post-treatment time points, and thus their kinetics contribute to the overall changes in T2* and ADC values.
There were some limitations in our results. First, we measured tumor temperatures by using infrared thermo detector, which might not reflect the real temperature of core tumor. Second, MR imaging was performed with a 9.4T MR scanner, which may contribute to different cutting-off ADC value when MRI set condition is changed. Lastly, distribution of NPs in tumor plays important in temperature elevation under laser, so whether the distribution is particle-dependent needs to be further explored.
4. Conclusion
NP-mediated photothermal injury is pronounced due to the heat trapping which may be relative to the distribution of the NPs. Intratumor microenvironment was rapidly altered upon nanoparticle-mediated PTT, and the dynamic variation in amplitude was corresponding to heating levels and heating duration. We found these changes were noninvasively well-tracked and evaluated by synergistic multi-parameters MRI as below: After treatment, CE-MRI can assess occlusion of blood vessels, an important event for tumor regression; T2*WI is highly sensitive to acute hemorrhage induced by tissue injury; DW-MRI accompanying with ADC maps may provide a quantitative parameter for evaluation of the extent of treatment response. Our results can also be expanded for the prediction of other nanoparticle-mediated photothermal therapeutic responses, the guidance to design powerful NPs with photothermal property and the selection of personalized therapeutic strategies.
5. Experimental Section
5.1 Preparation of GO-PEG, GO-PEG-Cy5.5 and GO-IONP-PEG
The GO, PEGylated GO and GO-IONP-PEG were prepared by following the previous reported methods[17, 18, 20]. An aqueous suspension (5 mL) of graphene oxide (GO) prepared by the modified Hammer's method at a concentration of ~3 mg/mL was sonicated for about 30 min, then NaOH (0.12 g/mL) was added to the GO suspension and bath sonicated for about 3 h. The resulting solution was neutralized and purified by repeated rinsing and centrifugation. A solution of 6-arm-polyethyleneglycol-amine (Sunbio Inc.) (3 mg/mL) was added to the GO solution(0.5 mg/mL), and the mixture was sonicated for 5 min. N-(3-dimethylaminopropyl-N-ethylcarbodiimide) hydrochloride (EDC, from Fluka Inc.) was then added to the mixture in two equal portions to give a final concentration of 1 mg/mL totally. The reaction was allowed overnight to yield a GO-PEG solution.
For the labeling of GO-PEG with Cy5.5, the Cy5.5-NHS ester was incubated with the resulting covalent GO-PEG in phosphate buffer (pH 7.8) for 4 h. Free Cy5.5 was then removed by dialyzing the resulting Cy5.5 conjugated GO-PEG in ultrapure water.
IONP deposited GO were synthesized by following a previously reported method [22, 36]. Then 25 mg of C18PMH-PEG poly (maleicanhydride-alt-1-octadecene) was added into in a solution of GO-IONP (1 mg/mL, 5mL) to improve the biocompatibility and aqueous solubility and the solution was ultrasonicated for 5 min at room temperature. Next, 5 mg EDC was added to the mixture and the solution was magnetically stirred overnight. The final product (GO-PEG or GO-IONP-PEG) was purified by a Millpore ultrafiltration tube for 10 min and washed 5 times with deionized water.
5.2 Biodistribution
Animal experiments were conducted under protocols approved by the Animal Care and Use Committee (ACUCC) of Xiamen University in China. Female BALB/C mice (5-6 weeks) were implanted subcutaneously with a suspension of 1×10⁶ 4T1 breast cancer cells in PBS (100 μl). 200 μl of GO-PEG-Cy 5.5 (2 mg/ml) was injected via tail vein when tumors were up to a volume of 80-100 mm3. The fluorescence signal was observed using Carestream FX Pro at the indicated time points. At 2 h and 24 h p.i., tumors and organs including heart, liver, spleen, lung, kidney, intestine and tumor from 4T1 tumor-bearing nude mice were collected and visualized with Carestream FX Pro, respectively. For the biodistribution of GO-IONP-PEG, 4T1 tumor-bearing BALB/C mice were intravenously injected with GO-IONP-PEG (200 µl of 2 mg/ml). MR imaging was subsequently conducted on a 9.4T MRI scanner.
5.3 In vivo treatment
4T1-tumor bearing mice were randomly divided into different groups (n=5 per group). For tumor response using different temperatures (42, 48, 53, and 58 °C), 4T1 breast cancer cells were inoculated into both sides of mouse hip. When the tumor volume reached 80-100 mm3, 200 μl of GO-PEG (2 mg/ml) were injected intravenously. The tumor on each mouse was exposed to an 808nm laser by adjusting laser power (1.5-3 W/cm2) until temperatures reaching wanted temperature in about 1.5 min and keeping this temperature for 15 min. Thermal images of different groups were obtained real-time by FLIR Ax5 camera. Mapping and quantifying the increase in tumor temperatures was monitored by real-time thermal imaging.
For tumor response using ~48 °C with different heating duration (5, 10 and 15 min), tumor cells were inoculated into one side of hip. After 24 h injection of 200 μl of GO-PEG (2 mg/ml) intravenously, the mice were irradiated to 5 min, 10 min and 15 min, respectively.
For all PTT treatment groups, tumor responses were monitored before and after PTT by T2-weighted MRI, T2*-weighted MRI, and DWI and CE-MRI at the indicated time points. The end time point of survival was determined when tumor volume reached a specific volume (600 mm3).
5.4 MRI experiments
Magnetic resonance images were acquired using a 9.4T small animal MRI scanner (Bruker, Germany). All the mice were anesthetized with 1.5% isoflurane/air mixture via a nose cone and were placed a respiratory sensor in a stretched prone position. To ensure the imaging position of the implanted tumor, axial and coronal two-dimensional (2D) fast spin-echo sequence images were first acquired. The images were acquired using the following parameters: (1) T2-weighted MRI: TR/TE = 2500/33 ms, field of view (FOV) = 4×4 cm matrix = 256 ×256, FA =180°, slice thickness = 1.5 mm, 11 contiguous slices; (2) T2*-map: TR = 1500 ms, TE =10, 16, 22, 28, 34, 40, 46, 52, 58, 64 and 70 ms. FOV = 4×4 cm, matrix = 256× 256, FA =180°, slice thickness = 1.5mm, 11 contiguous slices, T2*-map was created by using built-in software (Paravision5.1, Bruker); (3) DWI: using spin echo sequence, TR/TE = 3000/27 ms, FOV= 4×4 cm, matrix = 128×128, FA =90°, slice thickness = 1.5mm, 11 contiguous slices, b values =0,1000s/mm2. Diffusion gradients were applied in three orthogonal directions. Trace images were obtained by using the same above mentioned software. ADC maps were created in all groups. (4) Contrast enhanced T1-weighted MRI: TR/TE: 960/10ms, FOV = 4×4 cm, matrix = 256×128, slice thickness = 1.5mm, FA =180°.
The tumor sizes were measured with a caliper tool to the nearest millimeter on axial T2-weighted images and the tumor volumes were computed using A×B2/2, where A is the largest and B is the smallest diameter of a tumor. T2* maps and ADC maps were calculated on a pixel-by-pixel basis using the built-in software.
For T2* value and ADC value measurement, the ROIs of tumor were drawn on the first echo of T2*-map and the image with no diffusion sensitizing gradient of DWI, which most clearly depicted tumor boundary, and subsequently copied to the parametric maps. T2* relaxation time and ADC values were obtained by averaging all voxels of all subjects within each ROI. ROIs were drawn throughout the whole tumor from each slice. To minimize a potential dependence of the results on the accuracy of ROIs definition, the ROI analyses were carried out by two independent readers and the results were determined by consensus.
5.5 Histological study
After 48 h treatment, one animal from each group was sacrificed for histological analysis. Each tumor was cut in half. Half of tumor was fixed in a 4% formaldehyde solution at room temperature for 48 h using haematoxylin and eosin (H&E) staining. The other half was collected in optimal-cutting-temperature (O.C.T.) compound, and was fixed with ice-cold acetone for 20 min before CD31 staining. For CD31 staining, after blocking with 1% BSA for 30 min, the sections were incubated with rabbit anti-mouse CD31 primary antibody diluent (1:50) for 1 h at room temperature. After rinsing with PBS (3 × 10 mines), a biotinylated anti-rat IgG secondary antibody solution (1:50) was applied and incubated for 30 min at room temperature. After washing with PBS, the whole slides were mounted with DAPI-containing mounting medium. Fluorescence images were obtained with a fluorescence microscope (Leica, Germany). Quantitative analysis of positive areas of CD31 blood vessels was performed by using ImageJ software.
5.6 Statistical analysis
The statistical analysis was determined by two-tailed student's t-test and one-way ANOVA followed by Bonferroni's post hoc test. P <0.05 indicates a significant difference.
Supplementary Material
Supplementary Fig. 1-3.
Acknowledgements
The authors thank Rebecca Zhang (Molecular and Cellular Biology at the Johns Hopkins University) for proof editing of this manuscript. This work was supported by the National Science Foundation of China (NSFC) (81201086, 81471655and 81301256), and the intramural research program, National Institute of Biomedical Imaging and Bioengineering, National Institutes of Health.
Competing Interests
The authors have declared that no competing interest exists.
References
1. Huang X, El-Sayed IH, Qian W, El-Sayed MA. Cancer cell imaging and photothermal therapy in the near-infrared region by using gold nanorods. J Am Chem Soc. 2006;128:2115-20
2. Peer D, Karp JM, Hong S, Farokhzad OC, Margalit R, Langer R. Nanocarriers as an emerging platform for cancer therapy. Nat Nanotechnol. 2007;2:751-60
3. He J, Huang X, Li YC, Liu Y, Babu T, Aronova MA. et al. Self-assembly of amphiphilic plasmonic micelle-like nanoparticles in selective solvents. J Am Chem Soc. 2013;135:7974-84
4. Burke A, Ding X, Singh R, Kraft RA, Levi-Polyachenko N, Rylander MN. et al. Long-term survival following a single treatment of kidney tumors with multiwalled carbon nanotubes and near-infrared radiation. Proc Natl Acad Sci U S A. 2009;106:12897-902
5. Chen J, Daniel BL, Diederich CJ, Bouley DM, van den Bosch MA, Kinsey AM. et al. Monitoring prostate thermal therapy with diffusion-weighted MRI. Magn Reson Med. 2008;59:1365-72
6. McDannold N, Hynynen K, Jolesz F. MRI monitoring of the thermal ablation of tissue: effects of long exposure times. J Magn Reson Imaging. 2001;13:421-7
7. Viswanath S, Toth R, Rusu M, Sperling D, Lepor H, Futterer J. et al. Quantitative Evaluation of Treatment Related Changes on Multi-Parametric MRI after Laser Interstitial Thermal Therapy of Prostate Cancer. Proc SPIE Int Soc Opt Eng. 2013;8671:86711F
8. Breen MS, Lazebnik RS, Fitzmaurice M, Nour SG, Lewin JS, Wilson DL. Radiofrequency thermal ablation: correlation of hyperacute MR lesion images with tissue response. J Magn Reson Imaging. 2004;20:475-86
9. O'Regan DP, Ahmed R, Karunanithy N, Neuwirth C, Tan Y, Durighel G. et al. Reperfusion hemorrhage following acute myocardial infarction: assessment with T2* mapping and effect on measuring the area at risk. Radiology. 2009;250:916-22
10. Koh DM, Collins DJ. Diffusion-weighted MRI in the body: applications and challenges in oncology. AJR Am J Roentgenol. 2007;188:1622-35
11. Mardor Y, Roth Y, Ochershvilli A, Spiegelmann R, Tichler T, Daniels D. et al. Pretreatment prediction of brain tumors' response to radiation therapy using high b-value diffusion-weighted MRI. Neoplasia. 2004;6:136-42
12. Monguzzi L, Ippolito D, Bernasconi DP, Trattenero C, Galimberti S, Sironi S. Locally advanced rectal cancer: value of ADC mapping in prediction of tumor response to radiochemotherapy. Eur J Radiol. 2013;82:234-40
13. Jacobs MA, Herskovits EH, Kim HS. Uterine fibroids: diffusion-weighted MR imaging for monitoring therapy with focused ultrasound surgery--preliminary study. Radiology. 2005;236:196-203
14. Robinson JT, Tabakman SM, Liang Y, Wang H, Casalongue HS, Vinh D. et al. Ultrasmall reduced graphene oxide with high near-infrared absorbance for photothermal therapy. J Am Chem Soc. 2011;133:6825-31
15. Lee JH, Sahu A, Jang C, Tae G. The effect of ligand density on in vivo tumor targeting of nanographene oxide. J Control Release. 2015;209:219-28
16. Yang K, Zhang S, Zhang G, Sun X, Lee ST, Liu Z. Graphene in mice: ultrahigh in vivo tumor uptake and efficient photothermal therapy. Nano Lett. 2010;10:3318-23
17. Liu Z, Robinson JT, Sun X, Dai H. PEGylated nanographene oxide for delivery of water-insoluble cancer drugs. J Am Chem Soc. 2008;130:10876-7
18. Yang K, Feng L, Hong H, Cai W, Liu Z. Preparation and functionalization of graphene nanocomposites for biomedical applications. Nat Protoc. 2013;8:2392-403
19. Hong H, Yang K, Zhang Y, Engle JW, Feng L, Yang Y. et al. In vivo targeting and imaging of tumor vasculature with radiolabeled, antibody-conjugated nanographene. ACS Nano. 2012;6:2361-70
20. Yang K, Hu L, Ma X, Ye S, Cheng L, Shi X. et al. Multimodal imaging guided photothermal therapy using functionalized graphene nanosheets anchored with magnetic nanoparticles. Adv Mater. 2012;24:1868-72
21. Hu SH, Chen YW, Hung WT, Chen IW, Chen SY. Quantum-dot-tagged reduced graphene oxide nanocomposites for bright fluorescence bioimaging and photothermal therapy monitored in situ. Adv Mater. 2012;24:1748-54
22. Yang K, Wan J, Zhang S, Zhang Y, Lee ST, Liu Z. In vivo pharmacokinetics, long-term biodistribution, and toxicology of PEGylated graphene in mice. ACS Nano. 2011;5:516-22
23. Braus DF, Brassen S. Functional magnetic resonance imaging and antipsychotics. Overview and own data. Radiologe. 2005;45:178-85
24. Xiao B, Zhang XM. Magnetic resonance imaging for acute pancreatitis. World J Radiol. 2010;2:298-308
25. Bicher HI, Hetzel FW, Sandhu TS, Frinak S, Vaupel P, O'Hara MD. et al. Effects of hyperthermia on normal and tumor microenvironment. Radiology. 1980;137:523-30
26. Song CW. Effect of local hyperthermia on blood flow and microenvironment: a review. Cancer Res. 1984;44:4721s-30s
27. Coakley WT. Hyperthermia effects on the cytoskeleton and on cell morphology. Symp Soc Exp Biol. 1987;41:187-211
28. Coss RA, Linnemans WA. The effects of hyperthermia on the cytoskeleton: a review. Int J Hyperthermia. 1996;12:173-96
29. Fajardo LF, Egbert B, Marmor J, Hahn GM. Effects of hyperthermia in a malignant tumor. Cancer. 1980;45:613-23
30. Fujiwara K, Watanabe T. Effects of hyperthermia, radiotherapy and thermoradiotherapy on tumor microvascular permeability. Acta Pathol Jpn. 1990;40:79-84
31. Nikfarjam M, Muralidharan V, Christophi C. Mechanisms of focal heat destruction of liver tumors. J Surg Res. 2005;127:208-23
32. Rao W, Deng ZS, Liu J. A review of hyperthermia combined with radiotherapy/chemotherapy on malignant tumors. Crit Rev Biomed Eng. 2010;38:101-16
33. Skinner MG, Iizuka MN, Kolios MC, Sherar MD. A theoretical comparison of energy sources--microwave, ultrasound and laser--for interstitial thermal therapy. Phys Med Biol. 1998;43:3535-47
34. Muralidharan V, Malcontenti-Wilson C, Christophi C. Effect of blood flow occlusion on laser hyperthermia for liver metastases. J Surg Res. 2002;103:165-74
35. Svaasand LO, Boerslid T, Oeveraasen M. Thermal and optical properties of living tissue: application to laser-induced hyperthermia. Lasers Surg Med. 1985;5:589-602
36. Sun H, Cao L, Lu L. Magnetite/reduced graphene oxide nanocomposites: one step solvothermal synthesis and use as a novel platform for removal of dye pollutants. Nano Research. 2011;4:550-62
Author contact
![]() Corresponding authors: F. Z. (sailfmricom ); X. H. (xhuang33edu); Xiaoyuan Chen (shawn. chengov)
Corresponding authors: F. Z. (sailfmricom ); X. H. (xhuang33edu); Xiaoyuan Chen (shawn. chengov)