Impact Factor
- Issue 14; 2026
- Issue 13; 2026
- Issue 12; 2026
- Issue 11; 2026
- Issue 10; 2026
- Volume 16; 2026
- Advance Articles
- Past Issues
- Cover Images
- Cover Suggestion
- Index & Coverage
- Special Issues
Introduction
Related Work
Segmentation Operations
Segmentation Visualization
Performance Measurements
Discussion
Abbreviations
Acknowledgements
References
International Journal of Biological Sciences
International Journal of Medical Sciences
 Global reach, higher impact

Theranostics 2016; 6(3):328-341. doi:10.7150/thno.13624 This issue Cite
Research Paper
Imalytics Preclinical: Interactive Analysis of Biomedical Volume Data
Felix Gremse1, Marius Stärk1, Josef Ehling1, Jan Robert Menzel2, Twan Lammers1, Fabian Kiessling1 ![]()
1. Experimental Molecular Imaging, University Clinic and Helmholtz Institute for Biomedical Engineering, RWTH Aachen University, Aachen, Germany
2. Computer Graphics and Multimedia, RWTH Aachen University, Aachen, Germany
Received 2015-8-21; Accepted 2015-9-25; Published 2016-1-1
Abstract

A software tool is presented for interactive segmentation of volumetric medical data sets. To allow interactive processing of large data sets, segmentation operations, and rendering are GPU-accelerated. Special adjustments are provided to overcome GPU-imposed constraints such as limited memory and host-device bandwidth. A general and efficient undo/redo mechanism is implemented using GPU-accelerated compression of the multiclass segmentation state. A broadly applicable set of interactive segmentation operations is provided which can be combined to solve the quantification task of many types of imaging studies. A fully GPU-accelerated ray casting method for multiclass segmentation rendering is implemented which is well-balanced with respect to delay, frame rate, worst-case memory consumption, scalability, and image quality. Performance of segmentation operations and rendering are measured using high-resolution example data sets showing that GPU-acceleration greatly improves the performance. Compared to a reference marching cubes implementation, the rendering was found to be superior with respect to rendering delay and worst-case memory consumption while providing sufficiently high frame rates for interactive visualization and comparable image quality. The fast interactive segmentation operations and the accurate rendering make our tool particularly suitable for efficient analysis of multimodal image data sets which arise in large amounts in preclinical imaging studies.
Keywords: Interactive Segmentation, Medical Image Analysis, Multimodal Imaging, GPU Processing, Segmentation Rendering, Undo/Redo
Introduction
Modern preclinical and clinical imaging devices generate three-dimensional data sets at high resolutions, whose large data amounts pose a challenge for visualization and analysis. For scientific purposes, but also increasingly for diagnosis and treatment planning in clinical applications, extraction of quantitative measurements is needed. To derive such quantitative measurements, segmentation is a commonly required intermediate step. A segmentation is usually defined as a subset of voxels, i.e., represented by a binary mask or label mask in case of multiple regions [1]. This voxel-wise representation is suitable for many operations such as thresholding, region growing, and morphological operations [2]. Segmented regions can be used to measure volumes and other properties of organs or lesions and are useful to analyze multimodal data sets [3].
Automated or semi-automated methods for image segmentation have been proposed for special applications such as liver segmentation [4], segmentation of multiple sclerosis lesions [5] or mouse organ segmentation [6]. Automated segmentation methods are usually favored over a manual segmentation workflow because of their reduced workload for the user and the improved user-independence. However, for many applications an automated algorithm is simply not available and the development of an automated method for a single experiment is often not worth the effort. Furthermore, automated methods rarely work in all cases robustly and the remaining cases need to be corrected manually. Therefore, a software tool for efficient interactive segmentation is required for many applications.
For large data sets, the processing time can quickly become a bottle neck, both for segmentation and rendering. Fortunately, modern graphics processing units (GPUs) provide massive processing power. These powerful devices come with several limitations though. To fully load these GPUs thousands of threads need to be kept busy which requires a fine grained level of parallelism. The GPU memory is fast, but limited in size. Furthermore, the transfer between host and GPU memory can easily become a bottleneck. While GPUs are becoming easier to program, simple code that minimizes diverging thread paths and scattered memory accesses is still the recipe to achieve the highest performance [7].
We present a newly developed GPU-accelerated tool for interactive segmentation with several essential and novel contributions. For reliable operation, we used a segmentation rendering with bounded worst case memory requirements. This is important to avoid sudden breakdown in special situations, e.g., when thresholding a noisy data set. Furthermore, all segmented regions, which we call 'classes', are rendered together and the memory consumption is independent on the segmentation state and the number of segmented regions. Moreover, the preprocessing of the segmentation rendering, including computation of a space-leaping data structure required for efficient ray casting, is GPU-accelerated to minimize the delay between a segmentation operation and visualization of the result. A fast filter is proposed to reduce staircase artifacts, which result from the discrete nature of the segmentation maps, while maintaining visibility of small structures. After the preprocessing, views can be rendered at high frame rates from any viewing position to allow interactive inspection of the segmentation state by rotation, panning, and zooming. The segmentation rendering can be combined with other isosurfaces and transparent overlays, i.e., volume rendering, in a way that it generates geometrically correct images suitable for stereo vision.
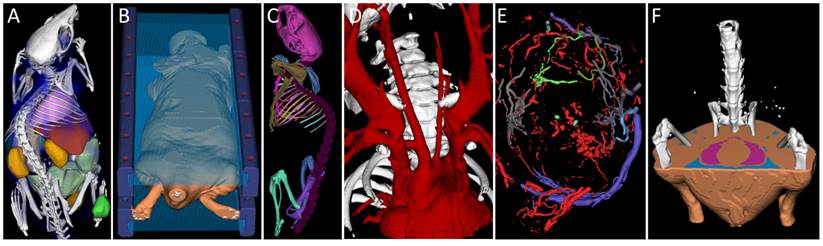
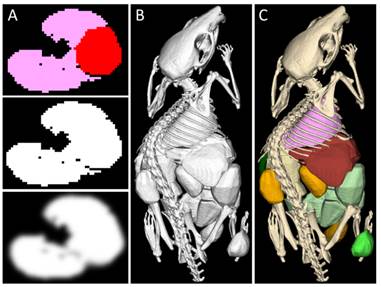
The bottleneck incurred by limited GPU memory and transfer bandwidth is compensated by compressing and decompressing the segmentation maps on the GPU, enabling a general and efficient undo/redo mechanism. A set of fast segmentation operations is implemented which can be used to handle many types of applications (Figure 1).
Interactive segmentation applications. A) Organ segmentation for biodistribution determination. B) Marker segmentation for multimodal image fusion. C) Bone segmentation and labeling. D) Segmented blood vessels of a mouse with a stenosed carotid artery. E) Segmented tumor blood vessels. F) Fat segmentation (visceral and sub cutaneous fat of a mouse). Data sets were acquired using µCT (micro Computed Tomography).
To assess the speed-up realized by GPU-processing, we carried out performance measurements for several operations. We compared our approach for segmentation rendering with a reference implementation of marching cubes to show that it is faster under many relevant conditions while maintaining favorable worst-case memory requirements.
While other systems for interactive medical image inspection and analysis were proposed earlier [8-11], we believe that our system bears novel contributions due to its broad applicability, robustness achieved through bounded worst case memory consumption, its efficient undo/redo implementation, and the fast visual response after changing the segmentation state. While many of the segmentation operations may be supported by other tools in a general purpose setting, our tool is particularly suitable for efficient interactive analysis of multimodal image data sets which arise in large amounts in preclinical imaging studies.
The software, named Imalytics Preclinical, has been used for analysis of passive drug delivery systems [12], active targeting [13], biodistribution analysis [14], probe development [15], cell labeling [16], ballistic soap experiments [17], blood perfusion [18], dental implants [19], functional ultrasound [20], atherosclerotic inflammation [21], atherosclerotic calcifications [22], carotid artery stenoses [23], tissue-engineering [24], and quantification of body fat [25]. Information about the availability of the software can be found on our institutional website (http://exmi.rwth-aachen.de/).
Related Work
Parallel processing, using the shared memory paradigm, is particularly helpful to reduce the delay after each segmentation step. Simple operations, such as thresholding are straightforward to parallelize. Others, such as region growing, are more difficult [26]. Morphologic operations, e.g., dilation, erosion, opening, and closing, can be efficiently implemented using the Euclidian distance transform. This operation receives a binary 3D mask as input and the output is defined as a 3D image where the voxel values contain the distances to the closest true voxel. Dilation and erosion are implemented by applying a threshold on the output of the distance transform. The construction time is linear in the number of voxels and independent of the state of the binary mask [27]. Recently, the accurate Euclidian distance transform has been implemented for GPUs [28]. The implementation requires multiple buffers however, which may conflict with the limited memory situation for GPUs.
For undo/redo, the usual implementation is to provide a reverse operation or to store the previous state. This is problematic because reverse operations are not available for many operations, e.g., morphologic operations [2] and storage of multiple segmentation states would require excessive amounts of memory.
3D rendering of volume data can be classified into direct and indirect methods [29]. For the special purpose of segmentation rendering, both types of methods can be applied. Indirect rendering methods and particularly the marching cubes algorithm [30,31] are traditionally used [32]. The marching cubes algorithm extracts triangles from the volume data to approximate an isosurface. These triangles can be rendered at high speed for any viewing position by a GPU. The triangle extraction can be costly, however, even with GPU-accelerated methods [33]. Furthermore, the worst case memory consumption can be excessive, because up to 5 triangles can be generated per voxel [33].
Direct rendering methods, also called ray casting or volume rendering, compute the image by traversing the volume along individual rays for each camera pixel. The final color is accumulated as the ray is traced through the volume. Ray casting benefits from early termination, i.e., the tracing can be stopped when an opaque state is reached. Furthermore, empty space regions can be skipped (“space-leaping”) using special data structures [34]. Ray casting has been used to visualize segmentations before. In [35], a modified z-buffer was used to select the visible voxels for a subsequent ray tracing step. Hadwiger et al. combined the segmentation rendering with transparent volume rendering [36]. Sherbondy et al. applied a general volume rendering for a GPU-accelerated region growing method [37].
To implement efficient space-leaping, tree-based structures such as k-dimensional trees or octrees are most commonly used [38]. GPU implementations for tree structures have been proposed, but adjustments were necessary, particularly due to limited memory and registers per GPU thread or to avoid recursive or excessively diverging code paths [39]. When using tree structures for ray casting, much time is spent during traversal of the tree [40]. Flat grid-based optimization structures are an alternative to tree structures [41]. They provide the distance to the closest opaque voxel and indicate a safe jumping distance [42,43]. When using a distance map, this is called sphere casting [44]. Ray casting code is much simpler for flat grid-based structures, bearing advantages for GPU processing. Furthermore, grid-based structures are more predictable with respect to memory requirements and computation cost [38], which is essential for a robust segmentation tool.
For marching cubes, the frame rendering time is proportional to the number of triangles, which, although depending on the image structure, is proportional to the number of voxels, i.e., cubic in the volume diameter. Ray casting on the other hand is more affected by the target resolution of the 2D image because the cost for each ray is linear in the volume diameter. For these theoretical reasons, ray casting should outperform marching cubes for large data sets, but the question is, whether the turning point is reached with practically relevant data sets and when generating images of high resolution.
Segmentation Operations
In this section, a set of interactive segmentation operations is described, which is sufficient for many problems. A segmentation defines a partition of the voxels into a set of user-defined classes, such as "liver", "tumor", or, "bone". Some operations require one or more seed points or an input and output class to specify or restrict the operation. These can be provided by clicking into slice views or into the rendered 3D image. In the latter case, the depth map resulting from the last rendering is used to find the corresponding point in 3D [35].
Segmentation Representation
Segmentation maps are represented as 3D data sets with one byte per voxel which stores the class index associated to the voxel. The value 0 is reserved for unclassified while the value 255 is reserved to be used as hidden temporary class. Therefore, 254 different non-overlapping classes can be represented. The user can add, remove, or rename classes and change their colors.
Compression of Segmentation Maps
To reduce memory consumption and mitigate the limited transfer bandwidth between host and GPU memory, a GPU-based compression and decompression method for segmentation maps is implemented. The segmentation maps are highly compressible by simple run length encoding in many practical cases. To compress and decompress, each GPU thread operates on one row of the 3D data set in the Y direction, i.e., the second leading dimension. This is advantageous because the memory accesses of successive GPU threads are coalesced, i.e., parallel threads access adjacent memory addresses. Each run is encoded using two bytes (1 byte for the class, 1 byte for the run length) and the compressed data of all rows is concatenated. In detail, the compression operates in three steps. In the first step only the number of runs per row is determined, indicating the amount of storage needed for this row. In the second step, a parallel prefix sum of these individual row sizes is computed using the thrust library, available with the CUDA toolkit [45]. The parallel prefix sum vector indicates the “row starts”, i.e., the destination locations for the compressed row data. In the third pass, the rows are compressed using the known storage location for each row. The decompression requires a single pass only, making use of the stored row starts. While the row starts can be recovered from the compressed data, we store them to achieve faster decompression on the expense of a suboptimal compression ratio.
General Undo/Redo Implementation
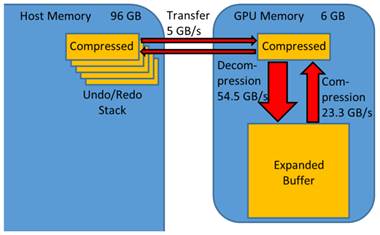
Undo and redo is enabled for all segmentation operations by providing a fast and general implementation. After each segmentation step, the segmentation map is compressed on the GPU. The compressed data is transferred to the host memory and maintained in a list, to enable iteration through the previous states (Figure 2). The maximum size of the undo/redo list is set to a default of 20 segmentation states which seem to be appropriate for many applications. To restore a state, the segmentation is transferred to the GPU and decompressed.
Undo/redo mechanism. GPU-accelerated compression enables a general and efficient undo/redo implementation. The strongly compressed segmentation map is transferred between host and GPU memory. It is expanded, processed and compressed on the GPU. The bandwidths were measured using a GeForce Titan GPU.
Euclidian Distance Transform
The Euclidian distance transform is useful for several segmentation operations such as dilation and erosion [27]. The distance map of a binary input mask has the same dimensions as the binary mask and the resulting intensities are the Euclidian distance to the nearest foreground voxel. For 3D masks, the computation can be separated into incremental passes along the scan lines along the X, Y, and Z dimension [27]. Since the processing cost is linear in the image dimensions, the total cost is linear with respect to the number of voxels.
In [28] a GPU-based implementation has been proposed using doubly linked lists embedded into a 2D texture which requires memory overhead proportional to the number of voxels. We implemented a GPU-based version with less memory overhead. The X, Y, and Z passes are computed sequentially as in [28] but for each pass (X, Y, and Z), each scan line is processed by a single GPU thread by directly applying the method developed by Maurer and colleagues [27]. The processing of each pass is performed using inline memory usage and much less overhead because each thread utilizes a temporary buffer of the same size as the scan line. Since the number of threads is on the order of several thousands, this requires much less memory overhead than another 3D buffer, at least for large data sets. Since the squared distances between voxels are integral, the computations are performed using integer operations. To reduce the memory overhead, the distance map can be computed and stored using unsigned 16 bit or 8 bit integers. In this case the resulting distances are clamped to maxima of 255 and 15, respectively, because the squared values are stored.
Basic Operations
A thresholding operation classifies voxels based on their intensities using an upper or lower threshold or both. In our tool, the input class is used to restrict the operation while the output class indicates the resulting class. Thresholding can be used as a starting point, e.g., to segment all bright regions. This often results in several disconnected regions that need to be isolated, which can be achieved by a region growing operation in combination with a seed point. The region growing can be further guided or constrained using a maximum distance from the seed point, a maximum volume or an end point. Using a maximum distance is useful to isolate ribs for example (Figure 1C) using a few tries to find the appropriate distance. While parallel GPU-based region growing methods have been proposed [26], our current implementation is running on the CPU, making use of a breadth first search. Therefore, the computational cost is determined by the volume of the filled region, which is often much smaller than the entire data set.
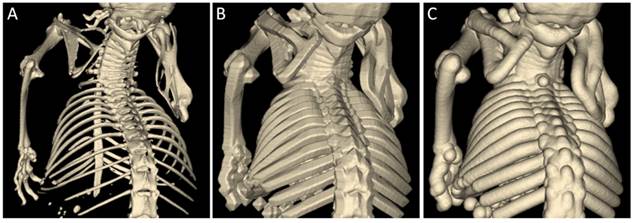
Morphologic operations, i.e., dilation, erosion, opening, and closing, are implemented using the distance transform [46]. To dilate a class by a distance d, the distance transform is computed for this class and then the voxels with distance below d are reassigned. Erosion is implemented similarly and opening and closing are successive calls to dilation and erosion. They are useful to remove small islets or fill holes, respectively. Since the computational cost of our GPU-based distance transform is linear with respect to the number of voxels, dilation, erosion, opening, and closing can be computed in linear complexity, independent on the parameters d. Usage of the Euclidian distance map is more natural than when using a rectangular kernel, which results in hard-edged segmentations (Figure 3).
Dilation using a spherical kernel. A) Bones of a mouse scanned with µCT were segmented by thresholding. B) The result after dilation with a box kernel appears hard-edged. C) The result after dilation with a spherical kernel appears more natural because no spatial directions are favored.
Several other segmentation operations were implemented. For instance, a class can be moved interactively by dragging the mouse. Classes can be deleted or assigned completely to another class. A class can be smoothed which is implemented by Gaussian filtering of the binary class mask and successive thresholding. Vessel diameters can be determined using the method described in [47]. All connected components below or above a user provided volume can be found. For a given segmentation, statistics can be computed such as volume, mean intensity, and standard deviation of the underlay or overlay.
Contour Delineation
While thresholding and region growing are usually preferred for their ease of use, their application is often difficult, e.g., in the absence of strong contrast as for soft tissue organs in CT images. Organs or lesions that have a relatively simple shape, such as the bladder, kidneys, or, in many cases, tumors, can be segmented by interactively delineating the region boundaries. The user can draw “scribbles” in 2D slices to specify the boundaries of objects. Based on these, a temporary 3D region is computed that approximates the convex hull of the scribbles. The user can incrementally provide more scribbles until the accuracy is found to be acceptable. These scribbles can be drawn in any slices of any orientation because they are drawn into a temporary 3D data set of the same size as the data set to be segmented. The computation of the region embraced by the scribbles approximates the convex hull defined by the scribbles in 3D. It is performed as follows: a subset, e.g., 100.000, of all possible pairs of scribble points, is randomly selected and these pairs are connected by plotting lines between them. The gaps between these lines are filled using a morphological closing operation using a distance proportional to the size of the region (10% of the bounding box of the scribbles). This approach is primarily meant for convex regions, however, non-convex regions, e.g., stomach and liver, can be segmented incrementally because of the fast implementation. Furthermore, the scribbles can be used to delete parts of a segmentation or to split a connected component, e.g., to separate two bones at a joint.
Segmentation Visualization
We provide a sphere casting and a marching cubes implementation for segmentation rendering. Both methods have a preprocessing phase, after which views from any viewing position can be rendered efficiently. The preprocessing starts from the compressed segmentation state, expands it into a temporary buffer and builds the data structures required for efficient frame rendering. When the user initiates a segmentation operation, all memory required for rendering is released, except the compressed buffer. This is done to provide as much as possible free GPU memory for the segmentation operation. After performing the segmentation operation, the new segmentation state is compressed and the preprocessing for rendering is performed again. In this way the conflicting memory requirements for rendering and segmentation are reduced. The preprocessing includes a staircase filter which is required to generate a smooth surface appearance. Both sphere casting and marching cubes are fully GPU-accelerated, including the preprocessing phases. They generate visually indistinguishable results and are therefore exchangeable from an application development point of view. They differ in terms of memory consumption and frame rate and are affected by the type of segmentation in different ways. Anti-aliasing is implemented by 2x2 super-sampling for sphere casting and by 4 times OpenGL multi-sampling for marching cubes.
Staircase Filter
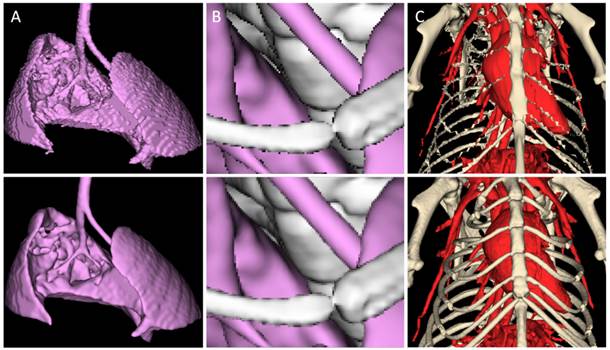
In contrast to a regular volumetric data set, e.g., a CT data set, the segmentation is represented by discrete indices. If this would be rendered directly, the image would show staircase artifacts (Figure 4) which can be very distracting due to the unnatural appearance. To define a smooth surface and achieve a more natural visualization, the binary opaqueness mask (values are 0 and 255) is smoothed using a nonlinear staircase filter. A linear Gaussian filter or box filter would smooth away thin regions, which is particularly problematic when rendering fine vessel structures. Our proposed staircase filter is an adjusted 3x3x3 box filter which operates on 8 bit data sets. Similar to a regular separable box filter the kernel [1/3 1/3 1/3] is applied in X, Y, and Z directions. To maintain the visibility state, i.e., to keep visible voxels above the visibility threshold β + τ (e.g., 128) and invisible voxels below the threshold, an additional constraint is applied after each pass. Voxel intensities above β + τ (τ is a margin, e.g., 5) stay above β + τ and intensities below β - τ stay below β - τ. This constraint is applied after each of the three passes of the separable box filter. Each thread processes one row of the data set which allows inline memory usage, i.e., another buffer is not required.
Quality aspects of segmentation rendering. A) The discrete nature of a segmentation results in staircase artifacts (top) if not compensated with surface smoothing (bottom). Shown is a mouse lung from a µCT scan. B) Aliasing artifacts (top) at edges, e.g., of ribs or bronchi, can be avoided by super-sampling (bottom). C) Rendering of a segmentation of the chest bones and blood vessels of the same mouse, using a coarse mesh approximation (top) and high quality rendering (bottom).
Sphere Casting
Our segmentation rendering method is essentially reduced to render an isosurface. An isosurface is defined as the set of points whose intensity is equal to a given threshold, the isovalue. When rendering an isosurface by ray casting, the first intersection between the ray and the isosurface is sought. Each pixel, i.e., ray, is computed by a single GPU thread.
The preprocessing required before rendering starts by decompressing the segmentation state into a 3D buffer (1 byte per voxel). Then this is converted with inline memory usage into a binary opaqueness mask (0 and 255). Subsequently the staircase filter is applied to the buffer (Figure 5). The smoothed data set is copied into a 3D texture (1 byte per voxel) to enable hardware-accelerated trilinear filtering during ray casting. To enable empty space leaping, i.e., sphere casting, a 3D distance map is computed [48], the voxel intensities of which provide the distance to the closest opaque voxel, a distance which can be safely skipped in any direction during ray casting [42]. The distance map is computed using the same algorithm as for the segmentation operations described above. To reduce the memory requirements the distance map is computed, stored, and used at a resolution reduced by a factor of two in each dimension. In detail, the opaqueness mask is down-sampled by factor two in each dimension using the maximum operator, to avoid that single voxels are missed. The distance map is computed in 16 bit mode using this down-sampled mask and the final distances are stored using 8 bits per voxel. Storage of this distance map therefore requires one byte per 2³ = 8 voxels. Finally, the buffer is filled with the segmentation map again using another decompression operation because this is required for the coloring step. The cost of all preprocessing steps is linear in the number of voxels, i.e., O(N³). Excluding the size of the compressed segmentation, which is often negligible, the occupied memory on the GPU amounts to 2.125 bytes per voxel, i.e., 1 byte for the segmentation, 1 byte for the smoothed opaqueness mask inside the texture, and 0.125 bytes for the down-sampled distance map.
Segmentation rendering. A) The segmentation (top, axial slice through lung and heart) is converted into an opaqueness mask (middle) and smoothed to avoid staircase artifacts (bottom). B) The isosurface of all opaque classes is rendered at once. C) As a final step, the rendered image is colored. Here, the skeleton and organs of a µCT scan of a mouse are shown.
The code for casting each ray is very straightforward: the ray advances iteratively along its direction until the image intensity is above the isovalue (Figure 6). The step size is determined by the corresponding intensity of the distance map, but if this value is below a safety margin, the step size is set to a fixed value, e.g., 0.3 times the voxel size. Once a position above the isovalue is found, a more accurate position is determined using a few iterations of bisection [36]. In the next step, the coloring is applied for each pixel (Figure 5) by searching for the nearest segmentation voxel in a 3x3x3 neighborhood. Therefore, all classes are rendered together in a single step. Finally, the color and brightness are computed assuming Lambertian reflection and a virtual light source. For sphere tracing, the maximal jumping distance is limited to 510 (corresponding to 255 in the down-sampled 8 bit distance map), which is not a problem because it enables sufficiently large jumps in practice.
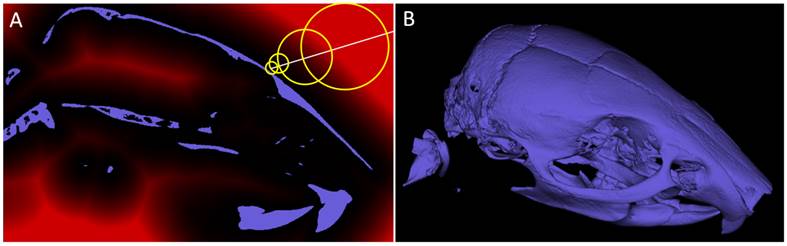
Sphere casting. A) Shown is a sagittal slice through a segmentation of a mouse skull (from a µCT scan). Sphere casting makes use of a distance map (red overlay) to leap through empty spaces. B) Rendered 3D image.
Marching Cubes
The marching cubes algorithm extracts triangles which approximate the isosurface [30,31]. The image intensities are considered to generate vertices with sub-voxel accuracy. For each voxel, up to five triangles, i.e., 15 vertices are computed which approximate the isosurface in the “cell” defined by the voxel and its seven neighbors with higher indices [32]. A cell only contributes to the isosurface if some of its eight corners are below and some are above the isovalue. Then the cell is called an active cell or active voxel. The Nvidia CUDA toolkit provides example code for an efficient GPU-based marching cubes algorithm which is optimized using pre-computed lookup tables [32]. Our marching cubes implementation is based on this code, however, extensions were necessary to enable image sizes that are not powers of two. Furthermore, for smooth shading of the triangles, we compute a normal vector for each vertex. Additionally, the memory consumption was optimized: for each vertex, 16 bytes are used, i.e., 12 bytes for the position (3 x float), 3 bytes for the normal (3 x char) and one byte for the color index. In the worst case, 240 bytes, corresponding to 5 triangles, are required per active voxel. During preprocessing, the active voxels are determined, i.e., those that contribute to the isosurface. The relative amount of these voxels, called occupancy, is often below 5%, but can be much higher under certain circumstances. By thresholding a noisy region, an occupancy of 50% can easily occur, resulting in problematic memory requirements. Such a situation is likely to occur in reality, e.g., when an isovalue is near the soft tissue brightness in a noisy CT data set [49]. Particularly when interactively changing the isovalue, this is almost guaranteed to happen at some point. In our implementation, the memory consumption per voxel amounts to 1 byte for the segmentation map and 1 byte for the smoothed segmentation mask, additional to the memory for the triangles, which can be 240 bytes per voxel in the worst case. The memory for the vertices could be further reduced by storing shared vertices in a vertex list, particularly because each vertex is used by at least three triangles in closed isosurfaces. This would still require memory for an additional index into the vertex list (e.g., 4 bytes), compared to 16 bytes for the entire vertex. It would also create a memory indirection during triangle rendering and cause scattered memory accesses to look up the vertices. Sorting and arranging the shared vertices is costly and would further delay the preprocessing stage. Furthermore, the memory consumption would still be prohibitively high in worst-case situations. The sparse indices of the active voxels are extracted using a parallel prefix sum and stored on the GPU [45]. The triangles are generated using CUDA and rendered using OpenGL. The entire preprocessing and rendering is performed on the GPU, i.e., no vertices are transferred between CPU and GPU memory.
To render segmentations using marching cubes, the same staircase filter as for ray casting is applied. Subsequently, the active voxel subset is determined as for isosurface rendering. The triangles are generated with colors corresponding to the associated class.
Underlay and Overlay Rendering
The segmentation rendering can be combined with an isosurface rendering of an underlay and a transparent overlay. The underlay rendering is commonly used to inspect the data set on which the segmentation is based. It is useful to visualize bone structures or the vasculature for CT data sets, for example. Our implementation is very similar to the segmentation rendering, except that the decompression, staircase filter and coloring steps are omitted. The transparent overlay rendering is useful to visualize and analyze multimodal data sets [3,12]. To combine rendering of underlay, segmentation and transparent overlay, a depth map is used and the underlay, segmentation and overlay are rendered sequentially [50]. For transparent overlay rendering, standard volume rendering with front-to-back alpha blending is used. No zero skipping optimization is implemented, because, usually the overlay data sets are of much lower resolution than the underlay and the segmentation. This approach results in geometrically correct renderings suitable for stereo vision.
Performance Measurements
Data Sets
For performance experiments, three high resolution CT data sets were selected which resemble typical imaging studies. The data sets were acquired using three differently scaled CT devices, for humans, mice, and smaller probes. The segmentations of these data sets are useful to illustrate the advantages and disadvantages of the two rendering methods. The properties of the data sets used in the experiments are listed in Table 1.
Properties of data sets.
| Data set | Dimensions | Voxel size [µm³] | Voxels [10^9] |
|---|---|---|---|
| Femur Head | 1183 x 1127 x 1496 | 35 x 35 x 35 | 1.99 |
| Human CT | 1022 x 1022 x 1742 | 166 x 166 x 200 | 1.82 |
| Mouse Kidney | 1000 x 1000 x 1247 | 6.9 x 6.9 x 6.9 | 1.25 |
First, an excised human femur head was scanned in a dual energy µCT for small animals (Tomoscope DUO; CT Imaging, Erlangen, Germany). Tubes were operated at 40 kV/1.0 mA and 65 kV/0.5 mA and 2880 projections were acquired over 6 minutes [47].
Second, a clinical CT angiography data set was used [47]. The scan was performed using a clinical dual energy CT (Somatom Definition, Siemens, Medical Solutions, Forchheim, Germany) with tube settings of 140 kV/55 mAs and 80 kV/230 mAs for the two tubes after bolus injection of 20 ml of iodine-containing contrast media (Ultravist 300, Bayer-Schering, Berlin, Germany). To generate a larger size for the performance experiments the volume size was doubled in each dimension using linear interpolation.
Third, an excised mouse kidney, prepared by vascular casting [51], was scanned using ex vivo µCT (SkyScan 1172, Bruker, Kontich, Belgium), acquiring 542 projections with 4000 x 2096 pixels. The reconstructed data set (4000 x 4000 x 4990) was too large (122 GB) for interactive processing with currently available GPUs and therefore down-sampled by 4x4x4 binning.
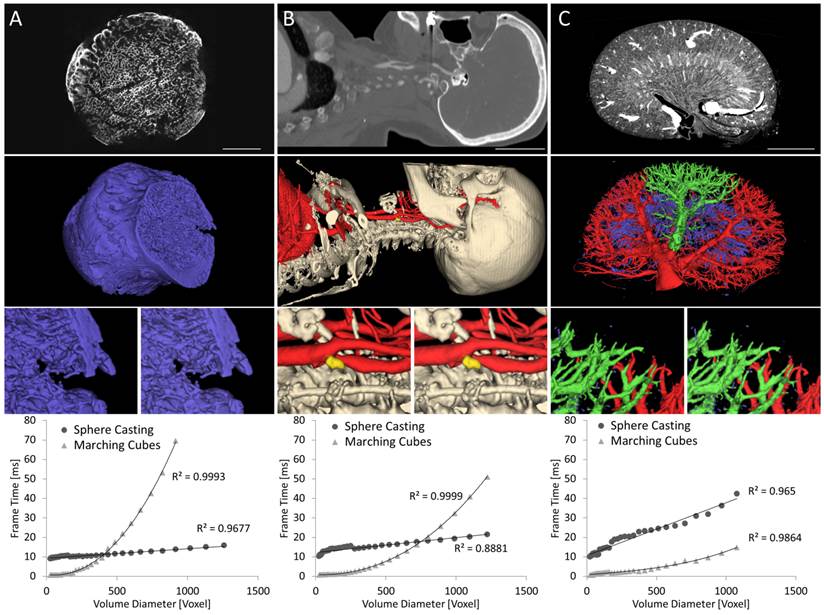
The three segmented data sets are shown in Figure 7, as seen from the camera position that was used for the experiments. To assess the dependency of the rendering time on the 3D size, the data sets were successively down-sampled, and the rendering and preprocessing time were measured. The down-sampling of the segmentation was performed by 2x2x2 binning using the maximum operator for factors of 2 and using nearest neighbor interpolation for the intermediate steps.
Frame time as function of volume size. The three exemplary data sets are increasingly difficult for ray casting and decreasingly difficult for marching cubes from left to right. A) Head of human femur scanned in small animal µCT. B) Human CT angiography with carotid artery stenosis and calcified plaque. C) Mouse kidney scanned ex-vivo using µCT. The top row shows slices through the CT data sets. Scale bars 10 mm (A), 50 mm (B), 2 mm (C). The middle row shows rendered segmentation images. Zoomed parts, rendered by ray casting (left) and marching cubes (right) show that both methods result in nearly identical images. The last row shows frame rendering times plotted over the volume diameter, i.e., the cube root of the number of voxels. Linear and cubic regression lines are shown for sphere casting and marching cubes, respectively. Sphere casting excels for data sets with large numbers of triangles (A,B) but is slowed down by complex vessel structures (C).
Devices and Software
For the performance measurements, a PC (Dell Precision Workstation T7500) equipped with two Intel Xeon X5677 (3.47 GHz) quad-core processors, 96 GB of DDR3 RAM (CAS latency 9, DRAM Frequency 665.1 MHz) and an Nvidia Geforce Titan (6 GB memory) was used. The operating system was Windows 7 (64-bit). The CUDA Toolkit 5.5 including the Thrust library was used to develop and compile the GPU code. The C++ code was compiled with Visual Studio 2012 Ultimate (Update 4).
Segmentation Operations
To measure the effect of the GPU acceleration, the time for compression, decompression, and distance map computation was measured using a parallel CPU-based implementation. The speed up factors between GPU and CPU implementations of compression, decompression, and distance map computation were 16.7, 28.4, and 13.0, respectively, showing that GPU-acceleration is highly beneficial for this interactive tool. It should be noted, that up to 3 times more powerful dual-socket CPUs are currently available, which would reduce the relative improvement of the GPU-acceleration.
GPU-based compression and decompression achieved bandwidths of 23.3 GB/s and 54.5 GB/s, respectively, which were measured for the clinical CT data set. The compression factors were 24.3, 52.9 and 62.9 for the three data sets of Table 1. The transfer speed between host memory and GPU memory was 5.2 GB/s using pinned memory [52].
Preprocessing for Rendering
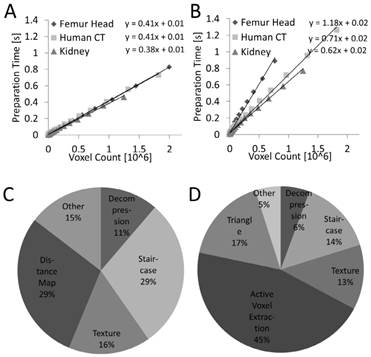
The preprocessing time is the time required to compute the data structures needed for frame rendering. For these measurements it was assumed that the segmentation is available in compressed form on the GPU, i.e., the decompression was included into the measurements. The preprocessing time depends linearly (R²=0.99, P<0.001) on the number of voxels for both sphere casting and marching cubes (Figure 8). For marching cubes it was more heterogeneous because it depends on the number of triangles to be generated. When splitting the preprocessing time into parts (Figure 8), it can be seen that the distance map and active voxel computation require the largest parts, without dominating the preprocessing, however.
Preprocessing time. The preprocessing time is proportional to the number of voxels for sphere casting (A) and marching cubes (B). The time is lower and more predictable for sphere casting. (C, D) Preprocessing time for ray casting and marching cubes split into categories, for the human CT data set.
Frame Rate over Volume Diameter
For this experiment, the frame rate was measured as a function of 3D volume diameter (Figure 7). We used a high 2D resolution to accommodate for modern high resolution displays. Images were rendered in full HD (1920x1080 pixels), i.e., including 2x2 super-sampling, around 8 million rays were cast for each frame. Compared to naive ray casting, sphere casting achieved a speed up of 15.0, 10.8, and 7.0 for the three data sets at the highest volume diameter, showing that a space leaping optimization is required to achieve interactive frame rates.
The theoretical frame rendering cost is linear in the image diameter for ray casting and cubic for marching cubes, with a much smaller constant factor for marching cubes [53]. This behavior was confirmed in the experiments; however, the performance of both methods strongly depends on the image structure. The three data sets are increasingly difficult for sphere casting, resulting in decreasing frame rates of 62.7 Hz, 46.4 Hz, and 23.6 Hz. Sphere casting is particularly affected by complex vessel structures which negatively affect early ray termination and space-leaping.
For marching cubes, the opposite behavior was observed, i.e., the three data sets were decreasingly difficult. In large data sets with high occupancy, such as the femur head with the complex trabecular bone structures, marching cubes cannot maintain interactive frame rates. Furthermore, marching cubes could not process the three largest data sets of the femur head pyramid because the buffer for the vertices was prohibitively large (Table 2). In cases of low occupancy, the marching cubes method excels on the other hand. For the kidney example, due to the relatively small number of vertices, marching cubes was faster than sphere casting for all volume diameters.
Marching cubes properties of data sets.
| Data set | Occupancy [%] | Triangles [10^6] | VBO Size [GB] | VBO Bytes per Voxel |
|---|---|---|---|---|
| Femur Head | 4.09 | 163.6 | 7.5 | 3.8 |
| Human CT | 1.43 | 52.2 | 2.3 | 1.3 |
| Mouse Kidney | 0.67 | 16.5 | 0.7 | 0.6 |
Frame Rate over 2D Resolution
The frame rendering time was also measured as a function of the 2D resolution (Figure 9), i.e., the number of pixels of the rendered image. For the femur head, a down-sampled data set was used (the fourth in the pyramid), because the larger data sets resulted in prohibitive memory consumption.
Frame time as a function of 2D image size. A) For sphere casting the frame time increases with the 2D size since the number of rays grows proportional with the number of pixels. The measured effect is supra-linear, presumably because of beneficial caching effects resulting from tightly packed rays. B) For marching cubes the rendering time per frame hardly depends on the 2D size, except for very low resolutions.
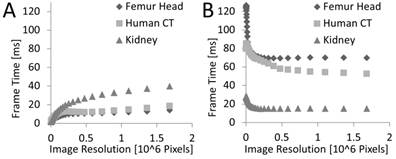
For sphere casting a supra-linear effect can be seen (Figure 9). Generally, the work-load should increase linearly with the number of pixels, i.e., rays. The supra-linear effect can be explained because the GPU traces the rays for small blocks of pixels in parallel utilizing a SIMD-like architecture, i.e., 32 adjacent rays are traced by a group of 32 threads, called a warp. This architecture benefits from cases where rays processed by the same warp traverse the volume at nearby positions; the higher the 2D resolution and/or the simpler the surface of the object inside of the 3D volume the higher this benefit gets. When the rays are coarse, i.e., for low resolutions, the computation is bandwidth bound. For dense rays the computation eventually becomes compute bound since many rays share the cached 3D data.
For marching cubes, the frame time appears to be almost constant over the rendering resolution, except for small resolutions which receive a penalty. The OpenGL rendering consists of two phases, vertex processing and fragment shading. The vertex processing costs are independent of the image resolution since it only depends on the given mesh which is constant in this experiment. Only the fragment shading is directly dependent on the image resolution, but this is not the bottleneck here as we only apply a simple lighting model, and, for our data sets, the resulting triangles cover only a small number of pixels (often only one) even at high resolution which result in a workload for the rasterizer that depends more on the number of triangles than the number of pixels. Small resolutions receive a penalty because the rendering hardware has to always shade groups of two by two fragments from the same triangle to be able to compute derivations (e.g., for texture mapping) independent of the number of pixels covered by a triangle. In case of one pixel sized triangles this results in only a 25% fragment shader efficiency explaining the observed penalty for low resolutions.
Discussion
We implemented and evaluated a GPU-accelerated system for interactive segmentation of volumetric data sets. A major challenge for an interactive segmentation tool is to implement both segmentation operations and rendering with low delay while retaining high frame rates and image quality. While GPUs may be the solution for this with their massive processing power, they require special attention with respect to code complexity, limited memory, limited host-device bandwidth, and fine grained parallelism [54,55]. Tolerable worst-case memory consumption is particularly relevant for a robustly applicable tool, because otherwise it could suddenly crash when reaching a segmentation state with prohibitive memory consumption.
We show that GPU-acceleration is useful for several segmentation operations, in particular morphological operations and a general undo/redo mechanism. The latter is implemented by GPU-based compression of the segmentation map in combination with transfer and storage of the compressed data into host memory. Compression and decompression operate at 23.3 GB/s and 54.5 GB/s, respectively, while compression factors above 20 are achieved for all three example data sets. In our opinion, this is the most reasonable way to implement undo/redo for our application, because multiple states cannot be stored on the GPU due to limited memory. Transfer of the uncompressed data would lead to an increased delay due to the transfer limitations and to excessive memory consumption on the host memory. Delayed transfer is not an option, because the GPU memory should be released as fast as possible to be available for GPU-based segmentation operations or rendering. The compression algorithm is a compromise between speed and compression ratio, and could be further optimized using Huffman encoding, probably without sacrificing much speed when using pre-computed lookup-tables.
The entire segmentation rendering, including preprocessing required after changing the segmentation state, is performed on the GPU. Most studies about ray casting have focused on achieving a high frame rate, while the preprocessing cost has not been considered. The preprocessing time of our method is scalable, i.e., linear with respect to the number of voxels and independent of the number of regions. Furthermore, memory requirements for rendering are constant (per voxel) for sphere casting which is relevant for a robustly applicable tool. To achieve interactive frame rates with ray casting, we found that a space-leaping optimization is required. Therefore, we chose a flat grid structure, a 3D distance map, which provides a safe jumping distance with a few simple operations, does not require recursion or tree traversal, and can be efficiently computed on the GPU.
A general comparison between direct and indirect volume rendering may not be appropriate. However, for our use case of segmentation rendering, the resulting images are visually indistinguishable and a comparison does make sense. We show that the preprocessing time is more predictable for sphere casting and faster than for marching cubes. More importantly, the GPU memory consumption is constant (2.125 bytes per voxel) for sphere casting, while for marching cubes, the memory requirements can become prohibitively large in cases of high noise or heterogeneous structures. Such a situation is not unlikely in practice, since it occurs when thresholding a noisy image, which could be created through a sharp CT reconstruction kernel. For cases with moderate amounts of triangles, marching cubes is preferable, resulting in less memory consumption and higher frame rates. Therefore, a beneficial combination would be to use marching cubes for low numbers of triangles and otherwise switch to sphere casting.
Limitations and Outlook
Currently, the GPU memory size limits the size of data sets that can be processed and visualized with our tool. GPUs with 12 GB memory are available and GPUs with 4 GB are available for less than $100. Commodity PCs are easily upgraded with power-saving single-slot GPUs. In our implementation only a compressed segmentation state is kept on the GPU memory, from which the data structures for rendering and segmentation operations are rebuilt on demand. Data sets larger than the GPU memory could be rendered using a compressed format [56]. A tree structure would actually solve this implicitly [57]. Rendering at lower resolutions could reduce the memory constraints and increase the frame rate, e.g., during interactive rendering. However, to fully support data sets larger than the GPU memory, all segmentation operations would have to be adjusted to operate on a compressed storage format. GPUs integrated into the CPU chip with direct access to the potentially larger CPU memory could also mediate the memory limitations. The speed of the preprocessing could be improved by using a faster approximate method instead of the accurate distance map [58] or using a distance map based on a different metric [59,60]. The staircase filter is essential to provide a smooth and natural visualization of the binary segmentation map. A possible alternative is to use the image intensities of the underlying image as proposed in [61], however, this does not work well for regions that are not aligned to intensity gradients. The ray casting could be optimized further by starting with coarse fat rays which are split into fine rays once a sufficient narrowness is reached, which can be determined from the distance map values. Another promising approach is to compact alive threads, corresponding to rays, to avoid idle GPU threads of terminated rays [62]. Transparent rendering of isosurfaces is currently not supported but could be implemented by casting rays through the objects using a bidirectional distance map [63] or by two-level volume rendering [64]. It would come at the expense of increased computational cost and the combination with a transparent overlay is not trivial [65]. Our current implementation supports up to 254 non-overlapping classes, which can be extended at the expense of memory consumption by using 16 bit, 32 bit, or 64 bit indices for the segmentation map. To support overlapping regions, only the last step in the segmentation rendering, i.e., the coloring, needs to be adjusted; however, the concept of non-overlapping regions, i.e., partitions, was found to be beneficial for many applications due to its simplicity [1]. A pragmatic compromise might be to use multiple segmentation maps and provide binary operations to combine these. Nevertheless, the implemented segmentation operations are sufficient to solve many tasks arising in daily medical image analysis and we plan to implement more operations during future projects.
Abbreviations
FMT: Fluorescence-mediated Tomography; µCT: Micro-Computed Tomography; rBV: relative Blood Volume; GPU: Graphics Processing Unit; CPU: Central Processing Unit; VBO: Vertex Buffer Object.
Acknowledgements
The authors gratefully acknowledge financial support by Philips Research, Aachen, Germany, the German Federal State of North Rhine Westphalia (EFRE/ForSaTum), the RWTH Aachen University (START-152/12), and the European Research Council (Starting Grant 309495 - NeoNaNo).
Competing Interests
Felix Gremse is founder and owner of Gremse-IT, a startup company that offers software and services for medical image analysis in cooperation with Philips and the Department for Experimental Molecular Imaging of the RWTH Aachen University.
References
1. Baatz M, Zimmermann J, Blackmore CG. Automated analysis and detailed quantification of biomedical images using Definiens Cognition Network Technology. Comb Chem High Throughput Screen. 2009;12(9):908-16
2. Gil JY, Kimmel R. Efficient dilation, erosion, opening, and closing algorithms. IEEE Trans Pattern Anal Mach Intell. 2002;24(12):1606-17
3. Kunjachan S, Gremse F, Theek B. et al. Noninvasive optical imaging of nanomedicine biodistribution. ACS Nano. 2013;7(1):252-62
4. Ruskó L, Bekes G, Fidrich M. Automatic segmentation of the liver from multi- and single-phase contrast-enhanced CT images. Med Image Anal. 2009;13(6):871-82
5. García-Lorenzo D, Francis S, Narayanan S. et al. Review of automatic segmentation methods of multiple sclerosis white matter lesions on conventional magnetic resonance imaging. Med Image Anal. 2013;17(1):1-18
6. Baiker M, Milles J, Dijkstra J. et al. Atlas-based whole-body segmentation of mice from low-contrast Micro-CT data. Med Image Anal. 2010;14(6):723-37
7. Shi L, Liu W, Zhang H. et al. A survey of GPU-based medical image computing techniques. Quant Imaging Med Surg. 2012;2(3):188-206
8. Hadwiger M, Laura F, Rezk-Salama C. et al. Interactive volume exploration for feature detection and quantification in industrial CT data. IEEE Trans Vis Comput Graph. 2008;14(6):1507-14
9. Diepenbrock S, Praßi J, Lindemann F. et al. Interactive Visualization Techniques for Neurosurgery Planning. Proc Eurographics. 2011
10. Oeltze S, Doleisch H, Hauser H. et al. Interactive visual analysis of perfusion data. IEEE Trans Vis Comput Graph. 2007;13(6):1392-9
11. Smelyanskiy M, Holmes D, Chhugani J. et al. Mapping high-fidelity volume rendering for medical imaging to CPU, GPU and many-core architectures. IEEE Trans Vis Comput Graph. 2009;15(6):1563-70
12. Gremse F, Theek B, Kunjachan S. et al. Absorption reconstruction improves biodistribution assessment of fluorescent nanoprobes using hybrid fluorescence-mediated tomography. Theranostics. 2014;4(10):960-71
13. Kunjachan S, Pola R, Gremse F. et al. Passive versus active tumor targeting using RGD- and NGR-modified polymeric nanomedicines. Nano Lett. 2014;14(2):972-81
14. Gremse F, Doleschel D, Zafarnia S. et al. Hybrid µCT-FMT imaging and image analysis. J Vis Exp. 2015 (100):e52770
15. Doleschel D, Rix A, Arns S. et al. Erythropoietin improves the accumulation and therapeutic effects of carboplatin by enhancing tumor vascularization and perfusion. Theranostics. 2015;5(8):905-18
16. Mertens ME, Frese J, Bölükbas DA. et al. FMN-coated fluorescent USPIO for cell labeling and non-invasive MR imaging in tissue engineering. Theranostics. 2014;4(10):1002-13
17. Gremse F, Krone O, Thamm M. et al. Performance of lead-free versus lead-based hunting ammunition in ballistic soap. PLoS ONE. 2014;9(7):e102015
18. Ehling J, Bartneck M, Wei X. et al. CCL2-dependent infiltrating macrophages promote angiogenesis in progressive liver fibrosis. Gut. 2014;63(12):1960-71
19. Duttenhoefer F, Mertens ME, Vizkelety J. et al. Magnetic resonance imaging in zirconia-based dental implantology. Clin Oral Implants Res. 2015;26(10):1195-202
20. Theek B, Gremse F, Kunjachan S. et al. Characterizing EPR-mediated passive drug targeting using contrast-enhanced functional ultrasound imaging. J Control Release. 2014;182:83-9
21. Schober A, Nazari-Jahantigh M, Wei Y. et al. MicroRNA-126-5p promotes endothelial proliferation and limits atherosclerosis by suppressing Dlk1. Nat Med. 2014;20(4):368-76
22. Assmann A, Zwirnmann K, Heidelberg F. et al. The degeneration of biological cardiovascular prostheses under pro-calcific metabolic conditions in a small animal model. Biomaterials. 2014;35(26):7416-28
23. Schürmann C, Rezende F, Kruse C. et al. The NADPH oxidase Nox4 has anti-atherosclerotic functions. European Heart Journal. 2015 ehv460
24. Mertens ME, Koch S, Schuster P. et al. USPIO-labeled textile materials for non-invasive MR imaging of tissue-engineered vascular grafts. Biomaterials. 2015;39:155-63
25. Li X, Zhu M, Penfold ME. et al. Activation of CXCR7 Limits Atherosclerosis and Improves Hyperlipidemia by Increasing Cholesterol Uptake in Adipose Tissue. Circulation. 2013;129:1244-53
26. Szenasi S, Vamossy Z, Kozlovszky M. GPGPU-based data parallel region growing algorithm for cell nuclei detection. Proc IEEE Computational Intelligence and Informatics (CINTI). 2011:493-9
27. Maurer CR, Qi R, Raghavan V. A Linear Time Algorithm for Computing Exact Euclidean Distance Transforms of Binary Images in Arbitrary Dimensions. IEEE Trans Pattern Anal Mach Intell. 2003;25(2):265-70
28. Cao T-T, Tang K, Mohamed A. et al. Parallel Banding Algorithm to compute exact distance transform with the GPU. Proc ACM SIGGRAPH symposium on Interactive 3D Graphics and Games. 2010:83-90
29. Preim B, Botha CP. Visual Computing for Medicine: Theory, Algorithms, and Applications. 2nd ed. San Francisco, CA, USA: Morgan Kaufmann Publishers Inc. 2013
30. Lorensen WE, Cline HE. Marching cubes: A high resolution 3D surface construction algorithm. Comput Graph (ACM). 1987;21(4):163-9
31. Wyvill G, McPheeters C, Wyvill B. Data structure for soft objects. Vis Comput. 1986;2(4):227-34
32. Newman TS, Yi H. A survey of the marching cubes algorithm. Comput Graph-UK. 2006;30(5):854-79
33. Martin S, Shen H-W, McCormick P. Load-balanced isosurfacing on multi-GPU clusters. Proc Eurographics Parallel Graphics and Visualization. 2010:91-100
34. Kruger J, Westermann R. Acceleration techniques for GPU-based volume rendering. Proc IEEE Visualization. 2003:287-92
35. Bullitt E, Aylward SR. Volume rendering of segmented image objects. IEEE Trans Med Imaging. 2002;21(8):998-1002
36. Hadwiger M, Sigg C, Scharsach H. et al. Real-Time Ray-Casting and Advanced Shading of Discrete Isosurfaces. Comput Graph Forum. 2005;24:303-12
37. Sherbondy A, Houston M, Napel S. Fast volume segmentation with simultaneous visualization using programmable graphics hardware. Proc IEEE Visualization. 2003:171-6
38. Havran V, Herzog R, Seidel H-P. On the Fast Construction of Spatial Hierarchies for Ray Tracing. Proc IEEE Symposium on Interactive Ray Tracing. 2006:71-80
39. Zhou K, Hou Q, Wang R. et al. Real-time KD-tree construction on graphics hardware. ACM Trans Graph. 2008;27(5):126
40. Foley T, Sugerman J. KD-tree acceleration structures for a GPU raytracer. Proc ACM SIGGRAPH/EUROGRAPHICS Conference on Graphics hardware. 2005:15-22
41. Cosenza B. A Survey on Exploiting Grids for Ray Tracing. Proc Eurographics Italian Chapter Conference. 2008:89-96
42. Zuiderveld KJ, Koning AHJ, Viergever MA. Acceleration of ray-casting using 3-D distance transforms. Proc SPIE 1808, Visualization in Biomedical Computing. 1992:324-35
43. Frey S, Ertl T. Accelerating Raycasting Utilizing Volume Segmentation of Industrial CT Data. Proc Theory and Practice of Computer Graphics. 2009:33-40
44. Hart JC. Sphere Tracing: A Geometric Method for the Antialiased Ray Tracing of Implicit Surfaces. Vis Comput. 1994;12:527-45
45. Bell N, Hoberock J. Thrust: Productivity-Oriented Library for CUDA. Astrophysics Source Code Library. 2012;1:12014
46. Jones MW, Bærentzen JA, Sramek M. 3D distance fields: A survey of techniques and applications. IEEE Trans Vis Comput Graph. 2006;12:581-99
47. Gremse F, Grouls C, Palmowski M. et al. Virtual elastic sphere processing enables reproducible quantification of vessel stenosis at CT and MR angiography. Radiology. 2011;260(3):709-17
48. Coeurjolly D, Vacavant A. Separable Distance Transformation and Its Applications. In: (ed.) Brimkov VE, Barneva RP. Digital Geometry Algorithms. Dordrecht, Netherlands: Springer. 2012:189-214
49. Dyken C, Ziegler G, Theobalt C. et al. High-speed Marching Cubes using HistoPyramids. Comput Graph Forum. 2008;27(8):2028-39
50. Tietjen C, Isenberg T, Preim B. Combining silhouettes, surface, and volume rendering for surgery education and planning. Proc EUROGRAPHICS/IEEE Symposium on Visualization. 2005:303-10
51. Ehling J, Bábíčková J, Gremse F. et al. Quantitative Micro-Computed Tomography Imaging of Vascular Dysfunction in Progressive Kidney Diseases. J Am Soc Nephrol. 2015 [Epub ahead of print]
52. NVIDIA Corporation. CUDA C Programming Guide. 2015.
53. Parker S, Shirley P, Livnat Y. et al. Interactive ray tracing for isosurface rendering. Proc IEEE Visualization. 1998:233-8
54. Garland M, Kirk DB. Understanding throughput-oriented architectures. Commun ACM. 2010;53(11):58
55. Gregg C, Hazelwood K. Where is the data? Why you cannot debate CPU vs. GPU performance without the answer. Proc IEEE International Symposium on Performance Analysis of Systems and Software. 2011:134-44
56. Schneider J, Westermann R. Compression domain volume rendering. Proc IEEE Visualization. 2003:293-300
57. Crassin C, Neyret F, Lefebvre S. et al. GigaVoxels: ray-guided streaming for efficient and detailed voxel rendering. Proc ACM SIGGRAPH Symposium on Interactive 3D Graphics and Games. 2009:15-22
58. Schneider J, Kraus M, Westermann R. GPU-Based Euclidean Distance Transforms and Their Application to Volume Rendering. In: (ed.) Ranchordas A, Pereira JM, Araújo HJ. et al. Computer Vision, Imaging and Computer Graphics Theory and Applications. Heidelberg, Germany: Springer. 2010:215-28
59. Cohen D, Sheffer Z. Proximity clouds - an acceleration technique for 3D grid traversal. Vis Comput. 1994;11(1):27-38
60. Sramek M, Kaufman A. Fast Ray-Tracing of Rectilinear Volume Data Using Distance Transforms. IEEE Trans Vis Comput Graph. 2000;6(3):236-52
61. Tiede U, Schiemann T, Hohne KH. High quality rendering of attributed volume data. Proc IEEE Visualization. 1998:255-62
62. Wald I. Active thread compaction for GPU path tracing. Proc ACM SIGGRAPH Symposium on High Performance Graphics. 2011:51-8
63. Lim S, Shin B-S. Bidirectional Distancemap for Efficient Volume Ray Casting. Levi A, Savaş E, Yenigün H, et al, editors. Computer and Information Sciences - ISCIS 2006. Springer Berlin Heidelberg. 2006:334-42
64. Hadwiger M, Berger C, Hauser H. High-quality two-level volume rendering of segmented data sets on consumer graphics hardware. Proc IEEE Visualization. 2003:301-8
65. Lux C, Fröhlich B. GPU-Based Ray Casting of Multiple Multi-resolution Volume Datasets. In: (ed.) Bebis G, Boyle R, Parvin B. et al. Advances in Visual Computing. Springer Berlin Heidelberg. 2009:104-16
Author contact
![]() Corresponding author: Dr. rer. medic. Dipl.-Inf. Felix Gremse, Experimental Molecular Imaging, RWTH Aachen University, Pauwelsstr. 30, 52074 Aachen, Germany. Phone: +49 241 8089761; Fax: +49 241 803380116; E-Mail: fgremsede
Corresponding author: Dr. rer. medic. Dipl.-Inf. Felix Gremse, Experimental Molecular Imaging, RWTH Aachen University, Pauwelsstr. 30, 52074 Aachen, Germany. Phone: +49 241 8089761; Fax: +49 241 803380116; E-Mail: fgremsede