Impact Factor
- Issue 14; 2026
- Issue 13; 2026
- Issue 12; 2026
- Issue 11; 2026
- Issue 10; 2026
- Volume 16; 2026
- Advance Articles
- Past Issues
- Cover Images
- Cover Suggestion
- Index & Coverage
- Special Issues
Introduction
Materials and Methods
Results
Discussion
Conclusions
Supplementary Material
Acknowledgements
References
International Journal of Biological Sciences
International Journal of Medical Sciences
 Global reach, higher impact

Theranostics 2016; 6(3):392-403. doi:10.7150/thno.13727 This issue Cite
Research Paper
Improving Nanoparticle Penetration in Tumors by Vascular Disruption with Acoustic Droplet Vaporization
Yi-Ju Ho1, Yuan-Chih Chang2, Chih-Kuang Yeh1 ![]()
1. Department of Biomedical Engineering and Environmental Sciences, National Tsing Hua University, Hsinchu, Taiwan
2. Institute of Cellular and Organismic Biology, Academia Sinica, Taipei, Taiwan
Received 2015-9-2; Accepted 2015-11-20; Published 2016-1-6
Abstract

Drug penetration influences the efficacy of tumor therapy. Although the leaky vessels of tumors can improve the penetration of nanodrugs via the enhanced permeability and retention (EPR) effect, various aspects of the tumor microenvironment still restrict this process. This study investigated whether vascular disruption using the acoustic vaporization of micro- or nanoscale droplets (MDs or NDs) induced by ultrasound sonication can overcome the limitations of the EPR effect to allow drug diffusion into extensive regions. The intravital penetration of DiI-labeled liposomes (as a drug model with red fluorescence) was observed using an acousto-optical integrated system comprising a 2-MHz focused ultrasound transducer (transmitting a three-cycle single pulse and a peak negative pressure of 10 MPa) in a window-chamber mouse model. Histology images of the solid tumor were also used to quantify and demonstrate the locations where DiI-labeled liposomes accumulated. In the intravital image analyses, the cumulative diffusion area and fluorescence intensity at 180 min were 0.08±0.01 mm2 (mean±standard deviation) and 8.5±0.4%, respectively, in the EPR group, 0.33±0.01 mm2 and 13.1±0.4% in the MD group (p<0.01), and 0.63±0.01 mm2 and 18.9±1.1% in the ND group (p<0.01). The intratumoral accumulations of DiI-labeled liposomes were 1.7- and 2.3-fold higher in the MD and ND groups, respectively, than in the EPR group. These results demonstrate that vascular disruption induced by acoustic droplet vaporization can improve drug penetration more than utilizing the EPR effect. The NDs showed longer lifetime in vivo than MDs and provided potential abilities of long periods of treatment, intertissue ND vaporization, and intertissue NDs-converted bubble cavitation to improve the drug penetration and transport distance.
Keywords: drug penetration, vascular disruption, acoustic droplet vaporization, transport distance
Introduction
Drug penetration in solid tumors crucially influences the efficacy of chemotherapy [1]. The drugs used in conventional chemotherapy inhibit tumor growth, but they also produce systemic toxicity by influencing normal physiological metabolism. With the aim of decreasing the possible side effects and treating specific tissues only, researchers have reported that leaky tumor vessels enable nanoparticles to penetrate into the tumor interstitial tissues; this passive drug-delivery procedure is called the enhanced permeability and retention (EPR) effect [2-5]. Although drug penetration can be improved by the EPR effect, the efficacy is still influenced by the size distribution of nanoparticles and many aspects of the tumor microenvironment, such as the vascular pore size [4, 6], vessel density, tumor vascular permeability, interstitial fluid pressure [3, 7], limited interstitial space, and tissue hypoxia regions (>70 μm from blood vessels [8]). Cabral et al. demonstrated that drug penetration is associated with the size of nanoparticles and the tumor permeability. The extravascular transport distances of 70-nm micelles were 40 and 10 µm in tumors with high and low permeability, respectively [7]. These limitations of the EPR effect might decrease the efficacy of drug penetration and increase the probability of inducing drug resistance and tumor recurrence [9-13].
The use of ultrasound (US)-stimulated microbubbles can produce the microstreaming, shock wave emission, fluid jetting, high wall speeds on expansion and collapse, high temperatures and pressures on collapse to apply the therapeutic applications of the sonoporation [14], sonophoresis [15], sonothrombolysis [16], and BBB disruption [17]. Furthermore, US-stimulated microbubbles have been investigated for improving the penetration capability of large particles, genes, and cells via vascular disruption by various mechanical forces from oscillation, expansion, and collapse of microbubbles [18-20]. This drug-delivery strategy also reduces the vascular perfusion and entraps drugs in tumor vessels [21-22]. The efficacy of vascular disruption is influenced by the US parameters (pressure magnitude, pulse length, and sonication time [23-26]) and the microbubble characteristics (size, shell composition, and intravascular concentration [24, 27]). However, the in vivo lifetime of microbubbles is typically only 5 to 20 min due to gas diffusion or microbubble destruction [28-29]; this limitation of a short in vivo lifetime might restrict the efficacy of tumor therapy due to the microbubble intravascular concentration being too low to disrupt the vessel walls during the treatment period [30]. Some researchers have used multiple bolus or high-dosage microbubble injection to maintain the efficacy of vascular disruption in tumor therapy [22, 31-32]. In addition, acoustic phase-change droplets with a considerably longer in vivo lifetime have been reported as a potential agent for use in therapeutic applications [27, 28].
The acoustic phase-change droplets combine a phospholipid shell with a liquid perfluorocarbon core, and the low solubility and diffusivity of perfluorocarbon provides a relative stable structure for the droplets in water or blood [33-34]. US sonication converts the droplets from their original liquid phase into gas bubbles to enhance US imaging. This process is called acoustic droplet vaporization (ADV) [33]. The initiation of ADV allows better in vivo spatial control compared with microbubbles because of the high acoustic power required [35]. This advantage provides potential applications for local drug release, enhancing vascular permeability, and mechanical tissue erosion induced by the expansion of ADV-generated bubbles (ADV-Bs; expansion ratios of 3- to 5-fold have been reported [36]), oscillation, and inertial cavitation [16]. Samuel et al. directly observed red-blood-cell penetration after intravascular ADV in intravital optical images [37]. In addition, micro- or nanoscale droplets (MDs or NDs, respectively) can be fabricated according to the specific medical application [38-40]. Williams et al. established that NDs with a mean size of 221 nm can accumulate in KHT-C sarcomas by the EPR effect and produced US contrast images after ADV [41]. Rapoport et al. reported that paclitaxel-loaded NDs with sizes from 300 to 500 nm can passively accumulate and directly release drugs in pancreatic tumor tissue by US sonication so as to inhibit tumor growth [42]. NDs present some advantages over MDs for tumor drug delivery, such as a longer in vivo lifetime (by preventing rapid renal clearance and reticuloendothelial system uptake), higher vascular extravasation (by the EPR effect), and higher intracellular uptake (by endocytosis) [43-44].
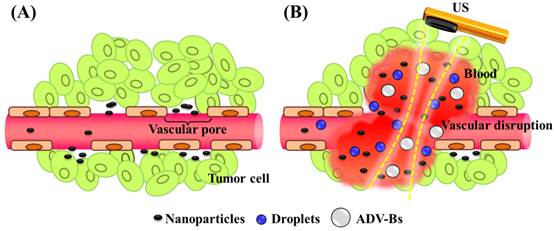
The present study evaluated the drug penetration via vascular disruption induced by ND vaporization, the EPR effect and MD vaporization were the control groups (Figure 1). For intravital imaging, the distribution of liposomes encapsulating the fluorescent dye DiI (with excitation at 549 and emission at 656 nm; 1,1'-dioctadecyl-3,3,3',3'-tetramethylindocarbocyanine perchlorate, Sigma-Aldrich, MO, USA) (as a drug model, and denoted as DLs) was observed in dorsal skinfold window-chamber-bearing mice using an acousto-optical integrated system. The diffusion area, fluorescence intensity, and transport distance of DLs were quantified to evaluate the drug penetration. Histology images were acquired to quantify the accumulation of DLs in solid tumors and the relative locations of intratumoral hemorrhages, DLs, and vessels. The purpose of this study was to determine whether drug penetration could be improved via the vascular disruption induced by ADV.
Nanoparticle delivery via (A) the EPR effect and (B) the vascular disruption induced by ADV.
Materials and Methods
Preparation of Particles
In this study, the phospholipid mixture of DLs, MDs, and NDs were contained with 1, 2-dipalmitoyl-sn-glycero-3-phosphocholine (DPPC), 1,2-dioctadecanoyl-sn-glycero-3-phospho-(1'-rac-glycerol) (DSPG), and 1,2-distearoyl-sn-glycero-3-phosphoethanolamine-N-[methoxy(polyethylene glycol)-5000] (DSPE-PEG5000) at a weight ratio of 10:4:4. These materials were purchased from Avanti Polar Lipids (Alabaster, AL, USA). The phospholipid mixture was added to 1 mL chloroform to dissolve in a 2 mL sealed glass vial and evaporated for 24 h with a rotary evaporator (Rotavapor R-210, Büchi Labortechnik AG, Flawil, Switzerland) at room temperature. The film of phospholipid was stored at -20°C. The preparation of aqueous phospholipid solution was to dissolve and disperse phospholipid film in 1 mL of degassed phosphate-buffered saline by sonication at room temperature.
DLs were used to observe the in vivo penetration in intravital fluorescence images [45-46]. The fabrication of DLs was to homogenize the 1 mL phospholipid solution (comprising 0.25 mg of DiI) for 10 min in a sonication bath (2510, Branson, Danbury, CT, USA). The suspension of DLs was stored at 4°C in the dark.
MDs were manufactured by homogenization in 0.5 mL of phospholipid solution and 0.1 mL of perfluoropentane (ABCR GmbH, Karlsruhe, German) for 10 min by a sonicator (100 W; 2510, Branson) at room temperature. To maintain the phospholipid solution at room temperature (25°C) and to avoid bubbles production during the manufacture, the vial was stored at 4°C for 5 min following the 5 min sonication and the process repeated twice. The MD emulsions were then centrifuged (3000×g for 1 min) to remove free phospholipids and liposomes.
The preparation of NDs was mixing 0.75 mL of perfluoropentane in 1 mL of phospholipid solution for 20 min using a high-intensity sonicator (200 W; UTR200, Dr Hielscher Company, Teltow, Germany). Note that to maintain the phospholipid solution at room temperature and to avoid bubbles production during the manufacture, the vial was stored at 4°C for 5 min following the 5 min sonication and the process repeated four times. Different centrifuges were used to select the droplet size: the first supernatant containing free phospholipids was removed after centrifuging at 5000×g for 5 min, the second centrifugation at 3000×g for 1 min removed liposomes, and after the final centrifugation at 1000×g for 1 min, the supernatant particles were smaller than 1 μm and had a nanoscale distribution. Finally, MD and ND emulsions were stored at 4°C for stabilization prior to being used in experiments.
The complete size distribution of the MDs was determined—including calculation of the mean size and concentration—using a Coulter counter (Multisizer 3, Beckman Coulter, Miami, FL, USA) with a detection range of 0.7-20 µm, while DLs and NDs were measured using a NanoSight LM10 device (Malvern Instruments, Worcestershire, UK) with a detected size range from 10 nm to 2 µm. The structural features of the particles were visually examined with the aid of a cryotransmission electron microscope (Tecnai F20, Philips, San Francisco, CA, USA). Samples (4 µL) were placed on holey carbon-film-covered copper grids (HC300-Cu, PELCO, CA, USA) to blot humidity, and then plunge-frozen in Vitrobot (FEI, Hillsboro, OR, USA). The grids were stored under liquid nitrogen and transferred to the electron microscope using a cryostage.
Cell Culture and Animal Preparation
The transgenic adenocarcinoma mouse prostate (TRAMP) cell line was used to form the tumors for animal experiments. TRAMP cells were cultured in Dulbecco's modified Eagle's medium (DMEM; Gibco, NY, USA) supplemented with 10% fetal bovine serum (FBS; Gibco), 1% penicillin-streptomycin (Gibco). Cells were grown in a humidified atmosphere with 5% CO2 at 37°C.
All of the animal experiments were carried out in accordance with the Institutional Animal Care Committee guidelines under a protocol approved by the animal experiment committee at National Tsing Hua University (approval number: 10044). C57BL/6JNarl mice (N=24, 7-10 weeks of age and weighing 30-35 g) were purchased from the National Laboratory Animal Center (Taipei, Taiwan). For all the animal experiments, mice were injected with 50 µL of a 1:1 mixture of Zoletil 50 (Virbac, Carros, France) and Rompun 2% (Bayer HealthCare, Leverkusen, Germany) for intraperitoneal anesthesia. The body temperature was maintained at 35-37°C using a heating pad (THM100, Indus Instruments, Houston, TX, USA).
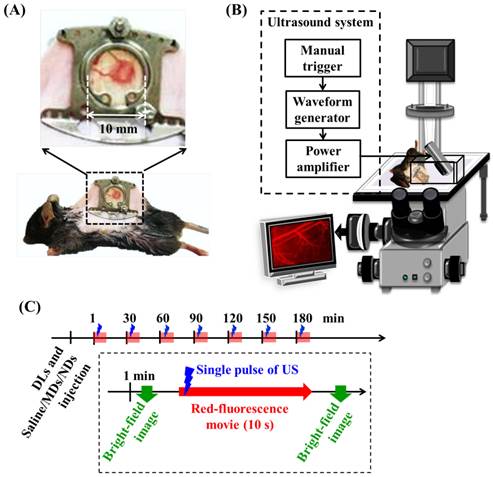
Two types of in vivo experiments were employed to evaluate the penetration capability of DLs. The window chamber model combining intravital imaging was used to quantify the DLs penetration and the solid tumor model was applied to demonstrate the intratumoral DLs distribution. For intravital imaging, mice (N=12) were subcutaneously injected with 1×10⁶ TRAMP cells in the dorsal skin. Five days after implantation when the tumor size was to 2-3 mm, the tumor was clipped and fixed in a window chamber kit (SM100, APJ Trading, Ventura, CA, USA) [47]. A circular glass coverslip on the window chamber provided a clear field to directly observe vessels and tumor tissue and obtain the intravital images (Figure 2A) [48-49]. Moreover, previous studies have applied window chamber models to investigate the tumor microenvironment [4, 48-49], assess the effects of therapy [50], and evaluate the in vivo pharmacokinetics [7, 51-54].
(A) Dorsal skinfold window-chamber-bearing mouse. (B) Acousto-optical integrated system, in which the transducer is immersed in a water tank and focused on the window chamber. (C) Intravital imaging flowchart.
Solid-tumor-bearing mice were prepared to demonstrate the penetration of DLs and tumor hemorrhage in histology images. Mice (N=12) were subcutaneously injected with 1×10⁶ TRAMP cells in the right leg [55]. Nine days after implantation, when the tumor size was 6-7 mm, the solid-tumor-bearing mice were investigated in US sonication experiments.
Intravital Imaging Using the Acousto-optical System
Intravital images of the vascular structure and tumor hemorrhage before and after treatment were acquired by a self-made acousto-optical system comprising an inverted microscope (IX71, Olympus, Tokyo, Japan) with a 4× objective (UPlanFL, Olympus) and a US sonication system (Figure 2B). A 2-MHz focused US transducer (model SU-101, Sonic Concepts, Bothell, WA, USA; diameter of 35 mm and focus length of 55 mm) was immersed in a water tank and placed on the microscope stage. The US transducer was driven by a function generator (WW2571, Tabor Electronics, Haifa, Israel) and radiofrequency power amplifier (150A100B, Amplifier Research, Souderton, PA, USA). The US sonication was a three-cycle pulse with a peak negative pressure of 10 MPa and the sonication was triggered manually [36]. The parameters of US sonication of window chamber experiments are summarized in Table 1. The acoustic pressure was calibrated with a polyvinylidene difluoride-type hydrophone (model HGL-0085, ONDA, Sunnyvale, CA, USA; calibration range of 1-40 MHz; spatial resolution of 85 μm) in an acrylic water tank filled with degassed and deionized water at 25°C.
Parameters of US sonication for window chamber and solid tumor two models.
| Window chamber | Solid tumor | |
|---|---|---|
| Frequency (MHz) | 2 | 2 |
| Peak negative pressure (MPa) | 10 | 10 |
| Pulse length (cycle) | 3 | 1000 |
| PRF (Hz) | --- | 18 |
| Sonication time | Single pulse | 20-30 min |
Window-chamber-bearing mice (N=12) were randomly separated into the EPR, MD, and ND groups (each N=4). Intravital imaging with an in-plane resolution of 1360 by 1024 pixels (field view of 850 by 640 µm), bright-field images showed the blood-vessel and tumor-tissue patterns for revealing vascular disruption and hemorrhage. The intra- and extravascular distributions of the DLs were determined using red fluorescence. The experimental procedure is shown in Figure 2C. After injecting 50 µL of DLs, 50 µL of saline, MDs (concentration of 1×10⁶ MDs/mL), and NDs (concentration of 1×10⁶ NDs/mL) were infused by retro-orbital injection in the EPR, MD, and ND groups, respectively [56]. The penetration of DLs by the EPR effect and vascular disruption were evaluated over time by making measurements at time points 1, 30, 60, 90, 120, 150, and 180 min after injecting saline, MDs, or NDs. At each time point, the pre-US red-fluorescence images were the control images, and movies of the red fluorescence were recorded for 10 s at a frame rate of 15 fps during single-pulse US sonication. Bright-field images were obtained before and after acquiring the movies of red fluorescence to evaluate the vascular structure and tumor hemorrhage.
Quantification of DL Penetration
Intravital images were analyzed using MATLABTM (The MathWorks, Natick, MA, USA) and ImageJ (NIH, Bethesda, MD, USA) software. The red-fluorescence movies were converted to image sequences with a frame rate of 1 fps to analyze the penetration of DLs. The DL diffusion area, fluorescence intensity, and transport distance were quantified to evaluate extravascular drug distribution regions, extravascular drug accumulation, and the gradient of drug accumulation from vessel to tissue, respectively. The image analyses were applied to pre- and post-US red-fluorescence images obtained at each time point to avoid any overlapping of DL penetration after multiple US sonications. The diffusion area was defined by subtracting pre- and post-US images to remove the stationary areas (e.g., vessel pattern). The threshold of the background noise level in fluorescence intensity was set to determine the penetration of DLs. Afterward, the fluorescence intensity was calculated as the percentage increase in fluorescence intensity relative to the pre-US images. The diffusion area and fluorescence intensity were analyzed both individually and cumulatively at 1, 30, 60, 90, 120, 150, and 180 min. The individual results were used to compare DL penetration between the EPR, MDs, and NDs at each time point after a single US sonication, while the cumulative results were used to trace the final improvement of the DL penetration after multiple US sonications.
The transport distance was measured using the fluorescence intensity profile from the vessel wall to the tumor tissue [7]. Since previous studies have found that the drug penetrates by 39-51 µm and hypoxia region extends to 87-142 µm in solid tumors [13], a 20×100 µm2 region of interest was placed vertically on the ruptured vessel wall with the maximum hemorrhage position to evaluate the DL transport distance. Time-to-distance maps were generated from the fluorescence intensity and extravascular distance for a time series; these maps were used to observe the enhancement of the transport distance by ADV at various time points. Furthermore, the fluorescence intensity at an extravascular distance of 70 µm was used to approximately evaluate the drug penetration in regions distant from vessels with inadequate oxygen, nutrient, and drug delivery [8, 57].
Ultrasound Sonication of Solid Tumors
Solid-tumor-bearing mice were divided into the EPR, MD, and ND groups (each N=4) for the US sonication experiments, and the dosages of DLs, MDs, and NDs were followed. A US-imaging-guided stereotactic sonication system was combined with a 25-MHz high-resolution US imaging system (V324, Panametrics, Waltham, MA,USA; diameter of 6.1 mm and focus length of 12.3 mm) and a 2-MHz focused US transducer [58-59]. After determining the tumor location in US images, DLs and saline/MDs/NDs (depending on the group) were infused by retro-orbital injection and circulated for 1 min. The 2-MHz US transducer transmitted the pulses with a pulse length of 1000-cycle, and a pulse repetition frequency (PRF) of 18 at a peak negative pressure of 10 MPa (parameters as summarized in Table 1). The longer pulse length of US sonication was used to avoid the acoustic wave attenuation within solid tumors [60-61]. The transducer affixed to a motor driver was moved to the imaging slice position (i.e., ultrasound focal depth in the tumor center) and sonicated for 5 minutes. After that, the transducer was moved manually by a triaxial platform to the next position of imaging slice and repeated the sonication process [21-22, 31]. The total sonication time was typically 30 to 40 min for whole-tumor sonication. Finally, mice with solid tumors were sacrificed after 24 h, and the tumor tissues were filled with optimal-cutting-temperature compound (Tissue-Tek, Sakura Finetek, Torrance, CA, USA) and frozen at -20°C overnight.
Histology Analysis
Solid tumors were sectioned at a thickness of 20 μm and observed with the aid of an inverted microscope (IX71, Olympus) with a 10× objective (UPlanFL, Olympus). Histology images of hematoxylin and eosin (H&E) staining defined tumor hemorrhages in bright-field images [62], red-fluorescence images showed the DL distribution, and the CD31 immunohistochemical assay showed vessel patterns in green-fluorescence images [6]. Comparisons of relative locations in these histology images demonstrated that the DL distribution was due to vascular disruption. The red-fluorescence intensity of DLs per unit tumor tissue in histology images was analyzed using MATLABTM software to quantify the accumulation of DLs in solid tumors.
The immunohistochemistry of CD31 staining was applied to indicate tumor vessels. The slices were fixed in methanol at -20°C for 10 min and washed in degassed phosphate-buffered saline. After that, blocking buffer blended 5% goat serum and 1% bovine serum albumin in degassed phosphate-buffered saline was reacted at room temperature for 1 h. The sections were overlaid with rat-anti-mouse CD31 monoclonal antibody (1:100 dilution in degassed phosphate-buffered saline; BD Biosciences, San Diego, CA, USA) at room temperature for 1 h. After removal of the primary antibody and washing in degassed phosphate-buffered saline three times, FITC-labeled goat-anti-rat IgG (1:100 dilution in degassed phosphate-buffered saline; Thermo Fisher Scientific, Waltham, MA, USA) were immersed the tissues at room temperature for 30 min. The slides were stored at -20°C in the dark.
Statistical Analysis
The results are presented as mean±standard-deviation values for at least three independent samples; the standard deviations are indicated as error bars in each graph. The statistical comparisons of diffusion area, fluorescence intensity, and transport distance were performed using paired two-tailed Student's t-tests, and a probability value of p<0.05 was considered to be indicative of statistical significance.
Results
Size Distribution of Particles
The cryotransmission electron microscope images from left to right in Figure 3A display the structures of DLs, MDs, and NDs. DLs were composed of condensed water and double-layer phospholipid shells, while MDs and NDs had single-layer phospholipid shells and a black core that was produced by condensed perfluoropentane.
(A) Cryo-transmission electron microscope images of DLs, MDs, and NDs. Size distributions as measured using a (B) Coulter counter and (C) Nanosight device.
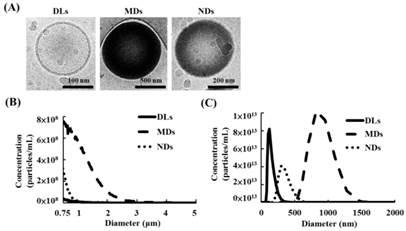
The sizes and concentrations of MDs measuring a Coulter counter was 1.1±0.1 μm and (3.5±0.3)×1010 MDs/mL, respectively (Figure 3B). Furthermore, the primary diameter and concentration of DLs and NDs was evaluated using Nanosight device, which showed 124±18 nm and (4.0±0.9)×1013 DLs/mL for DLs, respectively, and 357±54 nm and (1.7±0.4)×1013 NDs/mL for NDs.
Quantification of DL Penetration
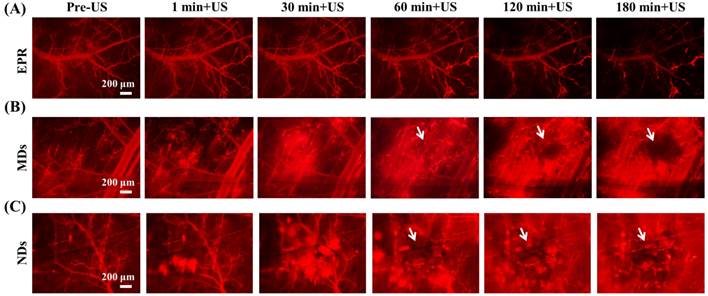
The penetration of DLs induced by EPR, MDs, and NDs was estimated using intravital red-fluorescence images in the window-chamber model. The pre-US images displayed the vascular structure enhanced by the infusion of DLs. In the EPR group, the vessels maintained an intact structure after multiple US sonications without injecting MDs or NDs; the DLs gradually penetrated the tumor tissue over time via the EPR effect, especially at the end of the vessels (Figure 4A). After injecting MDs or NDs with US sonication, red-fluorescence masses appeared that covered the vascular structure, as shown in Figure 4B and 4C. Numerous red-fluorescence masses appeared at 180 min in a hazy pattern after multiple US sonications in both the MD and ND groups. The image sequences reveal that some red-fluorescence masses gradually darkened from 60 to 180 min in the MD and ND groups (white arrows), which might have been due to blood coagulation obscuring the red fluorescence of DLs [63]. Note that all of the mice survived with multiple US sonications in the experiments and also exhibited normal behaviors until natural death.
Intravital images of (A) EPR, (B) MDs, and (C) NDs. The red fluorescence darkened due to blood clots covering the DLs in the areas indicated by white arrows.
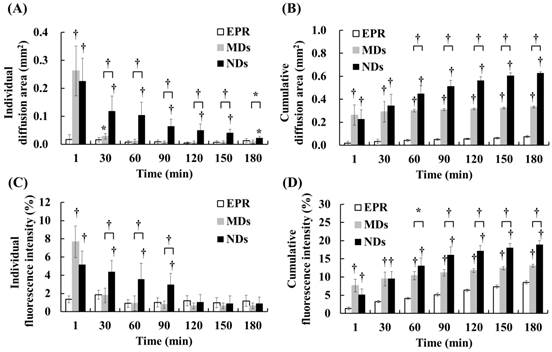
DL penetration was quantified from the individual and cumulative results. Comparisons of the various time points indicated that the individual diffusion areas showed a decreasing trend over time in the MD and ND groups, which was due to the decreased intravascular MDs/NDs concentration reducing the efficacy of vascular disruption (Figure 5A). The individual diffusion area relative to EPR did not differ significantly from MDs at 60 min, but differed significantly from NDs until 180 min. The cumulative diffusion areas of MDs and NDs were 4.4- and 8.3-fold higher, respectively, than the EPR at the final time point of 180 min (Figure 5B). Moreover, the cumulative diffusion area was significantly larger for NDs than for MDs at 60 min due to the continuous ADV, and was 1.9-fold higher than that of MDs at 180 min (p<0.01). The individual fluorescence intensity displayed a similar trend to the individual diffusion area, with no significant difference between the EPR group when the individual diffusion area was 0.03±0.01 µm2 at 30 min in the MD group and 0.05±0.02 µm2 at 120 min in the ND group (Figure 5C). The cumulative fluorescence intensities of MDs and NDs were 1.5- and 2.2-fold higher than that of EPR at 180 min (p<0.05) (Figure 5D).
Quantification of DL penetration with (A) individual and (B) cumulative diffusion areas, and (C) individual and (D) cumulative fluorescence intensities (* p<0.05, † p<0.01).
The quantification data indicated that vascular disruption improved the extravascular DL distribution regions and accumulation more than the EPR effect. Comparison of the vascular disruption induced by ADV revealed that NDs provided a longer in vivo lifetime to produce more DL penetration than did MDs. The process of vascular disruption after US sonication continued until 30 min for MDs and until 180 min for NDs in intravital images (Additional File 1: Movie S1 in supporting information).
Extravascular Transport Distance
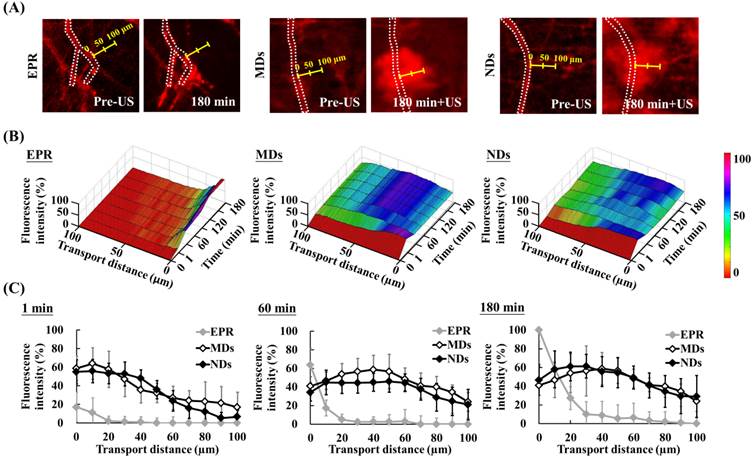
The red-fluorescence images in Figure 6A indicate the vascular structure (dotted line) and measurement direction at the maximum hemorrhage position (yellow scale). Time-to-distance maps reveal the color displacement that can be used to estimate DL penetration in the EPR, MD, and ND groups after US sonication at each time point (Figure 6B). DLs diffused to near the vessel walls and the fluorescence intensity improved over time via the EPR effect only. The peak dark-blue region near the vessel wall shifted to blue in the MD map and to green in the ND map when DLs were delivered to distant regions after US sonication. The fluorescence intensities near the vessel wall (at a transport distance of 0 μm) at 1, 60, and 180 min were 17±16%, 64±18%, and 100±12%, respectively, in the EPR group; 59±13%, 41±10%, and 41±20% in the MD group; and 55±13%, 34±9%, and 47±16% in the ND group (Figure 6C). The fluorescence intensity of EPR increased over time and was higher than for MDs and NDs at 60 min since almost all of the DLs accumulated near the vessel wall. In addition, the fluorescence intensities at a transport distance of 70 μm at 1, 60, and 180 min were 0±6%, 0±9%, and 3±9%, respectively, in the EPR group; 24±11%, 41±14%, and 41±7% in the MD group; and 16±11%, 38±12%, and 41±13% in the ND group. The improvement in the fluorescence intensity over time demonstrated that vascular disruption provides a potential way to deliver drugs into a hypoxia region (with an extravascular distance of >70 μm) via ADV.
Evaluation of transport distance. (A) Intravital images in which dotted lines display the vascular structure and yellow scales indicate measurement directions and distances. (B) Time-to-distance maps reveal the association with fluorescence intensity, transport distance, and various time points with US sonication. (C) Fluorescence intensity versus the transport distance at 1, 60, and 180 min.
Solid-Tumor Histology
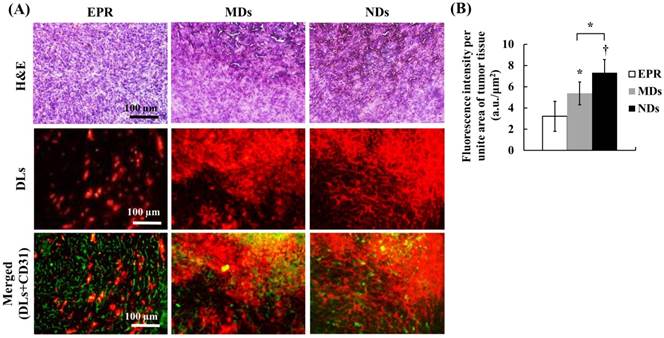
The solid-tumor histology images showed tissue hemorrhage, the DL distribution, and vessel patterns by H&E, DLs, and CD31 staining, respectively (Figure 7A). Merged images of DLs and CD31 were produced to reveal the relative locations of DLs and vessels. The EPR group showed intact tumor tissues and vessel patterns in H&E and merged images. The DLs only penetrated near the vessels, which is consistent with the transport distance evident in the intravital images. In the MD and ND groups, deep-purple regions revealed tissue hemorrhaging indicated by H&E stain, with a hazy and extensive DL distribution overlapping vessel pattern in merged images. The fluorescence intensities per unit area of tumor tissue, which quantify the accumulation of DLs in solid tumors, were 3.22±1.42, 5.38±1.07, and 7.32±1.24 in the EPR, MD, and ND groups, respectively (Figure 7B). These results demonstrate that vascular disruption induced by ADV showed greater drug accumulation than that induced by the EPR effect, and hence it provides a possible way for overcoming the limitation of drug penetration induced by the tumor microenvironment.
(A) Histology images of solid tumors. The tissue hemorrhage, DL distribution, and vessel patterns are shown by H&E stain, DLs, and merged (DLs+CD31) images, respectively. The deep-purple color indicates intratumoral hemorrhage stained with H&E in the MD and ND groups. Comparing the locations of DLs and vessels in merged images, DLs only appear near the vessel wall in the EPR group, but express a hazy pattern in the MD and ND groups. (B) Quantification of DL accumulation in solid tumors (* p<0.05, † p<0.01).
Discussion
Drug penetration in solid tumors is influenced by various aspects of the tumor microenvironment. This study used vascular disruption induced by ADV to improve drug penetration, and this was compared with the EPR effect. The quantification of DL penetration in MDs and NDs relative to the EPR effect at 180 min showed 4.4- and 8.3-fold increases, respectively, in the diffusion area and 1.5- and 2.2-fold increases in the fluorescence intensity. However, the efficacy of vascular disruption was inversely proportional to time due to the decreasing intravascular concentration of MD or ND. Therefore, how to define the effective treatment time for vascular disruption induced by ADV is an important issue for tumor therapy.
Comparisons with the individual data revealed that the diffusion areas in the MD and ND groups were significant larger than that in the EPR group at 30 and 180 min, but there was no difference in fluorescence intensity (Figure 5A and 5C). These inconsistent results indicated that the EPR effect might result in the accumulation of dense DLs within the intensive diffusion area to produce high fluorescence intensity; this is also demonstrated in Figure 6C, where the fluorescence intensity of the EPR effect is higher than that for MDs and NDs near the vessel wall at 60 min. Consequently, the effective vascular disruption induced by ADV should be defined when the drug accumulation is higher than that by the EPR effect. The effective treatment time of the vascular disruption was less than 30 min for MDs and 90 min for NDs, and this differed significantly with the EPR effect in both the individual diffusion area and the fluorescence intensity data. The long-lasting vascular disruption effect of NDs indicates their potential ability to improve drug penetration in tumor treatment via the application of repeatable and multiple US sonications.
For time-to-distance maps, the fluorescence intensity at a transport distance of 70 µm increased from 24% to 42% at 30 min after injecting MDs and from 16% to 41% at 180 min after injecting NDs (Figure 6B). The diffusion area of NDs showed a continuous slightly increasing trend after each US sonication, whereas that of MDs did not differ from 30 to 180 min. In order to evaluate the drug-penetration behavior induced by multiple MD and ND vaporization, Figure 8A shows intravital images that reveal the DL penetrations at 1 and 30 min after US sonication. The bright-field and red-fluorescence images indicate hemorrhage and the DL distribution, respectively. The red-fluorescence decay evident in the images obtained at 30 min was due to the blood clots in both the MD and ND groups. Comparison of the bright-field images between 1 and 30 min reveals a slight change (black arrows) in both the MD and ND groups, but there is an obvious external expansion in the red-fluorescence images (white arrows) only in the ND group. Since the red blood cells were trapped in the platelet-fibrin framework [64], the network of blood clots was formed with nano-sized pores after hemolysis of blood cells [65]. This specific network might allow NDs to continuously extravasate from vessels into the blood clots, and broke up the blood clots to deliver DLs into distant regions after US sonications [16]. However, the sizes of MDs might were too large to fit within the fibrin matrix of blood clots; so that, the DLs delivery was restricted by the blocked penetration of MDs at disrupted vessels.
(A) Intravital images obtained at 1 and 30 min after US sonication used to evaluate the drug-penetration behavior induced by the vaporization of multiple MDs and NDs. The bright-field and red-fluorescence images reveal hemorrhage and DL penetration, respectively. The arrows indicate the differences between two US sonications. (B) The intertissue ADV and penetration of ADV-Bs images in the ND group. The black and white arrows indicate the locations of ADV-Bs.
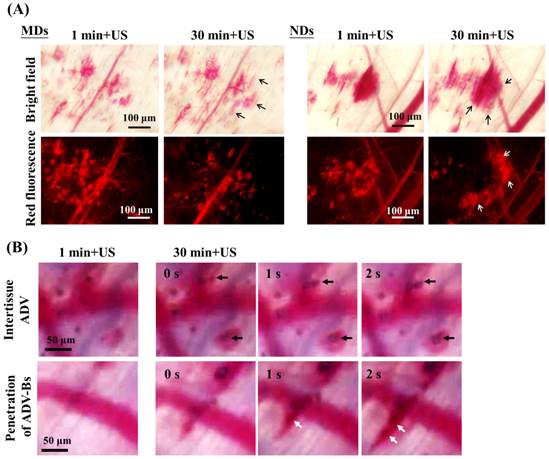
Figure 8B shows intravital bright-field images of NDs obtained at 1 and 30 min with US sonication (Additional File 2: Movie S2 in supporting information). The regions in which intertissue ADV and ADV-Bs formed are indicated by black arrows. Hemorrhage and ADV-Bs appeared in these two areas at 1 min, and new ADV-Bs appeared in hemorrhage regions (blood clots) after the second US sonication. The resolution when imaging vessel diameters using an optical microscope is 5-10 μm, so that, if the new ADV-Bs (with diameters of 10-15 μm) formed in the vessels, the vessel pattern should be observed in this focal plane. However, no clear vessel pattern was evident in the areas where ADV-Bs formed before the second US sonication, and so the results obtained in this study suggest that ADV is produced in extravascular or intertissue regions. The intravital images provided some evidence and probability of intertissue ADV induced by NDs after multiple US sonications. Moreover, the penetration of ADV-Bs shows that the ADV-Bs (blurred black objects indicated by white arrows) were produced in vessels and then gradually flowed into tumor tissue at 30 min after the second US sonication. These ADV-Bs and intertissue ADV induced intertissue cavitation that directly disrupted the tumor tissue and probably would deliver drugs to distant regions. On the other hand, since blood clots would restrict the drug distribution, the characteristic of NDs favoring the penetration of intertissue ADV and ADV-Bs could be utilized to avoid this possible limitation and assist to improve the drug diffusion area and distance.
Acoustic cavitation of US-stimulated microbubbles can generate some mechanical effects to deliver drugs and directly damage tumor cells via the oscillation, expansion, and collapse of the microbubbles [18-20]. Previous studies have reported that microbubbles cavitation can induce some physiological mechanisms of tumor vessels to assist tumor therapy, like the tumor cell disruption by fluid microjets and asymmetrical collapse [66], and pushing against the vascular endothelial lining by microbubble expansion [67]. These physiological mechanisms might activate various cytokines secreted by damaged cells to induce cell apoptosis, acute inflammation, and immune response [68-69]. This antitumor immune response provides tumor specificity and long-lasting effects that could potentially assist chemotherapy [70-71]. In addition, tumor metastasis induced by intratumoral hemorrhage was previously discussed but not found at 30 days after treatment with US-stimulated microbubbles [60-61]. Other researchers also reported no significant increment of metastasis after tumor hemorrhage induced by US ablation [72-73]. Therefore, we considered that vascular disruption induced by ADV provides not only chemotherapeutic drug delivery and physical stimulation via mechanical forces, but also activated antitumor immunotherapy to inhibit tumor growth without increasing the potential risk of tumor metastasis.
This study investigated ADV to disrupt tumor vessels under a consistent protocol of US sonication. However, the ADV efficiency was associated with US parameters (pressure magnitude and sonication time), and characteristics of droplets (size and intravascular concentration). Thus, the parameters of US sonication need to be optimized under different conditions. Moreover, the effective treatment time of this delivery strategy should be defined more exactly in order to optimally control the US solid-tumor sonication time.
Conclusions
This study has demonstrated that vascular disruption induced by ADV with multiple US sonications improves drug penetration more than the EPR effect. The intravital images revealed that NDs provide the potential to prolong the effective treatment time of tumor sonication, induce intertissue ADV, and penetrate ADV-Bs to improve drug penetration. This drug-delivery strategy might overcome the limitations of the tumor microenvironment and provide a way to deliver drugs into tumor hypoxia regions or tumors with low permeability.
Supplementary Material
Additional File 1Movie S1.
Movie S2.
Acknowledgements
The authors gratefully acknowledge the support of the Ministry of Science and Technology, Taiwan under Grant No. 101-2221-E-007-035-MY3 and 104-2221-E-007-076, National Tsing Hua University (Hsinchu, Taiwan) under Grant No. 104N2046E1, and Chang Gung Memorial Hospital (Linkou, Taiwan) under Grant No. CIRPD2E0051.
Competing Interests
The authors have declared that no competing interest exists.
References
1. Minchinton AI, Tannock IF. Drug penetration in solid tumours. Nature reviews Cancer. 2006;6:583-92
2. Iyer AK, Khaled G, Fang J, Maeda H. Exploiting the enhanced permeability and retention effect for tumor targeting. Drug discovery today. 2006;11:812-8
3. Li Y, Wang J, Wientjes MG, Au JL. Delivery of nanomedicines to extracellular and intracellular compartments of a solid tumor. Advanced drug delivery reviews. 2012;64:29-39
4. Hobbs SK, Monsky WL, Yuan F, Roberts WG, Griffith L, Torchilin VP. et al. Regulation of transport pathways in tumor vessels: role of tumor type and microenvironment. Proceedings of the National Academy of Sciences of the United States of America. 1998;95:4607-12
5. Matsumura Y, Maeda H. A new concept for macromolecular therapeutics in cancer chemotherapy: mechanism of tumoritropic accumulation of proteins and the antitumor agent smancs. Cancer Res. 1986;46:6387-92
6. Meng H, Xue M, Xia T, Ji Z, Tarn DY, Zink JI. et al. Use of size and a copolymer design feature to improve the biodistribution and the enhanced permeability and retention effect of doxorubicin-loaded mesoporous silica nanoparticles in a murine xenograft tumor model. ACS nano. 2011;5:4131-44
7. Cabral H, Matsumoto Y, Mizuno K, Chen Q, Murakami M, Kimura M. et al. Accumulation of sub-100 nm polymeric micelles in poorly permeable tumours depends on size. Nature nanotechnology. 2011;6:815-23
8. Vaupel P, Harrison L. Tumor hypoxia: causative factors, compensatory mechanisms, and cellular response. The oncologist. 2004;9(Suppl 5):4-9
9. Jain RK, Stylianopoulos T. Delivering nanomedicine to solid tumors. Nature reviews Clinical oncology. 2010;7:653-64
10. Fang J, Nakamura H, Maeda H. The EPR effect: Unique features of tumor blood vessels for drug delivery, factors involved, and limitations and augmentation of the effect. Advanced drug delivery reviews. 2011;63:136-51
11. Duncan R. Polymer conjugates for tumour targeting and intracytoplasmic delivery. The EPR effect as a common gateway? Pharmaceutical science & technology today. 1999;2:441-9
12. Brown JM, Giaccia AJ. The unique physiology of solid tumors: opportunities (and problems) for cancer therapy. Cancer Res. 1998;58:1408-16
13. Primeau AJ, Rendon A, Hedley D, Lilge L, Tannock IF. The distribution of the anticancer drug Doxorubicin in relation to blood vessels in solid tumors. Clinical cancer research: an official journal of the American Association for Cancer Research. 2005;11:8782-8
14. Kudo N, Okada K, Yamamoto K. Sonoporation by single-shot pulsed ultrasound with microbubbles adjacent to cells. Biophysical journal. 2009;96:4866-76
15. Park D, Park H, Seo J, Lee S. Sonophoresis in transdermal drug deliverys. Ultrasonics. 2014;54:56-65
16. Pajek D, Burgess A, Huang Y, Hynynen K. High-intensity focused ultrasound sonothrombolysis: the use of perfluorocarbon droplets to achieve clot lysis at reduced acoustic power. Ultrasound in medicine & biology. 2014;40:2151-61
17. Fan CH, Ting CY, Chang YC, Wei KC, Liu HL, Yeh CK. Drug-loaded bubbles with matched focused ultrasound excitation for concurrent blood-brain barrier opening and brain-tumor drug delivery. Acta biomaterialia. 2015
18. Hernot S, Klibanov AL. Microbubbles in ultrasound-triggered drug and gene delivery. Advanced drug delivery reviews. 2008;60:1153-66
19. Qin S, Caskey CF, Ferrara KW. Ultrasound contrast microbubbles in imaging and therapy: physical principles and engineering. Physics in medicine and biology. 2009;54:R27-57
20. Ferrara K, Pollard R, Borden M. Ultrasound microbubble contrast agents: fundamentals and application to gene and drug delivery. Annual review of biomedical engineering. 2007;9:415-47
21. Wood AK, Ansaloni S, Ziemer LS, Lee WM, Feldman MD, Sehgal CM. The antivascular action of physiotherapy ultrasound on murine tumors. Ultrasound in medicine & biology. 2005;31:1403-10
22. Goertz DE, Todorova M, Mortazavi O, Agache V, Chen B, Karshafian R. et al. Antitumor effects of combining docetaxel (taxotere) with the antivascular action of ultrasound stimulated microbubbles. PloS one. 2012;7:e52307
23. Miller DL, Gies RA. Gas-body-based contrast agent enhances vascular bioeffects of 1.09 MHz ultrasound on mouse intestine. Ultrasound in medicine & biology. 1998;24:1201-8
24. Miller DL, Quddus J. Diagnostic ultrasound activation of contrast agent gas bodies induces capillary rupture in mice. Proceedings of the National Academy of Sciences of the United States of America. 2000;97:10179-84
25. Miller DL. Overview of experimental studies of biological effects of medical ultrasound caused by gas body activation and inertial cavitation. Progress in biophysics and molecular biology. 2007;93:314-30
26. Hwang JH, Tu J, Brayman AA, Matula TJ, Crum LA. Correlation between inertial cavitation dose and endothelial cell damage in vivo. Ultrasound in Medicine and Biology. 2006;32:1611-9
27. Price RJ, Skyba DM, Kaul S, Skalak TC. Delivery of colloidal particles and red blood cells to tissue through microvessel ruptures created by targeted microbubble destruction with ultrasound. Circulation. 1998;98:1264-7
28. Kabalnov A, Bradley J, Flaim S, Klein D, Pelura T, Peters B. et al. Dissolution of multicomponent microbubbles in the bloodstream: 2. Experiment. Ultrasound in medicine & biology. 1998;24:751-60
29. Kang ST, Yeh CK. Ultrasound microbubble contrast agents for diagnostic and therapeutic applications: current status and future design. Chang Gung medical journal. 2012;35:125-39
30. Chen H, Hwang JH. Ultrasound-targeted microbubble destruction for chemotherapeutic drug delivery to solid tumors. Journal of therapeutic ultrasound. 2013;1:10
31. Todorova M, Agache V, Mortazavi O, Chen B, Karshafian R, Hynynen K. et al. Antitumor effects of combining metronomic chemotherapy with the antivascular action of ultrasound stimulated microbubbles. International journal of cancer Journal international du cancer. 2013;132:2956-66
32. Wood AK, Schultz SM, Lee WM, Bunte RM, Sehgal CM. Antivascular ultrasound therapy extends survival of mice with implanted melanomas. Ultrasound in medicine & biology. 2010;36:853-7
33. Kripfgans OD, Fowlkes JB, Miller DL, Eldevik OP, Carson PL. Acoustic droplet vaporization for therapeutic and diagnostic applications. Ultrasound in medicine & biology. 2000;26:1177-89
34. Reznik N, Williams R, Burns PN. Investigation of vaporized submicron perfluorocarbon droplets as an ultrasound contrast agent. Ultrasound in medicine & biology. 2011;37:1271-9
35. Phillips LC, Puett C, Sheeran PS, Wilson Miller G, Matsunaga TO, Dayton PA. Phase-shift perfluorocarbon agents enhance high intensity focused ultrasound thermal delivery with reduced near-field heating. The Journal of the Acoustical Society of America. 2013;134:1473-82
36. Kang ST, Huang YL, Yeh CK. Characterization of acoustic droplet vaporization for control of bubble generation under flow conditions. Ultrasound in medicine & biology. 2014;40:551-61
37. Samuel S, Duprey A, Fabiilli ML, Bull JL, Fowlkes JB. In vivo microscopy of targeted vessel occlusion employing acoustic droplet vaporization. Microcirculation. 2012;19:501-9
38. Rapoport N, Gao Z, Kennedy A. Multifunctional nanoparticles for combining ultrasonic tumor imaging and targeted chemotherapy. Journal of the National Cancer Institute. 2007;99:1095-106
39. Rapoport NY, Kennedy AM, Shea JE, Scaife CL, Nam KH. Controlled and targeted tumor chemotherapy by ultrasound-activated nanoemulsions/microbubbles. Journal of controlled release: official journal of the Controlled Release Society. 2009;138:268-76
40. Rapoport NY, Nam KH, Gao Z, Kennedy A. Application of Ultrasound for Targeted Nanotherapy of Malignant Tumors. Acoustical physics. 2009;55:594-601
41. Williams R, Wright C, Cherin E, Reznik N, Lee M, Gorelikov I. et al. Characterization of submicron phase-change perfluorocarbon droplets for extravascular ultrasound imaging of cancer. Ultrasound in medicine & biology. 2013;39:475-89
42. Rapoport N, Nam KH, Gupta R, Gao Z, Mohan P, Payne A. et al. Ultrasound-mediated tumor imaging and nanotherapy using drug loaded, block copolymer stabilized perfluorocarbon nanoemulsions. Journal of controlled release: official journal of the Controlled Release Society. 2011;153:4-15
43. Hu CM, Zhang L. Therapeutic nanoparticles to combat cancer drug resistance. Current drug metabolism. 2009;10:836-41
44. Peer D, Karp JM, Hong S, Farokhzad OC, Margalit R, Langer R. Nanocarriers as an emerging platform for cancer therapy. Nature nanotechnology. 2007;2:751-60
45. Janib SM, Moses AS, MacKay JA. Imaging and drug delivery using theranostic nanoparticles. Advanced drug delivery reviews. 2010;62:1052-63
46. Litzinger DC, Buiting AM, van Rooijen N, Huang L. Effect of liposome size on the circulation time and intraorgan distribution of amphipathic poly(ethylene glycol)-containing liposomes. Biochimica et biophysica acta. 1994;1190:99-107
47. Papenfuss HD, Gross JF, Intaglietta M, Treese FA. A transparent access chamber for the rat dorsal skin fold. Microvasc Res. 1979;18:311-8
48. Bauer DR, Olafsson R, Montilla LG, Witte RS. 3-D photoacoustic and pulse echo imaging of prostate tumor progression in the mouse window chamber. Journal of biomedical optics. 2011;16:026012
49. Baron VT, Welsh J, Abedinpour P, Borgstrom P. Intravital microscopy in the mouse dorsal chamber model for the study of solid tumors. American journal of cancer research. 2011;1:674-86
50. Eichhorn ME, Klotz LV, Luedemann S, Strieth S, Kleespies A, Preissler G. et al. Vascular targeting tumor therapy: non-invasive contrast enhanced ultrasound for quantitative assessment of tumor microcirculation. Cancer biology & therapy. 2010;9:794-802
51. Dicheva BM, Hagen TL, Li L, Schipper D, Seynhaeve AL, Rhoon GC. et al. Cationic Thermosensitive Liposomes: A Novel Dual Targeted Heat-Triggered Drug Delivery Approach for Endothelial and Tumor Cells. Nano letters. 2012
52. Smith BR, Cheng Z, De A, Koh AL, Sinclair R, Gambhir SS. Real-time intravital imaging of RGD-quantum dot binding to luminal endothelium in mouse tumor neovasculature. Nano letters. 2008;8:2599-606
53. Kong G, Braun RD, Dewhirst MW. Hyperthermia enables tumor-specific nanoparticle delivery: effect of particle size. Cancer Res. 2000;60:4440-5
54. Li L, ten Hagen TL, Bolkestein M, Gasselhuber A, Yatvin J, van Rhoon GC. et al. Improved intratumoral nanoparticle extravasation and penetration by mild hyperthermia. Journal of controlled release: official journal of the Controlled Release Society. 2013;167:130-7
55. Chen JJ, Fu SY, Chiang CS, Hong JH, Yeh CK. Characterization of tumor vasculature distributions in central and peripheral regions based on Doppler ultrasound. Medical physics. 2012;39:7490-8
56. Yardeni T, Eckhaus M, Morris HD, Huizing M, Hoogstraten-Miller S. Retro-orbital injections in mice. Lab animal. 2011;40:155-60
57. Vaupel P. The role of hypoxia-induced factors in tumor progression. The oncologist. 2004;9(Suppl 5):10-7
58. Yeh CK, Lu SY, Chen YS. Microcirculation volumetric flow assessment using high-resolution, contrast-assisted images. IEEE transactions on ultrasonics, ferroelectrics, and frequency control. 2008;55:74-83
59. Chen JJ, Chen JJ, Chiang CS, Hong JH, Yeh CK. Assessment of tumor vasculature for diagnostic and therapeutic applications in a mouse model in vivo using 25-MHz power Doppler imaging. Ultrasonics. 2011;51:925-31
60. Lin CY, Tseng HC, Shiu HR, Wu MF, Chou CY, Lin WL. Ultrasound sonication with microbubbles disrupts blood vessels and enhances tumor treatments of anticancer nanodrug. International journal of nanomedicine. 2012;7:2143-52
61. Huang P, You X, Pan M, Li S, Zhang Y, Zhao Y. et al. A novel therapeutic strategy using ultrasound mediated microbubbles destruction to treat colon cancer in a mouse model. Cancer letters. 2013;335:183-90
62. Fischer AH, Jacobson KA, Rose J, Zeller R. Hematoxylin and eosin staining of tissue and cell sections. CSH protocols. 2008;2008:pdb prot4986
63. Raymond SB, Skoch J, Hynynen K, Bacskai BJ. Multiphoton imaging of ultrasound/Optison mediated cerebrovascular effects in vivo. Journal of cerebral blood flow and metabolism: official journal of the International Society of Cerebral Blood Flow and Metabolism. 2007;27:393-403
64. Fan CH, Ting CY, Chang YC, Wei KC, Liu HL, Yeh CK. Drug-loaded bubbles with matched focused ultrasound excitation for concurrent blood-brain barrier opening and brain-tumor drug delivery. Acta biomaterialia. 2015;15:89-101
65. Carr ME, Hardin CL. Fibrin Has Larger Pores When Formed in the Presence of Erythrocytes. Am J Physiol. 1987;253:H1069-H73
66. Prentice P, Cuschierp A, Dholakia K, Prausnitz M, Campbell P. Membrane disruption by optically controlled microbubble cavitation. Nat Phys. 2005;1:107-10
67. Caskey CF, Stieger SM, Qin S, Dayton PA, Ferrara KW. Direct observations of ultrasound microbubble contrast agent interaction with the microvessel wall. The Journal of the Acoustical Society of America. 2007;122:1191-200
68. Bunte RM, Ansaloni S, Sehgal CM, Lee WM, Wood AK. Histopathological observations of the antivascular effects of physiotherapy ultrasound on a murine neoplasm. Ultrasound in medicine & biology. 2006;32:453-61
69. ter Haar G. Safety and bio-effects of ultrasound contrast agents. Medical & biological engineering & computing. 2009;47:893-900
70. Lake RA, Robinson BW. Immunotherapy and chemotherapy-a practical partnership. Nature reviews Cancer. 2005;5:397-405
71. Nowak AK, Robinson BWS, Lake RA. Synergy between chemotherapy and immunotherapy in the treatment of established murine solid tumors. Cancer Research. 2003;63:4490-6
72. Oosterhof GO, Cornel EB, Smits GA, Debruyne FM, Schalken JA. Influence of high-intensity focused ultrasound on the development of metastases. European urology. 1997;32:91-5
73. Wu F, Wang ZB, Jin CB, Zhang JP, Chen WZ, Bai J. et al. Circulating tumor cells in patients with solid malignancy treated by high-intensity focused ultrasound. Ultrasound in medicine & biology. 2004;30:511-7
Author contact
![]() Corresponding author: Department of Biomedical Engineering and Environmental Sciences, National Tsing Hua University, No. 101, Section 2, Kuang-Fu Road, Hsinchu, Taiwan 30013, Tel: +886-3-571-5131 ext. 34240; Fax: +886-3-571-8649 (C.-K. Yeh). E-mail address: ckyehnthu.edu.tw (C.-K. Yeh)
Corresponding author: Department of Biomedical Engineering and Environmental Sciences, National Tsing Hua University, No. 101, Section 2, Kuang-Fu Road, Hsinchu, Taiwan 30013, Tel: +886-3-571-5131 ext. 34240; Fax: +886-3-571-8649 (C.-K. Yeh). E-mail address: ckyehnthu.edu.tw (C.-K. Yeh)