Impact Factor
- Issue 14; 2026
- Issue 13; 2026
- Issue 12; 2026
- Issue 11; 2026
- Issue 10; 2026
- Volume 16; 2026
- Advance Articles
- Past Issues
- Cover Images
- Cover Suggestion
- Index & Coverage
- Special Issues
Introduction
Materials and methods
Results and analysis
Discussions and conclusion
Supplementary Material
Acknowledgements
References
International Journal of Biological Sciences
International Journal of Medical Sciences
 Global reach, higher impact

Theranostics 2016; 6(4):446-455. doi:10.7150/thno.13518 This issue Cite
Research Paper
Reparable Cell Sonoporation in Suspension: Theranostic Potential of Microbubble
S. Moosavi Nejad1,2*, Hamid Hosseini2* ![]() , Hidenori Akiyama2, Katsuro Tachibana1
, Hidenori Akiyama2, Katsuro Tachibana1
1. Department of Anatomy, School of Medicine, Fukuoka University, Fukuoka 814-0180, Japan;
2. Bioelectrics Department, Institute of Pulsed Power Science, Kumamoto University, Kumamoto 860-8555, Japan.
*both first authors contributed equally to this work.
Received 2015-8-10; Accepted 2015-12-31; Published 2016-2-3
Abstract

The conjunction of low intensity ultrasound and encapsulated microbubbles can alter the permeability of cell membrane, offering a promising theranostic technique for non-invasive gene/drug delivery. Despite its great potential, the biophysical mechanisms of the delivery at the cellular level remains poorly understood. Here, the first direct high-speed micro-photographic images of human lymphoma cell and microbubble interaction dynamics are provided in a completely free suspension environment without any boundary parameter defect. Our real-time images and theoretical analyses prove that the negative divergence side of the microbubble's dipole microstreaming locally pulls the cell membrane, causing transient local protrusion of 2.5 µm in the cell membrane. The linear oscillation of microbubble caused microstreaming well below the inertial cavitation threshold, and imposed 35.3 Pa shear stress on the membrane, promoting an area strain of 0.12%, less than the membrane critical areal strain to cause cell rupture. Positive transfected cells with pEGFP-N1 confirm that the interaction causes membrane poration without cell disruption. The results show that the overstretched cell membrane causes reparable submicron pore formation, providing primary evidence of low amplitude (0.12 MPa at 0.834 MHz) ultrasound sonoporation mechanism.
Keywords: Reparable sonoporation, Low amplitude ultrasound, Dipole microstreaming, Cell suspension.
Introduction
Ultrasound (US) is known as a controllable source of acoustic energy for non-invasive medical procedures. US alone or combined with contrast agent microbubbles offers wide-spread applicability, ranging from well-established diagnostic tools to adjunctive therapeutic methods. Microbubble-assisted drug delivery has especially gained attention as a newly emerging therapy in recent years [1-4]. Extensive acoustical and optical studies of microbubble behavior have shown a wide range of non-thermal mechanical bio-effects on cells; such as cell killing and apoptosis [5-7], or deformation of micro-vessel walls [8,9]. It has been suggested that nonlinear oscillation of microbubbles or inertial cavitation under high acoustic pressures (>0.5 MPa) caused these phenomenon. However, at lower amplitudes (0.1-0.5 MPa) microbubbles can only temporarily disrupt the cell membrane structure with minimum cytotoxicity [10-12], offering an interesting theranostic technique.
In view of future clinical applications, the main challenge exists in observing the dynamic cell membrane behavior during the interaction, particularly in the low US pressure range (0.1-0.5 MPa). Real-time visualization of the transient interaction between linearly oscillating microbubbles and cell membrane in a free-floating setup is essential in understanding the biophysical mechanism that causes sonoporation. Meanwhile, in a contact-free system, constant movements of bubbles and cells make it difficult to capture focused images of the interaction. To compensate for this problem, in-vitro experimental setups have been designed using a cultured monolayer on a rigid surface to immobilize the cells [13-15]. This observation set-up, however, produces wall related artifacts to enhance microstreaming near the cells and microbubbles. Furthermore, any direct contact of the cells to a fixed surface can change the physical composition of the cell membrane and its supportive cytoskeleton (CSK) [16, 17].
In a previous study, we introduced an in-vitro method utilizing capillary-microgripping system to hold the cell for observing the cell-microbubble interaction under a microscope [18]. The system had an advantage that the cells were not on a rigid surface, however, fixing of the cell interfered with the interaction dynamics and the sonoporation mechanism could not be understood.
In this study, in order to clarify mechanism of the reparable sonoporation, we utilized a high speed microphotography system in a contact free suspension of cells and microbubbles to capture real-time images of the interaction between an oscillating microbubble and the cell membrane. This observation setup provided a more mechano-physiologically relevant environment for capturing clear images, while eliminating unwanted artificial factors. Real-time observation of cell-microbubble interaction is used to bridge the acoustic streaming [19-21] to cell membrane response, leading to a better understanding of low amplitude US sonoporation phenomena. Here, we show that the microbubble and the cell velocities, local pulling of the negative divergence side of the dipole microstreaming, and the elastic response of the cell membrane, contribute to transient sono-permeabilization.
Materials and methods
Cell culture
Human lymphoma cells (U937, Japanese Cancer Research Resources Bank) were cultured in RPMI-1640 medium (Wako Ltd., Osaka, Japan) supplemented with 10% Fetal Bovine Serum (FBS, Sigma-Aldrich, MO, USA) maintained at 37°C in a humidified atmosphere with 5% CO2. Immediately before the experiment, collected U937 cells were washed with Phosphate Buffered Saline (PBS; Gibco, NY, USA) and then re-suspended in RPMI/ FBS. U937 cell line, a widely used in-vitro model in biomedical research, is a suitable model to study the behavior and differentiation of sono-transfected hematopoietic cells, both cancerous and normal.
Microbubbles
To retain clinical relevance, SonazoidTM US contrast agent (Daiichi-Sankyo, Tokyo, Japan) was used in this study. Sonazoid is an eco-contrast lipid-stabilized suspension of perfluorobutane microbubbles with medium size diameter range of 2-3 µm (median diameter of about 2.6 µm) [22] and has steady-state fragmentation threshold of 0.15 MPa at 1.1 MHz [23]. The Sonazoid batch was reconstituted with 2 ml of water and then further diluted with 2 ml of PBS resulting in 4 ml of microbubbles suspension with 0.6 x 10⁹ microbubbles/ml ± 5% [22].
Experimental setup
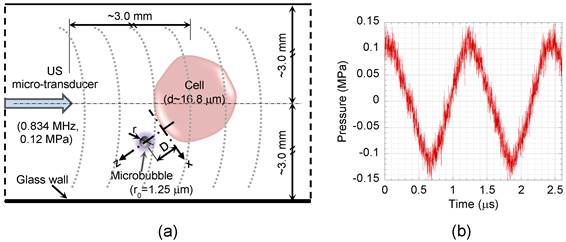
The experimental setup consisted of a micro-transducer accommodated into a drill-retaining hole in a 35 mm glass-bottom dish (Matsunami Glass Ind., Osaka, Japan) by means of a joystick micromanipulator (Narishige, Tokyo, Japan), permitting accurate alignment of the transducer in horizontal and vertical planes, 3 mm away from bottom (glass wall) interface. To avoid reflection, the test section wall opposite the transducer was covered with an acoustic absorber rubber. The experimental setup is shown in supplementary material Fig. S1. The chamber was filled with 10 ml suspended U937 cells (1×10⁶ cell/ml) in RPMI containing 1 ml of the diluted Sonazoid microbubbles solution. A schematic diagram of the test section is shown in Fig. 1a. High speed time-resolved images of the cell-microbubble interaction were recorded with 1 μs exposure and 200 μs inter-frame time by a high-speed camera (up to 200,000 fps rate, 100 ns inter-frame time in double exposure mode) (Motion ProX4, RedLake Co., FL, USA). The camera was integrated with a Leica DMI3000B inverted microscope (Leica Microsystems Co., Wetzlar, Germany), and was synchronized (DG 535 delay generator, Stanford Research System, Inc., USA) with the ultrasound exposure.
Schematic diagram of the test section. (a) Cell suspension was exposed to US, while suspended microbubbles could freely interact with the cells. (b) Pressure profile of the US applied to the cell suspension at 3 mm distance away from the micro-transducer with 0.12 MPa peak rarefaction pressure at 0.834 MHz. D, distance between bubble and cell; r, bubble radius; x and z, tangential and perpendicular directions relative to the cell membrane.
Ultrasound exposure
The US field was produced using a custom-made 1-mm diameter single element piezoceramic micro-transducer driven by a compact generator (Sonopore 4000, NepaGene, Japan). A 10 Hz burst and 50 % duty cycle was adjusted to provide sufficient ultrasound exposure time (50 ms) for a complete microbubble/cell interaction, while minimizing ultrasound exposure. The transducer generates peak rarefaction pressures of 0.07 to 0.12 MPa (60-80 V) at 0.834 MHz, with a short near-field far-field distance (ZR) of 0.14 mm. The Z=3 mm axial distance was chosen to ensure a uniform ultrasound field (Z≫ZR). The acoustic pressure field was measured by a PVDF needle hydrophone (Müller Ingenieurtechnik, Germany), which has a 0.5 mm diameter pressure sensitive area, rise time of 40 ns, and high sensitivity of 1.22 mV/bar. The needle hydrophone was calibrated with a fiber optic probe hydrophone (100 μm diameter and 3 ns rise time) (FOPH 2000, RP acoustics, Germany). Bubble oscillation amplitude and resonant frequency are important factors to prevent early rupture of the microbubble's shell [23] and consequently increase their life span in order to elevate sonoporation efficiency. Therefore, to generate low mechanical index (MI) off-resonant oscillation, 0.12 MPa peak rarefaction US at 0.834 MHz was adjusted for this experiment (MI=0.13 MPa.MHz-1/2). Figure 1b shows pressure history of US waves applied to the cell suspension at Z=3 mm, the location used for the real time imaging during the experiments.
Gene transfection
A non-viral mammalian type plasmid vector, pEGFP-N1 (Clontech, Takara Bio, Ohtsu, Japan) was used to express EGFP in the cells as a transfection marker. pEGFP-N1 (10 µg/ml) were added to 10 ml of the three groups, control (sham-treated), ultrasound, and ultrasound/microbubble treated cell suspensions. Treated cells were washed, incubated, and observed after 24 and 48 hours. Fluorescence microphotographs of the treated cells were compared with the control sample using a CCD camera (Evolve® 128 EMCCD, Photometrics, USA) connected to a phase contrast microscope (Leica Microsystems, Tokyo, Japan).
Particle image tracing
Particle image analysis was performed using 1 μm diameter micro-beads (Polysciences, Inc., USA) with 1.3x10⁹ beads/ml concentration. The micro-beads have a density of 1.05 g.cm-3, the same density as the cells and the medium, while they have about 40% higher acoustic impedance compared to the cells (longitudinal sound speed 2,320 m.s-1). The micro-beads were added to 10 ml of RPMI medium with or without 1 ml of the Sonazoid microbubbles. Fluid velocities in suspensions with or without the microbubbles were measured and compared by tracing images of the micro-beads in the real-time visualizations.
Cell surface plot
Surface plots of the cell surfaces were drawn based on captured high-speed real-time images of the cells in suspensions, using PM Capture-Pro version 6.0 image analyzing software (QImaging Co., BC, Canada). Modification of the cell geometry and its membrane deformation were measured before, during, and after interaction with a microbubble by comparing measured parameters in their respected surface plots.
Results and analysis
Particle image tracing
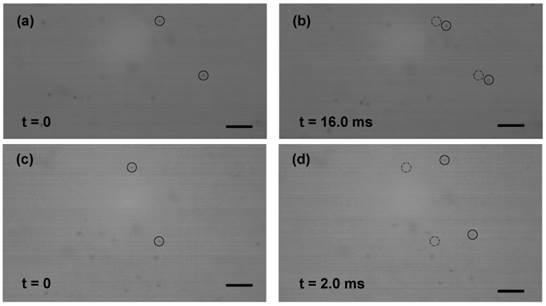
In order to determine the effect of streaming generated by US transducer, particle image analyses of 1 μm diameter poly-beads were performed. A velocity of 0.26 mm.s-1 was obtained for suspension (without microbubble) insonated with 0.12 MPa peak rarefaction pressure at 0.834 MHz (Fig. 2a-b). The very low velocity referred to a weak and negligible streaming generated by the US exposure alone. In the presence of Sonazoid microbubbles, however, velocity of the micro-beads increased to 7.9 mm.s-1, due to the enhanced microstreaming caused by the oscillating microbubbles (Fig. 2c-d).
Selected frames of time-resolved visualization of micro-beads (1 μm dia.) motion. The suspensions were exposed to US (0.12 MPa at 0.834 MHz) from left side of the images. (a-b) Without microbubbles, the micro-beads had a low velocity of 0.26 mm.s-1 (4.2 μm displacement after 16.0 ms). (c-d) With microbubbles, enhanced fluid (micro-beads) motion with 7.9 mm.s-1 velocity was observed (15.8 μm after 2.0 ms). Initial positions of the beads are marked with dashed circles in frames (b) and (d). (Scale bar: 10 µm).
High speed real-time imaging
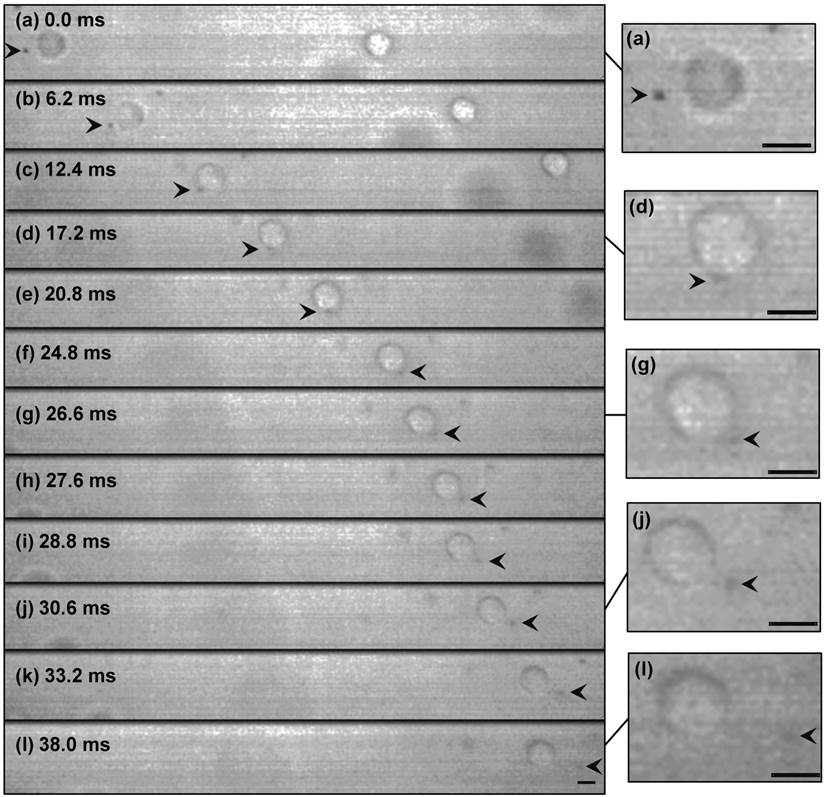
Figure 3 shows selected real-time images of interaction between a single encapsulated microbubble (r0=1.25 μm) and a single cell (Rcell=8.4 μm) insonated with US pressure of 0.12 MPa at 0.834 MHz. Here, the cell had a velocity of 7.7 mm.s-1 (Fig. 3a-b), nearly the same as the flow velocity obtained from the particle image tracing in the presence of microbubbles. Meanwhile, the microbubble had higher velocity of 9.6 mm.s-1 (1.9 mm.s-1 relative velocity compared to the cell), due to US radiation force imposed to its gas content. In Fig. 3c, as the microbubble approached at close proximity of the cell, it caused the original spherical shape of the cell deformed to an oval shape. At t=24.8 ms, a local protrusion of the cell membrane appeared adjacent to the microbubble, reaching its maximum at t=30.6 ms. During the bubble-cell interaction, from t=12.4 ms to t=24.8 ms (Fig. 3c-f), cell velocity was temporarily increased by the microbubble to 9.1 mm.s-1. At the later time t=33.2 ms, the microbubble was repelled from the cell with the same relative velocity of 1.9 mm.s-1. Based on US radiation force theory [24-26], in simplified equilibrium conditions [27, 28], a radiation force of 0.04 nN for the microbubble was calculated, giving an estimated bubble relative velocity of 1.7 mm.s-1 in suspension, which was in agreement with the experiment. The membrane protrusion retracted back with no sign of membrane rupture at t=38.0 ms (Fig. 3l), when the microbubble was at about 19.5 μm distance from the cell.
High-speed real-time images of cell-microbubble interaction. Cell membrane was pulled outward but not ruptured as the microbubble repelled from the cell. The membrane gradually retracted back after the interaction. The suspension was exposed to US (0.12 MPa at 0.834 MHz) from left side of the images. The dark object (arrowed) is a 1.25 µm-radius Sonazoid bubble whose oscillation amplitude is too small to be seen here. Timing in milliseconds relative to the appearance of the bubble in the cell proximity is indicated on each frame. Image (l) at t=38 ms was shifted 25 μm to the left to show the cell and the microbubble. Magnified images are shown at the right side (refer to the online version for higher magnification). (Scale bars: 10 µm).
The observation was repeated three times; the velocities, interaction duration, and cell deformations were nearly the same for all observations. The average measurement results are shown in Fig. 5. The experiments were also performed with a microbubble attached to the cell membrane and sonicated with the same US parameters. In this case as shown in supplementary material Fig. S2, interestingly, the cell and the adhered microbubble moved together (8.1 mm.s‑1 velocity); the microbubble remained attached to the cell membrane without producing any local cell deformation/evagination.
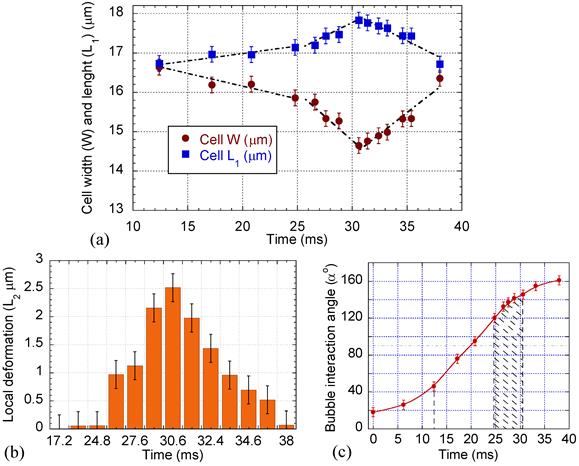
Cell deformation, local membrane evagination, and microbubble interaction angle variation with time. (a) Cell width, W, and length, L1. (b) Cell local membrane elongation, L2. (c) Interaction angle α; significant cell deformation and local evagination occurred during the cell pulling (post 90o) between 120o to 145o angles.
Theoretical analysis of microbubble oscillation and microstreaming
Equations of bubble oscillation near rigid and viscoelastic walls were considered [19, 29-31], with additional loss term due to shell surface viscosity and shell restoring force owing to the shell stiffness of encapsulated microbubble [32] (details are given in supplementary material).
The cell medium's physical properties and Sonazoid's lipid-stabilized shell and gas properties [33] (please refer to supplementary material for detail), under acoustic pressure amplitude Pac=0.12 MPa and frequency f=0.834 MHz, were used to calculate oscillation amplitude ε0 and natural frequency f0 of the microbubble. In the vicinity of the cell (D=r0, Fig. 1), microbubble natural frequency f0W=4.44 MHz and oscillation amplitude ε0W=85 nm were obtained. At a far distance from the cell (D≫r0), where the cell wall had negligible effect on the microbubble free oscillation, the natural frequency f0∞=5.44 MHz and oscillation amplitude ε0∞=84 nm were estimated. The effect of cell membrane viscoelastic behaviour was taken into account, using modified equations described by Doinikov et al. [31] and mechanical properties of U937 cell in suspension; average viscosity of 608 Pa.s, initial elastic modulus of 898 Pa, initial shear modulus of 323 Pa, and Poisson's ratio of 0.39±0.14 [34]. The cell's density and acoustic impedance were nearly the same as the medium. Applying these conditions to the 1.25 μm microbubble close to the 16.7 μm U937 cell (D=r0) allowed us to calculate microbubble's natural frequency near the cell membrane as f0EW=5.79 MHz and oscillation amplitude ε0EW=83.6 nm. While the differences between oscillation amplitudes of the three models were small (less than 2%), the unbounded medium and elastic wall assumptions predicted higher natural frequencies. The low amplitude (ε0 / r0 ≈0.07) and off-resonant oscillation (f / f0 ≈0.14) assured the microbubble's linear oscillation without causing any shell rupture.
The bubble-streaming Reynolds number [35, 36] of the insonation protocol (Rebs=0.013) was considerably small, verifying that the microstreaming was a Stokes flow [35]. The theoretical viscous Rayleigh-Nyborg-Westervelt steady streaming for superposition of bubble volume (ε) and translational (ε') oscillations for a free moving bubble was calculated by Longuet-Higgins [37] (ε≈ε' for small oscillations). The maximum tangential streaming velocity (u) can be estimated [37]:
(1)
where ε is dimensionless oscillation amplitude ε=ε0/r0=0.07 and ω is angular frequency ω=2πf. For the microbubble near the cell (elastic boundary) u = 29.6 mm.s-1 was obtained. Microstreaming had a sharp velocity drop across the boundary layer with thickness δ of 0.62 μm (δ= (2μ/ωρ)1/2) [29]. These values and the cell velocity gave a theoretical evaluation of the maximum rate of strain as Gmax≈35.3×10³ s-1. Therefore, the maximum shear stress (Smax) applied to the cell by microstreaming (Smax=μGmax) was 35.3 Pa.
Cell surface plot and time variation of the cell dimension
Surface plots of the cell were drawn to compare the cell membrane before and after microbubble interaction. The surface plots were produced by creating a three-dimensional representation of the image intensity taken by the high speed camera. Figure 4 shows a sample wireframe-style surface plot showing the cell membrane at its maximum evagination. Cell diameters in parallel (W) and perpendicular (L1) to the direction of the bubble/cell interaction, as well as local cell membrane protrusion (L2), were measured using the PM Capture-Pro image analysing software. Time variation of the cell geometry, its membrane and the microbubble interaction angle are plotted in Fig. 5, based on the averaged data obtained from the surface plots. During the initial stage, the cell deformation rate was 0.06 μm.ms-1, while it sharply increased to 0.2 μm.ms-1 during the bubble pulling (Fig. 5a). The cell elongation reached its maximum as the bubble was repelled from the cell membrane. With increasing microbubble distance from the cell, the cell geometry gradually retracted back to its original spherical shape with an average rate of 0.23 μm.ms-1.
Wireframe style surface plot of the cell membrane deformation representing Fig. 3j, at t=30.6 ms. W, cell width; L1, cell length; L2, cell membrane local evagination. (Scale bar: 10 µm).
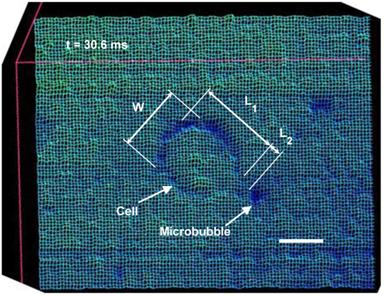
The membrane protrusion (Fig. 5b) immediately adjacent to the microbubble was stretched out with evagination rate of 0.43 μm.ms-1. It reached its maximum value of 2.5 μm with base diameter (B, Fig. 6) of 2 μm, afterward gradually receded back with response rate of 0.33 μm.ms-1.
Schematic diagrams representing sequences of microbubble/cell interaction under low amplitude (0.12 MPa) US. (a) Microbubble moving toward the cell. (b) Microbubble repelling from the cell. Dashed lines with arrows show microstreaming. d, initial cell diameter; W and L1, cell width and length; L2 and B, length and base diameter of the cell membrane local evagination; r, microbubble radius; S, off-axis distance; α, angle between US direction and bubble/cell center line.
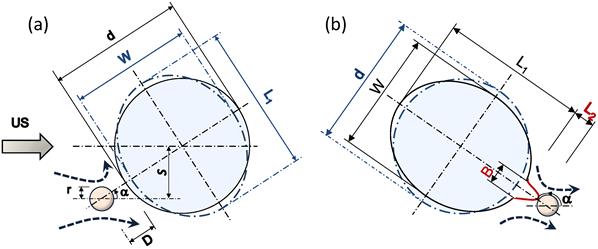
Figure 6 shows a schematic diagram illustrating mechanisms of the sonoporation under low-amplitude US. As the microbubble approached the cell, the membrane curvature caused an asymmetry in the flow field in front of the microbubble. This flow asymmetry increased the angle α between the microbubble and the cell (Figs. 5c and 6). A symmetrical α=0o path would not result in a stable interaction; a small perturbation near the stagnation point would shift the bubble to either side of the symmetrical axis.
Interaction consisted of two stages depending on whether the microbubble relative motion was toward or away from the cell. During the initial period (α < 90o, Fig. 6a) the streaming flow field had a positive divergence effect [38] and the microbubble behaved as a source to drive the medium toward the cell. At this stage, the microstreaming drive the medium toward the cell. The microstreaming shear stress exerted sufficient tension on the cell to deform the cell geometry. The maximum tension (τmax) in the cell membrane was calculated τmax = µGmaxRcell = 0.29 mN.m-1. During the first stage, the cell's CSK network was able to transmit the mechanical deformation globally throughout the network [39] rather than being exclusively focused on the membrane bilayer. However, during the second stage (α > 90o, Fig. 6b), the microbubble's streaming had a negative divergence acting as a sink to draw the medium outward, pulling the cell membrane. Significant cell membrane modification occurred at post 90o angles, between 120o to 145o. At this stage, asymmetry in the flow shear stress caused the angle α to increase. Further raise of α increased flow symmetry to intensify local pulling shear effects of the flow and produced a local membrane protrusion. This local membrane evagination caused the higher cell geometrical deformation rate observed between 25 ms to 31 ms in Fig. 5a. At the end of interaction, with the increased microbubble distance and the reduced shear stress, the biological response of the cell dominated to retract the membrane back to its original position. Therefore, a microbubble approach toward the cell with off-axis s less than the cell's radius Rcell (s < Rcell in Fig. 6; in other words passage with 0o < |α| < 90o) would result in sonoporation.
The above reparable sonoporation mechanism explains our previous observations [18, 40] and interprets microstreaming (seen in Fig. 3) over alternative options (prevailing in Fig. S2, supplementary material), e.g., sound scattering or thermal heating by microbubbles, to cause local cell deformation/evagination.
The maximum microstreaming shear stress (35.3 Pa) applied to the cell during the interaction was higher than the threshold shear stress of 12 Pa determined experimentally for reparable sonoporation [41]. Considering the cell area expansion modulus, the cell membrane stretched by an area strain of ΔA/A=0.12%, less than the membrane critical areal strain of 2% to 5% to cause cell rupture [39].
The sizes of microbubbles are polydispersed. The microbubble size (r0) has direct effect on its natural frequency as shown in supplementary material Eq. (S2), oscillation amplitude (Eq. S1), streaming velocity, and streaming shear stress. A larger microbubble would have a lower natural frequency, a higher oscillation amplitude, and under the same US field would produce higher streaming velocity and shear stress (vice-versa for smaller bubbles). Therefore, the size dispersion should be considered for a tuned outcome. For Sonazoid microbubbles, the size distribution is well defined in a narrow mono-modal peak, determined by Coulter counting [22].
The same order of shear stress would be expected for similar types of phospholipid-shelled contrast agent microbubbles (e.g., Definity, Sonovue).
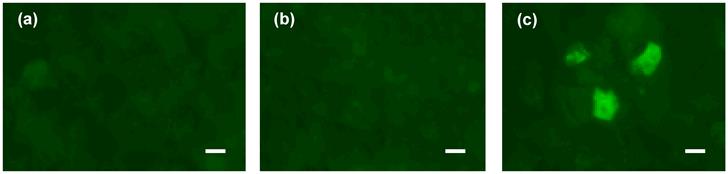
The ultrasound mediated gene transfection was examined 24 hours after the exposure. Images of the cells from three groups of control (sham-treated), ultrasound, and ultrasound/microbubble treated are shown in Fig. 7. Sonicated cells suspended with microbubbles showed positive expression of EGFP protein, while no intracellular delivery was observed either in the untreated control cells or the sonicated cells with US alone. These results confirm that transient increase in the cell membrane permeability occurred only in the presence of the microbubbles. They also verify that cell membranes were not permanently damaged after interaction with microbubbles under low amplitude (0.12 MPa) US.
Gene transfection under 0.12 MPa amplitude US. Expression of EGFP in three groups of cells: (a) control cells, (b) US exposure only, (c) US/microbubble combination. (Scale bar: 10 µm).
Discussions and conclusion
In this in-vitro experiment, we visualized the sequence of events in which shear stress of the microbubble microstreaming was transmitted to the cell membrane, leading to non-lethal sonoporation. Our direct observation is consistent with previous report [42] that the presence of microbubbles would intensify the ultrasound effect on the cell membrane.
The high-speed images, suggest two possible scenarios by which the repelling microbubble might have altered the membrane structure. In one, the pulling shear stress during close contact with the microbubble may have resulted in depolymerization of actin microfilaments in the cell cortex, a specialized layer of cell CSK on the inner face of the plasma membrane that functions as a mechanical support of the cell membrane. This could be followed by decoupling of the lipid bilayer from the underlying CSK and generation of membrane bleb or blebs. Depend on the extent of damage in the membrane, though, this could cause irreversible cell damage. Thus, a more likely scenario might involve the membrane protrusion maintaining its interaction with the CSK (Fig. 8). Consistent with the second theory, any bleb formation was not observed. However, this would not rule out the possibility of delayed blebbing due to local defects in the CSK. Also despite its large base size, the protrusion was gradually retracted back after the decline in the shear stress. Dense network of short actin filaments in the cell cortex could develop subtle micro-damage in their structure during protrusion [43].
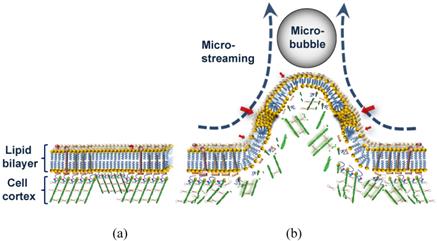
Schematic diagram of sonoporation mechanism with low amplitude (<0.15 MPa) US. (a) Cell membrane before the interaction. (b) Overstretched lipid bilayer with submicro/nano pores (red arrows) and damaged underlying cell cortex during the microstreaming shear stress pulling of the membrane.
Microbubbles and US can be used to trigger leakage from liposomes consisting of only a lipid bilayer membrane, which possess no CSK [20, 44]. However, the ability of CSK to stretch outward with the microstreaming while supporting the membrane is of extreme importance for the cell viability. This flexibility can be seen only when the time is long enough to give the CSK possibility to react to the shear stress.
An overstretched lipid bilayer and a damaged underlying CSK can together explain the mechanism of pore formation in the bilayer during mechanical pulling (Fig. 8). Transfection of the plasmid pEGFP-N1 vector of 4,700 base pair (bp) by molecules sized about 230 nm indicates a large submicron pore formation (Fig. 7). In our experiment, the morphological effects of the microbubble interaction happened on a millisecond time scale; whereas the nonlinear/inertial cavitation required a microsecond time scale to rupture the cell membrane with a high speed micro-jet [5] of or to distend and invaginate the blood vessel wall [8]. A significantly longer time for the shear stress to exert its effect might have given the cell enough time to respond to the force with its supportive cortical CSK system, preventing irreversible damage to the cell membrane, as seen here. Since the pores or spaces between the bilayer components require time to completely seal, and since the CSK would be reorganized within seconds after the damage [45], transfection might have continued even after the membrane retracted back to its original position. Such a case would indicate treated bilayer containing pre-formed pores can be used as a vulnerable structure for microstreaming to enhance sono-permeability rate and elevate the efficiency of gene/drug delivery.
Detailed characteristics of the cell membrane respond proposed here may have use in in-vitro technologies for insertion of transgenes into both cancerous and normal cells (e.g., adult mesenchymal stem cells and mature hematopoietic cells). However, with the exception of blood tissue, it is unlikely that bubbles will translate through solid tissues in the interstitial spaces, which would be a limitation for this technique.
Here, we have shown the effect of the cell/microbubble relative velocities, the impact of changes in the streaming velocity field divergence, the effect of the cell curvature resulting in flow asymmetry, and the importance of dynamic elastic response of the cell membrane, all contribute to sono-permeability outcomes. The results provide detailed characteristics of physical processes and profound effects of biological factors in leading to low-amplitude (0.12 MPa) US sonoporation. A detailed investigation of the sonoporation process involving both physical (e.g., US amplitude, variable microbubble properties) and biological parameters would be necessary to establish a guideline for optimizing the interaction dynamics to achieve higher transfection rate.
Supplementary Material
Supplementary Figure S1: A schematic diagram of the experimental set up. Supplementary Figure S2: High-speed real-time images of a U937 cell with an 1.25 µm-radius Sonazoid microbubble attached to its membrane (arrowed) and exposed to US (0.12 MPa at 0.834 MHz) from left side of the images.Supplementary Equations and Analysis: including supplementary equations S1 and S2, and the cell medium and the Sonazoid encapsulated microbubble physical properties.
Acknowledgements
This work was supported in part by Grant-in-Aid for Scientific Research from the Ministry of Education, Culture, Sports, Science and Technology of Japan (18200036, 313) and (24540539).
Competing Interests
The authors have declared that no competing interest exists.
References
1. Bao S, Thrall BD, Miller DL. Transfection of a reporter plasmid into cultured cells by sonoporation in vitro. Ultrasound Med Biol. 1997;23:953-959
2. Greenleaf WJ, Bolander ME, Sarkar G. et al. Artificial cavitation nuclei significantly enhance acoustically induced cell transfection. Ultrasound Med Biol. 1998;24:587-595
3. Tachibana K, Uchida T, Ogawa K. et al. Induction of cell-membrane porosity by ultrasound. Lancet. 1999;353:1409
4. Mehier-Humbert S, Bettinger T, Yan F. et al. Plasma membrane poration induced by ultrasound exposure: implication for drug delivery. J Control Release. 2005;104:213-222
5. Prentice P, Cuschieri A, Dholakia K. et al. Membrane disruption by optically controlled microbubble cavitation. Nat Phys. 2005;1:107-110
6. Williams AR. Ultrasound: Biological effects and potential hazards. London, UK: Academic Press. 1983
7. Rooney JA. Hemolysis near an ultrasonically pulsating gas bubble. Science. 1970;169:869-871
8. Chen H, Kreider W, Brayman AA. et al. Blood vessel deformations on microsecond time scales by ultrasonic cavitation. Phys Rev Lett. 2011;106:034301
9. Chen H, Brayman AA, Evan AP. et al. Preliminary observations on the spatial correlation between short-burst microbubble oscillations and vascular bioeffects. Ultrasound Med Bio. 2012;38:2151-62
10. Hwang JH, Brayman AA, Reidy MA. et al. Vascular effects induced by combined 1-MHz ultrasound and microbubble contrast agent treatments in vivo. Ultrasound Med Biol. 2005;31:553-564
11. Juffermans LJ, Kamp O, Dijkmans PA. et al. Low-intensity ultrasound-exposed microbubbles provoke local hyperpolarization of the cell membrane via activation of BK(Ca) channels. Ultrasound Med Biol. 2008;34:502-508
12. Fan L, Liu Y, Ying H. et al. Increasing of blood-tumor barrier permeability through paracellular pathway by low-frequency ultrasound irradiation in vitro. J Mol Neurosci. 2011;43:541-548
13. Garbin V, Cojoc D, Ferrari E. et al. Changes in microbubble dynamics near a boundary revealed by combined optical micromanipulation and high-speed imaging. Appl Phys Lett. 2007;90:114103
14. Zhao S, Ferrara KW, Dayton PA. Asymmetric oscillation of adherent targeted ultrasound contrast agents. Appl Phys Lett. 2005;87:134103
15. Fan Z, Liu H, Mayer M. et al. Spatiotemporally controlled single cell sonoporation. Proc Natl Acad Sci USA. 2012;109:16486-91
16. Radmacher M, Fritz M, Kacher CM. et al. Measuring the viscoelastic properties of human platelets with the AFM. Biophys J. 1996;70:556-567
17. Discher DE, Mohandas N, Evans EA. Molecular maps of red cell deformation: hidden elasticity and in situ connection. Science. 1994;266:1032-35
18. Moosavi Nejad S, Hosseini SHR, Akiyama H. et al. Optical observation of cell sonoporation with low intensity ultrasound. Biochem Biophys Res Commun. 2011;413:218-223
19. Lewin PA, Bjorno L. Acoustically induced shear stresses in the vicinity of microbubbles in tissue. J Acoust Soc Am. 1982;71:728-734
20. Marmottant P, Hilgenfeldt S. Controlled vesicle deformation and lysis by single oscillating bubbles. Nature. 2003;423:153-156
21. Krasovitski B, Kimmel E. Shear stress induced by a gas bubble pulsating in an ultrasonic field near a wall. IEEE Trans Ultrason Ferroelectr Freq Control. 2004;51:973-979
22. Sontum PC. Physicochemical characteristics of sonazoid™, a new contrast agent for ultrasound imaging. Ultrasound Med Biol. 2008;34:824-833
23. Chen WS, Matula TJ, Brayman AA. A comparison of the fragmentation thresholds and inertial cavitation doses of different ultrasound contrast agents. J Acoust Soc Am. 2003;113:643-651
24. Leighton TG. The acoustic bubble. London, UK: Academic Press. 1994
25. Dayton P, Allen J, Ferrara K. The magnitude of radiation force on ultrasound contrast agents. J Acoust Soc Am. 2002;112:2183-92
26. Vos HJ, Guidi F, Boni E. et al. Method for microbubble characterization using primary radiation force. IEEE Trans Ultrason Ferroelectr Freq Control. 2007;54:1333-45
27. Zhao S, Borden M, Bloch SH. Radiation force assisted targeting facilitates ultrasonic molecular imaging. Mol Imaging. 2004;3:135-148
28. Palanchon P, Tortoli P, Bouakaz A. Optical observations of acoustical radiation force effects on individual air bubbles. IEEE Trans Ultrason Ferroelectr Freq Control. 2005;52:104-110
29. Nyborg WL. Acoustic streaming near a boundary. J Acoust Soc Am. 1958;30:329-339
30. Doinikov AA, Bouakaz A. Theoretical investigation of shear stress generated by a contrast microbubble on the cell membrane as a mechanism for sonoporation. J Acoust Soc Am. 2010;128:11-19
31. Doinikov AA, Aired L, Bouakaz A. Acoustic scattering from a contrast agent microbubble near an elastic wall of finite thickness. Phys Med Biol. 2011;56:6951-67
32. de Jong N, Cornet R, Lancèe CT. Higher harmonics of vibrating gas-filled microspheres. Part one: Simulations. Ultrasonics. 1994;32:447-453
33. Sarkar K, Shi WT, Chatterjee D. et al. Characterization of ultrasound contrast microbubbles using in vitro experiments and viscous and viscoelastic interface models for encapsulation. J Acoust Soc Am. 2005;118:539-550
34. MacQueen LA, Buschmann MD, Wertheimer MR. Mechanical properties of mammalian cells in suspension measured by electro-deformation. J Micromech Microeng. 2010;20:065007
35. Lighthill SL. Acoustic streaming. J Sound Vib. 1978;61:391-418
36. Davidson BJ, Riley N. Cavitation microstreaming. J Sound Vib. 1971;15:217-233
37. Longuet-Higgins MS. Viscous streaming from an oscillating spherical bubble. Proc R Soc Lond A. 1998;454:725-742
38. Collis J, Manasseh R, Liovic P. et al. Cavitation microstreaming and stress fields creating by microbubbles. Ultrasonics. 2010;50:273-279
39. Boal D. Mechanics of the Cell. Cambridge, UK: Cambridge University Press. 2002
40. Lentacker I, De Cock I, Deckers R. et al. Understanding ultrasound induced sonoporation: Definitions and underlying mechanisms. Adv Drug Deliv Rev. 2014;72:49-64
41. Wu J, Ross JP, Chiu JF. Reparable sonoporation generated by microstreaming. J Acoust Soc Am. 2002;111:1460-64
42. Tran TA, Roger S, Le Guennec JY. et al. Effect of ultrasound-activated microbubbles on the cell electrophysiological properties. Ultrasound Med Biol. 2007;33:158-163
43. Moosavi Nejad S, Hosseini SHR, Satoh M. et al. Shock wave induced cytoskeletal and morphological deformations in human renal carcinoma cells. Cancer Sci. 2006;97:296-304
44. Wrenn SP, Dicker SM, Small EF. et al. Bursting Bubbles and Bilayers. Theranostics. 2012;2:1140-59
45. Leontiadou H, Mark AE, Marrink SJ. Molecular dynamics simulations of hydrophilic pores in lipid bilayers. Biophys J. 2004;86:2156-2164
Author contact
![]() Corresponding author: Hamid Hosseini: Bioelectrics Department, Institute of Pulsed Power Science, Kumamoto University, Kumamoto 860-8555, Japan. Tel +81-96-342-3963; Fax +81-96-342-3818; Email: hosseiniac.jp URL: http://www.ipps.kumamoto-u.ac.jp/English/index.html.
Corresponding author: Hamid Hosseini: Bioelectrics Department, Institute of Pulsed Power Science, Kumamoto University, Kumamoto 860-8555, Japan. Tel +81-96-342-3963; Fax +81-96-342-3818; Email: hosseiniac.jp URL: http://www.ipps.kumamoto-u.ac.jp/English/index.html.