Impact Factor
 Global reach, higher impact
Theranostics 2016; 6(8):1075-1084. doi:10.7150/thno.13842 This issue Cite
Research Paper
High Precision Imaging of Microscopic Spread of Glioblastoma with a Targeted Ultrasensitive SERRS Molecular Imaging Probe
Ruimin Huang1*, Stefan Harmsen1*, Jason M. Samii1, Hazem Karabeber1, Kenneth L. Pitter2, Eric C. Holland3, Moritz F. Kircher1,4,5,6 ![]()
1. Department of Radiology, Memorial Sloan Kettering Cancer Center, New York, NY 10065, USA;
2. Cancer Biology and Genetics Program, Memorial Sloan Kettering Cancer Center, New York, NY 10065, USA;
3. Human Biology, and Solid Tumor and Translational Research, Fred Hutchinson Cancer Research Center, Alvord Brain Tumor Center, University of Washington, Seattle, WA 98109, USA;
4. Brain Tumor Center, Memorial Sloan Kettering Cancer Center, New York, NY 10065, USA;
5. Center for Molecular Imaging and Nanotechnology (CMINT), Memorial Sloan Kettering Cancer Center, New York, NY 10065, USA;
6. Department of Radiology, Weill Cornell Medical College, New York, NY 10065, USA.
*These authors contributed equally to this work
Received 2015-9-13; Accepted 2016-2-2; Published 2016-5-7
Abstract

The dismal prognosis of patients with malignant brain tumors such as glioblastoma multiforme (GBM) is attributed mostly to their diffuse growth pattern and early microscopic tumor spread to distant regions of the brain. Because the microscopic tumor foci cannot be visualized with current imaging modalities, it remains impossible to direct treatments optimally. Here we explored the ability of integrin-targeted surface-enhanced resonance Raman spectroscopy (SERRS) nanoparticles to depict the true tumor extent in a GBM mouse model that closely mimics the pathology in humans. The recently developed SERRS-nanoparticles have a sensitivity of detection in the femtomolar range. An RGD-peptide-conjugated version for integrin-targeting (RGD-SERRS) was compared directly to its non-targeted RAD-SERRS control in the same mice via Raman multiplexing. Pre-blocking with RGD peptide before injection of RGD-SERRS nanoparticles was used to verify the specificity of integrin-targeting. In contrast to the current belief that the enhanced permeability and retention (EPR) effect results in a baseline uptake of nanoparticles regardless of their surface chemistry, integrin-targeting was shown to be highly specific, with markedly lower accumulation after pre-blocking. While the non-targeted SERRS particles enabled delineation of the main tumor, the RGD-SERRS nanoparticles afforded a major improvement in visualization of the true extent and the diffuse margins of the main tumor. This included the detection of unexpected tumor areas distant to the main tumor, tracks of migrating cells of 2-3 cells in diameter, and even isolated distant tumor cell clusters of less than 5 cells. This Raman spectroscopy-based nanoparticle-imaging technology holds promise to allow high precision visualization of the true extent of malignant brain tumors.
Keywords: SERRS molecular imaging, Raman spectroscopy, Image-guided surgery, Neurosurgery, Brain tumor treatment.
Introduction
High grade gliomas, in particular GBMs (= grade IV astrocytoma), are still considered universally fatal [1], with an average mean survival of 12-15 months after diagnosis [2, 3]. Surgery remains a mainstay in the treatment of GBMs. Tumor resections have shown to improve patient survival [4-6], and the extent of resection of both primary and recurrent GBMs directly correlates with the length of survival [5, 7, 8]. Studies examining the patterns of GBM recurrence have shown 80-90% of recurrences to occur near the original resection margins, suggesting residual tumor cells due to incomplete resection as the cause [9, 10]. In the other cases, recurrences occur at distant sites in the brain because of microscopic locoregional tumor spread. Extensive attempts with multiple different modalities have been made to determine the true extent of tumor spread. Several studies have suggested that magnetic resonance imaging (MRI) using FLAIR or diffusion-weighted sequences could enable imaging of microscopic tumor infiltrations [11, 12]. However, the tumor borders as assessed by pre-operative MRI are often incongruent with those during surgery because of brain shift during the procedure [13, 14]. Intra-operative MRI is limited by several factors such as the inability to achieve microscopic resolution, inaccuracies due to false-positive contrast enhancement [15], or the necessity for frequent administrations of gadolinium contrast agents [16]. In addition, small molecule Gd-agents are known to disperse from the initial area of tumor enhancement into the peritumoral zone of edema over time, therefore causing inaccuracies in estimating the true tumor borders [17]. Ultrasound has the advantage of providing real-time imaging and has been reported to improve patient outcome [18, 19] but cannot visualize microscopic cancer. Several optical methods have been explored, either based on intrinsic tissue properties [20-22] or by using exogenous contrast agents [13, 23-26]. However, these optical techniques are often limited by small fields of view (microscopy), decreased specificity due to autofluorescence, or rapid photobleaching [27, 28].
Given these difficulties, neurosurgeons currently remain hindered in achieving complete resections that, in principle, could be possible in non-eloquent areas if a high precision detection method was available. Thus, there is an unmet need for an imaging method that can reveal the true microscopic extent of tumor spread.
We recently developed ultrasensitive nanoparticle imaging probes that rely on the effect of 'surface-enhanced resonance Raman spectroscopy' (SERRS) [29-31]. In gliomas, the most common type of brain tumors, a subset of integrin receptors, such as αvβ3, is highly expressed on the tumor vasculature, angiogenic endothelial cells, and tumor cells [26, 32]. Overexpression of integrin αvβ3 was demonstrated in the state-of-the-art RCAS-PDGF/N-tva transgenic mouse model of GBM [26], which presents with all the histopathological and imaging hallmarks of human high-grade tumors, such as infiltrating tumor margins, microvascular proliferation and pseudopalisading necrosis [33]. In this study we investigated whether integrin-targeting of SERRS nanoparticles enables accurate delineation of the infiltrating tumor margins and subtle microscopic metastatic lesions of glioblastoma in the recapitulative RCAS-PDGF/N-tva mouse model.
Materials and Methods
Materials
Unless otherwise noted, all chemicals were obtained from Sigma Aldrich (St Louis, MO). The cyclic RGDyK and RADyK peptides were purchased from AnaSpec (Fremont, CA).
SERRS nanoparticle synthesis
SERRS nanoparticles were synthesized as previously described [29, 30]. In brief, 60-nm gold nanospheres were synthesized by rapid addition of 7.5 mL 1% (w/v) sodium citrate tribasic dihydrate to a 1 L boiling aqueous gold chloride (HAuCl4; 0.25 mM) solution. Gold nanostars were synthesized by rapid addition of 10 ml 20 mM HAuCl4 to 1.0 L ice-cold 40 mM ascorbic acid. The as-synthesized gold nanoparticles were collected by centrifugation and dialyzed (MWCO 3.5 kDa). The dialyzed gold nanoparticle dispersion (360 μL; 2.0 nM) was added to 3.5 mL absolute ethanol containing 53 μL 28% (v/v) ammonium hydroxide, 106 μL 99.999% tetraethyl orthosilicate (TEOS), and 7 μL of 25 mM resonant Raman reporter in N,N-dimethylformamide, which constituted either IR792 perchlorate (IR792) or IR780 perchlorate (IR780) for the nanospheres and nanostars, respectively. After 25 minutes, the as-synthesized SERRS nanoparticles were washed with ethanol, and redispersed in 1.0 mL ethanol containing 5% (v/v) (3-mercaptopropyl)trimethoxysilane (MPTMS) and heated at 70 oC for 2 hours. The sulfhydryl-modified SERRS nanoparticles were collected by centrifugation and washed first with ethanol and then water.
Integrin-targeted SERRS nanoparticle synthesis
The heterobifunctional linker, poly(ethylene glycol) (N-hydroxy-succinimide 5-pentanoate) ether N'-(3-maleimidopropionyl)aminoethane (NHS-PEG4k-Mal) was was reacted for 30 minutes with cRGDyK or cRADyK in a 1:1 molar ratio after which the sulfhydryl-modified SERRS nanoparticles 'IR792' or sulfhydryl-modified SERRS nanoparticles 'IR780' were added to cRGDyK-PEG4k-Mal or cRADyK-PEG4k-Mal in a 10 mM 2-(N-morpholino)ethanesulfonic acid (MES buffer pH 7.1), respectively. After 2 hours, 0.5 μL 50% (v/v) hydroxylamine was added to quench any remaining unreacted N-hydroxy-succinimide functional groups. The integrin-targeted cyclic RGDyK-conjugated SERRS (RGD-SERRS) nanoparticles and non-targeted control cyclic RADyK-conjugated SERRS (RAD-SERRS) nanoparticles were washed with water and redispersed in 0.22-μm filter sterilized 10 mM MES buffer (pH 7.3) at a final concentration of 3.5 nM.
Integrin-targeted SERRS nanoparticle characterization
For characterization by electron microscopy, samples of the RGD-SERRS and RAD-SERRS nanoparticles were deposited on carbon film-coated copper grids (300 Mesh, Electron Microscopy Sciences) and air-dried. Images were typically acquired at magnification factors ranging from 25,000× to 500,000× using a JEOL 1200EX (JEOL USA, Inc.) transmission electron microscope operating at 80 kV. The concentration and size distribution of the SERRS nanoparticles were determined by nanoparticle tracking analysis (NTA; NanoSight NS500; Malvern Instruments Inc.; Westborough, MA). SERRS signal intensity of 1.0 nM SERRS nanoparticle dispersion was measured on a Renishaw inVia Raman microscopy system (Renishaw, Hoffman Estates, IL) at 50-μW laser power, 785 nm laser wavelength, 1.0-s acquisition time, and a 5× objective.
Animals
All animal experiments have been approved by the Institutional Animal Care and Use Committees of Memorial Sloan Kettering Cancer Center (#06-07-011).
The somatic gene transfer system RCAS/tv-a was used to generate the glioblastoma-bearing mice [34-37]. Briefly, the 4-8 week-old Nestin-tv-a/Ink4a-arf-/-/Ptenfl/fl mice were stereotactically injected with 4×10⁴ DF1 cells transfected with RCAS-Pdgfb and RCAS-Cre (1:1 mixture, 1 µL) into the brain, coordinates bregma 1.7 mm (anterior), 0.5 mm (right), and depth 2.5 mm from the dural surface. The genetic aberrations including overexpression of oncogene Pdgfb and loss of tumor suppressor genes (Ink4a-arf and Pten) led to near complete penetrance of glioblastoma within 2 months. Tumor incidence and size were determined by weekly MRI scans (Bruker Biospin Corp., Billerica, MA) starting four weeks after DF-1 cell injection [38].
Raman imaging and signal quantification
All Raman scans were performed on an InVia Raman microscope (Renishaw) equipped with a piezo-controlled stage for micron-resolved spatial mapping, a 300-mW 785-nm diode laser and a 1-inch CCD detector with a spectral resolution of 1.07 cm-1. The SERRS spectra were collected through a 5× or 20× objective (Leica). Laser output at the microscope objective was measured with a handheld laser power meter (Edmund Optics, Inc.) and determined to be 100 mW at the microscope objective. Typically, in vivo and ex vivo Raman scans were performed at 10-100 mW laser power, which is below the safety requirement for clinical application [39], 1.5 s acquisition time, using the StreamLineTM high-speed acquisition mode. All Raman images were acquired and analyzed under the same conditions, including the same laser power, Raman integration times (per pixel), focal plane (same objective lens), and a threshold setting of 0.1. Subsequently, Raman images were analyzed using Metamorph Microscopy Automation and Image Analysis software (Molecular Devices, Sunnyvale, CA) image processing software. Regions of interests were defined by histology and photographs of the brain tissue slices. SERRS intensities were then measured within all regions of the tissue, along with tumor area measurements to allow for normalization of intensity values between tissue samples. Intensity of SERRS signal in areas outside of the tissue regions were used to set thresholds, which were set at 0.1 such that intensity levels corresponding to areas surrounding the tissue were considered to be noise. The mean signal and standard deviations of different experimental groups were calculated. A Student's t-test (two-tailed, unpaired) was performed and the level of significance was set at p < 0.05.
Multiplexed Raman imaging in GBM-bearing mice
Prior to injection, 75 μL of 3.5 nM RGD-SERRS (IR792) nanoparticles and 75 μL of 3.5 nM RAD-SERRS (IR780) nanoparticles were mixed. This mixture was then injected intravenously via tail vein. After 18-24 hours, the GBM-bearing animals were sacrificed by CO2 asphyxiation and brains were harvested, fixed in 4% paraformaldehyde to prevent autolytic decomposition of the brain tissue, and kept at 4 °C overnight. Raman imaging was performed on the fixed brain and/or on paraffin-embedded coronal brain sections instead of in live mice in order to achieve the highest possible precision in correlating the Raman signal with the histological information. The Raman spectra of the RGD-SERRS and non-targeted RAD-SERRS nanoparticles (i.e. IR792 and IR780 Raman spectrum, respectively) were unmixed by a direct classical least squares (DCLS) algorithm that is embedded in the Wire 3.4 Raman imaging software (Renishaw). After deconvolution of the two Raman flavors, Raman images were generated using identical parameters for both RGD- and RAD-SERRS nanoparticles.
Histology
Intact GBM-bearing brains were sliced coronally (1 mm slice thickness) and embedded in paraffin. 5 μm-thick continuous sections were cut for hematoxylin and eosin (H&E) staining and immunohistochemistry (IHC) staining, followed by high-resolution Raman imaging on paraffin blocks. IHC staining was performed on the Discovery XT biomarker platform (Ventana, Tucson, AZ) as previously described [30]. Antibodies for OLIG2 (1:300, AB9610, Millipore, Temecula, CA), polyethylene glycol (1:100, ab51257, Abcam, Cambridge, MA), ITGB3 (1:100, 13166, Cell Signaling, Danvers, MA), ITGAV (1:2000, ab76609, Abcam), HA-tag (1:200, 11867423001, Roche, San Francisco, CA), IBA1 (1:600, 019-19741, Wako, Richmond, VA), NOS3 (1:200, 610296, BD Biosciences, Franklin Lakes, NJ) and ACTA2 (1:350, M0851, DAKO, Carpinteria, CA) were used as the primary antibodies. The slides were digitally scanned with Pannoramic Flash (3DHistech, Hungary) and relevant tissue areas were exported into tiff format. Quantification of Olig2 was performed using ImageJ/FIJI (NIH). Color deconvolution algorithm was used to determine the area of positive signal, which was normalized to tissue area.
Results
Generation and characterization of integrin-targeted and non-targeted control SERRS nanoparticles
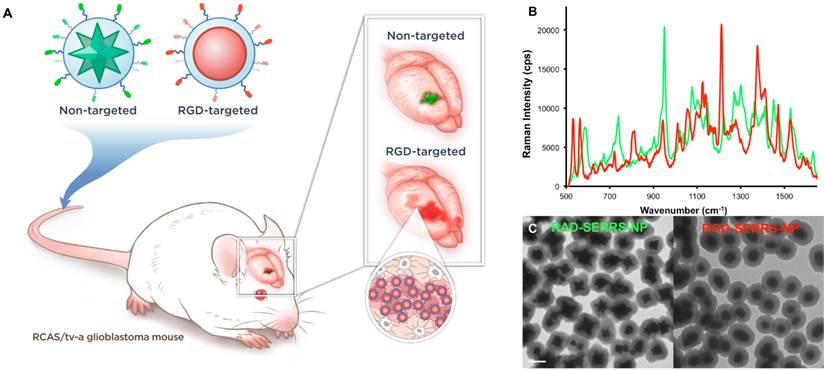
Integrin-targeted RGD-SERRS nanoparticles were synthesized by conjugating cyclic RGDyK (RGD) via the ε-amino group of the lysine to the sulfhydryl functional groups on silica-coated SERRS nanospheres via a heterobifunctional polyethylene glycol linker (4000 Da; PEG4k) (flavor 1; IR792). In a similar manner, non-targeted control RAD-SERRS nanoparticles were generated by conjugating cyclic RADyK (RAD) to silica-coated SERRS nanostars (flavor 2; IR780 perchlorate) (Figure 1A). Both RGD-SERRS and RAD-SERRS nanoparticles were characterized by Raman spectroscopy, nanoparticle tracking analysis and transmission electron microscopy (Figure 1B, C). Equimolar amounts of the RGD-SERRS and RAD-SERRS nanoparticles, which have similar limits of detection (i.e. 10-15 M, [29, 30]) generated similar SERRS signal intensity (~20,000 cps) for the most intense peak of each dye , i.e. 950 cm-1 for the RAD-SERRS (green) and 1200 cm-1 for the RGD-SERRS (red). In addition, the distinct Raman fingerprints of the RAD- and RGD-SERRS nanoparticles allowed multiplexed detection (Figure 1B). Nanoparticle tracking analysis demonstrated a similar hydrodynamic radius of ~140 nm for both SERRS nanoparticle versions. RGD-SERRS and RAD-SERRS nanoparticle can also be distinguished by TEM due to the difference in their gold core geometry (Figure 1C).
Concept and characterization of integrin-targeted SERRS-Nanoprobes. A. Conceptual figure outlining integrin-based detection and delineation of glioblastoma with cRGDyK-conjugated SERRS nanoparticles. Using a single excitation wavelength, SERRS nanoparticles with different Raman-active substances emit complex spectra that act as a molecular fingerprint enabling multiplexing. This allows for the detection of co-injected non-targeted and integrin-targeted nanoparticles simultaneously within the same animal and imaging of their in vivo homing using multiplexed Raman imaging. Due to the enhanced permeability and retention (EPR) effect of the GBMs, accumulation of the non-targeted RAD-SERRS nanoparticles (green) was limited to the bulk tumor, while the RGD-SERRS probe (red) could be detected in both tumor bulk and the infiltrating tumor cells by targeting overexpressed integrin receptors. B. SERRS spectra of the RGD-SERRS nanoparticles (red) and the non-targeted control RAD-SERRS nanoparticles (green). As shown, equimolar amounts of both nanoparticles generate similar SERRS signal intensities (50-μW laser power, 1.0-s acquisition time, 5× objective), and have several distinct spectral peaks which allow precise spectral unmixing. C. The two nanoparticle types can also be distinguished by electron microscopy due to their different gold core geometry. Transmission electron micrographs (TEM) of RAD-SERRS nanoparticles (left image) and RGD-SERRS nanoparticles (right image). Scale bar = 100 nm.
Specificity of integrin-targeted SERRS nanoparticle-guided glioblastoma detection
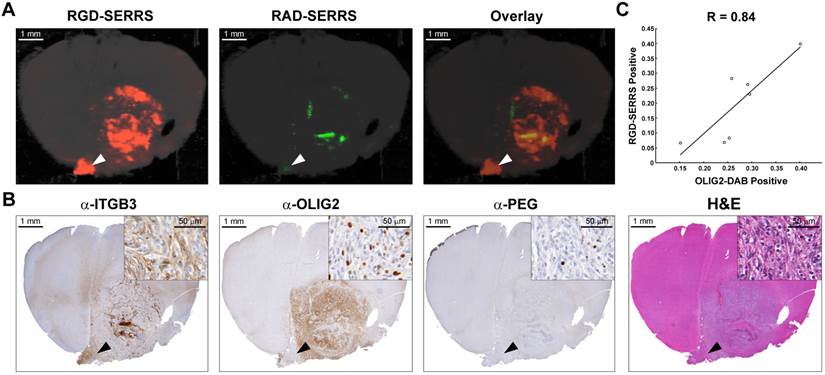
To determine the targeting specificity of the integrin-targeted RGD-SERRS nanoparticles, an equimolar dose (13 fmol/g) of RGD-SERRS and non-targeted RAD-SERRS nanoparticles was co-injected via tail vein in RCAS-Pdgfb/N-tva GBM-bearing mice (n=7) [40]. In order to preserve the brain tissue architecture and prevent autolytic decomposition, multiplexed Raman imaging was performed on paraformaldehyde-fixed coronal brain sections. Raman images of RGD-SERRS and RAD-SERRS from a representative GBM-bearing brain slice were shown in Figure 2A. SERRS intensities of RGD-SERRS and RAD-SERRS from the healthy brains and tumors (normalized by the area of interest) were quantified, respectively. Significantly elevated RGD-SERRS signal intensity was noted in tumors (24.3±11.8 counts/pixel; n=7, p<0.01). Interestingly, RGD-SERRS nanoparticles, but not RAD-SERRS, were detected in an area separate from the bulk tumor in the contralateral hemisphere (white arrowheads in Figure 2A). Strong positive expression of integrin β3 (ITGB3) but weak expression of OLIG2 were observed in this separate tumor focus, indicating that overexpressed integrins, including integrin β3, were specifically targeted by the RGD-SERRS (black arrowheads in Figure 2B). The ratio of RGD-SERRS to RAD-SERRS in tumors was 188.8±58.4. Raman images of RGD-SERRS and RAD-SERRS from injected GBM-bearing brain slices were correlated with OLIG2-expression, a protein that is highly overexpressed in the tumor cells of the applied model (n=7, Figure 2C; [41]). A strong positive Pearson correlation was found for RGD-SERRS and OLIG2 immunostaining (R=0.84, p<0.05) in the analyzed sections. Together, these results suggest that the RGD-SERRS nanoparticles preferentially accumulated due to the intratumoral overexpression of αvβ3 integrins.
Integrin-targeted SERRS nanoparticles enable the detection of bulk and infiltrative glioblastomas. A. GBM-bearing animals were co-injected with equimolar amounts of RGD-SERRS (targeted; red) and RAD-SERRS (non-targeted; green) nanoparticles. Multiplexed Raman imaging was performed on a coronal brain section (thickness 1 mm) in a paraffin block generated from a representative GBM-bearing mouse. Both RGD-SERRS (red) and RAD-SERRS (green) nanoparticles were detected in the bulk tumor located in the right hemisphere (OLIG2-positive). RGD-SERRS nanoparticles outlined the true tumor extent markedly better than the RAD-SERRS nanoparticles. Notably, RGD-SERRS nanoparticles also accumulated in an unexpected area in the contralateral hemisphere (white arrow heads). B. Sequential sections cut from the Raman-imaged paraffin block processed with H&E and immunohistochemistry staining for integrin β3 (α-ITGB3, target of the RGD-SERRS nanoparticles), OLIG2 (α-OLIG2), and polyethylene glycol linker (α-PEG, nanoparticle presence), respectively. The RGD-SERRS positive focus (black arrow heads) was shown to express OLIG2 in the contralateral hemisphere and co-expressed high levels of integrins, such as integrin β3 (ITGB3). C. Pearson correlation analysis of the RGD-SERRS positive areas and OLIG-2 staining (n=7) was performed and a strong correlation (R=0.84) was found.
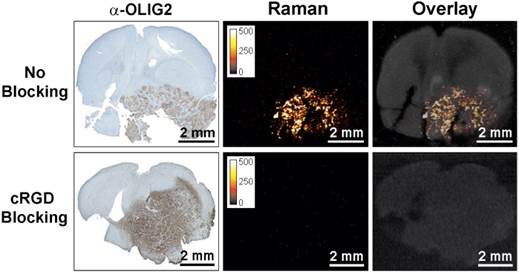
To further confirm integrin-targeting of the RGD-SERRS nanoparticles, an in vivo blocking study was performed in which cRGDyK peptide (1.0 nmol/g) was injected into a separate cohort of GBM-bearing mice (n=5) 30 minutes prior to the RGD-SERRS nanoparticle injection (26 fmol/g). As shown in Figure 3, the mean value of RGD-SERRS signal intensity of tumor tissues in the blocking group was 3.6±3.3×10⁻³ counts/pixel, which was significantly lower than that in the non-blocking group (24.3±11.8 counts/pixel) (p<0.01) when identical imaging and data analysis conditions were applied.
Specificity of integrin-targeting of RGD-SERRS nanoparticles. Pre-blocking of integrins was established by injection of an excess (1.0 nmol/g) of cRGDyK (cRGD) peptide 30 minutes prior to injection of the RGD-SERRS nanoparticles via tail vein. Raman imaging of coronal brain sections (thickness 1 mm) in paraffin blocks showed that the excess cRGDyK peptide significantly reduced the SERRS signal intensity of RGD-SERRS nanoparticles in glioblastomas (lower panels).
Integrin-targeted SERRS nanoparticles enable detection of microscopic tumor invasion beyond the borders of the main tumor
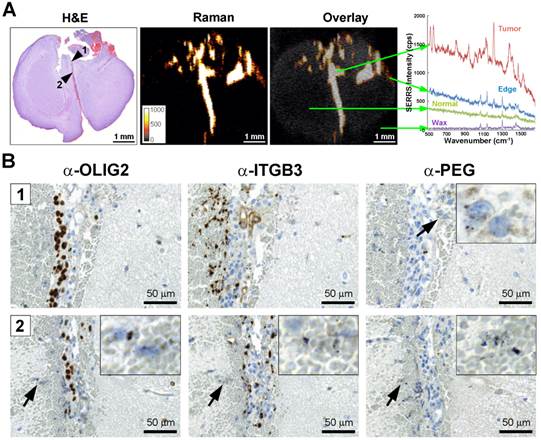
GBMs are aggressive and locally invasive tumors. GBM cells preferentially invade along the preexisting tissue elements via surface, perineuronal, perivascular, and intrafascicular growth [42]. In a representative GBM-bearing mouse that was injected intravenously with RGD-SERRS nanoparticles (26 fmol/g), strong SERRS signals were detected within the bulk tumor in the upper right cerebrum, but not in normal contralateral brain tissue, with a fine delineation of the actual tumor margin confirmed by H&E staining (Figure 4A). RGD-SERRS signal was also detected along the medial septum (arrowhead 1), which was infiltrated by GBM cells (OLIG2-positive) and other ITGB3-overexpressing cells. Anti-polyethylene glycol (PEG) immunostaining, which stains for the PEG-linker on the RGD-SERRS nanoparticle surface, confirmed the presence of RGD-SERRS nanoparticles in areas with high integrin β3 (ITGB3) expression (Figure 4B, upper panels). Furthermore, in the “infiltration front” of GBM cells penetrating into normal brain, presence of RGD-SERRS nanoparticles (PEG-positive) was demonstrated adjacent to ITGB3- and OLIG2-positive cells (arrowhead in lower panels, Figure 4B). This ability to delineate the true tumor extent (diffuse borders, microscopic tumor extensions) was observed in all five mice.
Integrin-targeted SERRS nanoparticles enable the detection of microscopic tracts of tumor cell migration through the brain. A. SERRS signal in a paraffin-embedded coronal brain section (1-mm thickness) after i.v. injection of RGD-SERRS nanoparticles (26 fmol/g) in a GBM-bearing mouse. High SERRS signal intensity was detected along the midline between the two hemispheres. Right panel: SERRS spectra from tumor bulk, tumor edge, normal brain and paraffin (Wax). Notice that the pronounced 1200 cm-1 peak of the RGD-SERRS-NP is only present in the tumor bulk and tumor edge, while it was not detected in the normal brain tissue. B. Immunohistochemistry analysis of two regions along the midline. Upper panels (region indicated by arrowhead 1 in A): OLIG2 staining confirmed tumor cell invasion along the midline. Interestingly, integrin β3-positive cells were mostly adjacent to the OLIG2-positive cells. Lower panels (region indicated by arrowhead 2 in A): The RGD-SERRS nanoparticles accurately outlined the linear microscopic (2-3 cells in diameter) tumor infiltration, extending from the superiorly located bulk tumor all the way into the inferior areas of the brain. Insets, high magnification of the regions indicated by black arrows (4-fold magnification).
Integrin-targeted SERRS nanoparticles enable identification of very small locoregional metastases with microscopic precision
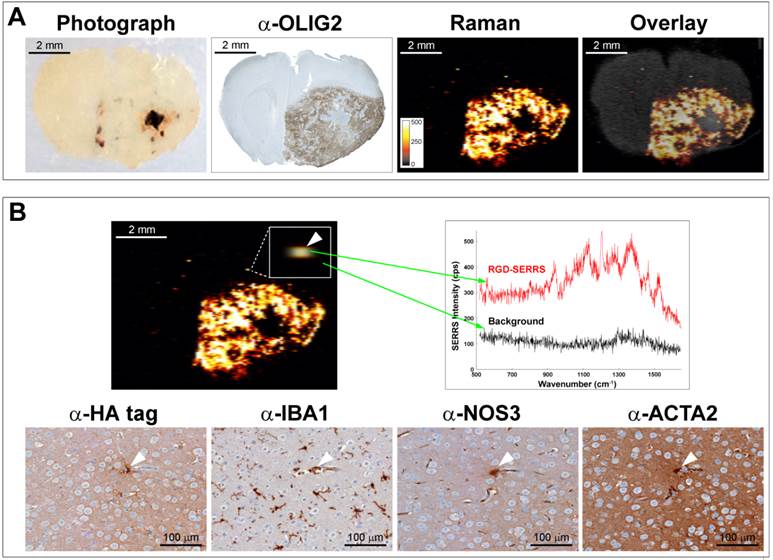
As exemplified in a different animal (Figure 5), RGD-SERRS nanoparticle-based Raman imaging enabled accurate delineation of the bulk tumor located in the right hemisphere (Figure 5A). However, more importantly, a microscopic SERRS-positive focus (Figure 5B, upper panel, left) located at a distance of ~350 μm from the bulk tumor was identified by Raman imaging. The spectral analysis of this pixel proved the presence of the unique Raman fingerprint of RGD-SERRS nanoparticles (Figure 5B, upper right). Corresponding adjacent sections from this tissue block were analyzed with immunohistochemistry staining of protein markers for tumor cells (α-HA tag), microglia cells (α-IBA1), endothelial cells (α-NOS3), and pericytes (α-ACTA2), which indeed identified this microscopic locoregional focus (~15 μm) as a small cluster of cells, including a GBM cell, a microglial cell, an endothelial cell and a pericyte (Figure 5B, lower panels). This corresponds well with observations that GBM cells tend to invade individually or in small groups in between the dense network of neuronal and glial cell processes, and thus give rise to multifocal locoregional gliomas [43].
Integrin-targeted SERRS nanoparticles enable detection of microscopic satellite foci. A. Photograph, OLIG2 staining and Raman image of a paraffin-embedded coronal brain section from a GBM-bearing mouse that was injected with RGD-SERRS nanoparticles (26 fmol/g) intravenously. Note the high degree of correlation between the α-OLIG2 staining and the SERRS signal. Also note the presence of SERRS positive pixels outside of the bulk tumor margins. B. Histological evaluation of one of the SERRS-positive pixels outside of the bulk tumor margins (arrowhead in box shows magnification) demonstrated that the RGD-SERRS nanoparticles allowed the detection of a micrometastatic tumor focus (HA-tag positive) accompanied by a microglial cell (IBA1), an endothelial cell (NOS3) and a pericyte (ACTA2).
Collectively, integrin-targeted RGD-SERRS nanoparticle-based Raman imaging enabled accurate delineation of the actual extent of the tumor and the detection of locoregional satellite tumor foci, microscopic extensions invading across the entire brain, and even isolated GBM cells on their migratory paths.
Discussion
In this work, we used a targeted version of our recently developed SERRS-nanoprobes [30], which have femtomolar sensitivity and enable high precision imaging of a universally fatal brain tumor type. The SERRS-nanoprobes are orders-of-magnitude brighter than previous non-resonant SERS probes [13]. To our knowledge, this is the first report of a targeted SERRS nanoprobe enabling brain tumor imaging in vivo. Our goal was to enable visualization of the true microscopic extent of GBMs. We used the genetically engineered RCAS-Pdgfb-driven/tv-a [34] murine model to test these probes in vivo, because this tumor model is considered to most closely recapitulate the human GBM development and biology. In order to prevent autolytic decomposition of the GBM-bearing mouse brains and to achieve the highest possible accuracy in correlating the SERRS data with the histological data, we performed ex vivo Raman imaging studies on paraformaldehyde-fixed specimens of GBM-bearing animals that were injected with the nanoprobes 18-24 hours prior to sacrificing and subsequent tissue processing.
We found that the SERRS images of the integrin-targeted SERRS nanoprobes correlate well with the actual extent of the microscopic spread of the GBM as indicated by immunohistochemistry correlation. This included the typical diffuse spread at the margins of the bulk tumor, and importantly, the microscopic extensions of migrating cells throughout the brain. Surprisingly, even isolated tumor cell clusters as small as a few cells could be imaged. The homing of the RGD-SERRS nanoparticles proved to be highly specific, as shown by the marked decrease of SERRS signal after pre-blocking with RGDyK peptide. This provides interesting insights into how to achieve high specificity of targeting with nanoparticles. To date, there is an ongoing debate on whether active targeting of nanoprobes by incorporating target-specific moieties such as antibodies, affibodies, peptides, or small molecules to the nanoprobe surfaces [44] is more effective than solely relying on the 'enhanced permeability and retention' (EPR) effect. In our previous work, using the U87MG and TS543 orthotopic models, we have observed that the EPR effect alone can be an effective mechanism for tumor-directed delivery of nanoparticles [30]. However, in the genetically engineered tumor model employed in the current study, we observed that the addition of a targeting peptide increased the specific accumulation of the nanoprobe to the expressed target and significantly changed the intratumoral distribution compared to an otherwise identical non-targeted nanoparticle.
It is not intuitive that pre-blocking with cRGDyK peptide would decrease the accumulation of the RGD-targeted nanoprobe to the degree we have observed. One would expect that after blocking of its designated target, RGD-SERRS would still accumulate to a substantial degree in the tumor via the EPR effect. Interestingly, our results are consistent with several other reports that demonstrated that pre-blocking of integrin by free cRGDyK-peptide significantly decreased the accumulation of cRGDyK-targeted nanoparticles at the tumor site [45, 46]. In a previous study we showed that integrin β3 was predominantly overexpressed on tumor endothelial cells, along with a lower and more heterogeneous expression on the tumor cells in the same glioblastoma mouse model [26]. This might, at least in part, explain the major effect of RGD pre-blocking observed in this study. While cyclic RGD-peptides are known to inhibit avb3-integrin signaling, thereby displaying long-term anti-angiogenic effects and blood-vessel normalization, short-term effects of integrin inhibition on tumor blood vessel integrity and its effect on RGD-targeted nanoparticle accumulation are less well studied and remain to be explored.
While we have demonstrated that integrin-targeting significantly improved the accumulation of SERRS nanoparticles in GBM in the RCAS/tv-a model, this PDGF driven brain tumor is characteristic of approximately 25-30% of human GBMs. Therefore, further studies are needed to determine whether RGD-SERRS nanoparticles also enable accurate tumor delineation in other GBM-subtypes with distinct genetic backgrounds such as EGFR-amplifications or loss of NF1.
The detection of SE(R)RS nanoparticles by Raman spectroscopy-based imaging approaches has major advantages over other molecular contrast agent approaches. For example, as opposed to fluorescence imaging, our SERRS nanoprobes not only have superior sensitivity, they also are significantly more photostable than current fluorochromes [30]. SERRS nanoparticles with different Raman reporters also emit complex spectra when excited with a single 785-nm excitation source [13, 30, 47]. These complex, fingerprint-like spectra are unique to the SERRS-nanoparticles and are not produced by any endogenous biomolecule, thereby providing high signal specificity. This overcomes disadvantages of fluorescence imaging agents, where tissue autofluorescence can often be limiting by creating false-positive signals. The high tumor-to-background ratios produced by the RGD-SERRS nanoparticles prevents any unnecessary resection of healthy tissue and is therefore of particular importance in delicate surgical scenarios such as brain tumor resections [48]. Whether a truly complete surgical removal of all tumor cells (and therefore cure) would be feasible with our RGD-SERRS nanoparticles in humans remains to be evaluated. In the case of GBMs, complete surgical resection is expected to be limited to cases without infiltration in eloquent brain areas. However, complete surgical resections should be feasible in other brain tumor types, such as e.g. low-grade gliomas, ependymomas or pilocytic astrocytomas [49-51], which are known to express integrin αvβ3 [52, 53]. In pediatric brain tumors, resection can be curative, but requires the highest precision in order to achieve removal of all tumor cells while sparing crucial cerebral structures. While the presented method could be especially impactful in such scenarios, in the current study we deliberately selected GBM for the purpose of testing our technique in order to evaluate how well it would perform in the most challenging scenario.
SERS nanoparticles of similar size, materials, and surface composition as those used here have already passed extensive cytotoxicity studies [54], therapeutic gold-silica nanoparticles are in advanced clinical trials [44], and wide-field Raman imaging devices are being developed [55, 56]. We have also recently demonstrated that an already commercially available hand-held Raman scanner can be used to guide the resection of microscopic glioblastoma with high precision [38]. Thus, this approach using RGD-conjugated SERRS nanoprobes should have a high potential for clinical translation.
Acknowledgements
We thank Jonathan T. C. Liu, PhD, for helpful advice; Chrysafis Andreou, PhD and Volker Neuschmelting, MD, for critical review of the manuscript; and the MSKCC Electron Microscopy and Molecular Cytology core facilities for technical support. The following funding sources are acknowledged: NIH R01 EB017748 (M.F.K.); NIH K08 CA16396 (M.F.K.); M.F.K. is a Damon Runyon-Rachleff Innovator supported (in part) by the Damon Runyon Cancer Research Foundation (DRR-29-14); Pershing Square Sohn Prize by the Pershing Square Sohn Cancer Research Alliance (M.F.K.); The Dana Foundation Brain and Immuno-Imaging Grant (M.F.K.); Dana Neuroscience Scholar Award (M.F.K.); MSKCC Brain Tumor Center Grant (M.F.K.); MSKCC Center for Molecular Imaging and Nanotechnology Grant (M.F.K.); MSKCC Technology Development Grant (M.F.K.); "Mr. William H. and Mrs. Alice Goodwin and the Commonwealth Foundation for Cancer Research" and "The Center for Experimental Therapeutics Center of Memorial Sloan Kettering Cancer Center" (M.F.K.). Geoffrey Beene Cancer Research Center at MSKCC Grant and Shared Resources Award (M.F.K.); RSNA Research Scholar Grant (M.F.K.); Society of MSKCC Research Grant (M.F.K.); the National Natural Science Foundation (81401461, R.H.); R25T Molecular Imaging for Training in Oncology Program grant from the National Cancer Institute (NCI) (2R25-CA096945; principal investigator: H. Hricak; fellow: J.M.S.). Acknowledgments are also extended to the grant-funding support provided by the MSKCC NIH Core Grant (P30-CA008748).
Competing Interests
S.H. and M.F.K. are inventors on several pending patents regarding the SERRS nanoparticle design and detection hardware. M.F.K. is a co-founder of RIO Imaging, Inc.
References
1. Holland EC. Glioblastoma multiforme: the terminator. Proceedings of the National Academy of Sciences of the United States of America. 2000;97:6242-4
2. Adamson C, Kanu OO, Mehta AI, Di C, Lin N, Mattox AK. et al. Glioblastoma multiforme: a review of where we have been and where we are going. Expert Opin Investig Drugs. 2009;18:1061-83
3. Hoover JM, Chang SM, Parney IF. Clinical trials in brain tumor surgery. Neuroimaging Clin N Am. 2010;20:409-24
4. Bucci MK, Maity A, Janss AJ, Belasco JB, Fisher MJ, Tochner ZA. et al. Near complete surgical resection predicts a favorable outcome in pediatric patients with nonbrainstem, malignant gliomas: results from a single center in the magnetic resonance imaging era. Cancer. 2004;101:817-24
5. Ngwenya LB, Chiocca EA. Extent of resection. Journal of neurosurgery. 2011;115:1-2 discussion
6. Stupp R, Hegi ME, van den Bent MJ, Mason WP, Weller M, Mirimanoff RO. et al. Changing paradigms-an update on the multidisciplinary management of malignant glioma. Oncologist. 2006;11:165-80
7. Sanai N, Polley MY, McDermott MW, Parsa AT, Berger MS. An extent of resection threshold for newly diagnosed glioblastomas. Journal of neurosurgery. 2011;115:3-8
8. Bloch O, Han SJ, Cha S, Sun MZ, Aghi MK, McDermott MW. et al. Impact of extent of resection for recurrent glioblastoma on overall survival: clinical article. Journal of neurosurgery. 2012;117:1032-8
9. Petrecca K, Guiot MC, Panet-Raymond V, Souhami L. Failure pattern following complete resection plus radiotherapy and temozolomide is at the resection margin in patients with glioblastoma. Journal of neuro-oncology. 2013;111:19-23
10. Oh J, Sahgal A, Sanghera P, Tsao MN, Davey P, Lam K. et al. Glioblastoma: patterns of recurrence and efficacy of salvage treatments. The Canadian journal of neurological sciences Le journal canadien des sciences neurologiques. 2011;38:621-5
11. Gerstner ER, Chen PJ, Wen PY, Jain RK, Batchelor TT, Sorensen G. Infiltrative Patterns of Glioblastoma Spread Detected via Diffusion MRI After Treatment with Cediranib. Neuro-oncology. 2010;12:466-72
12. de Groot JF, Fuller G, Kumar AJ, Piao Y, Eterovic K, Ji Y. et al. Tumor Invasion after Treatment of Glioblastoma with Bevacizumab: Radiographic and Pathologic Correlationin Humans and Mice. Neuro-oncology. 2010;12:233-42
13. Kircher MF, de la Zerda A, Jokerst JV, Zavaleta CL, Kempen PJ, Mittra E. et al. A brain tumor molecular imaging strategy using a new triple-modality MRI-photoacoustic-Raman nanoparticle. Nature medicine. 2012;18:829-34
14. Reinges MH, Nguyen HH, Krings T, Hutter BO, Rohde V, Gilsbach JM. Course of brain shift during microsurgical resection of supratentorial cerebral lesions: limits of conventional neuronavigation. Acta Neurochir (Wien). 2004;146:369-77 discussion 77
15. Knauth M, Aras N, Wirtz CR, Dorfler A, Engelhorn T, Sartor K. Surgically induced intracranial contrast enhancement: potential source of diagnostic error in intraoperative MR imaging. AJNR Am J Neuroradiol. 1999;20:1547-53
16. Ludemann L, Hamm B, Zimmer C. Pharmacokinetic analysis of glioma compartments with dynamic Gd-DTPA-enhanced magnetic resonance imaging. Magn Reson Imaging. 2000;18:1201-14
17. Pronin IN, McManus KA, Holodny AI, Peck KK, Kornienko VN. Quantification of dispersion of Gd-DTPA from the initial area of enhancement into the peritumoral zone of edema in brain tumors. Journal of neuro-oncology. 2009;94:399-408
18. Saether CA, Torsteinsen M, Torp SH, Sundstrom S, Unsgard G, Solheim O. Did survival improve after the implementation of intraoperative neuronavigation and 3D ultrasound in glioblastoma surgery? A retrospective analysis of 192 primary operations. Journal of neurological surgery Part A, Central European neurosurgery. 2012;73:73-8
19. Ulrich NH, Burkhardt JK, Serra C, Bernays RL, Bozinov O. Resection of pediatric intracerebral tumors with the aid of intraoperative real-time 3-D ultrasound. Child's nervous system: ChNS: official journal of the International Society for Pediatric Neurosurgery. 2012;28:101-9
20. Beljebbar A, Dukic S, Amharref N, Manfait M. Ex vivo and in vivo diagnosis of C6 glioblastoma development by Raman spectroscopy coupled to a microprobe. Anal Bioanal Chem. 2010;398:477-87
21. Toms SA, Lin WC, Weil RJ, Johnson MD, Jansen ED, Mahadevan-Jansen A. Intraoperative optical spectroscopy identifies infiltrating glioma margins with high sensitivity. Neurosurgery. 2005;57:382-91 discussion -91
22. Ji M, Orringer DA, Freudiger CW, Ramkissoon S, Liu X, Lau D. et al. Rapid, Label-Free Detection of Brain Tumors with Stimulated Raman Scattering Microscopy. Science translational medicine. 2013;5:201ra119
23. Ozawa T, Britz GW, Kinder DH, Spence AM, VandenBerg S, Lamborn KR. et al. Bromophenol blue staining of tumors in a rat glioma model. Neurosurgery. 2005;57:1041-7 discussion -7
24. Shinoda J, Yano H, Yoshimura S, Okumura A, Kaku Y, Iwama T. et al. Fluorescence-guided resection of glioblastoma multiforme by using high-dose fluorescein sodium. Technical note. Journal of neurosurgery. 2003;99:597-603
25. Stummer W, Pichlmeier U, Meinel T, Wiestler OD, Zanella F, Reulen HJ. et al. Fluorescence-Guided Surgery with 5-Aminolevulinic Acid for Resection of Malignant Glioma: A Randomised Controlled Multicentre Phase III Trial. The lancet oncology. 2006;7:392-401
26. Huang R, Vider J, Kovar JL, Olive DM, Mellinghoff IK, Mayer-Kuckuk P. et al. Integrin alphavbeta3-targeted IRDye 800CW near-infrared imaging of glioblastoma. Clin Cancer Res. 2012;18:5731-40
27. Kantelhardt SR, Diddens H, Leppert J, Rohde V, Huttmann G, Giese A. Multiphoton excitation fluorescence microscopy of 5-aminolevulinic acid induced fluorescence in experimental gliomas. Lasers Surg Med. 2008;40:273-81
28. de la Zerda A, Bodapati S, Teed R, Schipper ML, Keren S, Smith BR. et al. A comparison between time domain and spectral imaging systems for imaging quantum dots in small living animals. Molecular imaging and biology: MIB: the official publication of the Academy of Molecular Imaging. 2010;12:500-8
29. Harmsen S, Bedics MA, Wall MA, Huang R, Detty MR, Kircher MF. Rational design of a chalcogenopyrylium-based surface-enhanced resonance Raman scattering nanoprobe with attomolar sensitivity. Nat Commun. 2015;6:6570
30. Harmsen S, Huang R, Wall MA, Karabeber H, Samii JM, Spaliviero M. et al. Surface-enhanced resonance Raman scattering nanostars for high-precision cancer imaging. Science translational medicine. 2015;7:271ra7
31. Spaliviero M, Harmsen S, Huang R, Wall MA, Andreou C, Eastham JA. et al. Detection of Lymph Node Metastases with SERRS Nanoparticles. Molecular imaging and biology: MIB: the official publication of the Academy of Molecular Imaging. 2016
32. Tabatabai G, Weller M, Nabors B, Picard M, Reardon D, Mikkelsen T. et al. Targeting integrins in malignant glioma. Target Oncol. 2010;5:175-81
33. Barrett LE, Granot Z, Coker C, Iavarone A, Hambardzumyan D, Holland EC. et al. Self-renewal does not predict tumor growth potential in mouse models of high-grade glioma. Cancer cell. 2012;21:11-24
34. Hambardzumyan D, Amankulor NM, Helmy KY, Becher OJ, Holland EC. Modeling Adult Gliomas Using RCAS/t-va Technology. Transl Oncol. 2009;2:89-95
35. Hambardzumyan D, Parada LF, Holland EC, Charest A. Genetic modeling of gliomas in mice: new tools to tackle old problems. Glia. 2011;59:1155-68
36. Uhrbom L, Holland EC. Modeling gliomagenesis with somatic cell gene transfer using retroviral vectors. Journal of neuro-oncology. 2001;53:297-305
37. Uhrbom L, Kastemar M, Johansson FK, Westermark B, Holland EC. Cell type-specific tumor suppression by Ink4a and Arf in Kras-induced mouse gliomagenesis. Cancer Res. 2005;65:2065-9
38. Karabeber H, Huang R, Iacono P, Samii JM, Pitter K, Holland EC. et al. Guiding brain tumor resection using surface-enhanced Raman scattering nanoparticles and a hand-held Raman scanner. ACS Nano. 2014;8:9755-66
39. Garai E, Sensarn S, Zavaleta CL, Loewke NO, Rogalla S, Mandella MJ. et al. A real-time clinical endoscopic system for intraluminal, multiplexed imaging of surface-enhanced Raman scattering nanoparticles. PLoS One. 2015;10:e0123185
40. Tichauer KM, Wang Y, Pogue BW, Liu JT. Quantitative in vivo cell-surface receptor imaging in oncology: kinetic modeling and paired-agent principles from nuclear medicine and optical imaging. Phys Med Biol. 2015;60:R239-69
41. Katz AM, Amankulor NM, Pitter K, Helmy K, Squatrito M, Holland EC. Astrocyte-specific expression patterns associated with the PDGF-induced glioma microenvironment. PLoS One. 2012;7:e32453
42. Peiffer J, Kleihues P. Hans-Joachim Scherer (1906-1945), pioneer in glioma research. Brain Pathol. 1999;9:241-5
43. Claes A, Idema AJ, Wesseling P. Diffuse glioma growth: a guerilla war. Acta Neuropathol. 2007;114:443-58
44. Thakor AS, Gambhir SS. Nanooncology: the future of cancer diagnosis and therapy. CA: a cancer journal for clinicians. 2013;63:395-418
45. Lee HY, Li Z, Chen K, Hsu AR, Xu C, Xie J. et al. PET/MRI dual-modality tumor imaging using arginine-glycine-aspartic (RGD)-conjugated radiolabeled iron oxide nanoparticles. J Nucl Med. 2008;49:1371-9
46. Zhang F, Huang X, Zhu L, Guo N, Niu G, Swierczewska M. et al. Noninvasive monitoring of orthotopic glioblastoma therapy response using RGD-conjugated iron oxide nanoparticles. Biomaterials. 2012;33:5414-22
47. Zavaleta CL, Kircher MF, Gambhir SS. Raman's "Effect" on Molecular Imaging. J Nucl Med. 2011;52:1839-44
48. Liu JT, Meza D, Sanai N. Trends in fluorescence image-guided surgery for gliomas. Neurosurgery. 2014;75:61-71
49. Rogers L, Pueschel J, Spetzler R, Shapiro W, Coons S, Thomas T. et al. Is Gross-Total Resection Sufficient Treatment for Posterior Fossa Ependymomas? Journal of neurosurgery. 2005;102:629-36
50. Pfister S, Witt O. Pediatric Gliomas. Recent results in cancer research Fortschritte der Krebsforschung Progres dans les recherches sur le cancer. 2009;171:67-81
51. Pollack IF. Brain Tumors in Children. The New England journal of medicine. 1994;331:1500-7
52. Lim M, Guccione S, Haddix T, Sims L, Cheshier S, Chu P. et al. alpha(v)beta(3) Integrin in central nervous system tumors. Hum Pathol. 2005;36:665-9
53. Schnell O, Krebs B, Wagner E, Romagna A, Beer AJ, Grau SJ. et al. Expression of integrin alphavbeta3 in gliomas correlates with tumor grade and is not restricted to tumor vasculature. Brain Pathol. 2008;18:378-86
54. Thakor AS, Luong R, Paulmurugan R, Lin FI, Kempen P, Zavaleta C. et al. The fate and toxicity of Raman-active silica-gold nanoparticles in mice. Science translational medicine. 2011;3:79ra33
55. Andreou C, Kishore SA, Kircher MF. Surface-Enhanced Raman Spectroscopy: A New Modality for Cancer Imaging. J Nucl Med. 2015;56:1295-9
56. Bohndiek SE, Wagadarikar A, Zavaleta CL, Van de Sompel D, Garai E, Jokerst JV. et al. A small animal Raman instrument for rapid, wide-area, spectroscopic imaging. Proceedings of the National Academy of Sciences of the United States of America. 2013;110:12408-13
Author contact
![]() Corresponding author: Moritz F. Kircher, MD, PhD. Department of Radiology, Center for Molecular Imaging and Nanotechnology (CMINT), Memorial Sloan Kettering Cancer Center, Mortimer B. Zuckerman Research Center, Z-2062, 408 East 69th Street, New York, NY 10065, Phone: 646-888-3371 Email: kirchermorg.
Corresponding author: Moritz F. Kircher, MD, PhD. Department of Radiology, Center for Molecular Imaging and Nanotechnology (CMINT), Memorial Sloan Kettering Cancer Center, Mortimer B. Zuckerman Research Center, Z-2062, 408 East 69th Street, New York, NY 10065, Phone: 646-888-3371 Email: kirchermorg.