Impact Factor
- Issue 14; 2026
- Issue 13; 2026
- Issue 12; 2026
- Issue 11; 2026
- Issue 10; 2026
- Volume 16; 2026
- Advance Articles
- Past Issues
- Cover Images
- Cover Suggestion
- Index & Coverage
- Special Issues
Introduction
Materials and Methods
Results
Discussion
Conclusion
Supplementary Material
Abbreviations
Acknowledgements
References
International Journal of Biological Sciences
International Journal of Medical Sciences
 Global reach, higher impact

Theranostics 2016; 6(11):1918-1933. doi:10.7150/thno.15568 This issue Cite
Research Paper
CD146-targeted immunoPET and NIRF Imaging of Hepatocellular Carcinoma with a Dual-Labeled Monoclonal Antibody
Reinier Hernandez1*, Haiyan Sun2*, Christopher G. England1, Hector F. Valdovinos1, Emily B. Ehlerding1, Todd E. Barnhart1, Yunan Yang2 ![]() , Weibo Cai1,2,3
, Weibo Cai1,2,3 ![]()
1. Department of Medical Physics, University of Wisconsin, Madison, WI 53705, USA;
2. Department of Radiology, University of Wisconsin, Madison, WI 53705, USA;
3. University of Wisconsin Carbone Cancer Center, Madison, WI 53705, USA.
*Reinier Hernandez and Haiyan Sun contributed equally to this work.
Received 2016-3-17; Accepted 2016-6-27; Published 2016-8-8
Abstract

Overexpression of CD146 has been correlated with aggressiveness, recurrence rate, and poor overall survival in hepatocellular carcinoma (HCC) patients. In this study, we set out to develop a CD146-targeting probe for high-contrast noninvasive in vivo positron emission tomography (PET) and near-infrared fluorescence (NIRF) imaging of HCCs. YY146, an anti-CD146 monoclonal antibody, was employed as a targeting molecule to which we conjugated the zwitterionic near-infrared fluorescence (NIRF) dye ZW800-1 and the chelator deferoxamine (Df). This enabled labeling of Df-YY146-ZW800 with 89Zr and its subsequent detection using PET and NIRF imaging, all without compromising antibody binding properties. Two HCC cell lines expressing high (HepG2) and low (Huh7) levels of CD146 were employed to generate subcutaneous (s.c.) and orthotopic xenografts in athymic nude mice. Sequential PET and NIRF imaging performed after intravenous injection of 89Zr-Df-YY146-ZW800 into tumor-bearing mice unveiled prominent and persistent uptake of the tracer in HepG2 tumors that peaked at 31.65 ± 7.15 percentage of injected dose per gram (%ID/g; n=4) 72 h post-injection. Owing to such marked accumulation, tumor delineation was successful by both PET and NIRF, which facilitated the fluorescence image-guided resection of orthotopic HepG2 tumors, despite the relatively high liver background. CD146-negative Huh7 and CD146-blocked HepG2 tumors exhibited significantly lower 89Zr-Df-YY146-ZW800 accretion (6.1 ± 0.5 and 8.1 ± 1.0 %ID/g at 72 h p.i., respectively; n=4), demonstrating the CD146-specificity of the tracer in vivo. Ex vivo biodistribution and immunofluorescent staining corroborated the accuracy of the imaging data and correlated tracer uptake with in situ CD146 expression. Overall, 89Zr-Df-YY146-ZW800 showed excellent properties as a PET/NIRF imaging agent, including high in vivo affinity and specificity for CD146-expressing HCC. CD146-targeted molecular imaging using dual-labeled YY146 has great potential for early detection, prognostication, and image-guided surgical resection of liver malignancies.
Keywords: Positron emission tomography (PET), near-infrared fluorescence (NIRF) imaging, dual-modality imaging, hepatocellular carcinoma (HCC), CD146, 89Zr.
Introduction
Liver cancer remains the second leading cause of cancer-related mortality worldwide [1, 2]. Although liver cancer is a much more frequent disease in undeveloped areas, in the US, the incidence has tripled since 1975 [2]. Such a hike in the incidence rate of liver cancer is rooted in an increased prevalence of risk factors including chronic hepatitis C virus (HCV) infection, obesity, diabetes, and fatty liver disease [3]. Hepatocellular carcinoma (HCC), the most common liver cancer histology that accounts for nearly 90% of primary liver malignancies, is among the most lethal types of cancers with a bleak 17% 5-year survival rate [2]. Partial hepatectomy and liver transplantation are the only two curative options currently available for the treatment of HCC. Unfortunately, curative treatment is only suitable for a small subset of patients at the early stages of the disease and with adequate liver function [4]. HCC prognosis significantly worsens when patients are diagnosed during advanced stages of the disease, when surgery is precluded by tumor size, multifocal disease, extrahepatic dissemination, or insufficient hepatic function. At this point, management options are limited to locoregional therapies such as radiofrequency ablation, radioembolization, and systemic chemotherapy, all with palliative intents [4, 5].
Early detection remains the foremost strategy to improve HCC patient outcomes [6]. Owing to the availability of multiple imaging techniques, new guidelines have emerged for noninvasive diagnosis of HCC (historically performed via biopsies) using computed tomography (CT), magnetic resonance imaging (MRI) or contrast-enhanced ultrasound (CEUS)[3, 7]. Nevertheless, these imaging modalities rely on detecting tumor morphological features that are rarely visible during initial stages of HCC or that are insensitive to biological changes occurring soon after treatment [3, 7]. On the other hand, functional imaging techniques are superior for detecting variations in tumor metabolism and dysregulation of tumor-associated biomarkers and molecular pathways noninvasively. A typical example is positron emission tomography (PET) using 18F-fluordeoxyglucose (18F-FDG), a radiotracer that scrutinizes the generally exacerbated glucose metabolism of tumors [8]. Despite the proven benefits of 18F-FDG PET in assessing therapeutic response and predicting patient outcome after treatment, 18F-FDG lacks sufficient specificity for the unequivocal diagnosis of HCC [8]. Improving detection specificity with PET requires first the identification of HCC-specific molecular signatures, followed by the generation of targeted imaging agents with high affinity for the selected molecule. In this regard, immunoPET, which exploits the exquisite binding affinity and specificity of monoclonal antibodies (mAb) for their cognate antigen to detect tumor-associated markers, has proven superior to MRI and 18F-FDG PET in terms of sensitivity and specificity under several clinical scenarios [9, 10]
Once HCC is diagnosed noninvasively, surgeons face yet another challenge: how to delineate tumor contours during surgery. Currently, intraoperative identification of tumorous tissue is typically carried out through visual inspection and/or palpation, based on differences in color, texture, morphology, plasticity, and elasticity between tumor and the healthy organ [11, 12]. This approach greatly relies on physician's expertise and is inherently insensitive to detecting small residual tumor or metastasis, resulting in tumor recurrence and an overall poor patient performance. Steps have been taken toward the use of fluorescence imaging techniques for the intraoperative visualization of malignant tissue. Multiple clinical trials are exploring the use of indocyanine green (ICG) fluorescent dye to determine tumor mass in the operating room using near-infrared fluorescence (NIRF) imaging. However, the non-specific character of ICG's accumulation in tumors limits the performance of this methodology, particularly for the detection of poorly differentiated and metastatic HCC lesions [13]. A better strategy is to conjugate a fluorescent dye to a tumor-targeting ligand that specifically accumulates in tumors overexpressing the ligand receptor.
Fluorescence imaging provides superb spatial and temporal resolution; however, it suffers from a major drawback that is its poor tissue penetrability [14]. Nuclear detection, on the other hand, is extremely sensitive and nearly unaffected by tissue attenuation, facilitating the detection of lesions sitting deep inside the body. Thus, a targeted dual-modality imaging agent featuring a radionuclide and an NIRF fluorophore would allow first the noninvasive determination of tumor burden via tomographic nuclear imaging techniques (SPECT or PET), and also gross localization of deep-sitting tumor lesions intraoperatively using a γ-probe. Following, optical imaging would facilitate accurate detection, delineation, and surgical resection of primary and metastatic lesions. The latter would enable complete tumor resection while largely sparing healthy tissue, offering a chance at improving patient survival and reducing post-surgical sequelae.
CD146, also called MCAM or MUC18, has emerged as an attractive molecular target for targeted diagnosis and therapy in a variety of diseases. The overexpression of CD146 has been reported in multiple cancers including melanoma, breast cancer, brain cancer, lung carcinoma, gastric cancer, and ovarian cancer [15-18]. Additionally, CD146 expression has been linked almost invariably to increased cancer aggressiveness, metastasis, and decreased patient survival. Recently, we reported the in vitro overexpression of CD146 and its association with a high histological grade in HCC [19]. Moreover, Wang and colleagues demonstrated that CD146 expression enhances migration and tumor invasion in HCC; presumably via activation of the mitogen-activated protein kinase 1 (MAPK1) and the induction of the epithelial to mesenchymal transition (EMT) [20]. In this study, we describe the generation of a CD146-targeting probe via labeling of YY146, a murine anti-CD146 mAb, with the positron emitter 89Zr for immunoPET imaging and the NIRF dye ZW800-1 for optical imaging of intrahepatic malignancies in a mouse model of HCC. Owing to the excellent targeting properties and CD146-specificity of 89Zr-Df-YY146-ZW800, we demonstrated the noninvasive PET visualization and fluorescent image-guided resection of orthotopic HCC tumors. Our results suggest the potential of 89Zr-Df-YY146-ZW800 for the early detection and better staging of liver malignancies, image-guided surgery, and monitoring of tumor response to CD146-targeted therapies.
Materials and Methods
Reagents
The anti-CD146 mAb YY146 was generated and purified as described previously [19]. AlexaFluor488 and Cy3 labeled secondary antibodies for flow cytometry were purchased from Jackson Immunoresearch Laboratories, Inc. (West Grove, PA). The chelator SCN-Bn-deferoxamine (Df) was obtained from and Macrocyclics Inc. (Dallas, TX). Unless stated otherwise, materials and reagents were acquired from Thermo Fisher Scientific (Waltham, MA). Buffers and solutions were prepared using Milli-Q water (resistivity >18.2 MΩ·cm) and treated with Chelex 100 resin (Sigma-Aldrich, St. Louis, MO) to remove heavy metal contaminants.
Tracer generation and characterization
89Zr was produced in a GE PETtrace biomedical cyclotron via irradiation of natural yttrium foils with 16.2 MeV protons. 89Zr was separated from target material via solid-phase chromatography using a hydroxamate-functionalized column, then eluted in 1M oxalic acid with a specific activity (SA) of ~111 GBq/µmol at end-of-bombardment (EOB). Deferoxamine was conjugated to YY146 using protocols described previously [21]. Briefly, 3 mg (20 nmol) of YY146 in 500 μL of phosphate buffered saline (PBS) were adjusted to pH 8.5-9.0 with 0.1 M Na2CO3, and SCN-Bn-deferoxamine (50-100 nmol) in DMSO was added to the mixture. A 1:5 mAb to SCN-Bn-deferoxamine molar ratio was employed for the generation of Df-YY146, while a 1:2.5 molar ratio was used to prepare Df-YY146 for further derivatization with an NIRF fluorophore. The pH of the mixture was readjusted with Na2CO3, and the reaction was left to proceed at room temperature (RT) for 2 h. Df-YY146 was then purified by size exclusion chromatography using PD-10 (GE Healthcare) columns and PBS mobile phase. For dual modality imaging, Df-YY146-ZW800 was prepared. Df-YY146 in PBS was adjusted to pH 8.5-9.0, then ZW800-1-NHS in DMSO was added in a 1:2 mAb to dye molar ratio. The reaction carried out at RT for 2h and Df-YY146-ZW800 was purified via PD-10 columns. DMSO concentration in the mixture was lower than 5% (v/v) to minimize mAb denaturing.
For 89Zr labeling, 121 MBq (~3 mCi) of 89Zr-oxalate were diluted in 1 mL of HEPES buffer (0.5 M), pH adjusted to 7.0 with Na2CO3 (2M), and ~450 µg (150 µg /mCi) of Df-YY146 or Df-YY146-ZW800 was added. Radiolabeling was carried out for 1h at 37 °C, after which 89Zr-Df-YY146/ 89Zr-Df-YY146-ZW800 was purified by PD-10 columns. Radiochemical yields and purity were determined via instant thin-layer chromatography (iTLC). Two μL samples of the radiolabeling reaction and purified antibody were spotted into silica-impregnated radio iTLC plates, run with 50 mM EDTA (pH = 4.5), and developed in a phosphor-plate reader (Perkin Elmer). Labeled antibody remained at the origin (Rf = 0) while free 89Zr moved with the solvent front (Rf = 1).
The number of chelators per antibody was elucidated in a modified isotopic dilution experiment [22]. Briefly, a fixed amount of Df-YY146 or Df-YY146-ZW800 (1 nmol) was placed into 1.5 ml plastic Eppendorf tubes containing 250 µL of 0.5M HEPES buffer (pH 7.0), and ~3.7 MBq (100 μCi) of 89Zr-oxalate was added to the vial. Following, vials were spiked with 0.1, 0.2, 0.5, 1.0 or 2.0 nmol of ZrCl4 and the mixtures incubated at 37 °C for 1h. Radiochemical yield, as determined by iTLC was plotted against ZrCl4 concentration, allowing for the moles required for 50% (N50) labeling to be calculated. The number of chelators per mAb was computed by dividing N50 by twice the moles of the mAb.
Cell culture
Hepatocellular carcinoma cell lines HepG2 and Huh7 were obtained from the American Type Culture Collection (ATCC) and the Japanese Collection of Research Bioresources (JCRB), respectively. Both cells were cultured in DMEM medium (Invitrogen) supplemented with penicillin (100 U/mL; Invitrogen), streptomycin (100 μg/mL; Invitrogen), and FBS [10% (v/v); Gibco] and incubated at 37 °C in a 5% CO2 atmosphere. Cells were used for in vitro and in vivo experiments when they reached >80% confluence.
Luciferase-transfected HepG2 cells
For bioluminescent imaging, HepG2 cells were transfected with PGK-Luc2-pp (Oplasmid) using the FuGENE® HD Transfection Reagent (Promega) in the presence of complete growth medium according to company's protocol. For in vitro bioluminescence detection, different amounts of transfected HepG2 cells were seeded into a 96 well plate and incubated in DMEM at 37 °C in a 5% CO2 atmosphere for 24 h After incubation, the culture medium was removed, 100 µL of a D-luciferin solution (150 µg/mL) was added, and cells' bioluminescence was recorded using an IVIS Spectrum imaging system (Perkin Elmer, Waltham, MA).
Animal Models
All animal studies were conducted under the approval of the University of Wisconsin Institutional Animal Care and Use Committee. HepG2 and Huh7 subcutaneous (s.c.) xenografts were induced by subcutaneous injection of 1 × 10⁶ cells, suspended in 100 μL of 1:1 PBS and Matrigel (BD Biosciences), into the lower flank of 5 week-old female athymic nude mice (Harlan). Tumor size was monitored visually every other day, and animals were used for in vivo experiments when the tumor reached 5-10 mm in diameter, ∼3 weeks after tumor implantation. Orthotopic HepG2 tumors were generated by stereotactic injection of luciferase-transfected HepG2 cells into the liver of athymic nude mice. During the surgical procedure, mice were anesthetized with isoflurane (3.5% induction; 2% maintenance) and median laparotomy performed to expose the liver. Approximately 1.0×10⁵ cells were injected into the left anterior hepatic lobe and the abdominal incision was closed with Prolene 4-0 sutures.
The progression of orthotopic tumors was monitored at weeks 2 and 3 post-implantation by in vivo bioluminescence. For imaging, mice were intravenously (iv) injected with 200 µL of a D-luciferin solution at 15 mg/mL in PBS and 10-15 min post-injection (p.i.) animals were anesthetized (2% isoflurane) and imaged in an IVIS Spectrum imaging system. Mice with tumors confirmed by bioluminescence were used for dual-modality imaging studies.
Flow cytometry
The CD146-immunoreactivity of YY146 and Df-YY146-ZW800 were studied and compared in HepG2 and Huh7 cells via flow cytometry analysis. Cells were harvested, suspended in cold PBS (pH 7.4) with 1% BSA at a concentration of 1 × 10⁶ cells per mL, and incubated with 5 μg/mL or 25 μg/mL of YY146 and Df-YY146-ZW800 antibodies for 30 min at room temperature. Following, cells were washed three times with cold PBS, spun down at 927×g for 5 minutes, and incubated with FITC-labeled goat anti-mouse IgG (5 μg/mL) for 30 min at RT. Finally, cells were washed and analyzed using an MACSQuant10 cytometer. FlowJo software was used for the analysis and data processing (Tree Star, Inc.).
Western blot
CD146 protein expression was determined in HepG2 and Huh7 cells using Western blot. Cells were lysed with radioimmunoprecipitation assays (RIPA) buffer (Boston BioProducts, Ashland, MA) and cell lysates collected and centrifuged at 12000×g for 20 minutes. Total protein concentration in the supernatant was determined by the Bradford method using the PierceTM Coomassie Protein Assay kit (Thermo Fisher Scientific, Waltham, MA). Equal amounts of protein lysates (~20 µg) were mixed with 4× gel loading buffer, loaded into gradient polyacrylamide gels (4-12% Bolt® Bis-Tris Plus Gels; Thermo Fisher Scientific), and electrophoresed at 120 mV for 45 min at 4°C. Separated proteins were transferred to nitrocellulose membranes employing the iBlot 2 Dry Blotting system (Thermo Fisher Scientific), then membranes were blocked with Odyssey Blocking Buffer (PBS) (LI-COR Biosciences, Lincoln, NE), overnight at 4°C. Blocked membranes were placed in an iBind Western apparatus, preloaded with 1:100 and 1:400 dilutions of mouse anti-CD146 (Santa Cruz Biotech Inc., Dallas, TX) and rabbit anti-β-actin (LI-COR Biosciences) polyclonal antibodies, in iBind fluorescence detection solution (Thermo Fischer Scientific). Dilutions of IRDye-680LT-labeled donkey anti-mouse (1:2000) and IRDye-800CW-labeled donkey (1:3000) anti-rabbit secondary antibodies (LI-COR Biosciences) were placed in their respective chambers, and the iBind Western System was left to run overnight at 4°C. Fluorescent immunocomplexes were visualized using the Odyssey® CLx Infrared Imaging System (LI-COR Biosciences) and images analyzed using image Studio Lite (LI-COR Biosciences).
Saturation binding and internalization assay
Receptor saturation assay was performed to determine the CD146-binding affinity of YY146 and the number of CD146 molecules per HepG2 cell. To the wells of 96-well filter plates (Corning® , Sigma-Aldrich, St. Louis, MO), 1×10⁵ HepG2 cells were seeded and increasing concentrations of radiolabeled YY146 (range 0.03 nM - 100 nM; SA: 18.5 GBq/µmol) were added. For each concentration, non-specific binding was determined by adding 1 µM of cold YY146. The plate was incubated at room temperature with constant rocking for 2 h, then rinse three times with cold PBS containing 0.1% BSA, blow-dried, and filters collected and counted in an automated γ-counter. Saturation binding isotherms were plotted, and the affinity constant (Kd) and maximum specific binding (Bmax) calculated using GraphPad Prism software (GraphPad Software, San Diego, CA).
For the internalization assay, ~ 5×10⁵ HepG2 cells were seeded into culture 6-well plates and incubated overnight under the appropriate conditions. Following incubation, the culture medium was replaced with fresh DMEM media containing 0.1% BSA and 18.5 kBq of 89Zr-Df-YY146. After 15 min, 2, 6, 12 or 24 h incubation, an acid wash was performed (0.1 M HAc in normal saline, pH 2.5) to remove the membrane-bound 89Zr-Df-YY146, then cells were trypsinized, collected, and counted in a gamma counter. The fraction of the total binding corresponding to membrane-bound and internalized 89Zr-Df-YY146 was plotted against the incubation time. All data points were collected in triplicate.
PET imaging with 89Zr-Df-YY146 and 89Zr-Df-YY146-800ZW
Small animal PET imaging was performed in an Inveon microPET/microCT scanner (Siemens Medical Solutions, Knoxville, TN). Before each PET scan, animals were anesthetized with isoflurane (4% induction, 2% maintenance) and placed in a prone position for scanning. Considering the long physical half-life of 89Zr and the pharmacokinetic profile of antibody-based radiotracers, time points starting at 4 h p.i. of the tracer and up to day 5 p.i. were selected for longitudinal PET imaging studies. A total of 8 groups (n=3-5) of athymic nude mice were employed. Grouping is summarized in Table 1. Briefly, group 1 and 2 received an intravenous injection of 5.6 MBq (~150 μCi) of 89Zr-Df-YY146; in addition, group 2 was administered a large blocking dose (50 mg/kg) of unlabeled YY146 24 h prior to injection of the radioactive tracer. Groups 3-6 were injected intravenously 5.6-7.4 MBq (150-200 μCi) of the dual modality tracer 89Zr-Df-YY146-ZW800; in addition, group 5 also received a blocking dose (50 mg/kg) of the unlabeled antibody 24 h before radiotracer infusion. Group 3 received 400 pmol of low SA (18.5 GBq/µmol) 89Zr-Df-YY146-ZW800 while groups 4-6 were injected with 250 pmol of a higher SA (29.6 GBq/µmol) preparation of the tracer. Mice bearing orthotopic HepG2 tumors were imaged once tumors were confirmed by bioluminescence imaging. Two groups, 7 and 8, were injected with 5.6-7.4 MBq of high or low SA89Zr-Df-YY146-ZW800.
PET imaging groups.
| Group | N | Tumor model | PET tracer | SA (GBq/µmol) |
|---|---|---|---|---|
| Subcutaneous xenograft | ||||
| 1 | 4 | HepG2(R)/Huh7(L) | 89Zr-Df-YY146 | 44.4 |
| 2 | 3 | HepG2(R)/Huh7(L) | 89Zr-Df-YY146 + YY146 (50 mg/kg) | 44.4 |
| 3 | 5 | HepG2 | 89Zr-Df-YY146-ZW800 | 18.5 |
| 4 | 3 | HepG2 | 89Zr-Df-YY146-ZW800 | 29.6 |
| 5 | 4 | HepG2 | 89Zr-Df-YY146-ZW800 + YY146 (50 mg/kg) | 29.6 |
| 6 | 3 | Huh7 | 89Zr-Df-YY146-ZW800 | 29.6 |
| Orthotopic xenografts | ||||
| 7 | 4 | HepG2 | 89Zr-Df-YY146-ZW800 | 29.6 |
| 8 | 5 | HepG2 | 89Zr-Df-YY146-ZW800 | 18.5 |
| R: right flank; L: left flank; SA: specific activity | ||||
List mode static scans of 40 million true events were acquired (energy window: 350-650 keV; timing window: 3.4 ns), and PET images were reconstructed using a three-dimensional (3D) Ordered Subset Maximization Expectation iterative reconstruction algorithm. 3D regions-of-interest (ROI) were manually drawn over the tumor and major organs, then accumulation of the tracer was determined in an Inveon Research Workstation (Siemens Medical Solutions, Knoxville, TN). Uptake was reported as percent injected dose per gram of tissue (%ID/g; mean ± SD).
Near-infrared Fluorescent Imaging
Following each PET acquisition, mice were transferred to an IVIS Spectrum in vivo fluorescence imager and placed in a prone or supine position, depending on the location of the tumor. Mice were then imaged using a 745nm/800nm excitation/emission filter pair under automatic exposure settings, and fluorescence signal was displayed as radiant efficiency.
Ex vivo PET/NIRF and biodistribution
Ex vivo imaging and ex vivo biodistribution studies were carried out in order to validate in vivo NIRF imaging and PET-derived quantitative data. Immediately after the final imaging time point, mice were euthanized by CO2 asphyxiation and major organs/tissues were harvested, wet weighted and imaged in a microPET and an IVIS spectrum system using the settings described for in vivo PET and NIRF imaging. Following PET/NIRF imaging, tissues were counted in an automated gamma counter, and tracer accumulation was reported as %ID/g (mean ± SD).
Confocal Laser Scanning Microscopy
Immunofluorescence staining was performed to evaluate in situ CD146 expression following a formerly described methodology [19]. Briefly, after terminal imaging, tumors were surgically resected, embedded in optimal cutting temperature (OCT) compound, and frozen. Tissue slices of 5-μm thickness were fixed with cold acetone for 10 min, rinsed with PBS, and blocked with 10% donkey serum for 20 min at RT. The slices were incubated overnight with a mixture of YY146 (10 μg/mL) and rat anti-mouse CD31 antibody (BD Biosciences) at 4 °C, then FITC-labeled goat anti-mouse IgG (Invitrogen) and Cy3-labeled donkey anti-rat IgG (The Jackson Laboratory) secondary antibodies were added. Cell nuclei were stained with DAPI. Confocal fluorescence images were acquired with a Nikon Digital Eclipse C1 plus microscope equipped with three excitation lasers (488 nm, 546 nm, and 633 nm).
Statistical analysis
Quantitative data is expressed as mean ± SD. Testing for statistical significance was performed using a two-tailed unpaired t-test with a 95% confidence interval. Differences were considered significant when P < 0.05. *P<0.01; **P<0.001; ***P<0.0001.
Results
In vitro studies
CD146 expression was determined in vitro in HepG2 and Huh7 cancer cell lines using flow cytometry (Figure 1A). Flow cytometry histograms of HepG2 cells showed elevated fluorescence signal corresponding to high levels of CD146 expression; Huh7 cells, on the other hand, displayed background fluorescence. Also by flow cytometry, the CD146-avidity of YY146 and Df-YY146-800ZW were compared, showing no difference in the cell binding ability between the two compounds. This demonstrated that conjugation of deferoxamine and ZW800-1 did not compromise YY146's immunoreactivity. Similarly, Western blot studies (Figure 1B) revealed the presence of a prominent band around 113 kDa, indicative of a high expression of CD146 protein in HepG2 cells. This band was undetected in Huh7 cell lysates. CD146 immunofluorescence staining, using YY146 as the primary antibody, uncovered a strong staining of HepG2 cell membranes while showing much weaker interaction with Huh7 cells (Figure 1C); such results corroborated the observations made by flow cytometry and Western blot.
In vitro CD146 expression in human hepatocellular carcinoma (HCC) cells. A) Flow cytometry of HepG2 and Huh7 HCC cells. Fluorescence histograms revealed markedly higher signal, indicative of higher CD146 expression, for HepG2 cells compared to Huh7 cells. B) Western blot displayed a strong band around 110 kDa consistent with CD146 (113 kDa) in HepG2 cell lysates; such band was undetectable in Huh7 cells. (1) molecular weight ladder; (2) Huh7 lysate; (3) HepG2 lysate. C) Consistent with results from A and B, immunofluorescence staining showed very intense CD146 staining (green channel) of HepG2 cell membranes that was unmatched in Huh7 cells. D) CD146 saturation binding assay isotherm in HepG2 cells. Cells were incubated with increasing concentration of radiolabeled YY146 (0.03-100 nM). The affinity constant (Kd) and maximum ligand binding (Bmax) were determined from the analysis of the binding isotherm. E) Cell internalization assay showing the slow kinetics of 89Zr-Df-YY146 internalization.
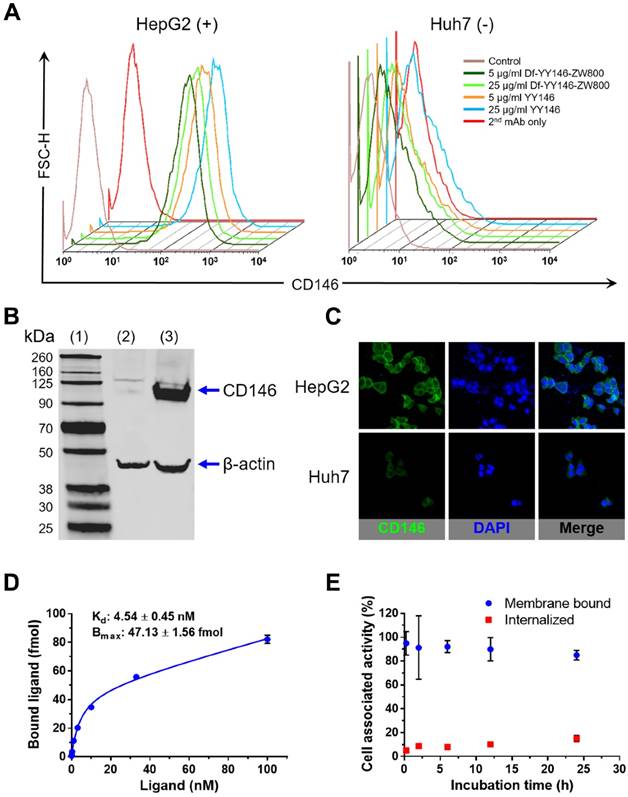
Receptor saturation binding assay revealed a CD146-affinity constant (Kd) of 4.54 ± 0.45 nM for YY146 (Figure 1D). Also, we determined an average of 2.15 ± 0.07 ×10⁵ CD146 receptors available for binding per HepG2 cell. YY146 was shown to undergo slow internalization in HepG2 cells, with 85% and 15% of the cell-associated activity being membrane bound and internalized, respectively after 24 h of incubation (Figure 1E). Overall, these in vitro studies proved the high affinity and specificity of YY146 binding to CD146-positive HepG2 cells.
Development of multimodality tracer
Two tracers were developed based on YY146 mAb: 89Zr-Df-YY146 for PET imaging and 89Zr-Df-YY146-ZW800 for multimodality PET and optical imaging. Deferoxamine, the most common bifunctional chelator in the preparation of 89Zr radiopharmaceuticals, was conjugated to YY146 by the standard primary amine-isothiocyanate reaction. Isotopic dilution studies using zirconium (IV) chloride showed an approximate 2.2 and 1.3 Df chelators per molecule of Df-YY146 and Df-YY146-ZW800, respectively (Figure S1). The NIRF dye ZW800-1-NHS was also incorporated to the previously prepared Df-YY146 via activated ester reaction, resulting in the conjugation of ~1 ZW800-1 per mAb. Radiolabeling of Df-YY146 and Df-YY146-ZW800 with 89Zr was achieved with high yields (> 80%; non-decay corrected) and radiochemical purities surpassing 95%. 89Zr-Df-YY146 and 89Zr-Df-YY146-ZW800 were obtained with excellent specific activity (SA; 29.6-44.4 GBq/µmol). A low SA 89Zr-Df-YY146-ZW800 (18.5 GBq/µmol) was prepared by adding nonradioactive Df-YY146-ZW800 to the radiolabeled homolog.
Single-modality PET imaging and biodistribution studies
The relatively long physical half-life of 89Zr (t1/2: 78.4 h) allowed monitoring the biodistribution of 89Zr-Df-YY146 in tumor-bearing mice noninvasively for a period of 5 days after intravenous administration of the radiolabeled antibody. Maximum intensity projections (MIP) of whole-body PET images of mice bearing HepG2 (CD146+; right flank) and Huh7 (CD146-; left flank) s.c. tumor xenografts are presented in Figure 2A. Even at the earliest time point, 4 h p.i., a marked accumulation of 89Zr-Df-YY146 was observed in CD146-positive HepG2 tumors. Such accretion continued to increase over time reaching a plateau at 48 h p.i., which permitted a sharp delineation of tumorous tissue due to the high tumor-to-background contrasts attained. On the other hand, contralateral CD146-negative Huh7 tumors were hardly discernible from the body's background signal.
In vivo PET imaging of CD146 expression and ex vivo biodistribution of 89Zr-Df-YY146 in mice bearing subcutaneous HCC xenografts. A) Representative maximum-intensity projections (MIP) images of longitudinal PET scans of athymic nude mice bearing HepG2 (right flank) and Huh7 (left flank) tumors injected with 5.6-7.4 MBq of 89Zr-Df-YY146 (n = 4; top row). Markedly higher accumulation of the tracer was observed in CD146-expressing HepG2 tumors compared to CD146-negative Huh7 tumors. Mice pre-injected with a blocking dose of YY146 (50 mg/kg) 24 h prior to 89Zr-Df-YY146 administration exhibited significantly lower uptake in HepG2 tumors (n = 3; bottom row). Arrows point to the heart (H), liver (L), Huh7 tumor (H7), and HepG2 tumor (H2). B) Region-of-interest (ROI) analysis of the PET images showing the temporal variation of 89Zr-Df-YY146's accumulation in HepG2, Huh7, and blocked HepG2 and Huh7 tumors; uptake values are presented as %ID/g ± SD (n = 3 or 4). Significantly higher (P < 0.0001) tracer uptake was observed in non-blocked HepG2 tumors, at all imaging time points. C) Ex vivo biodistribution at 120 h post-injection (p.i.) of 89Zr-Df-YY146. Mice were euthanized after the last PET scan and tissues collected, wet-weighed, and counted in a γ-counter. Uptake in the various tissues is givens as %ID/g (mean ± SD; n= 3 or 4). *** P<0.0001.
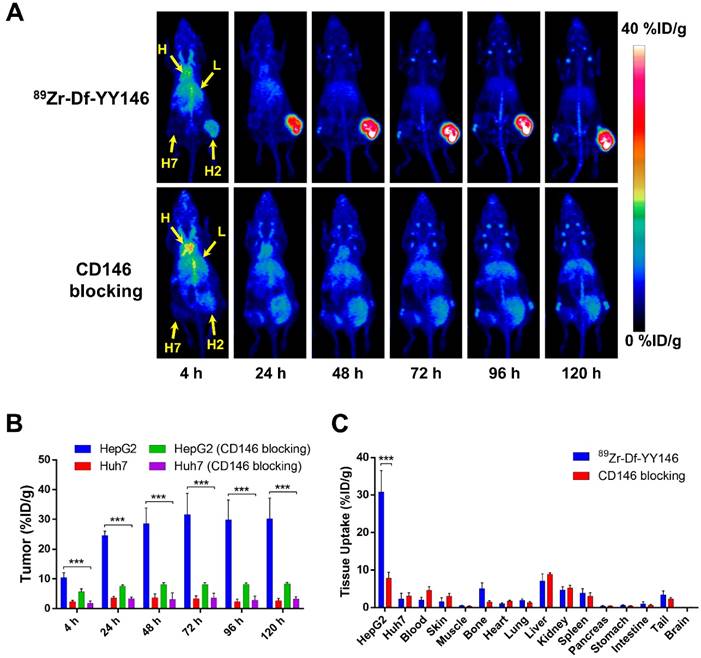
ROI analysis of the PET images was performed to determine the time-activity curves (TAC) of the heart, liver, muscle, and HepG2 and Huh7 tumors (Figure 2B, Table S1). Blood pool activity was initially elevated (13.48 ± 1.25 %ID/g at 4 h p.i.; n=4) and gradually declined with a half-life of 13.8 ± 4.7 h to a residual activity of 2.88 ± 0.84 %ID/g at 120 h p.i. (Figure S2). 89Zr-Df-YY146 accumulation in the liver was the highest at 4 h p.i. (10.00 ± 1.80 %ID/g; n=4) and slowly decreased to 5.60 ± 1.78 %ID/g at day 5 after tracer injection. Both slow blood kinetics and hepatic clearance were in line with the typical pharmacokinetics (PK) of antibodies and their derivatives [23]. Radiotracer uptake in HepG2 tumors was prominent at 4 h p.i. (10.4 ± 1.73 %ID/g) and continued ramping up until 48 h p.i., when uptake values stabilized at 28.6 ± 5.21 %ID/g. HepG2 radioactivity remained high (~30 %ID/g) for the rest of the imaging study. Conversely, Huh7 tumors showed significantly lower (P < 0.001) 89Zr-Df-YY146 uptake throughout the imaging period, with a peak uptake value of 3.70 ± 1.33 %ID/g, 48 h post administration of the radiotracer. Uptake in non-target tissues including muscle was low during the initial PET scans (0.96 ± 0.36 %ID/g, 4 h p.i.) and continued to decrease as the antibody was cleared from the body. Modest but noticeable bone uptake was observed at later time points (e.g. 96 and 120 h p.i.) indicating the presence of transchelated 89Zr. PET quantification of bone uptake was not performed due to inherent inaccuracies associated with the analysis of small structures (partial-volume effect) [24].
In vivo CD146 receptor blocking experiments demonstrated the specificity of 89Zr-Df-YY146 tumor accrual. As clearly seen in PET data (Figure 2A, B and Table S1), when mice were given a blocking dose of YY146 (50 mg/kg) prior to the injection of 89Zr-Df-YY146, a significant reduction (>70%; P < 0.001) in tracer peak uptake in HepG2 tumors (31.65 ± 7.15 vs. 8.2 ± 0.59 %ID/g) was observed. Additionally, CD146 blocking did not significantly impact the uptake of 89Zr-Df-YY146 in Huh7 tumors, which remained ~3 %ID/g.
Following terminal in vivo PET scans at 120 h p.i., mice were euthanized, and all major tissues were collected, wet-weighed, and counted in an automatic γ-counter with uptake values reported as %ID/g (mean ± SD). Ex vivo biodistribution studies served to validate the accuracy of the collected PET data and provided a more thorough characterization of 89Zr-Df-YY146's biodistribution (Figure 2C and Table S2). Excellent agreement (P >> 0.05; n=3-4) was observed between PET data acquired 120 h p.i. and ex vivo biodistribution in terms of 89Zr-Df-YY146 uptake in HepG2 (30.23 ± 6.93 vs. 30.82 ± 5.73 %ID/g) and Huh7 (2.60 ± 0.83 vs. 2.28 ± 1.57 %ID/g) tumors, liver (5.60 ± 1.78 vs. 7.08 ± 1.97 %ID/g), and blood pool (2.88 ± 0.84 vs. 1.99 ± 0.72 %ID/g). With the exception of liver, kidneys, and spleen which displayed moderated uptake (7.08 ± 1.97, 4.69 ± 0.88, 3.90 ± 1.13 %ID/g, respectively), non-target tissues exhibited very low levels of tracer accumulation (Figure 2C and Table S2). The effects of CD146 blocking were confirmed by a 75% reduction in tracer accretion noted in blocked HepG2 tumors compared to the non-blocked group. Apart from HepG2 tumors, blocking had no substantial effect on the biodistribution of 89Zr-Df-YY146 in non-target tissues. Altogether, these results attested to the excellent affinity and high CD146-specificity of 89Zr-Df-YY146 and the ability of immunoPET to examine the fate of the tracer in vivo.
Dual-modality PET/NIRF imaging of subcutaneous liver tumors
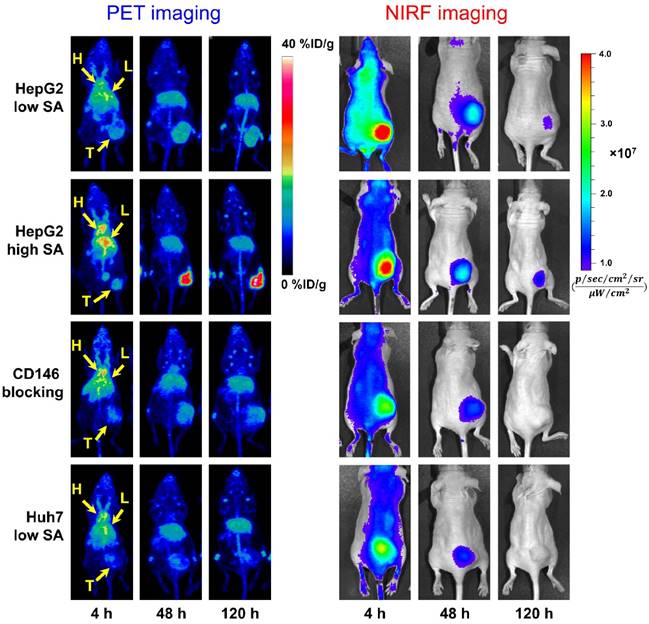
The in vivo CD146 targeting properties of 89Zr-Df-YY146-ZW800 were evaluated in mice bearing HepG2 or Huh7 tumors. The first group of mice bearing HepG2 s.c. xenografts were injected with 7.4 MBq (~400 pmol) of 89Zr-Df-YY146-ZW800 (SA: 18.5 GBq/µmol) and consecutive PET and NIRF images acquired following the previously described scan schedule; based on our previous experience a lower SA was employed in order to ensure an appropriate fluorescence signal [25]. Despite HepG2 tumors that were readily discernible at early time points by both PET and NIRF imaging (Figure 3), PET quantitative analysis revealed a significant drop in 89Zr-Df-YY146-ZW800 tumor uptake compared to that of 89Zr-Df-YY146 (15.54 ± 3.13 vs. 31.65 ± 7.15 %ID/g, at 72 h p.i.; P < 0.001 n = 5; Figure 4A; Table S1). Similar to its single labeled counterpart, 89Zr-Df-YY146-ZW800 showed elevated blood activity at 4 h p.i. and gradually cleared with a comparable half-life of 14.99 ± 5.7 h (Figure 4B; Figure S2). Liver uptake was slightly higher for 89Zr-Df-YY146-ZW800 and remained around 10 %ID/g throughout the course of the imaging study. Unlike the PET signal in HepG2 tumors, which increased steadily from early time points and reached a plateau around 15 %ID/g at 72 h p.i. (Figure S3; Table S1), tumor fluorescence was initially high but declined gradually later in the study.
Longitudinal PET/NIRF imaging study of HCC tumor-bearing athymic nude mice. A) Representative PET MIPs at 4, 48, and 120 h p.i. of 89Zr-Df-YY146-ZW800 with low SA (18.5 GBq/µmol; 400 pmol; first row), high SA (29.6 GBq/µmol; 250 pmol; second row), and high SA plus a pre-injection of YY146 blocking dose (50 mg/kg; third row), in mice implanted HepG2 s.c. xenograft (n = 3-5). Another group of mice bearing CD146-negative Huh7 tumors (bottom row) was injected the high SA tracer (n = 3). Arrows point to the heart (H), liver (L), and tumor (T). B) Sequential NIRF images acquired following PET scans described in (A). All images were acquired under similar conditions, and fluorescence is displayed as radiant efficiency (ηe).
Quantitative analysis of PET data presented in Figure 3 and ex vivo biodistribution. Image-derived time-activity curves (TAC) for tumor (A), heart/blood (B), liver (C), and muscle (D) were obtained from PET data acquired in s.c. tumor-bearing mice administered 89Zr-Df-YY146-ZW800 (n = 3-5). E) Ex vivo biodistribution, 120 h after the administration of 89Zr-Df-YY146-ZW800. Mice were euthanized after the last PET/NIRF scans and tissues were harvested, weighed, and counted (n = 3-5); biodistribution data was presented as %ID/g (mean ± SD). *** P<0.0001.
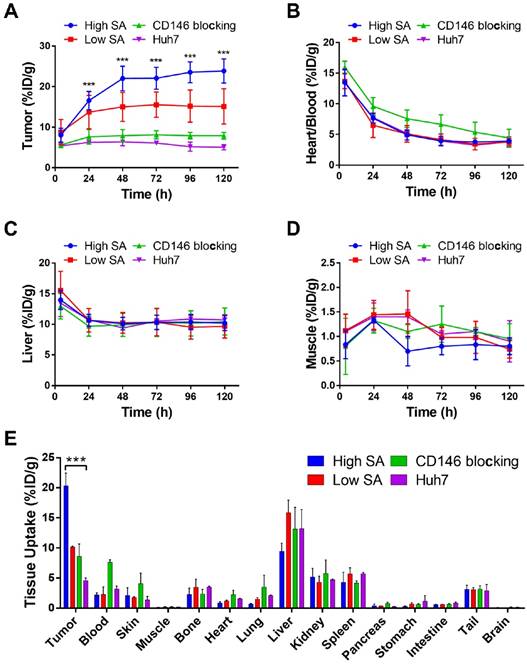
In mice administered higher SA 89Zr-Df-YY146-ZW800 (SA: 29.6 GBq/µmol), PET imaging showed markedly higher tumor radioactivity (22.07 ± 2.70 %ID/g at 72 h p.i.; n = 3) while normal tissue uptake remained comparable amongst high and low SA groups. Higher SA matching that of 89Zr-Df-YY146 (44.4 GBq/µmol) was unattainable due to smaller antibody/chelator ratio used in the preparation of 89Zr-Df-YY146-ZW800. Interestingly, the use of lower mass of the tracer did not impair the fluorescence visualization of HepG2 tumors (Figure 3; Figure S4). On the contrary, compared to low SA group, whole-body background fluorescence was reduced, and tumor signal remained higher at later time points. High SA tracer injections were employed for the rest of imaging studies.
The ratio of 89Zr-Df-YY146-ZW800 uptake in HepG2 tumors vs. CD146-negative Huh7 tumors was 1.49 ± 0.35 at 4 h p.i., and gradually increased to 3.44 ± 0.71 and 4.73 ± 0.84 at 48 h and 120 h p.i. of the tracer, respectively. Additionally, CD146 blocking with excess YY146 also resulted in reduced tumor uptake values. In line with PET scans, in vivo NIRF imaging also showed a decrease in tumor fluorescence in Huh7 and blocked HepG2 tumors compared to positive HepG2 tumors. The elevated 89Zr-Df-YY146-ZW800 PET and NIRF signal in CD146-positive tumors, together with its limited accretion in Huh7 and blocked HepG2 tumors, demonstrated the suitability of 89Zr-Df-YY146-ZW800 for highly-specific PET/optical dual modality detection of CD146 expression in liver cancer.
Following the last PET and NIRF scans 120 h p.i., mice were sacrificed and s.c. HepG2 tumors and major organs resected and imaged by ex vivo PET and NIRF (Figure S5). Overall, there was an excellent agreement between PET and NIRF images, which revealed a notably higher tumor signal, compare to the rest of tissues. Only bone showed PET signal that was not matched by fluorescence, corroborating that such radioactivity corresponds to the accumulation of free 89Zr rather than intact 89Zr-Df-YY146-ZW800.
Ex vivo gamma counting studies carried out on all imaging groups at 120 h after 89Zr-Df-YY146-ZW800 infusion (Figure 4E), indicated that of all tissue/organs only accumulation in the tumor was different amongst groups at a statistically significant level. Bone uptake was below 4 %ID/g in all groups. These results validated the magnitude and trends observed in PET imaging data and corroborated the excellent specificity and in vivo stability of 89Zr-Df-YY146-ZW800.
PET/NIRF Imaging of orthotopic HepG2 tumors
Owing to the substantial tumor accumulation of 89Zr-Df-YY146-ZW800 that resulted in excellent tumor-to-liver contrasts, we were able to delineate orthotopically implanted HepG2 tumors. HepG2 cells transfected with the luciferase (luc) reporter gene facilitated monitoring the progression of intrahepatic malignancies, noninvasively using bioluminescence imaging (Figure 5A and B). MIPs of PET images of mice bearing confirmed intra-hepatic tumors injected with high or low SA 89Zr-Df-YY146-ZW800 are shown in Figure S6. Liver nodules were clearly identified by PET as soon as 24 h p.i. in both groups, but were more evident in mice injected with the high SA tracer, for which tumor-to-liver ratios were 0.63 ± 0.13, 2.07 ± 0.64, and 2.24 ± 0.58, at 4 h, 48 h, and 120 h after 89Zr-Df-YY146-ZW800 administration, respectively (n = 4). A more detailed description of PET quantification and ex vivo biodistribution is provided as supplementary information (Figure S7; Table S1; Table S2).
In vivo bioluminescence and PET/NIRF imaging of orthotopically-implanted HepG2 tumors. A) In vitro bioluminescence imaging demonstrated the successful, stable transfection of luc2 gene into HepG2. B) The growth of orthotopic HepG2 tumors was monitored by in vivo bioluminescence imaging. PET/NIRF imaging was performed in mice with confirmed tumors, approximately 3 weeks after implantation. C) Representative MIPs of coronal and sagittal PET images, 120 h post administration of 89Zr-Df-YY146-ZW800. D) During necropsy, NIRF imaging also visualized tumor nodules with excellent spatial concordance with PET images. The red and yellow arrows point to multiple tumor nodules detected by PET and NIRF imaging.
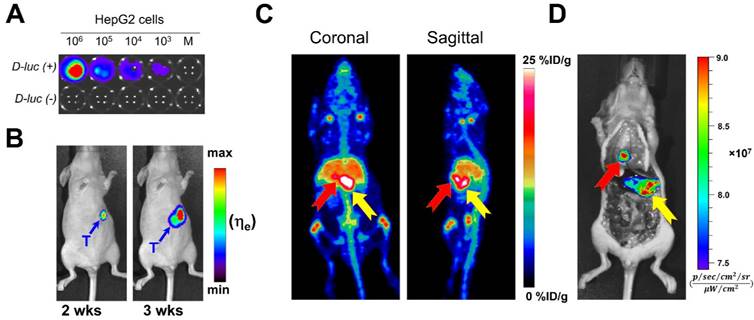
HepG2 tumor nodules were co-localized by both PET and NIRF imaging (Figure 5C), which enabled their gross three-dimensional localization by PET, then sharp delineation of very small (~ 1-2 mm in diameter) tumor masses using fluorescence imaging. These results suggest the feasibility of targeting CD146 using 89Zr-Df-YY146-ZW800 for multimodality detection and image-aided resection of hepatocellular carcinomas in a clinical setting.
Histology
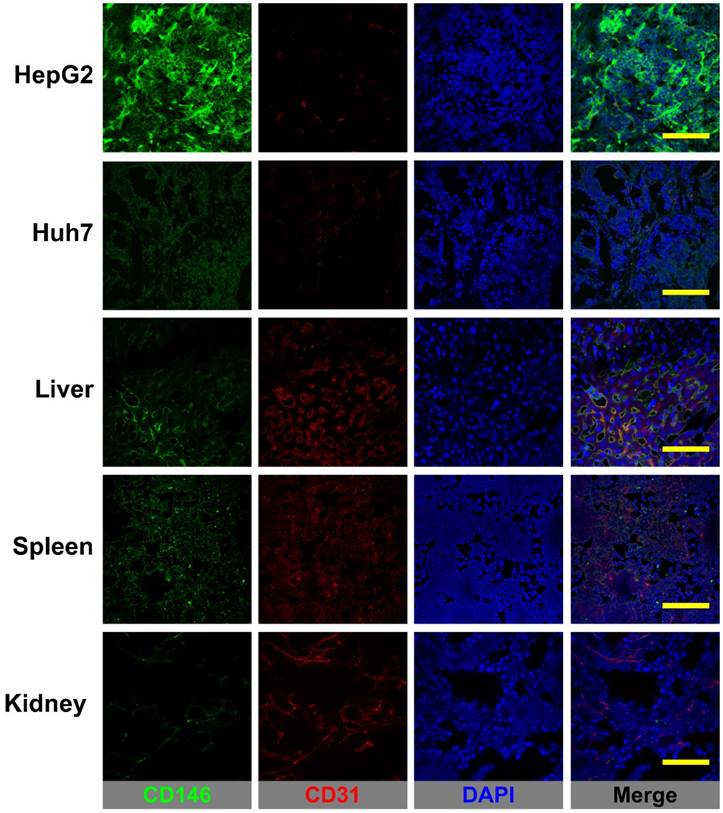
Figure 6 shows the CD146/CD31 immunofluorescence co-staining of tissue sections of HepG2 and Huh7 tumors, liver, spleen, and kidney. Prominent fluorescence signal in the green channel, corresponding to elevated levels of in situ CD146 expression were observed in HepG2 tumor slices. On the contrary, Huh7 tumors and non-target tissues exhibited very low fluorescence signal consistent with background CD146 staining. Therefore, 89Zr-Df-YY146 and 89Zr-Df-YY146-ZW800 uptake in the liver/spleen was not CD146-mediated but a result of non-specific accumulation due to tracer clearance via the reticuloendothelial system. While minimal, some levels of CD146 staining that overlapped with CD31 signal were observed in liver and spleen; these results align with previous reports describing CD146 expression within the vascular endothelium. Altogether, the results of immunofluorescence analysis successfully correlated in situ CD146 expression with the PET and biodistribution data.
CD146/CD31 immunofluorescence staining of HCC tumors, liver, spleen, and kidneys. CD146 staining (green channel) was prominent in HepG2 tumors while Huh7 tumors and normal tissues displayed only low, background staining. Some overlap between CD146 and CD31 (endothelial marker) staining was observed in the well-vascularized liver and spleen. Scale bar: 200 µm.
Discussion
Recently, we reported the in vitro overexpression of CD146 in a model of hepatocellular carcinoma [19]. In the same study, immunohistochemical analysis of patient-derived tissue samples revealed a correlation between CD146-positive staining and high histological grade HCC. In this study, we set out to develop a molecular imaging probe to noninvasively scrutinize in vivo CD146 expression in an animal model of HCC. 89Zr-Df-YY146-ZW800, a dual-modality imaging agent, was generated based on YY146, an anti-CD146 mAb, labeled with both a radionuclide (89Zr) and a fluorophore (ZW800-1) that allowed its simultaneous detection by PET and fluorescence imaging. Our dual-modality agent has the potential to positively influence the management of HCC by providing a significant improvement in tumor detection, intraoperative tumor visualization, and to monitor treatment response to both local ablative and systemic targeted therapies.
Accurate staging at diagnosis of HCC is of enormous importance since tumor stage dictates the type of standard of care patients will receive [26]. Patients at the very early and early stages of the disease are eligible for curative therapies including radiofrequency ablation, liver resection, and liver transplantation, which offer a better chance at long-term survival (50% to 70% 5-year survival rate). However, under current selection criteria, only 30% of HCC patients receive such treatment, which presses a need for improving staging guidelines to identify patient populations that might benefit from curative treatment options, but that are currently excluded. Moreover, accurate staging may also help to avoid futile liver resection, especially considering the morbidities associated with this procedure [27]. Although the implementation of noninvasive imaging techniques, including CT and MRI, has been instrumental in HCC diagnosis and surveillance of patient populations at risk, they often lack sufficient sensitivity to detect small (< 2 cm) primary or metastatic disease [28]. Additionally, anatomical imaging has limited benefit for estimating prognosis or predicting response to treatment. Instead, molecular biomarkers can potentially detect HCC during early stages and provide a more accurate characterization of disease phenotypes resulting in an earlier diagnosis, better prognostication, and treatment response prediction [29].
To date, α-fetoprotein (AFP) is the only biomarker of HCC that has been validated in randomized clinical trials [29]. However, several other candidates with potential clinical utility including des-γ-carboxyprothrombin (DCP), glypican-3 (GPC3), osteopontin, Golgi protein 73 (GP73), c-MET, and fibroblast growth factors 3 and 4 (FGF3/4) have been actively investigated. PET imaging, which has become the modality of choice to interrogate cancer phenotypes in the clinic, has been proven valuable in the management of HCC. 18F-FDG and 11C-acetate PET are advantageous for detecting extrahepatic metastasis but lacks specificity for distinguishing primary hepatic lesions. PET imaging using tracers that target HCC biomarkers can provide the necessary specificity for detecting intrahepatic lesions. Surprisingly, only GPC3 has been explored as a biomarker for targeted noninvasive PET imaging of HCC [3, 30].
Owing to a differential expression of CD146 in cancerous tissue and its correlation with tumor aggressiveness, invasion, and metastatic potential, CD146 has been evaluated as a target for imaging and therapy in a myriad of cancers [15-18]. Recently, the expression of CD146 has been reported in HCC but not in the normal liver [19]. More importantly, the work by Wang and colleagues demonstrated a significant correlation (P < 0.001; hazard ratio 3.64) between CD146 expression and shorter recurrence period and poor overall survival in HCC patients [20]. Therefore, we recognized the enormous potential of CD146 as a molecular target for noninvasive imaging and plausibly therapy of HCC. To target CD146 we employed YY146, a monoclonal antibody generated in our laboratory that showed excellent in vivo binding affinity and specificity toward CD146-expressing brain cancer. 89Zr was selected as the radionuclide due to its favorable half-life (t1/2: 78.4 h), which matches the time-scale of intact mAb pharmacokinetics, and that allows for following the tracer's biodistribution for up to a week after administration. Thanks to the high specific activity of 89Zr-oxalate and the amenable radiochemistry of 89Zr4+, 89Zr-Df-YY146 was synthesized with excellent purity and SA (44.4 GBq/μmol).
The targeting properties of 89Zr-Df-YY146 were investigated in two HCC carcinoma cell lines, HepG2 and Huh7, expressing high and low levels of CD146, respectively. In line with in vitro findings, in vivo PET imaging revealed a prominent and persistent accumulation of 89Zr-Df-YY146 in HepG2 tumors that resulted in excellent tumor-to-normal tissue ratios. Conversely, CD146-negative Huh7 tumors were not clearly discernible from the background, even at later imaging time points, confirming the correlation between 89Zr-Df-YY146 tumor uptake and CD146 expression. These results were further supported by histological analysis, where high tumor uptake was matched by strong CD146 immunofluorescence staining. The CD146-specificity of 89Zr-Df-YY146 was tested in vivo in a blocking study where mice were administered a large dose of unlabeled YY146 (50 mg/kg), 24 h prior to 89Zr-Df-YY146 injection. Significantly declined radioactivity in HepG2 tumors was witnessed upon blocking, indicating the specific character of the tumor uptake. Normal, non-target tissues exhibited low, non-specific accretion and faster clearance of 89Zr-Df-YY146, except in liver and spleen, organs that actively participate in the excretion of large biomolecules. Minimal degradation/de-metalation, indicating a robust in vivo stability of 89Zr-Df-YY146, was evidenced by the relatively low PET signal in bone, which corresponded to an uptake value of 5.01 ± 1.62 %ID/g, at day 5 after injection of the tracer. Similar bone accumulation has been observed in preclinical studies using 89Zr-labeled mAbs that have attributed such uptake to the bone-seeking nature of Zr4+ and the kinetic instability of zirconium(IV)-deferoxamine complexes [31, 32]. Despite the recent developments of novel octadentate chelators for Zr4+ with enhanced stability, to date deferoxamine remains the most amenable chelator for 89Zr-based imaging [33-35]. Interestingly, 89Zr bone depositions have not been reported in clinical studies using 89Zr-labeled radiopharmaceuticals, possibly due to significant differences in bone physiology between man and rodents [9, 36].
Surgical intervention remains the primary curative treatment for HCC [37]. However, despite the success of curative therapies, up to 80% of the patients recur within the first five years following treatment [26]. Hence, comprehensive tumor removal is vital to prolonged disease-free survival. Although real-time imaging modalities such as intraoperative ultrasonography (IUS) are currently employed for surgical resection of HCC, these have limited sensitivity for small or superficial lesions [38, 39]. Fluorescence image-guided surgery offers better sensitivity and spatial resolution for the detection of small tumor loci but requires the development of fluorescent imaging agents with suitable tumor-to-liver contrast [38]. Targeted fluorescent agents are a better alternative since adequate contrast can be achieved regardless of liver function status. In our preliminary PET imaging studies using s.c. HepG2 tumors, we observed elevated tumor-to-liver ratios (5.7 ± 1.8, at 72 h p.i.) that were propitious for imaging intrahepatic HepG2 nodules. Therefore, we recognized a window of opportunity for creating a multimodality probe that would allow highly specific detection of intrahepatic tumors using both PET and optical fluorescence imaging.
Df-YY146 was further conjugated to a fluorescence dye for PET/NIRF imaging. The zwitterionic near-infrared dye, ZW800-1 (λexc: 772 nm; λem: 788 nm) was selected as the fluorophore given its high extinction coefficient, quantum yield, enhanced tissue penetrability, and favorable pharmacokinetic properties that significantly minimize non-specific uptake in normal tissues, including the liver [40]. As seen in Figure 3, HepG2 tumors were clearly identified with PET and NIRF imaging in mice injected with 89Zr-Df-YY146-ZW800. The conjugation of the dye did not compromise the CD146-binding affinity and specificity of 89Zr-Df-YY146-ZW800, which was corroborated by a series of in vitro and in vivo studies. Compared to 89Zr-Df-YY146, the accumulation of 89Zr-Df-YY146-ZW800 in s.c. HepG2 tumors was markedly lower (31.65 ± 7.15 vs. 15.54 ± 3.13 %ID/g, at 72 h p.i.). Plausibly, the decreased uptake resulted from a tumor saturation effect due to low 89Zr-Df-YY146-ZW800 SA (18.5 GBq/μmol). Increasing SA to 29.6 GBq/μmol led to a significant (P < 0.01) recovery in tumor uptake, which peaked at 23.87 ± 2.97 %ID/g, 120 h after tracer administration. Unfortunately, due to a smaller chelator-to-antibody ratio used in preparing 89Zr-Df-YY146-ZW800, the SA could not be further increased to match that of 89Zr-Df-YY146. Higher SA not only promoted higher tumor accumulation but significantly reduced background fluorescence in NIRF images, enhancing tumor-to-normal tissue contrasts (Figure 3B).
Interestingly, we noted significant discrepancies between PET and qualitative NIRF data. While PET signal was lowest at the initial time points and progressively increased until reaching a plateau at 48 h p.i., NIRF signal was maximal at 4 h p.i. and decreased steadily throughout the imaging study. Several factors are likely to have played a role in such apparent divergence. First, the periphery of tumors is better vascularized, resulting in the diffusion of imaging tracers from the surface of the tumor inwards. Additionally, the sensitivity of fluorescence detection is hampered by limited tissue penetrability of both excitation and emission light, which limit optical detection to a few millimeters in depth [40]. As a result, as 89Zr-Df-YY146-ZW800 penetrated the tumor, a significant loss of overall fluorescence signal was observed. Finally, upon 89Zr-Df-YY146-ZW800 internalization and metabolism, 89Zr is retained inside tumor cells contributing to a persistent PET signal, while ZW800-1 is likely degraded and loses its fluorescence capabilities. Nonetheless, an excellent co-registration of PET and NIRF signal distribution was observed ex vivo, with only bone displaying PET signal that was not matched by NIRF.
Orthotopic HepG2 tumors were also visualized noninvasively using PET with excellent tumor-to-liver contrast (Figure 5C). All tumor nodules detected in the PET scans were successfully identified during intraoperative fluorescence imaging (Figure 5D). Interestingly, due to the natural darker color of normal liver, we observed a qualitative enhancement of tumor signal compared to the surrounding tissue. Given their deeper location, the detectability of orthotopic tumors during in vivo fluorescence scans (Figure S8) was very limited, which highlights the challenges of fluorescence imaging implementation in a clinical setting. Fortunately, the use of an intraoperative γ probe to detect 89Zr-Df-YY146-ZW800 radioactivity may complement fluorescence imaging. Specifically, this agent may allow surgeons to grossly map deep-sitting tumors using radioactive signals, then employ real-time NIRF imaging to determine surgical margins and assess the completeness of tumor resection. In a clinical setting, the use of 89Zr-Df-YY146-ZW800 to scrutinize CD146 expression may have ramifications in several aspects of HCC management such as early diagnosis, staging, and prognostication. Currently, we are devoting efforts to improve imaging by using antibody fragments that allow faster imaging and enhance liver contrast, and assessing YY146 potential as a targeted therapeutic agent.
Conclusion
In this study, we demonstrated the relevance of CD146 as a suitable target for noninvasive diagnosis and image-guided surgery of hepatocellular carcinomas. 89Zr-Df-YY146-ZW800 showed excellent properties as a PET/NIRF dual-modality imaging agent, including excellent in vivo CD146-affinity, specificity, and stability. Our encouraging results guarantee further exploration towards the clinical implementation of 89Zr-Df-YY146-ZW800, particularly regarding humanizing YY146 mAb.
Supplementary Material
Supplementary tables and figures.
Abbreviations
HCC: hepatocellular carcinoma; HCV: hepatitis C virus; PET: positron emission tomography; NIRF: near-infrared fluorescence; MRI: magnetic resonance imaging; CT: computer tomography; MIP: maximum intensity projection; Df: deferoxamine; SA: specific activity; s.c.: subcutaneous; 18F-FDG: 18F-fluordeoxyglucose; DCP: des-γ-carboxyprothrombin; GPC3: glypican-3; GP73: Golgi protein 73; FGF3/4: fibroblast growth factors 3 and 4.
Acknowledgements
We thank the UW-Madison small animal imaging facility (SAIF) for the continuous support. This work was financially supported by the University of Wisconsin- Madison, National Science Foundation (DGE-1256259), National Institutes of Health (NIBIB/NCI 1R01CA169365, P30CA014520, T32CA009206, T32GM008505, and 5T32GM08349), American Cancer Society (125246-RSG-13-099-01-CCE), and Strategic Priority Research Program of the Chinese Academy of Sciences (H1808-81201140).
Competing Interests
The authors have declared that no competing interest exists.
References
1. Society AC. Global Cancer Facts & Figures 3rd Edition. Atlanta: American Cancer Society. 2015
2. Torre LA, Bray F, Siegel RL, Ferlay J, Lortet-Tieulent J, Jemal A. Global cancer statistics, 2012. CA Cancer J Clin. 2015;65:87-108
3. Schraml C, Kaufmann S, Rempp H, Syha R, Ketelsen D, Notohamiprodjo M. et al. Imaging of HCC-Current State of the Art. Diagnostics (Basel). 2015;5:513-45
4. Dhir M, Melin AA, Douaiher J, Lin C, Zhen WK, Hussain SM. et al. A Review and Update of Treatment Options and Controversies in the Management of Hepatocellular Carcinoma. Ann Surg. 2016;6:1112-25
5. Raza A, Sood GK. Hepatocellular carcinoma review: current treatment, and evidence-based medicine. World J Gastroenterol. 2014;20:4115-27
6. Lan BY, Kwee SA, Wong LL. Positron emission tomography in hepatobiliary and pancreatic malignancies: a review. Am J Surg. 2012;204:232-41
7. Niendorf E, Spilseth B, Wang X, Taylor A. Contrast Enhanced MRI in the Diagnosis of HCC. Diagnostics (Basel). 2015;5:383-98
8. Jiang T, Zhu AX, Sahani DV. Established and novel imaging biomarkers for assessing response to therapy in hepatocellular carcinoma. J Hepatol. 2013;58:169-77
9. Borjesson PK, Jauw YW, Boellaard R, de Bree R, Comans EF, Roos JC. et al. Performance of immuno-positron emission tomography with zirconium-89-labeled chimeric monoclonal antibody U36 in the detection of lymph node metastases in head and neck cancer patients. Clin Cancer Res. 2006;12:2133-40
10. Reddy S, Robinson MK. Immuno-positron emission tomography in cancer models. Semin Nucl Med. 2010;40:182-9
11. Kelderhouse LE, Chelvam V, Wayua C, Mahalingam S, Poh S, Kularatne SA. et al. Development of tumor-targeted near infrared probes for fluorescence guided surgery. Bioconjug Chem. 2013;24:1075-80
12. Lutje S, Rijpkema M, Franssen GM, Fracasso G, Helfrich W, Eek A. et al. Dual-Modality Image-Guided Surgery of Prostate Cancer with a Radiolabeled Fluorescent Anti-PSMA Monoclonal Antibody. J Nucl Med. 2014;55:995-1001
13. Ishizawa T, Fukushima N, Shibahara J, Masuda K, Tamura S, Aoki T. et al. Real-time identification of liver cancers by using indocyanine green fluorescent imaging. Cancer. 2009;115:2491-504
14. Kovar JL, Simpson MA, Schutz-Geschwender A, Olive DM. A systematic approach to the development of fluorescent contrast agents for optical imaging of mouse cancer models. Anal Biochem. 2007;367:1-12
15. Liu WF, Ji SR, Sun JJ, Zhang Y, Liu ZY, Liang AB. et al. CD146 expression correlates with epithelial-mesenchymal transition markers and a poor prognosis in gastric cancer. Int J Mol Sci. 2012;13:6399-406
16. Zabouo G, Imbert AM, Jacquemier J, Finetti P, Moreau T, Esterni B. et al. CD146 expression is associated with a poor prognosis in human breast tumors and with enhanced motility in breast cancer cell lines. Breast Cancer Res. 2009;11:R1
17. Aldovini D, Demichelis F, Doglioni C, Di Vizio D, Galligioni E, Brugnara S. et al. M-CAM expression as marker of poor prognosis in epithelial ovarian cancer. Int J Cancer. 2006;119:1920-6
18. Zhang X, Wang Z, Kang Y, Li X, Ma X, Ma L. MCAM expression is associated with poor prognosis in non-small cell lung cancer. Clin Transl Oncol. 2014;16:178-83
19. Yang Y, Hernandez R, Rao J, Yin L, Qu Y, Wu J. et al. Targeting CD146 with a 64Cu-labeled antibody enables in vivo immunoPET imaging of high-grade gliomas. Proc Natl Acad Sci U S A. 2015;112:E6525-34
20. Jiang G, Zhang L, Zhu Q, Bai D, Zhang C, Wang X. CD146 promotes metastasis and predicts poor prognosis of hepatocellular carcinoma. J Exp Clin Cancer Res. 2016;35:38
21. Vosjan MJ, Perk LR, Visser GW, Budde M, Jurek P, Kiefer GE. et al. Conjugation and radiolabeling of monoclonal antibodies with zirconium-89 for PET imaging using the bifunctional chelate p-isothiocyanatobenzyl-desferrioxamine. Nat Protoc. 2010;5:739-43
22. Meares CF, McCall MJ, Reardan DT, Goodwin DA, Diamanti CI, McTigue M. Conjugation of antibodies with bifunctional chelating agents: isothiocyanate and bromoacetamide reagents, methods of analysis, and subsequent addition of metal ions. Anal Biochem. 1984;142:68-78
23. Lobo ED, Hansen RJ, Balthasar JP. Antibody pharmacokinetics and pharmacodynamics. J Pharm Sci. 2004;93:2645-68
24. Soret M, Bacharach SL, Buvat I. Partial-volume effect in PET tumor imaging. J Nucl Med. 2007;48:932-45
25. Chen F, Nayak TR, Goel S, Valdovinos HF, Hong H, Theuer CP. et al. In vivo tumor vasculature targeted PET/NIRF imaging with TRC105(Fab)-conjugated, dual-labeled mesoporous silica nanoparticles. Mol Pharm. 2014;11:4007-14
26. Guy J, Kelley RK, Roberts J, Kerlan R, Yao F, Terrault N. Multidisciplinary management of hepatocellular carcinoma. Clin Gastroenterol Hepatol. 2012;10:354-62
27. Reeves HL, Aisen AM. Hepatocellular carcinoma: optimal staging impacts survival. Gastroenterology. 2015;148:1274-6
28. Bellissimo F, Pinzone MR, Cacopardo B, Nunnari G. Diagnostic and therapeutic management of hepatocellular carcinoma. World J Gastroenterol. 2015;21:12003-21
29. Chaiteerakij R, Addissie BD, Roberts LR. Update on biomarkers of hepatocellular carcinoma. Clin Gastroenterol Hepatol. 2015;13:237-45
30. Yang X, Liu H, Sun CK, Natarajan A, Hu X, Wang X. et al. Imaging of hepatocellular carcinoma patient-derived xenografts using (8)(9)Zr-labeled anti-glypican-3 monoclonal antibody. Biomaterials. 2014;35:6964-71
31. Holland JP, Divilov V, Bander NH, Smith-Jones PM, Larson SM, Lewis JS. 89Zr-DFO-J591 for immunoPET of prostate-specific membrane antigen expression in vivo. J Nucl Med. 2010;51:1293-300
32. Chang AJ, De Silva RA, Lapi SE. Development and characterization of 89Zr-labeled panitumumab for immuno-positron emission tomographic imaging of the epidermal growth factor receptor. Mol Imaging. 2013;12:17-27
33. J NT, Pandya DN, Pailloux SL, Ogasawara A, Vanderbilt AN, Gill HS. et al. Evaluation of a 3-hydroxypyridin-2-one (2,3-HOPO) Based Macrocyclic Chelator for (89)Zr(4+) and Its Use for ImmunoPET Imaging of HER2 Positive Model of Ovarian Carcinoma in Mice. Theranostics. 2016;6:511-21
34. Patra M, Bauman A, Mari C, Fischer CA, Blacque O, Haussinger D. et al. An octadentate bifunctional chelating agent for the development of stable zirconium-89 based molecular imaging probes. Chem Commun (Camb). 2014;50:11523-5
35. Abou DS, Ku T, Smith-Jones PM. In vivo biodistribution and accumulation of 89Zr in mice. Nucl Med Biol. 2011;38:675-81
36. Jilka RL. The relevance of mouse models for investigating age-related bone loss in humans. J Gerontol A Biol Sci Med Sci. 2013;68:1209-17
37. Rahbari NN, Mehrabi A, Mollberg NM, Muller SA, Koch M, Buchler MW. et al. Hepatocellular carcinoma: current management and perspectives for the future. Ann Surg. 2011;253:453-69
38. Liu Y, Zhao YM, Akers W, Tang ZY, Fan J, Sun HC. et al. First in-human intraoperative imaging of HCC using the fluorescence goggle system and transarterial delivery of near-infrared fluorescent imaging agent: a pilot study. Transl Res. 2013;162:324-31
39. Vahrmeijer AL, Hutteman M, van der Vorst JR, van de Velde CJ, Frangioni JV. Image-guided cancer surgery using near-infrared fluorescence. Nat Rev Clin Oncol. 2013;10:507-18
40. Choi HS, Nasr K, Alyabyev S, Feith D, Lee JH, Kim SH. et al. Synthesis and in vivo fate of zwitterionic near-infrared fluorophores. Angew Chem Int Ed Engl. 2011;50:6258-63
Author contact
![]() Corresponding authors: Yunan Yang or Weibo Cai.
Corresponding authors: Yunan Yang or Weibo Cai.