Impact Factor
- Issue 14; 2026
- Issue 13; 2026
- Issue 12; 2026
- Issue 11; 2026
- Issue 10; 2026
- Volume 16; 2026
- Advance Articles
- Past Issues
- Cover Images
- Cover Suggestion
- Index & Coverage
- Special Issues
Introduction
Results and Discussion
Conclusion
Materials and methods
Supplementary Material
References
International Journal of Biological Sciences
International Journal of Medical Sciences
 Global reach, higher impact

Theranostics 2016; 6(12):2039-2051. doi:10.7150/thno.17098 This issue Cite
Research Paper
Size Dependent Kinetics of Gold Nanorods in EPR Mediated Tumor Delivery
Xiao Tong, Zhantong Wang, Xiaolian Sun, Jibin Song, Orit Jacobson, Gang Niu, Dale O. Kiesewetter, Xiaoyuan Chen ![]()
Laboratory of Molecular Imaging and Nanomedicine, National Institute of Biomedical Imaging and Bioengineering, National Institutes of Health, Bethesda, Maryland 20892, United States.
Received 2016-8-3; Accepted 2016-9-1; Published 2016-9-9
Abstract

Gold nanorods (AuNR) have been intensively used in nanomedicine for cancer diagnostics and therapy, due to their excellent plasmonic photothermal properties. Tuning the size and aspect ratio of AuNR tailors the localized surface plasmon resonance (LSPR) in the NIR spectrum at which biological tissues are transparent, thus enables specific and effective treatment. The AuNR extravasates into tumor interstitium through enhanced permeation and retention (EPR) effect. Efficient AuNR based cancer therapy requires efficient AuNR tumor delivery. However, the size of AuNR can dramatically affect its blood circulation and tumor accumulation. Here we proposed for the first time a systematic framework to investigate the size-dependent kinetics of AuNRs during EPR mediated tumor delivery. By using 64Cu-labeled AuNRs with positron emission tomography (PET) and kinetic modeling, the in vivo uptake and kinetics of 64Cu-AuNR during its blood circulation, tumor accumulation and elimination were studied both in vitro and in vivo. The results of different sized AuNRs were compared and the optimum size of AuNR was suggested for EPR mediated tumor delivery. Our study provides a better understanding of the in vivo behavior of AuNR, which can help future design of nanomaterials for cancer imaging and therapy.
Keywords: gold nanorods, enhanced permeation and retention (EPR) effect, positron emission tomography (PET), kinetic modeling
Introduction
Using nano-sized particles as the “nanocarrier” to load drug molecules has become an important strategy in intravascular drug delivery [1, 2]. A variety of nano-sized diagnostic and therapeutic agents have been developed for clinical applications [3-5]. Unlike the small molecular chemotherapeutic drugs, nanoparticles based drugs cannot get into healthy tissues due to the smaller junctions of the endothelial lining but permeate into the tumor tissue via the leaky endothelium, and stay within the diseased tissue due to the compromised lymphatic drainage of the tumor. This phenomenon is known as enhanced permeation and retention effect (EPR) [6], and has been considered as the fundamental for nanomedicine drug delivery in solid tumor. However, the nanoparticles can be recognized and eliminated by liver and macrophage phagocytic system (MPS) [7, 8] during blood circulation or excretion by renal system for those smaller than 5 nm [9]. Efficient tumor delivery through EPR effect requires nanoparticles to evade the MPS elimination and circulate in blood for sufficient time a priori. The enhanced angiogenesis and the lack of functional intratumoral lymphatic vessels in solid tumor thus reduced clearance of leaked particles [10] will also favor the tumor accumulation of nanoparticles through EPR. The criteria of designing nanoparticle for efficient delivery in solid tumor therefore include prolonged circulation half-life, enhanced EPR effect for high tumor accumulation and low uptake by liver and MPS [7, 10].
Among various nanoplatforms investigated, gold nanoparticles (AuNPs) have been extensively used in a wide range of biomedical applications due to their unique surface, optical and electrical properties [11, 12]. Researches have been prompted to study how different properties of gold nanoparticles have affected their interaction with the biological environment and eventually their homing to tumor. Studies have been focusing on the surface coating of the gold nanoparticles, which can be modified to achieve optimized targeting [13-16]. The surface coating with poly(ethylene glycol) (PEG) prevented protein serum binding and plasma clearance by macrophages [17], thus prolonged blood circulation of AuNPs therefore increased drug concentration in tumor by 10- to 100-fold compared with the use of non-PEGylated free drug [18]. Besides surface coating, the size and shape also dramatically affect the circulation, biodistribution and tumor accumulation of the gold nanoparticles. Several studies have been reported to address this issue [17, 19-21]; however, the majority of size-dependent studies were focusing on spherical AuNPs.
Rod shaped gold nanoparticles have attracted increasing scientific attention for their unique optical and photothermal properties and promising applications in the field of cancer imaging, drug delivery and cancer therapy [22-24]. Because of the anisotropic shape, gold nanorods (AuNRs) can be characterized by two localized surface plasmon resonance (LSPR) bands [24]: the transvers band located in the visible spectrum at 520 nm; the longitudinal band which varies with the aspect ratio of the AuNR [25, 26]. Tuning the size and aspect ratio of the AuNRs allows to tailor the LSPR in the NIR range at which biological tissues are relatively optically transparent [27], in particular for photothermal and photodynamic therapy, thus specific and effective treatment may be possible. The effect of the size of AuNR on its plasmon resonance and the photothermal therapeutic efficacy has been studied in vitro [28]. However, therapy efficacy requires efficient intravascular delivery and tumor extravasation of AuNR, it is extremely important to understand the effect of size and aspect ratio of the AuNRs on its kinetics and tissue uptake during intravascular circulation, MPS elimination and tumor accumulation.
The effect of the aspect ratio on nanorod biodistribution and tumor homing has been studied with nucleoprotein based nanorods in vivo with fluorescence imaging. Meanwhile the kinetics of blood circulation and tumor accumulation has been investigated with theoretical simulation and in vitro with copper oxide nanorod conducted under ideal experimental conditions [29, 30]. However, the rigid soft-matter nucleoprotein nanorod and copper oxide nanorod would behave very differently from AuNRs, thus their results may not be extrapolated directly to the case of AuNRs; The size effect of AuNR on the in vivo kinetics yet remains unclear. Developing a quantitative framework to investigate the size effect on the EPR mediated tumor delivery kinetics is crucial to guide the design of AuNR based drug delivery system and its application in anti-cancer therapy. Due to the small size and complex interaction with biological environment, it is very challenging to visualize and quantify the AuNR intravenously injected into biological system in vivo. The fluorescently labeled nanoparticles enable the accessibility of imaging the biodistribution and kinetics of the nanoparticles in vivo [17], however, the poor tissue penetration and the lack of accuracy for three-dimensional image quantification offered by in vivo optical imaging can restrain its application in nanomedicine. The development of radiolabeled nanoparticles provides a high sensitivity, high spatial, and high temporal resolution imaging technique for better quantifying nanoparticles in vivo [31, 32].
In the present study, by using positron emission tomography (PET) with 64Cu-labeled PEGylated AuNR, we have provided for the first time in vivo systematic frame work to investigate the size dependent kinetics of AuNRs during their tumor delivery. In analyzing the time-dependent in vivo uptake of different sizes of AuNR in major organs with kinetic modeling, we were able to interpret how the size of AuNR could affect the in vivo kinetics during blood circulation, MPS elimination and tumor accumulation, and eventually suggest the optimal size of AuNR for potentially more efficient EPR mediated tumor delivery.
Results and Discussion
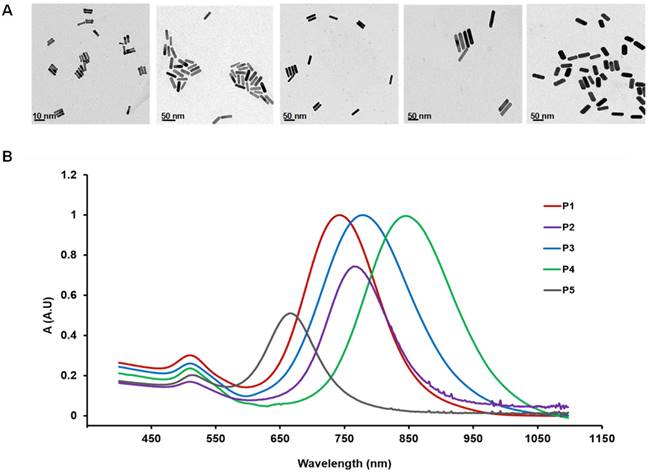
AuNR of five different sizes (Table 1) were used in the present study. The volume of the AuNR (Vrod) measured from TEM image (Figure 1A) was in the order of: P1 < P2 < P3 < P4 < P5 and the aspect ratio was in the order of P5 < P3 < P2 < P1 < P4. The UV absorption spectra of the five AuNRs were characterized and shown in Figure 1B. The theoretical diffusion parameter Mdiff given by Eq. 2 was calculated for each sized AuNR (Table 2). Mdiff was in power regression with the Vrod (Figure S1D), indicating that smaller AuNR reveal higher diffusiveness. The theoretical margination (Mmarg) of the nanorods was inversely proportional to the nanorod volume (Eq. 4). Therefore, smaller AuNR is expected to have higher margination capacity. However, these relations were restrained to theoretical assumption based on in vitro studies under ideal conditions [29, 33]. The cytotoxicity study (Figure S2) showed that all the AuNRs were safe for in vivo use. Ex vivo biodistribution study (Figure S3) at 48 h post injection was used to evaluate the in vivo uptake measured in PET. Positive correlation was found between the in vivo PET uptake and ex vivo biodistribution result (r > 0.6, p < 0.001).
The sizes of the five AuNRs (P1, P2, P3, P4, P5) used in the present study. The dimension values are mesured with TEM images.
| P1 | P2 | P3 | P4 | P5 | |
|---|---|---|---|---|---|
| Dimension (nm×nm) | 2×10 | 10×37 | 13×40 | 13×70 | 18×45 |
| Volume (nm3) | 31.42 | 2906 | 5309 | 9291 | 11451 |
| Aspect ratio | 5 | 3.7 | 3 | 5.5 | 2.5 |
A) TEM image of the five AuNRs. From left to right: P1: 2×10 nm, aspect ratio 5; P2: 10×37 nm, aspect ratio 3.7; P3: 13×40 nm, aspect ratio 3; P4: 13×70 nm, aspect ratio 5.5; P5: 18×45 nm, aspect ratio 5. B) UV-vis absorption spectra of the five AuNRs.
Summary of different kinetics parameters calculated from compartmental modeling for each sized AuNR. The parameter values for all individual mouse (M1 to M5 represent the mouse 1 to mouse 5 used for each size of AuNR) are presented with the mean and STD values for each group of AuNR size.
| Size (nmxnm) | Mdiff | Blood half life (h) | Tumor AUC (%ID*h/g) | Uptake @ 24 h (%ID/g) | Uptake @ 48 h (%ID/g) | Max uptake (%ID/g) | K1 (h-1) | k2 (h-1) | VD | ||
|---|---|---|---|---|---|---|---|---|---|---|---|
| P1 | M1 | 2x10 | 0.055 | 12.78 | 288.9 | 5.92 | 5.31 | 7.80 | 0.25 | 0.089 | 2.77 |
| M2 | 17.99 | 210.9 | 5.00 | 4.65 | 5.00 | 0.10 | 0.044 | 2.28 | |||
| M3 | 15.01 | 242.7 | 6.20 | 5.15 | 6.20 | 0.17 | 0.069 | 2.48 | |||
| M4 | 18.06 | 260.6 | 5.51 | 5.70 | 5.70 | 0.13 | 0.092 | 1.44 | |||
| M5 | 15.52 | 187.5 | 4.11 | 4.32 | 4.32 | 0.15 | 0.105 | 1.42 | |||
| mean | 15.87 | 238.1 | 5.35 | 5.02 | 5.80 | 0.16 | 0.080 | 2.08 | |||
| STD | 1.11 | 20.02 | 0.41 | 0.27 | 0.90 | 0.03 | 0.012 | 0.31 | |||
| P4 | M1 | 10x37 | 0.012 | 17.05 | 2.10E+02 | 5.17 | 4.06 | 5.17 | 0.14 | 0.116 | 1.94 |
| M2 | 15.00 | 2.19E+02 | 5.19 | 4.59 | 5.19 | 0.21 | 0.083 | 3.58 | |||
| M3 | 12.84 | 1.73E+02 | 3.87 | 3.76 | 3.91 | 0.22 | 0.054 | 3.55 | |||
| M4 | 16.17 | 1.80E+02 | 4.22 | 4.11 | 4.22 | 0.22 | 0.070 | 2.56 | |||
| M5 | 13.92 | 1.95E+02 | 4.63 | 4.08 | 4.63 | 0.23 | 0.061 | 2.51 | |||
| mean | 15.00 | 195.4 | 4.62 | 4.12 | 4.62 | 0.20 | 0.075 | 2.83 | |||
| STD | 0.84 | 9.72 | 0.29 | 0.15 | 0.29 | 0.02 | 0.0105 | 0.36 | |||
| P2 | M1 | 13x40 | 0.009 | 11.26 | 197.3 | 4.65 | 3.81 | 4.69 | 0.20 | 0.110 | 1.94 |
| M2 | 11.87 | 170.5 | 4.22 | 3.25 | 4.22 | 0.29 | 0.069 | 3.93 | |||
| M3 | 12.82 | 244.2 | 5.85 | 5.00 | 5.85 | 0.19 | 0.097 | 2.90 | |||
| M4 | 9.62 | 149.1 | 3.40 | 2.82 | 3.96 | 0.18 | 0.086 | 2.78 | |||
| M5 | 13.28 | 218.5 | 4.99 | 4.27 | 4.99 | 0.15 | 0.071 | 2.52 | |||
| mean | 11.77 | 195.9 | 4.62 | 3.83 | 4.74 | 0.21 | 0.086 | 2.81 | |||
| STD | 0.72 | 18.9 | 0.45 | 0.43 | 0.45 | 0.03 | 0.008 | 0.36 | |||
| P3 | M1 | 13x70 | 0.008 | 7.00 | 201.4 | 4.50 | 3.86 | 4.64 | 0.21 | 0.053 | 2.53 |
| M2 | 8.55 | 294.9 | 6.59 | 5.35 | 7.06 | 0.27 | 0.066 | 3.12 | |||
| M3 | 7.85 | 264.0 | 5.95 | 3.91 | 6.83 | 0.28 | 0.107 | 2.09 | |||
| M4 | 8.625 | 227.3 | 4.85 | 4.80 | 4.98 | 0.24 | 0.128 | 1.72 | |||
| M5 | 10.50 | 171.2 | 3.67 | 3.53 | 3.76 | 0.18 | 0.139 | 1.61 | |||
| mean | 8.51 | 231.8 | 5.11 | 4.29 | 5.45 | 0.24 | 0.099 | 2.22 | |||
| STD | 0.65 | 24.5 | 0.58 | 0.38 | 0.75 | 0.02 | 0.019 | 0.31 | |||
| P5 | M1 | 18x45 | 0.006 | 5.14 | 218.8 | 5.00 | 3.73 | 5.14 | 0.35 | 0.100 | 3.49 |
| M2 | 5.01 | 179.8 | 4.02 | 3.41 | 4.18 | 0.49 | 0.181 | 2.70 | |||
| M3 | 6.36 | 187.3 | 4.16 | 3.39 | 4.60 | 0.40 | 0.160 | 2.51 | |||
| M4 | 8.09 | 168.5 | 3.77 | 3.15 | 4.15 | 0.36 | 0.142 | 2.53 | |||
| M5 | 6.99 | 152.5 | 3.55 | 3.04 | 3.55 | 0.32 | 0.149 | 2.18 | |||
| mean | 6.32 | 181.4 | 4.10 | 3.34 | 4.33 | 0.39 | 0.147 | 2.68 | |||
| std | 0.65 | 12.3 | 0.28 | 0.13 | 0.29 | 0.03 | 0.015 | 0.25 |
Kinetics model for EPR mediate AuNR tumor delivery
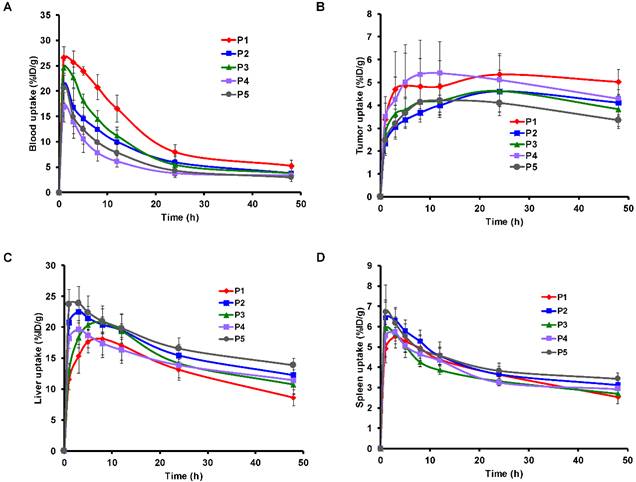
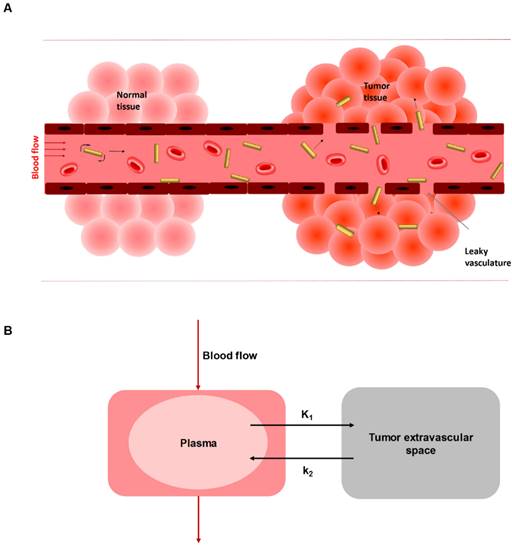
The time activity curves (TAC) of heart, tumor, liver, and spleen (Figure 3, Figure S5-S8) were generated from the reconstructed sequential PET images (Figure S4). In order to accurately quantify the in vivo kinetics of AuNR during the blood circulation, the MPS elimination and tumor accumulation through EPR effect based on the in vivo PET data, the first step is to define an appropriate kinetic model. Wong et al. has suggested a three-compartment model to assess the EPR effect on tumor uptake of small molecule drug doxorubicin and the nano-sized liposome loaded drug Doxil [34]. This model consisted of a central compartment for blood pool and two peripheral compartments in separating the uptake kinetics in normal tissue and in tumor, since small molecules could extravasate not only through tumor leaky vasculature but also 'diffuse' through the vessel endothelium of normal tissue. However, in our case it was not necessary to separate two compartments for normal and tumor tissue, as AuNR was considered to be impermeable in normal tissue. Stapleton et al. has also proposed a model of EPR effect of liposome transport in solid tumor [35]. This model only distinguished two components: blood and tumor. Therefore, in our study, a conventional reversible two-compartment model was used (Figure 2) to assess the kinetics of EPR mediated tumor delivery, with one central compartment representing the 64Cu-AuNR concentrations in the blood, and the other peripheral compartment for concentration in tumor extravascular space.
Time activity curves of the mean uptake of 64Cu-AuNR in the heart (A), tumor (B), liver (C) and spleen (D) derived from the region of interest (ROI) analysis of the PET images. The TAC of different sized AuNRs (P1 to P5) are presented respectively in blue, red, green, purple and dark gray. The uptake value at each time point is expressed as mean ± STD.
A) Schematic illustration of enhanced permeation and retention effect (EPR) in solid tumor where AuNRs extravasate from blood circulation through leaky endothelium. B) The reversible two-compartment model used to study the kinetics of AuNR between plasma and tumor extravascular space during EPR mediated tumor delivery.
Size-dependent blood circulation and MPS elimination of 64Cu-AuNR
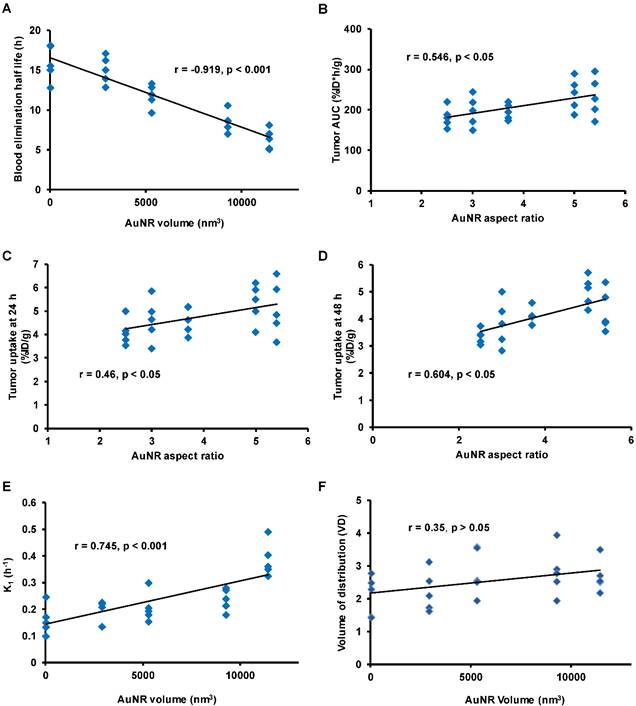
As mentioned previously, the prior condition for efficient EPR mediated tumor delivery is sufficiently long blood circulation in evading the MPS elimination. The blood circulation is generally characterized by blood uptake over time and the blood elimination half-life (T1/2). In comparing the mean blood TAC of each size of AuNR (Figure 3A), the smallest AuNR P1 showed the highest mean blood retention over the entire 48 h period (U test p < 0.05 from 3 h to 48 h post injection); the P4 and P5 which were the two largest in volume had the lowest mean blood retention, blood retention of the median size P2 and P3 located in between. At each time point, there was a negative dependence between the blood uptake and AuNR volume (r negative, |r| > 0.5, p < 0.05). The T1/2 of each AuNR (Table 2) was calculated by fitting the blood TAC with equation Eq. 6. A strong linear correlation was found between the T1/2 and the Vrod (Figure 4A, r = -0.919, p < 0.001), indicating that AuNR of smaller volume preferably circulate in blood for longer time. This may be due to the higher diffusiveness of smaller AuNR (Mdiff in power regression with Vrod, Figure S1D). Previous studies also showed that smaller AuNP revealed longer blood circulation than the larger ones regardless of whether the AuNPs were PEGylated [36, 37] or not [38]. Besides, Discher et al. also mentioned that high aspect ratio nanoparticles tend to align themselves to the flow streamline and avoid engulfment by macrophages thus remain in blood circulation for a long period of time [39]. In our study, the smallest P1 also exhibited high aspect ratio, which could further give favor to its long circulation in the blood. However, no correlation was found between the aspect ratio of AuNR with the T1/2 or the blood uptake of each time point, e.g. the P4 has the highest aspect ratio but not the longest T1/2. This indicated that blood circulation of AuNR was dominantly affected by its volume rather than the aspect ratio. We can thus conclude that smaller AuNR with high aspect ratio is preferred if we need AuNR to have longer T1/2 for longer blood circulation.
A): The correlation between blood elimination half-life and the volume of AuNR (Vrod). B-D):The correlation between the aspect ratio of AuNR with the tumor AUC (B), the tumor uptake at 24 h (C) and at 48 h post-injection (D). E-F): The correlation between the volume of AuNR (Vrod) with trans-endothelium kinetics constant K1 (E) and volume of distribution VD (which is given by K1 /k2) (F). The Pearson correlaiton coefficient r and the significance p value are presented for each correlation.
During the blood circulation, a part of AuNRs are uptaken by the MPS as a response of the immune system [40]. At early time, P1 and P3 revealed relatively less accumulation in the liver (Figure 3C), which was presumably due to their relatively high blood uptake (Figure 3A) especially at early time points. For spleen TAC (shown in Figure 3D), the time to reach maximum spleen uptake was not significantly different among different sizes of AuNR. Over the 48 h post injection period, the largest AuNR P5 exhibited the highest uptake both in liver and spleen (Figure 3C, 3D), while P1 showed the lowest in the liver. This corroborates with previous in vivo studies that larger AuNP were cleared faster than the smaller ones from blood by MPS [17, 19, 21]. However, there was no significant correlation between in vivo liver and spleen uptake with all five sizes of AuNR, indicating that the MPS elimination of AuNR is statistically independent of the size of AuNR, at least for the AuNR sizes involved in this study.
However, the decrease in mean liver and spleen uptake from 24 h to 48 h p.i. (Figure 3C, 3D) was more significant in P1 (ca. 35% for liver, 25% for spleen, p < 0.05) than the larger ones (ca. 15-20 % for liver, 5% for spleen), revealing that the excretion of P1 (the smallest) from MPS was faster than the larger sized AuNRs. This fast clearance from MPS has also been reported previously and has been considered as an advantage for small sized AuNP for reducing toxicity to biological systems [36, 37]. Interestingly, we also observed that not only small AuNR but also AuNR of high aspect ratio (example of P4 with highest aspect ratio), despite of its large volume, was still capable of evading the MPS elimination (Figure 3B-C) and staying in blood circulation for improved tumor uptake [19].
Size dependent EPR mediated tumor delivery of 64Cu-AuNR
When AuNR reach tumor site through blood circulation, it first needs to marginate towards the vessel wall in order to translocate to tumor extravascular space through vascular leakage. The transportation kinetics from blood to tumor and vice versa were represented by the kinetics rate constant K1 and k2, respectively. According to theoretical equations (Eq. 3 and 4) derived from in vitro experiment [33], smaller AuNR is expected to have stronger margination due to faster Brownian motion and higher diffusiveness [19], consequently smaller AuNRs are supposed to have higher trans-endothelium kinetics. Previous studies also suggested that the margination of nanorod increased with higher aspect ratio [19, 41]. However, a contradictory result has been observed in our in vivo study. The trans-endothelium kinetics K1 was positively correlated (Figure 4E, r = 0.745, p < 0.001) with the Vrod, indicating that larger AuNR extravasated faster from tumor vasculature. The correlation between the Vrod and the reverse kinetics (leakage of AuNR from tumor back to blood) k2 was also moderately positive (r=0.47, p<0.05). However, there was no significant correlation (Figure 4F, r = 0.35, p > 0.05) between the Vrod and the volume of distribution VD at equilibrium, where VD is given by K1/k2. The VD takes account both the inbound and outbound kinetics of AuNR trans-endothelium movement and can describe the net influx rate of AuNR tumor delivery at equilibrium as a result of the EPR effect. Therefore, it is more accurate to use VD for evaluating the AuNR kinetics rate related to the EPR effect. The independence between Vrod and VD indicated that for the AuNR size involved in our study, although larger sized AuNR potentially exhibited higher unidirectional kinetics from blood to tumor, net trans-endothelium kinetics rate through EPR effect was insensitive to the variation of the AuNR size. Moreover, no significant correlation was found between kinetics rates and the aspect ratio of AuNR. These discrepancies between our findings and previous in vitro studies might be due to the fact that in vitro studies were carried out under ideal red blood cell free system [19], whereas it did not take into account the complex interaction of AuNR with other components present in blood. Furthermore, the trans-endothelium movement of AuNRs through EPR effect involves not only the margination of the AuNRs, but also their chance to be released through the vasculature leakage.
After getting into the tumor extravascular space, we have characterized the retention of the AuNR in the tumor by using the AuNR's total tumor residence time (tumor AUC) and tumor uptake at later time points (24 h and 48 h). The P1 and P4 have shown higher tumor uptake over the 48 h p.i. compared to the other sizes of AuNR (Figure 3B). The tumor AUC was strongly correlated with the tumor maximum uptake (Figure S1A, r = 0.96, p < 0.001), with the tumor uptake at 24 h p.i. (Figure S1B, r = 0.95, p < 0.001) and at 48 h p.i. (Figure S1C, r = 0.85, p < 0.001), therefore any size-dependent correlation related to tumor AUC would also be considered to be related to tumor maximum uptake and tumor uptake at 24 h and 48 h. Moderate correlations were found between aspect ratio of AuNR with tumor AUC (Figure 4B, r = 0.546, p < 0.05) thus with the tumor uptake at 24 h p.i. (Figure 4C, r = 0.46, p < 0.05) and 48 h p.i. (Figure 4D, r = 0.604, p < 0.05) as well. However, there was no correlation between these tumor retention parameters and the Vrod. The correlation with the aspect ratio of AuNR may be explained by the study by Arnida et al. [42], in which they compared the in vivo tumor accumulation of spherical AuNP and AuNR. They found that AuNR exhibited much higher tumor uptake than spherical AuNP. The anisotropic structure of AuNR appears to be advantageous over the isotropic AuNP counterpart in tumor accumulation [42]. Considering the isotropic AuNP as an exceptional case of anisotropic nanoparticle with extremely low aspect ratio, then the anisotropic AuNR of higher aspect ratio is suggested to have higher tumor accumulation than the AuNR of lower aspect ratio.
A major concern is the high inter-subject variation of tumor uptake observed for all size of AuNR at different time points. When comparing the TAC of each individual mouse within each size of AuNR (Figure S5), high inter-subject variation of tumor uptake over time was observed especially at early time points before 24 h p.i. Consequently, it resulted in high standard deviation for the mean TAC of each size (Figure 3B), therefore the differences in tumor uptake between different sizes of AuNR seemed to be less significant. We further used Mann-Whitney U test [43] to compare and evaluate the differences in the mean tumor uptake of AuNR with different sizes at each time point. The results of U test (Table S1) showed that the difference in tumor uptake was generally not significant among different sizes of AuNR, except at certain time points (marked in red in Table S1 when p < 0.05).
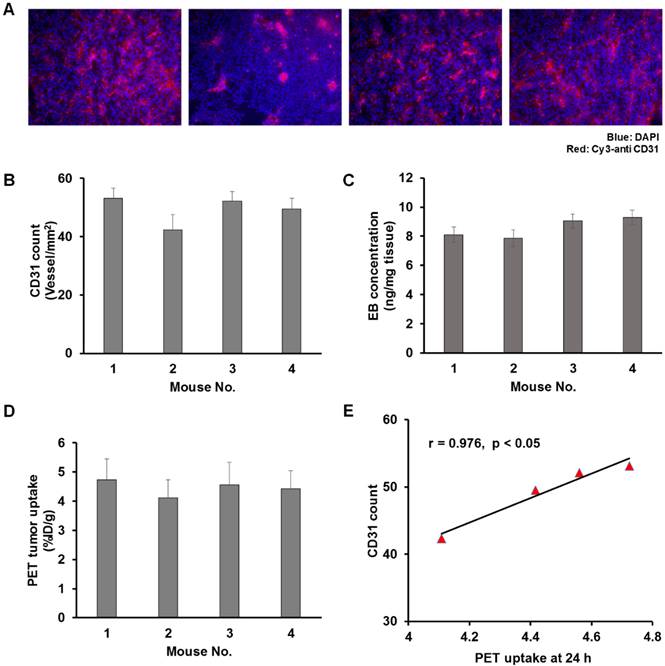
The high inter-subject variation may have also contributed to the weak or none correlation observed between the size of AuNR and its tumor retention and trans-endothelium kinetics. Previously Stapleton et al. defined their EPR model in considering the vascular permeability and the interstitial fluid pressure (which was also related to the vascular permeability) [35]. We then questioned whether the inter-subject variation on tumor uptake could be related to the intrinsic microenvironment of tumor vasculature. A separate group of U87MG tumor-bearing mice (n = 4) were thus used to compare the in vivo PET tumor uptake with the ex vivo tumor vascular density (CD31 staining, Figure 5A-B) and tumor vascular permeability (EB count, Figure 5C). 64Cu-AuNRs of two different sizes (P3, P4) were randomly selected and injected into mice. CD31 staining and EB extraction were performed after PET scanning at 24 h p.i. to evaluate the tumor vascular density and vascular permeability. In comparing the in vivo PET tumor uptake (Figure 5D) of the four mice with the ex vivo results of CD31 (Figure 5A-B) and EB staining (Figure 5C), a strong correlation was found between the in vivo tumor uptake and the CD31 staining count (Figure 5E, r = 0.976, p < 0.05). However, there was no correlation between the in vivo tumor uptake and EB staining. This result indicated that high (low) in vivo tumor uptake could be a result of abundant (insufficient) tumor vasculature, while the vascular permeability, for one single type of tumor, was rather independent of the in vivo tumor uptake of AuNR. This is possibly due to the fact that for the five sizes of AuNR used in our study, the size of vascular leakage is much larger [44] than the size of AuNR, thus the possibility of different sized AuNR being able to escape through the leaky vasculature is virtually the same. With relatively similar possibility of extravasation through EPR for different sized AuNR, the differences in tumor uptake would be related to the degree of vascularization present in each particular tumor. It would be necessary to have larger difference in size of AuNR to observe more significant difference in size related tumor uptake.
A) Microscopic images of CD31 staining (left to right: staining image of tumor harvested from mouse 1 to mouse 4). The Cy3-anti CD31 signals are shown in red color. B) The quantification of the CD31 count for mouse 1 to mouse 4. C) Quantification of Evans blue extraction of tumor harvested from mouse 1 to mouse 4. D) Quantification of tumor uptake from in vivo PET mouse 1 to mouse 4 at 24 h post injection of AuNR. E) Correlation between the CD31 count and in vivo PET tumor uptake; the Pearson correlation coefficient r and significance p value are included.
Overall, our study has manifested the interplay of the particle volume with the aspect ratio of AuNR in affecting its blood circulation, elimination and EPR mediated tumor delivery. Smaller volume slows its MPS elimination from the blood, resulting a longer circulation time, while higher aspect ratio potentially provides higher retention in the tumor. Therefore, AuNR of smaller size and higher aspect ratio would be the best option potentially for more efficient EPR mediated tumor delivery. The experimental framework we provided has illustrated the complexity of how the size of AuNR could affect its tumor delivery and how we could better understand this process to find the optimum candidate with the help of in vivo imaging technique. The discrepancies between previous in vitro study and our in vivo findings further brought up the importance and necessity of in vivo study, to truly understand the mechanism present in biological system. Investigating the size-dependent kinetics of AuNR in other types of tumor models will be necessary to further validate our findings. A full understanding of size-dependent kinetics of AuNR during EPR mediated tumor delivery will also push forward the translation into clinical application of AuNR and other nanomaterials in cancer imaging and therapy.
Conclusion
We have provided a systematic investigation on the effect of AuNR size on their EPR mediated tumor delivery kinetics both in vitro and in vivo. PET with 64Cu labeled PEGlylated AuNR allowed us to quantify AuNR distribution in major organs (heart, tumor, liver and spleen) over time. Compartmental modeling was used to analyze the kinetics of AuNR during their intravascular circulation and tumor accumulation through EPR effect. Based on our study, the elimination half-life was negatively correlated with the volume of AuNR, while the net trans-endothelium kinetics was independent of the size of AuNR. Despite the relatively high inter-subject variation in tumor uptake, the tumor retention of AuNR was related to the aspect ratio of AuNR. Besides, smaller AuNRs were cleared faster from liver and spleen over time. Consequently, we would suggest AuNRs with relatively small volume and high aspect ratio to be the ideal candidate for EPR mediated tumor delivery. The findings of our study offer tools for the design of more efficient AuNR based drug delivery platforms and potentially supporting their translation into clinical applications.
Materials and methods
Cell lines and animal models
All experiments with live animals were conducted in accordance with a protocol approved by the National Institutes of Health Clinical Center Animal Care and Use Committee (NIH CC/ACUC). The U87MG cell line was obtained from the American Type Culture Collection (ATCC, Manassas, VA). Cells were cultured and passaged in Eagle's minimal essential medium supplemented with 10% FBS at 37 °C and 5% CO2. Athymic nude mice were obtained from Harlan laboratories (Frederick, MD, USA). The U87MG tumor model was generated by subcutaneous injection of 5×10⁶ cells in 100 µL of PBS into the right shoulder of nude mice. The mice were used for imaging when the tumor volume reached around 100 mm3 (10-15 days after inoculation).
Synthesis of Cu-64 labeled gold nanorods
Materials
Gold chloride trihydrate (49%) was purchased from Alfa Aesar. Hexadecyltrimethylammoniumbromide (98%) (CTAB), benzyldimethylammoniumchloride hydrate (98%) (BDAC), sodium borohydride (99%), silver nitrate, L-ascorbic acid and sodium ascorbate were purchased from Sigma-Aldrich. All the solutions were prepared by deionized water (18 MΩ). The HS-PEG-NH2 (Mw = 5000) was purchased from Nanocs. Radiometal [64Cu] was produced by the PET department, NIH clinical center.
Synthesis of gold nanorods
The synthesis of gold nanorods (AuNR) followed a reported seed-mediated growth method [45]. Briefly, Au seeds were prepared by adding ice-cold NaBH4 (0.6 mL, 0.01 M NaBH4) to a mixture of CTAB solution (5 mL, 0.20 M) and HAuCl4 (5 mL, 0.0005 M). After vigorous stirring the solution for 2 min, the solution was kept at 25 ºC for 2 h to make sure the NaBH4 was consumed. To synthesize AuNR, CTAB (5 mL, 0.2 M) was first mixed with AgNO3 solution (4 mM). Then HAuCl4 (5 mL, 1 mM), ascorbic acid (70 µL, 0.0788 M), and 12 µL of gold seed solution were added sequentially. The reaction was performed at 27-30 °C for at least 1 h. The aspect ratio of AuNR was adjusted by tuning the volume of AgNO3 (from 0.05 to 0.25 mL) and using BDAC as co-surfactant.
Surface modification of AuNR
The as-synthesized AuNRs were purified by centrifugation at 14,000 rpm and re-dispersed in deionized water. 1 mg NRs were mixed and shaken with 3 mg SH-PEG-NH2 in 5 mL DI water for 2 h at 27 °C. The replaced ligands and unbound polymers were then purified via dialysis bag with MW 10 K.
Characterization
Transmission electron microscopy (TEM) images were obtained on a FEI Tecnai 12 (120 KV) microscope. The samples were prepared by depositing a drop of AuNR dispersion on carbon-coated copper grids and dried overnight. UV spectra was obtained by a Genesys 10S UV-vis Spectrophotometer.
Preparation of 64Cu-labeled AuNR
15 μL 64CuCl2 was pre-mixed with 5.5 mg of sodium ascorbate (in 0.1 M borate buffer pH 8.6) and vortexed. Then 200 mL of AuNR (1 mg/mL) were added and the solution was shaken at 37 °C for 1 h. The resulting 64Cu-labeled AuNRs were purified by centrifugation (4000 g, 10 min) for three times and re-dispersed in PBS. The labeling efficiency was determined by using instant thin-layer chromatography (ITLC) plates with citric acid (0.1 M pH 5) as an eluent. The labeling efficiency was nearly 100% for all five samples.
Cytotoxicity study
Cytotoxic study of AuNRs with five different sizes was conducted using U87MG human glioblastoma cells. The cells were cultured in MEM and seeded into 96-well plates at a density of 1×10⁴ cells per well. After 24 h incubation, different concentrations of AuNR were add into each well and incubated at 37 °C. Twenty-four hours later, cells were washed twice with room temperature PBS then 5 µL of MTT solution (10 mg/mL MTT in PBS, pH 7.4) was added to each well and the plate was incubated for another 3 h. Then the medium was removed and 100 µL DMSO was added into each well to dissolve the intracellular formazan crystal. The absorbance was recorded by a plate reader at 490 nm, and the cell viability was calculated by comparing cells with the untreated wells as control.
Theoretical calculation of AuNR diffusion and margination
Cheong et al. have suggested the theoretical model of diffusion of nanorods, where nanorod was under translational and rotational Brownian motion [29, 41]. The Brownian movement was a result of random and complex interactions of nanoparticles with other components present in the flouting medium, and was considered to be related to the size and shape of the particle. The endpoint Brownian diffusion coefficient of nanorod in a pure diffusive liquid medium (e.g. pure water) was expressed as (Eq. 1):
and
(eq.1)
Where  and
and  are the diffusion coefficients measured along and normal to the axis of nanorod, respectively. The L and r are the length and diameter of nanorods, kB is the Boltzmann constant, T is the temperature in Kelvin,
  is the viscosity of the fluid. The constant
  ≈ 0.45, depending on the detailed shape of the cylindrical rod. For a given diffusive medium,
  is considered as a constant, therefore the above diffusion coefficient
  and
and  for a given size can be simplified and expressed as a function of
  and
and  , respectively. In the present study, the average
  and
and  were calculated for each sized AuNR and represented the diffusion parameter (noted as Mdiff).
Mdiff = average (,
) (eq.2)
Margination
Besides traveling through the blood circulation, nanorods marginate towards the vessel wall so as to escape from the blood circulation through trans-endothelium movement. For nanoparticle size < 500 nm, the margination of nanorod towards flow chamber wall is a result of Brownian motion [19]. Based on the equations of Brownian motion [41], the Brownian force exerted on nanoparticle is expressed as [33]:
(eq.3)
Where kB is the Boltzmann constant, T is the temperature in Kelvin, and  is the equivalent spherical diameter of the particle. Therefore, in our study, the margination of AuNR was theoretically supposed to be inversely proportional to the volume of AuNR (Vrod).
(eq.4)
In vivo PET imaging
In vivo static PET imaging was performed using an Inveon® PET scanner (Siemens, USA). Approximately 3.8 MBq of 64Cu labeled AuNR of each size was injected intravenously to tumor-bearing mice. Five mice were used for each size of AuNR. Sequential PET scans were performed at 1, 3, 5, 8, 12, 24 and 48 h post-injection. The acquisition time was 10 min for the scans before 24 h post-injection and 15 min for the scan at 48 h post injection. The mice were anesthetized by inhalation of isoflurane (1% in 1 L/min oxygen) during each scan. PET images were reconstructed using 3D ordered-subsets expectation maximum followed by maximum a posteriori algorithm with a smoothing parameter of 0.1 (OSEM-3D-MAP).
Region of interest (ROI) and time-activity curves (TAC)
The region of interest (ROI) of heart, tumor, liver and spleen were drawn on the reconstructed PET images using Inveon Research Workplace (IRW) 3.0 software (Siemens Preclinical Solution). The tumor ROI was defined in applying a threshold to eliminate tumor necrotic region. The mean radioactivity of 64Cu-AuNR in each ROI was calculated with decay correction. The time activity curves (TAC) were generated by plotting the 64Cu-AuNR uptake as a function of time. The unit of the time axis was in hour. The TAC of the heart (Figure S5), tumor (Figure S6), liver (Figure S7) and spleen (Figure S8) ROIs were generated from the reconstructed PET images for each individual mouse used for each size of AuNR (Figure S3). Then for each ROI, the individual TACs within each group of AuNR size were averaged to have the mean TAC (expressed in mean±SD) for each size of AuNR (Figure 3).
Kinetics of blood circulation and EPR mediated tumor delivery
The effect of AuNR size on its blood circulation and tumor accumulation kinetics was studied in vivo based on the blood and tumor TACs generated from the sequential static PET. The blood TAC was defined using the maximum uptake (in %ID/g) of the heart ROI and was used as the plasma input function, while the tumor TAC was defined using the mean tumor uptake (in %ID/g) within the tumor ROI. The blood elimination rate was calculated by fitting the blood TAC with a bi-exponential function:
(eq.5)
the blood elimination half-life (T1/2) equals to
(eq.6)
The transportation kinetics of 64Cu-AuNR from tumor vessel to tumor extravascular space through EPR effect (Figure 2A) was assessed by a two-compartment model [34, 46] (Figure 2B). The concentration change between the compartments was expressed as
(eq.7)
Where Cp(t) and Cd(t) are the 64Cu-AuNR activity concentrations (Bq/mL) as a function of time in the compartments corresponding to plasma and tumor interstitium, and the K1 and k2 are the transportation rates of 64Cu-AuNR from vessel to tumor and vice versa. Cp(t) is given by the blood TAC measured from heart ROI and the Cd(t) is calculated by solving the above differential equations (Eq. 7). The signal intensity measured in a given tumor ROI on PET images is a weighted sum of Cp(t) and Cd(t) expressed as:
(eq.8)
Where  is the fractional blood volume in tumor, wd is the relative volume ratio for the rest of tumor area (wd =1-
 ). Given the measured TAC of tumor ROI and blood input function, the K1, k2 values were calculated by fitting the measured TAC with the analytical ROI function CROI(t) (Eq. 8) using non-linear least-square regression. The goodness of the fitting was evaluated using the residual analysis [47], and the error (between the data value and estimated function value) was limited to be less than 5%. The volume of distribution in tumor interstitial space VD at equilibrium was defined as:
(eq.9)
The total residence time of 64Cu-AuNR in tumor during the 48 h post injection was also studied by calculating area under the curve (AUC) of the tumor TAC.
(eq.10)
The compartmental modeling was conducted using a home-made Matlab object-oriented toolbox. Input parameters include plasma input TAC data, tumor ROI TAC data, and initial guess of K1, k2, wp, and wd values. According to preliminary fitting test, the K1 and k2 were initialized to 0.01; wp and wd were initialized to 0.1.
Biodistribution
Mice were sacrificed at 48 h after intravenous administration of 64Cu-labeled AuNR (after PET imaging at 48 h). Tumors and major organs including heart, lung, liver, spleen, kidneys, stomach, intestine, bone, muscle and blood were collected and wet weighed, 64Cu present in each organ was measured with a gamma counter and expressed in %ID/g.
CD31 immunostaining
Immunostaining against endothelial cell marker CD31 was performed to evaluate the tumor vascular density. After in vivo PET scan at 24 h post injection of 64Cu-AuNR, tumors from a separate group of mice were harvested and immersed in O.C.T. Compound. After freezing in a -80 °C freezer, 10 µm thick slides were acquired by Cryostat. Firstly, the slices were fixed with z-fix for 20 min and then washed with PBS twice for 5 min. Secondly, the slices were blocked with 1% BSA (in PBS) at room temperature for 1 h and incubated with primary antibody (Rat anti-mouse CD31 antibody, 1:150 in 1% BSA) for 2 h. After being washed with PBS, the slices were incubated with secondary antibody (Cy3-donkey anti-rat IgG, 1:100 in 1% BSA) in darkroom for 1 h. After washing with PBS, the slices were mounted with DAPI mounting medium and ready for microscopic observation.
Evans blue extraction
Evans blue extraction technique was used to evaluate tumor vascular permeability. After PET imaging at 24 h time point, Evans blue (30 mg/kg body weight) was intravenously injected into mice. At 2 h after dye injection the mice were sacrificed, a thorough whole body blood flush was carried out. Then the tumors were weighed and cut into small pieces of 50-100 mg. Formamide was added into each tumor containing tube for Evans blue extraction. Seventy-two hours later, the suspension was centrifuged at 13,000 g for 10 min, the concentration of Evans blue in the supernatant was then measured.
Statistical analysis
The in vivo uptake measured by PET was expressed in %ID/g; the kinetics parameters K1 and k2 were expressed in h-1. All quantitative values in the study were presented in mean ± STD. Mann-Whitney U test [43] was used to compare and evaluate the significance in differences between two independent samples. In our study, it was used to compare the different tissue uptake of different sized AuNR at different time points. The p value of U test less than 0.05 was considered to be significantly different. The dependences and correlations between different groups of values were evaluated with Pearson correlation. The correlation coefficient r was calculated, where r =1 referred to total positive dependence and r = -1 referred to total negative dependence, and r = 0 meant no correlation between the two groups of values. P value less than 0.05 indicated that the correlation was statistically significant.
Supplementary Material
Supplementary tables and figures.
Competing Interests
The authors have declared that no competing interest exists.
References
1. Xie J, Lee S, Chen X. Nanoparticle-based theranostic agents. Adv Drug Deliv Rev. 2010;62:1064-79 doi:10.1016/j.addr.2010.07.009
2. Zhen Z, Tang W, Chuang YJ, Todd T, Zhang W, Lin X. et al. Tumor vasculature targeted photodynamic therapy for enhanced delivery of nanoparticles. ACS Nano. 2014;8:6004-13 doi:10.1021/nn501134q
3. Rose PG. Pegylated liposomal doxorubicin: optimizing the dosing schedule in ovarian cancer. Oncologist. 2005;10:205-14 doi:10.1634/theoncologist.10-3-205
4. Matsumura Y, Kataoka K. Preclinical and clinical studies of anticancer agent-incorporating polymer micelles. Cancer Sci. 2009;100:572-9
5. Kobayashi H, Brechbiel MW. Dendrimer-based macromolecular MRI contrast agents: characteristics and application. Mol Imaging. 2003;2:1-10
6. Maeda H, Nakamura H, Fang J. The EPR effect for macromolecular drug delivery to solid tumors: Improvement of tumor uptake, lowering of systemic toxicity, and distinct tumor imaging in vivo. Adv Drug Deliv Rev. 2013;65:71-9 doi:10.1016/j.addr.2012.10.002
7. Blanco E, Shen H, Ferrari M. Principles of nanoparticle design for overcoming biological barriers to drug delivery. Nat Biotechnol. 2015;33:941-51 doi:10.1038/nbt.3330
8. Yu M, Zheng J. Clearance Pathways and Tumor Targeting of Imaging Nanoparticles. ACS Nano. 2015;9:6655-74 doi:10.1021/acsnano.5b01320
9. Wilhelm S, Tavares AJ, Dai Q, Ohta S, Audet J, Dvorak HF. et al. Analysis of nanoparticle delivery to tumours. Nat Rev Mater. 2016;1:16014. doi:10.1038/natrevmats.2016.14
10. Kobayashi H, Turkbey B, Watanabe R, Choyke PL. Cancer drug delivery: considerations in the rational design of nanosized bioconjugates. Bioconjug Chem. 2014;25:2093-100 doi:10.1021/bc500481x
11. Jain S, Hirst DG, O'Sullivan JM. Gold nanoparticles as novel agents for cancer therapy. Brit J Radiol. 2012;85:101-13 doi:10.1259/bjr/59448833
12. Her S, Jaffray DA, Allen C. Gold nanoparticles for applications in cancer radiotherapy: Mechanisms and recent advancements. Adv Drug Deliv Rev. 2015 doi:10.1016/j.addr.2015.12.012
13. Suk JS, Xu Q, Kim N, Hanes J, Ensign LM. PEGylation as a strategy for improving nanoparticle-based drug and gene delivery. Adv Drug Deliv Rev. 2016;99:28-51 doi:10.1016/j.addr.2015.09.012
14. Albanese A, Tang PS, Chan WC. The effect of nanoparticle size, shape, and surface chemistry on biological systems. Annu Rev Biomed Eng. 2012;14:1-16 doi:10.1146/annurev-bioeng-071811-150124
15. Liu D, Huang X, Wang Z, Jin A, Sun X, Zhu L. et al. Gold nanoparticle-based activatable probe for sensing ultralow levels of prostate-specific antigen. ACS Nano. 2013;7:5568-76 doi:10.1021/nn401837q
16. Sun X, Huang X, Yan X, Wang Y, Guo J, Jacobson O. et al. Chelator-free (64)Cu-integrated gold nanomaterials for positron emission tomography imaging guided photothermal cancer therapy. ACS Nano. 2014;8:8438-46 doi:10.1021/nn502950t
17. Sykes EA, Chen J, Zheng G, Chan WC. Investigating the impact of nanoparticle size on active and passive tumor targeting efficiency. ACS Nano. 2014;8:5696-706 doi:10.1021/nn500299p
18. Kaul G, Amiji M. Long-circulating poly(ethylene glycol)-modified gelatin nanoparticles for intracellular delivery. Pharm Res. 2002;19:1061-7
19. Sen Gupta A. Role of particle size, shape, and stiffness in design of intravascular drug delivery systems: insights from computations, experiments, and nature. Wiley Interdiscip Rev Nanomed Nanobiotechnol. 2016;8:255-70 doi:10.1002/wnan.1362
20. Hirn S, Semmler-Behnke M, Schleh C, Wenk A, Lipka J, Schaffler M. et al. Particle size-dependent and surface charge-dependent biodistribution of gold nanoparticles after intravenous administration. Eur J Pharm Biopharm. 2011;77:407-16 doi:10.1016/j.ejpb.2010.12.029
21. Chou LY, Chan WC. Fluorescence-tagged gold nanoparticles for rapidly characterizing the size-dependent biodistribution in tumor models. Adv Healthc Mater. 2012;1:714-21 doi:10.1002/adhm.201200084
22. Okuno T, Kato S, Hatakeyama Y, Okajima J, Maruyama S, Sakamoto M. et al. Photothermal therapy of tumors in lymph nodes using gold nanorods and near-infrared laser light. J Control Release. 2013;172:879-84 doi:10.1016/j.jconrel.2013.10.014
23. Shanmugam V, Selvakumar S, Yeh CS. Near-infrared light-responsive nanomaterials in cancer therapeutics. Chem Soc Rev. 2014;43:6254-87 doi:10.1039/c4cs00011k
24. Patino T, Mahajan U, Palankar R, Medvedev N, Walowski J, Munzenberg M. et al. Multifunctional gold nanorods for selective plasmonic photothermal therapy in pancreatic cancer cells using ultra-short pulse near-infrared laser irradiation. Nanoscale. 2015;7:5328-37 doi:10.1039/c5nr00114e
25. Varnavski OP, Mohamed MB, El-Sayed MA, Goodson T. Relative enhancement of ultrafast emission in gold nanorods. J Phys Chem B. 2003;107:3101-4 doi:10.1021/jp0341265
26. Mannelli I, Marco MP. Recent advances in analytical and bioanalysis applications of noble metal nanorods. Anal Bioanal Chem. 2010;398:2451-69 doi:10.1007/s00216-010-3937-8
27. Weissleder R. A clearer vision for in vivo imaging. Nat Biotechnol. 2001;19:316-7 doi:10.1038/86684
28. Mackey MA, Ali MRK, Austin LA, Near RD, El-Sayed MA. The Most Effective Gold Nanorod Size for Plasmonic Photothermal Therapy: Theory and In Vitro Experiments. J Phys Chem B. 2014;118:1319-26 doi:10.1021/jp409298f
29. Cheong FC, Grier DG. Rotational and translational diffusion of copper oxide nanorods measured with holographic video microscopy. Opt Express. 2010;18:6555-62 doi:10.1364/OE.18.006555
30. Shah S, Liu Y, Hu W, Gao J. Modeling particle shape-dependent dynamics in nanomedicine. J Nanosci Nanotechnol. 2011;11:919-28 doi:10.1166/jnn.2011.3536
31. Perez-Campana C, Gomez-Vallejo V, Puigivila M, Martin A, Calvo-Fernandez T, Moya SE. et al. Biodistribution of different sized nanoparticles assessed by positron emission tomography: a general strategy for direct activation of metal oxide particles. ACS Nano. 2013;7:3498-505 doi:10.1021/nn400450p
32. Sun X, Cai WB, Chen X. Positron Emission Tomography Imaging Using Radio labeled Inorganic Nanomaterials. Acc Chem Res. 2015;48:286-94 doi:10.1021/ar500362y
33. Lee SY, Ferrari M, Decuzzi P. Shaping nano-/micro-particles for enhanced vascular interaction in laminar flows. Nanotechnology. 2009;20:495101. doi:10.1088/0957-4484/20/49/495101
34. Wong AD, Ye M, Ulmschneider MB, Searson PC. Quantitative Analysis of the Enhanced Permeation and Retention (EPR) Effect. PLoS One. 2015:10 doi: 10.1371/journal.pone.0123461
35. Stapleton S, Milosevic M, Allen C, Zheng J, Dunne M, Yeung I. et al. A mathematical model of the enhanced permeability and retention effect for liposome transport in solid tumors. PLoS One. 2013;8:e81157. doi:10.1371/journal.pone.0081157
36. Terentyuk GS, Maslyakova GN, Suleymanova LV, Khlebtsov BN, Kogan BY, Akchurin GG. et al. Circulation and distribution of gold nanoparticles and induced alterations of tissue morphology at intravenous particle delivery. J Biophotonics. 2009;2:292-302 doi:10.1002/jbio.200910005
37. Song J, Yang X, Jacobson O, Huang P, Sun X, Lin L. et al. Ultrasmall Gold Nanorod Vesicles with Enhanced Tumor Accumulation and Fast Excretion from the Body for Cancer Therapy. Adv Mater. 2015;27:4910-7 doi:10.1002/adma.201502486
38. De Jong WH, Hagens WI, Krystek P, Burger MC, Sips AJ, Geertsma RE. Particle size-dependent organ distribution of gold nanoparticles after intravenous administration. Biomaterials. 2008;29:1912-9 doi:10.1016/j.biomaterials.2007.12.037
39. Geng Y, Dalhaimer P, Cai S, Tsai R, Tewari M, Minko T. et al. Shape effects of filaments versus spherical particles in flow and drug delivery. Nat Nanotechnol. 2007;2:249-55 doi:10.1038/nnano.2007.70
40. Weissleder R, Nahrendorf M, Pittet MJ. Imaging macrophages with nanoparticles. Nat Mater. 2014;13:125-38 doi:10.1038/nmat3780
41. Shah S, Liu YL, Hu W, Gao JM. Modeling Particle Shape-Dependent Dynamics in Nanomedicine. J Nanosci Nanotechnol. 2011;11:919-28 doi:10.1166/jnn.2011.3536
42. Arnida Janat-Amsbury MM, Ray A Peterson CM, Ghandehari H. Geometry and surface characteristics of gold nanoparticles influence their biodistribution and uptake by macrophages. Eur J Pharm Biopharm. 2011;77:417-23 doi:10.1016/j.ejpb.2010.11.010
43. Fay MP, Proschan MA. Wilcoxon-Mann-Whitney or t-test? On assumptions for hypothesis tests and multiple interpretations of decision rules. Stat Surv. 2010;4:1-39 doi:10.1214/09-SS051
44. Yuan F, Dellian M, Fukumura D, Leunig M, Berk DA, Torchilin VP. et al. Vascular permeability in a human tumor xenograft: molecular size dependence and cutoff size. Cancer Res. 1995;55:3752-6
45. Nikoobakht B, El-Sayed MA. Preparation and growth mechanism of gold nanorods (NRs) using seed-mediated growth method. Chem Mater. 2003;15:1957-62 doi:10.1021/cm020732l
46. Zhou JY, Wilson DA, Ulatowski JA, Trajstman RJ, van Zijl PCM. Two-compartment exchange model for perfusion quantification using arterial spin tagging. J Cereb Blood Flow Metab. 2001;21:440-55
47. Langohr K, Melis GG. Estimation and residual analysis with R for a linear regression model with an interval-censored covariate. Biom J. 2014 doi:10.1002/bimj.201300204
Author contact
![]() Corresponding author: Dr. Xiaoyuan Chen, shawn.chengov
Corresponding author: Dr. Xiaoyuan Chen, shawn.chengov