Impact Factor
- Issue 14; 2026
- Issue 13; 2026
- Issue 12; 2026
- Issue 11; 2026
- Issue 10; 2026
- Volume 16; 2026
- Advance Articles
- Past Issues
- Cover Images
- Cover Suggestion
- Index & Coverage
- Special Issues
Introduction
Experimental Procedures
Results
Discussion
Abbreviations
Supplementary Material
Acknowledgements
References
International Journal of Biological Sciences
International Journal of Medical Sciences
 Global reach, higher impact

Theranostics 2017; 7(2):238-252. doi:10.7150/thno.16086 This issue Cite
Research Paper
Comprehensive Metaproteomic Analyses of Urine in the Presence and Absence of Neutrophil-Associated Inflammation in the Urinary Tract
Yanbao Yu1 ![]() , Patricia Sikorski1,#, Madeline Smith1, Cynthia Bowman-Gholston2, Nicolas Cacciabeve3, Karen E. Nelson1, Rembert Pieper1
, Patricia Sikorski1,#, Madeline Smith1, Cynthia Bowman-Gholston2, Nicolas Cacciabeve3, Karen E. Nelson1, Rembert Pieper1 ![]()
1. J. Craig Venter Institute, 9714 Medical Center Drive, Rockville, MD 20850.
2. Quest Diagnostics at Shady Grove Adventist Hospital, 9901 Medical Center Drive, Rockville 20850, MD.
3. Advanced Pathology Associates LLC at Shady Grove Adventist Hospital, 9901 Medical Center Drive, Rockville 20850, MD.
# Current address: Laboratory of Parasitic Diseases, NIAID, NIH, 4 Memorial Drive, Bethesda 20892, MD; Department of Microbiology and Immunology, Georgetown University, 3900 Reservoir Road, N.W., 20057, Washington, DC.
Received 2016-5-6; Accepted 2016-8-28; Published 2017-1-1
Abstract

Inflammation in the urinary tract results in a urinary proteome characterized by a high dynamic range of protein concentrations and high variability in protein content. This proteome encompasses plasma proteins not resorbed by renal tubular uptake, renal secretion products, proteins of immune cells and erythrocytes derived from trans-urothelial migration and vascular leakage, respectively, and exfoliating urothelial and squamous epithelial cells. We examined how such proteins partition into soluble urine (SU) and urinary pellet (UP) fractions by analyzing 33 urine specimens 12 of which were associated with a urinary tract infection (UTI). Using mass spectrometry-based metaproteomic approaches, we identified 5,327 non-redundant human proteins, 2,638 and 4,379 of which were associated with SU and UP fractions, respectively, and 1,206 non-redundant protein orthology groups derived from pathogenic and commensal organisms of the urogenital tract. Differences between the SU and UP proteomes were influenced by local inflammation, supported by respective comparisons with 12 healthy control urine proteomes. Clustering analyses showed that SU and UP fractions had proteomic signatures discerning UTIs, vascular injury, and epithelial cell exfoliation from the control group to varying degrees. Cases of UTI revealed clusters of proteins produced by activated neutrophils. Network analysis supported the central role of neutrophil effector proteins in the defense against invading pathogens associated with subsequent coagulation and wound repair processes. Our study expands the existing knowledge of the urinary proteome under perturbed conditions, and should be useful as reference dataset in the search of biomarkers.
Keywords: urine, clinical proteomics, urothelial cells, label-free quantitation, urinary tract infection, neutrophils, inflammation, network analysis, shotgun proteomics, urine sediment
Introduction
Urine is a preferred body fluid for disease diagnosis and biomarker discovery because sample collection is non-invasive and often abundant.[1-3] As a glomerular filtrate of blood plasma, urine is dominated by proteins and small molecules that are highly abundant in plasma under normal physiological conditions.[4] Under pathological conditions, urine represents a rich sample source for clinical tests, such as the widely used urine dipsticks,[5] as well as for disease biomarker discovery.[6] Small molecules in urine such as ketones and glucose have also been quantified and linked to distinct pathologies.[5] More recently, global metabolite profiling has been used to discover biomarkers in urine.[7-9] Advances in mass spectrometry have enabled highly parallel quantitative surveys of proteins using high resolution LC-MS/MS peptidomics and shotgun proteomic approaches.[10-12] For example, a peptidomics study identified three urinary fibrinogen peptides as biomarkers for necrotizing enterocolitis, a leading cause of morbidity and mortality in premature infants.[13] Similarly, shotgun proteomics has been used in biomarker studies for renal and urinary tract diseases[14] and disease conditions, not in anatomical proximity to the site of sample collection, such as cancer,[15] aging,[16] osteoarthritis,[17] and preeclampsia.[18] Urine has also been pre-fractionated to characterize subsets of its proteome, which include exosomes and microparticles. Urinary exosomes are small membrane-bound vesicles secreted by urothelial cells and, in specific pathological states, by other cell types such as tumor cells, red blood cells, and leukocytes.[19] Exosomes transport proteins, microRNAs, and other nucleic acid materials to enable communication among cells involved in the immune system and tumor cell migration.[20] Therefore, urinary exosomes are a source of proteins relevant to conditions perturbing urogenital organ function such as polycystic kidney disease,[21] diabetic nephropathy[22] and prostate cancer.[23]
The urine sediment is compacted at a low centrifugation speed (≤ 5,000 rpm) into a urine pellet (UP), and thus is separated from the supernatant portion that mainly contains soluble proteins, including proteins derived from filtered plasma or secreted by urothelial and renal tubular epithelial cells[2]. Proteomes of the SU fraction, the focus of many urinary proteomic studies, have been characterized from healthy individuals[24] and those affected by diseases of the kidneys and the urogenital tract.[24-27] The UP fraction contains sloughed cells and casts from urethral epithelial cells in healthy individuals. It may also contain red and white blood cells as well as colonizing bacteria in varying abundances, the latter of which are often high in cases of urinary tract infection (UTI).[5] Microscopic examination of urine sediments allows the assessment of various abnormal physiological conditions.[5, 28] Nonetheless, many protein biomarker discovery studies examine SU and discard UP proteomes.[1] Only a few studies have explored the content of mRNAs, proteins and metabolites in UPs.[29-31] For instance, Johnson et al. assessed cholesterol levels in urinary pellets as indicators of acute kidney injury.[31] Doucette et al. suggested that both SU and UP fractions should be analyzed for comprehensive biomarker discovery.[32] Recently, we introduced metaproteomic approaches for the analysis of UP fractions to identify uropathogens and assess inflammatory responses for the infected patients more comprehensively.[33, 34] A similar approach was employed to survey the proteome of poly-bacterial urethral catheter biofilms.[35] The association of urinary tract microbial communities with urogenital health has been discussed, enabled by next generation metagenomics sequencing methods.[36] It is known that a healthy vaginal microbiome is enriched in Lactobacillus species that generate hydrogen peroxide concentrations limiting the growth of opportunistic vaginal pathogens.[37] The physiological role of Lactobacillus in the urinary tract is less well defined.[38]
To our knowledge, in-depth proteomic analyses evaluating how urinary proteins partition into UP and SU fractions under conditions of infection and injury have not been performed to date. Our data lead to insights into the solubility and apparent tissue or cell origin of proteins released into the urinary tract lumen. For example, secreted antibacterial proteins able to bind to and aggregate microbes were detected in both UP and SU proteomes if pathogens were present. Examining 45 urine specimens, we assessed proteomic similarities and differences in the UP versus SU fractions. Identification of pathogens, enrichment of Gene Ontology (GO) terms, and protein network analyses were used to support the assertion that proteomic profiles are an informative resource to identify infections, injury and inflammatory states in the urinary tract.
Experimental Procedures
Rationale for Experimental Design and Statistics
This study integrated specimens and proteomic datasets derived from two groups of human subjects. Thirty-three clinical specimens were from the pathology laboratory of Shady Grove Adventist Hospital (SGAH) in Rockville, Maryland, where urinalysis tests had been ordered by physicians for diagnostic purposes. In most but not all cases, symptoms suggested infections in the urogenital tract. Our selection criteria further enriched for specimens with UTIs: only samples positive for at least two of the three following tests were accepted: leukocyte esterase activity, nitrite presence, microscopically assessed the presence of bacteria. Using some of the same samples, we had previously conducted and published a study assessing the utility of metaproteomics for the routine diagnosis of UTIs from urinary pellet (UP) samples.[34] Since the specimens were left-over (waste) samples collected in the process of routine clinical urinalysis, since there was no patient health risk, and since specimens were de-identified with clinical records only available at a very limited scale, the study was exempted from human subject protocols and bioethical review.[34] Twelve specimens available with associated clinical records were from healthy controls older than 60 years of age. The data from these human subjects and their proteomes were previously deposited at the ProteomeXchange Consortium via the PRIDE [39] partner repository with the dataset identifier PXD004713. All 45 urine specimens subjected to proteomic surveys were analyzed using the same sample preparation and LC-MS/MS methods, followed by the same database search and computational quantification methods. The rationale for this study was to compare the composition of UP and SU proteomes in the presence of either diagnosed UTIs, other suspected urinary tract pathologies, or the absence of such pathologies. Our aims were to increase general urinary proteomic knowledge, to learn more about the partitioning of proteins under conditions of inflammation in the urogenital tract, and to assess if proteomic signatures in both UP and SU fractions allow us to support evidence of distinct pathological events as compared to healthy controls.
Sample preparation and shotgun proteomic analysis
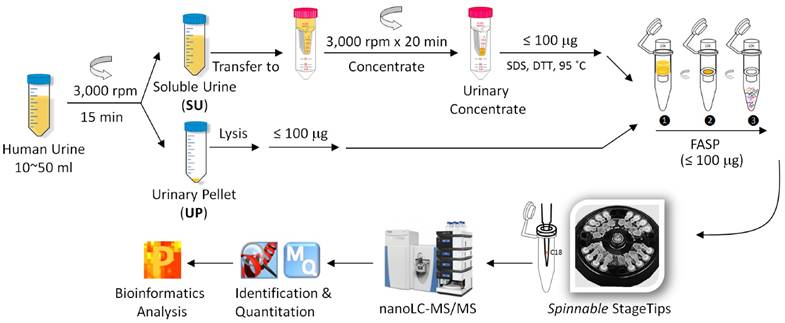
Following clean-catch urine collection, samples were stored at 4°C in 50-ml sterile disposable centrifuge tubes for maximally 6 h before further processing. No freeze/thaw cycles were performed before the samples (20-50 mL) were centrifuged at 2,500 × g for 15 minutes at 10°C. The UP and SU were obtained. Following a published method that is also shown in the schematic of Figure 1,[40] the SU fraction was concentrated in an Amicon Ultra-15 centrifugal filter (10 kDa MWCO, Millipore) at 3000 × rpm, and a volume of ~ 1.0 mL was retained. The UP fraction was treated with an 8 M urea buffer, and protein concentrations were estimated using the Bradford assay or SDS-PAGE as described.[41] Approximately 100 µg protein, applied to Vivacon filters (30K MWKO, Sartorius, Germany), was subjected to digestion with trypsin using the FASP protocol.[42] The digestion products were desalted prior LC-MS/MS analysis using the spinnable StageTip protocol.[43]
Workflow for the metaproteomic analysis of complete urine. First, the collected urine samples (10~50 ml) were centrifugally separated into soluble urine (SU) and urinary pellets (UP). The SU fraction was further concentrated using Amicon 10 kDa filter. The UP fractions were lysed, and proteins from human and bacterial cells, if present, were solubilized. Around 100 μg SU and UP proteins were subjected to digestion follwing the filter aided sample preparation (FASP) procedure. The resulting peptides were desalted using the spinnable StageTip protocol followed by nanoLC-MS/MS analysis using the hybrid Quadrupole-Orbitrap mass spectrometer (Q Exactive). Protein identification, quantitation, and bioinformatics analyses were performed using Proteome Discoverer, MaxQuant and Perseus software, respectively.
Analysis of peptide mixtures was performed on an Ultimate 3000 nano LC and Q Exactive mass spectrometer system coupled to a FLEX nano-electrospray ion source (all components were from Thermo Scientific). The dried peptide samples were first resuspended in 60 μL HPLC solvent A (0.1% formic acid in water), and then 10 μL were loaded onto a trap column (C18 PepMap100, 300 µm × 5 mm, 5µm, 100 Å, Thermo Scientific). The analytical column used was a PicoFrit column (75 µm × 10 cm, 5 μm BetaBasic C18, 150 Å, New Objective, MA) with an integrated emitter to minimize peak broadening and dead volume. The 130-min LC gradient with a flow rate of 300 nL/min started from 100% solvent A to 35% solvent B (0.1% formic acid in acetonitrile) for 110 min, then followed by a steeper gradient to 80% solvent B over 15 min. The column was re-equilibrated with solvent A for 5 more minutes. Eluting peptides were sprayed at a voltage of 2.1 kV and acquired in a MS data-dependent mode using Xcalibur software (version 2.2, Thermo Scientific). The full scan MS spectra were acquired at a resolution of 70,000 over a mass range of m/z 250 to 1,800 with an automatic gain control (AGC) target of 106. Up to ten of the most abundant ions were subjected to fragmentation by higher energy collisional dissociation (HCD) with a normalized collision energy of 27%. Peptide ion fragments from the MS/MS scans were acquired at a resolution of 17,500 with an AGC target of 5 × 10⁴. Dynamic exclusion was set to 20 s. Unassigned ions were rejected and only those with a charge ≥ 2 were subjected to HCD fragmentation.
Protein identification and quantification
The raw files acquired by the LCMS were processed using the Proteome Discoverer platform (version 1.4, Thermo Scientific) and the MaxQuant software (version 1.5.1.0). We used the former software for identification purpose and to report all the identification-related numbers in the manuscript. We used the latter for quantitation purpose only. An embedded workflow with the Sequest HT (version 2.4, Matrix Science) algorithm was employed. A database consisting of the UniProtKB human sequences (Release 2013_6, 27,151 sequences after 0.75 identify cut-off by CD-HIT Suite)[44] and the sequences derived from 21 microbial genomes (Release 2013_6, 70,784 sequences in total)[40] was used for protein IDs. Search parameters were set to allow two missed tryptic cleavages with oxidation (M), N-terminal acetylation, and deamidation (N, Q) as variable modifications and carbamidomethylation (C) as a fixed modification. Only top-ranked peptides with a length of at least seven amino acids were considered. The MS and MS/MS ion tolerances were set at 10 ppm and 0.02 Da, respectively. The false discovery rate (FDR) was estimated using the integrated decoy database search tool Percolator. Protein hits identified with a FDR threshold set at 1% were accepted in the final list. Prior to data export from Proteome Discoverer, the 'protein grouping' function was enabled to ensure that only one protein was reported in those cases where two or more proteins shared the same set of identified peptides.
We used MaxQuant to quantify proteomic datasets. For protein quantitation, most of the default settings provided in the MaxQuant-Andromeda software suite, which are similar to Proteome Discoverer settings, were accepted. Both the label-free quantitation (LFQ) and the intensity-based absolute quantitation (iBAQ) tools were enabled. Only proteins that were quantified by at least two unique peptides were used for analysis. When identified peptides were all shared by multiple proteins, they were combined and reported as one protein group. For quantitative comparison of urine supernatant verses pellet proteins, the 66 samples were grouped into two respective classes, and their LFQ intensities were log (base 2) transformed. Imputation of missing values was done with tuned parameters to better simulate the distribution of low signal values close to the noise level. Gaussian distribution of random numbers with a standard deviation of 30% relative to the standard deviation of the measured values and 1.8 standard deviation downshift of the mean were created. A non-parametric Welch t-test (p < 0.01) was applied with a permutation-based testing correction that was controlled by using a FDR threshold of 0.01. Hierarchical clustering (HCL) and Principle Component Analysis (PCA) of proteins were performed in Perseus software (version 1.5) using Euclidean distances and logarithmized LFQ values.
Results
While we have previously explored the diagnostic potential of metaproteomics and showed that microbial pathogens can be identified reliably in a host urinary proteome background from UP samples [34], we have not evaluated the functional relevance of the proteome of uropathogens associated with a UTI and have not yet studied the corresponding SU proteomes. Among the 33 urine specimens that were tested for UTIs by urinalysis tests and proteomics, 12 specimens showed evidence of uropathogens, and most of the cases were consistent with the diagnosis of UTI when assessing data on inflammation and/or symptoms (Supplemental Table S1). We refer to these 12 samples as UTI samples. In order to differentiate all 33 specimens tested for UTIs as a cohort from healthy control specimens introduced later, we use the acronyms dtUTI (diagnostic test of UTI) and HC (healthy control) for the specimens, respectively. Proteome analyses were performed using the experimental workflow shown in Figure 1.
Urinary tract infections and colonization
The Table 1 provides information on total proteome coverage, pathology groups based on proteomic and urinalysis evidence, and microbes as well as numbers of their proteins identified in each dtUTI sample. In addition to several common uropathogens, proteomic analysis of UP fractions revealed three bacterial genera (Prevotella, Lactobacillus, and Gardnerella) known to colonize the distal urethral and vaginal epithelia in women. These commensal bacteria, much more abundant in the vaginal environment than the urethra, appeared to vary in abundance. Due to the fact that the presence of these organisms in dtUTI samples largely corresponded to high content of squamous epithelial cells, microscopically assessed, and relatively high content of proteins highly expressed in stratified squamous epithelia (measured as the VCO score in Supplemental Table S1), we used the term EXF (exfoliation of squamous epithelial and urothelial cells) in Table 1. Commensal urogenital organisms are most often less abundant than uropathogens as matching data on proteomic profiles and CFUs/mL showed. Due to the higher abundance of Prevotella, Lactobacillus, and Gardnerella species in the vaginal tract, we were aware of the possibility that the clean-catch urine specimens were partially contaminated with vaginal fluids.
Metaproteomic identifications from 33 UP samples.
| Subject # | # Total proteins* | # Human proteins* | Pathology group*** | Microbe I (# proteins**) | Microbe II (# proteins**) |
|---|---|---|---|---|---|
| 2 | 2,054 | 1,473 | UTI | E.coli (209) | |
| 4 | 1,965 | 1,528 | UTI | E.coli (138) | |
| 5 | 1,896 | 1,364 | UTI | P.mirabilis (195) | A.urinae (33) |
| 6 | 1,825 | 935 | UTI | E.coli (358) | |
| 8 | 1,757 | 1,564 | UTI | S.aureus (50) | L.gasseri (46) |
| 16 | 1,468 | 1,366 | UTI | P.mirabilis (19) | |
| 18 | 1,365 | 450 | UTI | K.pneumoniae (413) | |
| 19 | 1,319 | 460 | UTI | E.coli (319) | |
| 24 | 1,069 | 757 | UTI/ERY | E.coli (47) | |
| 28 | 973 | 655 | UTI | K.pneumoniae (121) | |
| 29 | 893 | 446 | UTI/ERY | S.aureus (137) | S.saprophyticus (85) |
| 31 | 571 | 399 | UTI | E.coli (37) | |
| 14 | 1,486 | 1,397 | ERY | ||
| 20 | 1,269 | 1,198 | ERY | ||
| 21 | 1,258 | 1,189 | ERY | G.vaginalis (5) | |
| 26 | 1,013 | 940 | ERY | ||
| 25 | 1,057 | 1,003 | ERY/EXF | G.vaginalis (9) | |
| 32 | 431 | 402 | ERY/EXF | ||
| 1 | 2,089 | 1,866 | EXF | L.gasseri (54) | |
| 7 | 1,782 | 1,397 | EXF | L.gasseri (54) | S.agalactiae (40) |
| 9 | 1,727 | 1,595 | EXF | L.gasseri (18) | |
| 10 | 1,707 | 1,427 | EXF | L.gasseri (100) | |
| 11 | 1,705 | 1,337 | EXF | G.vaginalis (93) | P.melaninogenica (34) |
| 13 | 1,544 | 1,454 | EXF | L.gasseri (5) | |
| 15 | 1,484 | 1,359 | EXF | L.gasseri (24) | G.vaginalis (5) |
| 22 | 1,104 | 1,010 | EXF | L.gasseri (10) | |
| 23 | 1,080 | 966 | EXF | L.gasseri (22) | |
| 30 | 682 | 632 | EXF | ||
| 3 | 1,971 | 1,829 | unknown | ||
| 12 | 1,682 | 1,614 | unknown | ||
| 17 | 1,456 | 1,376 | unknown | ||
| 27 | 994 | 937 | unknown | ||
| 33 | 310 | 289 | unknown |
The number of human and microbial proteins identified from each sample is summarized. Confidently identified microbial species (microbes I and II), if detected, are listed. In one sample, subject #7, G. vaginalis was also detected with 35 protein IDs. * Protein identification required ≥ 1 unique peptide; ** protein identification required ≥ 2 unique peptides; protein IDs were rejected if not clearly distinguishable from orthologous peptides. Due to substantial sequence similarities among orthologous proteins of different bacterial genera, some IDs were not correctly assigned on the species level. Therefore, the number of microbial proteins listed was solely based on the output of the Proteome Discoverer software and is therefore an approximation. *** Pathology classification is based on considerations of proteomic interpretations and clinical data.
Most frequently identified were Lactobacillus (a commensal organism) and E. coli (a uropathogen); the latter was present in six samples with on average 184 protein IDs (Table 1). Enterobacteriaceae species such as Proteus mirabilis and Klebsiella pneumoniae form biofilms in the urinary tract [35] and were each present in two samples with on average 107 and 267 protein IDs, respectively. In sample #29, 222 proteins were identified for Staphylococcus species (137 proteins from S. aureus and 85 proteins from S. saprophyticus). Computationally assigning proteins to distinct bacterial species among evolutionarily related organisms such as E. coli and K. pneumoniae or S. aureus and S. saprophyticus remains challenging due to high numbers of indistinguishable tryptic peptides and the absence of unique peptides in shotgun proteomic data.[45] One sample (#5) revealed evidence of an infection with two pathogens, P. mirabilis (195 proteins) and Aerococcus urinae (33 proteins). Gardnerella vaginalis, a bacterium that has been associated with bacterial vaginosis, was identified in four instances with an average of 34 protein IDs (between 5 and 93).
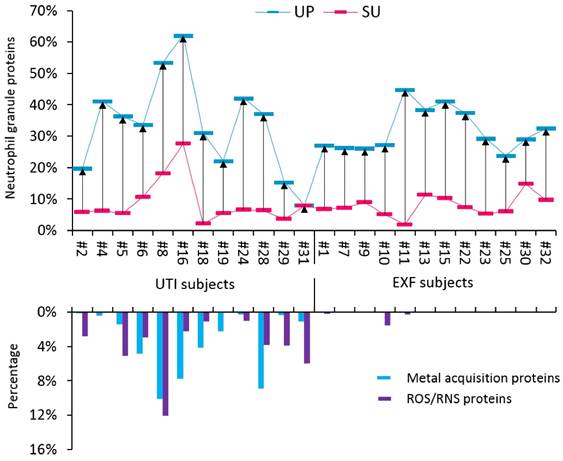
The proteomes of most UTI samples had high relative quantities of innate immune defense proteins primarily produced by activated neutrophils in the cytoplasm and cytoplasmic granules. We compared our data with two other studies on the neutrophil granule proteome; 103 granule proteins that were reported in published datasets [46, 47] were also identified in SU and UP fractions in our study (Supplemental Figure S5). This finding supported the infiltration of neutrophils into the urinary tract upon challenge by a pathogen. Abundant neutrophil proteins have roles in inflammatory signaling, such as proteins S100A8 and S100A9, and microbial inactivation, such as neutrophil defensin-1 (NDEF1), lactotransferrin (LTF), and myeloperoxidase (MPO). In high quantities, such proteins are biomarkers of a neutrophil-driven acute immune response. The sum of their iBAQ intensities (in SU and UP fractions) is displayed for UTI and EXF cases in the graphic of Figure 2. The data suggest that most EXF cases also have inflammatory responses supporting the notion of underlying pathologies. Given the presence of organisms that can cause dysbiosis in EXF cases and female gender, a likely pathology in such cases is vaginal dysbiosis. To investigate functional responses of the pathogens to the inflammatory or antimicrobial effector proteins, we measured the quantities of bacterial proteins involved in counteracting such insults. Such bacterial proteins have roles in iron acquisition (for instance, FepA, YtfE, FeoB, EfeO) and the destruction of reactive oxygen species (ROS) and reactive nitrogen species (RNS). RNS and ROS are produced in abundance by neutrophils. The data in Figure 2 show that uropathogens produce these defense proteins in almost all the UTI cases, where only a couple of EXF cases contained visible amount of such proteins. Apparently, only uropathogens launch protective responses against the human immune defenses that include oxidative stress and iron starvation. This interactive analysis infers that a bacterial battle for survival is not evident in cases of colonization of the urinary tract with bacterial typically considered to be commensals bacterium that when challenged by effectors of activated neutrophils in the urinary tract. We could not entirely exclude the possibility that some of the EXF cases constitute UTIs in decline where a pathogen had been reduced to a non-detectable number of cells in the urine or eliminated while the immune response had not yet subsided.
The cross-talk of bacterial pathogens with neutrophil effector proteins. Two groups of subjects were investigated, including the UTI group and the EXF (exfoliation of urothelial/squamous epithelial cells) group. The neutrophil granule proteome subset was quantified for UP and SU fractions and is presented in an interactive chart with bacterial proteins likely expressed in response to host immune defenses. Based on the comparisons shown in Supplemental Figure S5, 103 granule proteins identified from SU and UP fractions were selected for this graphic. The iBAQ intensities were summed, divided by the iBAQ intensities of entire proteome in each case and then displayed in the histogram. Calculations were performed for UP (blue) and SU (red) fractions. The average neutrophil granule protein content is 28.4% (± 14.1, SD; n=21) and 7.5% (± 5.4) in UP and SU samples, respectively. From the UP datasets only, iron and zinc acquisition proteins were summed based on PSMs and divided by all bacterial PSMs. Oxidative stress response proteins inactivating reactive oxygen and nitrogen species (ROS and RNS, respectively) were summed and also divided by all bacterial PSMs. The plot shows a trend of high neutrophil activities in samples representing UTIs that correlated well with the expression of iron acquisition and ROS/NOS response proteins.
Human host proteome characterization derived from SU and UP fractions
The non-comparative data analysis on host proteomes pertains to the 33 dtUTI specimens only. The number of protein IDs for UP fractions ranged from 289 to 1,866, with an average of 1,110 (± 450, SD; n=33). When the results from individual specimens were combined, deep proteome coverage of 4,379 non-redundant human protein groups was achieved (Supplemental Table S2 and S3). The median sequence coverage of individual proteins was 12.3%, and the median number of unique peptides per protein was 4. To explore the inter-individual variability of UP proteomes, we analyzed the frequency of protein IDs among the 33 UP samples (Supplemental Figure S1a). Of the 4,379 proteins, 3,336 proteins were identified from at least two human subjects. In addition, 2,851 proteins were detected from at least three human subjects, of which 15.7% had a single peptide hit, and 1,013 proteins were detected in 15 or more subjects. Less than 1% of the proteins of the latter group were limited to a single identified peptide. We further evaluated the quantitative repeatability of the LC-MS experiments using Pearson correlation analysis. As shown in Supplemental Figure S2, the R value for two LC-MS replicates of the same UP sample was high (> 0.92, n=33). This R value was much higher than the correlation comparing LC-MS runs pertaining to different UP samples, which was in a range of 0.02 to 0.88 with an average of 0.45 (SD=0.19, n=497).
For SU fraction profiles, up to 1,235 proteins were identified from a single sample. The sum of unique protein groups for all 33 samples was 2,638 (Supplemental Table S2 and S3). The median sequence coverage was 8%, and the median number of unique peptide per protein was 2. Approximately 53% of the protein IDs had two or more peptide hits. While 1,488 proteins were identified from at least three human subject specimens, with 17.8% limited to a single peptide hit, 548 proteins were identified from 15 or more subjects and matched with two or more unique peptides (Supplemental Figure S1b). As expected, the LC-MS/MS repeatability was similar for SU and UP fractions (R values are generally > 0.9; Supplemental Figure S2). We also evaluated the inter-individual variability between SU fractions. The Person correlation R-values for the proteome of two SU fractions averaged 0.67, a value far higher than the correlation of two UP fractions (R = 0.45). The finding that the proteomic variability among SU samples is lower than that among UP samples in the context of UTIs is not unexpected given that the innate immune response is based on the infiltration of immune cells and the disruption of the urothelial barrier that eventually causes exfoliation of urothelial cells. The content of UP samples changes more than that of SU samples. SU samples contain proteins derived from glomerular filtration and renal secretion activities that take place under non-inflammatory and inflammatory conditions, for instance, high concentrations of albumin, uromodulin, and bikunin.
By pooling protein IDs from all UP and SU datasets, a total of 5,242 non-redundant protein groups and 65,720 unique peptides were profiled. This urinary proteome is a valuable reference dataset for studies investigating pathological conditions in the urinary tract. We compared our data with urinary proteome datasets performed with similar methods (for instance, use of Orbitrap-based mass spectrometers and processing of proteins with the FASP method or by in-solution digestion; Supplemental Figure S3). Santucci et al. fractionated urine from healthy donors using combinatorial peptide ligand libraries, isolated a vesicle fraction and obtained 3,429 protein IDs.[48] Lacroix et al. studied the urine supernatant proteome of the newborns with obstructive nephropathy and quantified 970 proteins.[14] Bourderioux et al. studied urinary exosomes derived from patients with cystinuria and identified 1,794 proteins.[49] The protein ID overlaps were 48% (compared to Santucci's study) and 78% (compared to the other studies).
Comparison of SU proteome with UP proteome in the context of pathologies
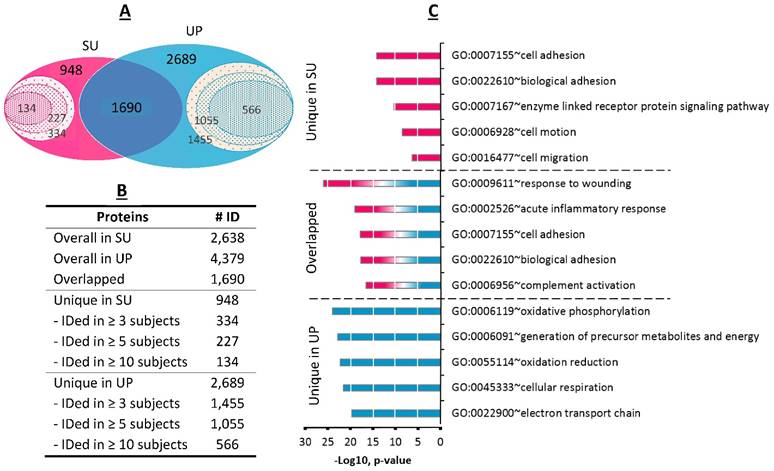
Pooling the proteomic profiles of all 33 dtUTI specimens, 1,690 proteins were detected in both SU and UP fractions (Figure 3A); 948 proteins were exclusively identified from the SU fraction including 334 proteins from at least three human subjects and 134 proteins from ten or more subjects. The UP fraction had an even larger number (2,689) of unique proteins, with 1,455 identified in at least three human subjects (Figure 3B). The GO annotations were performed for shared proteins and those unique to one of the fractions. The SU proteome was significantly enriched for the GO biological process terms of cell adhesion and motion/migration activities (Figure 3C), in agreement with a previous survey of the soluble fraction of human urine.[24] GO terms highly enriched in the UP proteome represented oxidoreductive and energy metabolism processes. These categories pertain to proteins that are intracellular, in agreement with high cellular content in UP samples. Enriched GO terms for proteins shared among UP and SU fractions included acute inflammation (p-value < 9.7 x 10⁻²⁰) and response to wounding and injury (p-value < 9.6 x 10⁻²⁶). This data is consistent with the occurrence of local injury and inflammation which we indeed inferred from proteomic and clinical data (Supplemental Table S1). Response to wounding implicates the repair of tissues upon injury, likely relevant not only in UTI cases but also in EXF cases (e.g., if related to a declining UTI or bacterial vaginosis). To contrast functional differences between SU and UP fractions in dependence on urogenital health, the GO term enrichment analyses were applied to the proteome profiles of HC samples and compared with dtUTI samples. We observed that the GO terms differed more in the comparison of the UP proteomes than in the comparison of the SU proteomes. The most obvious biological category with different enrichment profiles was the term 'innate immune response' (Supplemental Figure S9). This was not a surprise because the innate immune system is largely silent in the healthy urogenital tract. Such comparative analyses are reported here for the first time, to our knowledge. Both UP and SU proteomes contain information on pathologies in the urinary tract.
Comparison of SU and UP human proteomes. (A) The Venn diagram displays the overlaps for a total of 2,638 human proteins derived from SU and 4,379 human proteins from derived from UP fractions. 1,690 proteins were common to both fractions (summed from all 33 samples). Proteins identified from at least three, five, and ten urine specimens were indicated in the inner circles. (B) The table lists the protein numbers shown in the Venn diagram. (C) Gene Ontology analysis for biological process category displays the five most enriched terms for proteins present only in SU, only in UP, or shared among the two fractions.
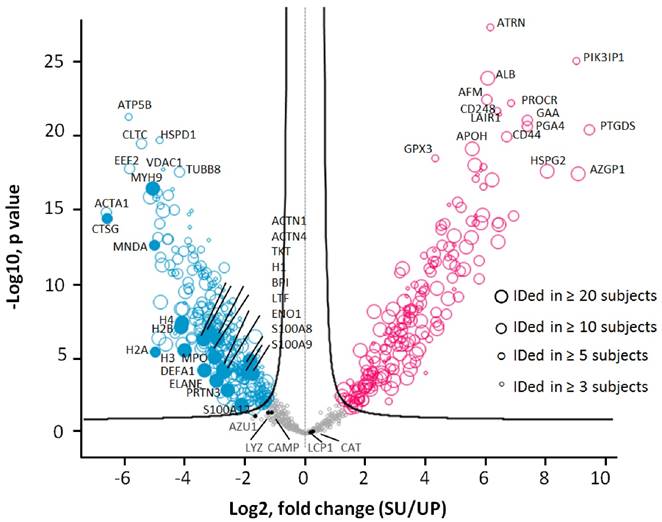
To assess accuracy of the quantitation analyses, we compared the LFQ-based quantification method with two other methods and performed HCL analyses. Spectral count and peak area integration-based approaches have been employed to profile proteomes.[50-52] As shown in Supplemental Figure S4, all quantification approaches grouped the samples similarly. We then tested the significance of quantitative differences comparing the UP and SU datasets of all 33 dtUTI samples using the unpaired Welch's t-test (S0=0.4) with permutation-based FDR corrections (FDR=0.01). This analysis resulted in 508 proteins with significant abundance differences (greater than 2.3-fold change), including 197 proteins with increases in the SU proteome and 311 proteins with increases in the UP proteome (Figure 5). More than 80% (416) of these proteins were identified in at least five human subjects; 293 and 142 proteins were detected in at least ten and twenty subjects, respectively. Many proteins abundant in activated neutrophils were enriched in the UP fraction compared to the SU fraction with statistical significance. Of the 508 significantly changing proteins, 165 proteins were identified in one of the two recent surveys of the neutrophil granule proteome (Supplemental Figure S5D). In summary, the presence of neutrophil effectors (e.g., DEFA1, LFT, MPO, cathelicidin and calprotectins) in UP and SU fractions supports the fact these cells use intra- and extracellular strategies to subdue pathogens and signal to other immune cells.
Differences in protein abundances comparing SU and UP datasets. Biological differences were not considered in this analysis as a parameter of in- or exclusion. Only the 33 dtUTI samples were used for the analysis. Proteins were filtered with frequency (≥ 3 subjects), and the subject was filtered with quantity (≥ 300 proteins), resulting in 818 proteins which are displayed in the valcono plot. The 508 significantly changing proteins upon performance of the unpaired Welch T-test are highlighted (red, increased in SU; blue, increased in UP; gray, no significance). Each circle represented a protein, and the size indicated the presence in at least 3, 5, 10 and 20 subjects, respectively. Proteins abundant in neutrophil granules (e.g. CTSG, MPO, DEFA1), cytosol (e.g. S100A8, S100A9), and membranes (e.g. VDAC1, MNDA, CLTC) as well as proteins also abundant in epithelial cells that line the urogenital tract (e.g. the cytoskeletal proteins ACTA1, MYH9, and TUBB8) were enriched in the UP proteome. Plasma proteins (e.g. ALB, APOH, HSPG2, and AZGP1) and proteins apparently released from membrane anchorage in urothelial cells or shed into urine via exosomes (e.g. ATRN, PIK3IP1, CD248, and PROCR) were increased in the SU proteome.
Clustering differences for dtUTI versus healthy control specimens
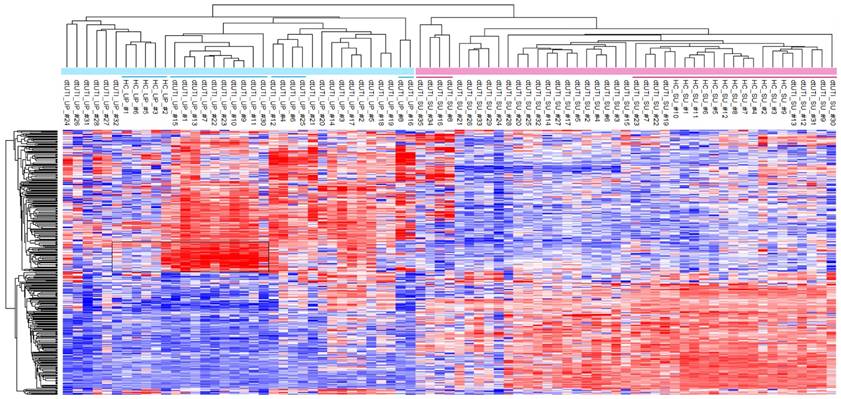
All dtUTI samples were from human subjects with underlying medical conditions, although not necessarily disease states clearly linked to malfunctions and infections of the kidneys and urogenital tract (Additional Table S1). For clustering, all proteomic data were quantified using label-free quantitation (LFQ) and after eliminating low abundance proteins and datasets with less than 100 quantifiable proteins. With that, 363 proteins were retained. We assessed whether both UP and SU proteome profiles derived from dtUTI samples clustered separately from those derived from healthy control (HC) specimens. Unsupervised clustering data in Figure 4 show clear separation of the SU and UP samples into two distinct clusters, which are largely sub-clustered according to the phenotypes (HC, UTI, ERY, and EXF). For instance, in the UP cluster, HC and EXF samples clustered separately, but were adjacent to each other. UTI and ERY samples were more distant in the tree from the HC and EXF samples. The EXF profiles contained a set of highly enriched proteins apparently responsible for the formation of a separate cluster (Figure 4, highlighted box). These proteins (e.g., cytokeratins, desmoplakin, periplakin, serpin B3, and cornulin) are abundant cytoskeletal components of stratified squamous epithelium, which is present in mucosal surfaces of the distal urethra and vaginal tract. The outermost layer of cells exfoliates, especially under inflammatory conditions, leading to the release of cells and cell debris into urine and vaginal fluid. While low level exfoliation is normal, as low quantities of these proteins in UP samples of HC cases show, the EXF phenotype described in this study appears to be not physiologically normal. This difference is much more obvious than in the corresponding SU datasets (EXF cluster from #23 to #30, underlined in Figure 4) in line with the notion that exfoliation is a cellular process with proteins retained in an insoluble fraction of urine. Given that the EXF phenotype is also strongly associated with detection of Lactobacillus, Prevotella, and G. vaginalis proteins (Table 1), we do not exclude the possibility that the EXF signatures are associated with squamous epithelial cells from the vaginal meatus and vagina via urine contamination with vaginal fluids. All of the SU profiles for HC samples were associated with one cluster that also contained four dtUTI samples, three of which showed low LE activities and no hematuria (on the very right of the SU datasets in Figure 4). The urinary tract of these dtUTI subjects indeed showed no evidence of inflammation or injury. Only one dtUTI sample (SU_#17) in this cluster revealed bacteriuria (E. coli), and it is plausible that this case was asymptomatic.
Unsupervised hierarchical clustering analysis of the dtUTI and HC subjects. The logarithmic (Log2) LFQ values derived from MaxQuant data were used. Samples with less than 100 quantifiable proteins were eliminated. Infrequently identified proteins (in < 20 UP or SU samples) were also filtered, leading to 363 proteins for the clustering analyses. Missing values were imputed with default settings in Perseus. SU and UP clusters clearly separated. Red bars represents SU samples; blue bar represents UP samples. Clusters that are underlined are further discussed in the main text. Heat map color ranging from blue to red stands for Z-score value from low to high.
Furthermore, we observed a lower complexity of UP proteomes from HC samples compared to the corresponding SU proteomes and the UP proteomes derived from dtUTI samples (Supplemental Figure S7A). This observation is apparently linked to much smaller volumes of urine sediments in healthy individuals and to a low cellular diversity given that infiltrating immune system cells and leakage of cells from the vascular system are absent. Of the 12 HC urine samples, only six contained visible pellets. UP and SU fractions also revealed larger differences in GO terms for 'biological process' than the equivalent fractions of specimens with evidence of UTIs (Supplemental Figure S7A). Statistical analyses revealed that, opposed to proteomic profiles in SU vs. UP fractions of UTI samples, there was not a large set of innate immunity and neutrophil-associated proteins that was enriched in the UP vs. SU fraction for HC samples (Supplemental Figure S7B). In fact, the proteins LTF and NDEF1 were enriched in the SU fraction. This finding suggests that, under conditions of health, antibacterial proteins are secreted (by urothelial cells) and remain soluble. In cases of UTI, the majority of antibacterial proteins are associated with cellular contents (neutrophils and other immune cells). Assessing differences in the UP proteomes associated with the EXF phenotype (where underlying disease conditions may vary) compared to healthy controls, protein heat map (Figure 4) revealed a signature of abundant proteins (box in the heatmap) with structural and modulatory roles in the cytoskeleton of stratified squamous epithelial cells. The fact that this signature was absent in HC samples further supported the notion that the EXF phenotype was not simply a minor change in the normal urothelial and squamous epithelial renewal process of the urinary tract. In conclusion, comparisons with HC samples based on SU and UP proteome profiles further supported the notion that physiological perturbations in the urinary tract can be observed via proteomics in both SU and UP fractions.
Interaction network for the urinary proteome associated with a UTI
Based on the evidence that some of the samples represented a UTI, we inferred functional host-pathogen interactions using bioinformatics methods.[53] We used the UP proteome of human subject #6 as an example because the data were comprehensive (1,825 protein IDs), included 506 proteins pertaining to the most frequent cause of UTIs in humans, uropathogenic E. coli, and revealed strong inflammation. To build the interaction network, we used a subset of proteins (144 in total) that accounted for nearly 90% of the total protein mass and were also detected in at least five other subjects, thus making them representative of the UTI cases. With a medium confidence score cutoff of ≥ 0.4 in STRING database,[54] 708 associations were mapped. As shown in Figure 6, GO and pathway analysis linked the proteins to a variety of highly interconnected biological processes and cellular functions enriched in responses to stress and wounding (p-value < 10-15 for both GO categories). The analysis also linked proteins to the 'pathogen E. coli infection' pathway as well as a few other known activities, which verified our proteomic data. For instance, nine proteins, including C3, CD59, KNG1 and several serpins, are involved in 'complement and coagulation cascades' (p-value = 4.1 x 10⁻⁷). There is evidence that the complement proteins C3b and iC3b opsonize the pathogen surface and bind to receptors enriched on the neutrophil surface. One well-characterized receptor is CR3, which is composed of the integrin subunits CD11b and CD18. This interaction promotes phagocytosis.
Reconstruction of protein interactions and networks for a UP sample associated with a case of UTI caused by UPEC. From human subject #6, about 144 proteins that constituted 90% of the total protein mass were obtained and submitted to the STRING functional tool. The resulting network was filtered with the medium confidence cutoff score (0.4), and then visualized using Cytoscape software (version 3.2). Gene Ontology and KEGG pathway enrichment analyses were performed in STRING. Overrepresented categories with significance (p value) were depicted in different color groups. Proteins reported to be associated with neutrophils extracellular traps (NETs) were displayed in the center. Their associations with intra- and inter-group proteins were highlighted in red.
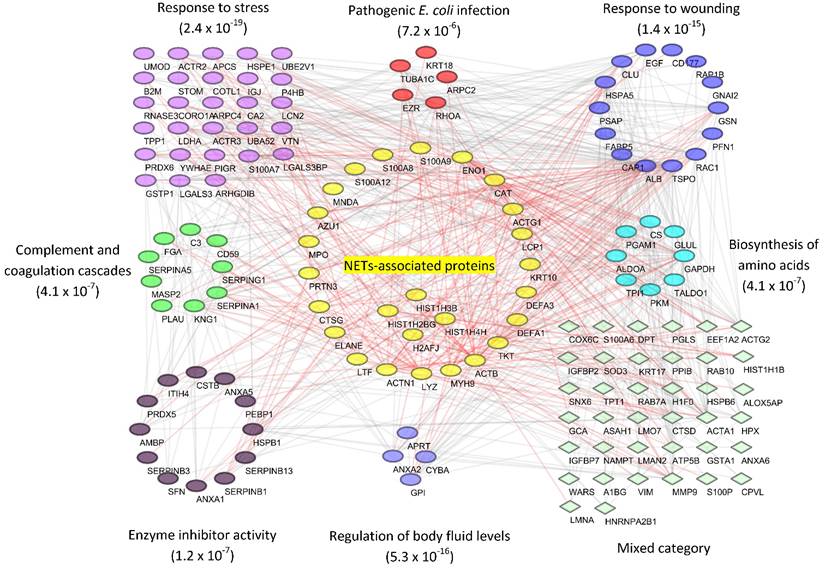
In the interaction network, 24 proteins that were known to be associated with neutrophil extracellular traps (NETs)[55] are visualized in the center. Activated neutrophils were recently found to release decondensed chromatin fibers (e.g., DNA and histones), granule proteins and other antimicrobial molecules to trap and kill bacteria.[55] Our analysis shows that 24 NETs-associated proteins constituted up to 43% of the total UP protein mass (Supplemental Figure S6), allowing us to infer a potentially central role of NETs in the defense against uropathogens.
Discussion
Comprehensive urinary proteomics
Urinary sediments (or pellets) and their proteomes are complex in nature. This complexity is increased if there is inflammation in the urogenital tract, most frequently caused by the occurrence of a UTI. Doucette et al. reported the first investigation of a UP proteome identifying 60 proteins.[32] By using metaproteomics approaches, we reported the identification of up to 1,887 proteins from a single UP sample[40], and we showed that such protein profiles yielded information on inflammation and UTIs useful as a diagnostic test in clinical urology.[34, 42] In this study, we continued to examine the urinary proteome by surveying both SU and UP fractions from a total of 45 specimens collected for clinical tests on urinary pathologies (dtUTI samples) as well as healthy controls (HC samples). Collapsing all proteome profiles of 33 dtUTI sample sets, 5,327 non-redundant human proteins were identified by LC-MS/MS. Given the high amino acid sequence similarities among many orthologous proteins of bacteria part of the same phylogenetic group (family), a conservative estimate for the total number of bacterial proteins we identified in this effort is 1,206. A comparison of our data with three previous urinary proteome surveys revealed that proteins that were shared were in the minority with only 258 proteins (Supplemental Figure S3). Given that 25% of the specimens showed clear evidence of UTIs, which trigger neutrophil infiltration in the urinary tract, and another 25% of the specimens suggested exfoliation of squamous epithelial cells not normally observed in the healthy urinary tract, it was not unexpected that we identified many proteins (more than 3,000) not previously reported in urinary proteomics datasets. Proteomic evidence for exfoliation of squamous epithelial cells may be associated with vaginal fluid contamination, vaginosis, idiopathic cystitis, prostatitis and genitourinary surgery.[56] The fact that we pooled all datasets, separately surveyed UP from SU fractions, and used specimens with diverse pathologies obviously contributed to the gain in the number of protein IDs compared to previously published data.
Using LC-MS/MS and label-free quantification (LFQ) to compare proteomes of clinical urine samples from larger cohorts, one challenge is to reproducibly identify and quantify hundreds of proteins given the absence of homeostasis and occurrence of urinary proteolysis, resulting in considerable inter- and intra-individual proteome differences.[25] Another issue is that urine samples may be collected over an extended time frame and are run by LC-MS/MS without multiplexing, thus making the alignment of XICs across multiple samples difficult due to retention time shifts and instrument drifts.[57] Spectral count and integrated peak area-based approaches (for instance, the top-3 peptide ions per protein) have also been employed for semi-quantitative proteomic analyses of clinical samples [50-52]. We chose the latter two and the LFQ-based method to analyze a large set of urine proteomic profiles (Supplemental Figure S4) to gain confidence that the LFQ-based method was appropriate to perform clustering and other bioinformatics analyses on urine specimens in the context of urinary tract pathologies. All three methods returned similar HCL clusters for 66 samples, clearly separating the UP proteome from the SU proteome datasets.
Associating urinary tract pathologies with distinct proteomic profiles in UP and SU fractions
Since 25% of the urine specimens showed IDs of uropathogens and an even larger percentage evidence of inflammation based on urinalysis data, we performed global biological process enrichment and clustering experiments. Indeed, enriched biological processes were immune responses and repair of injured tissues. The categories cell adhesion, motion and migration were enriched in SU samples (Figure 3C). Enrichment of 'response to wounding' and 'acute inflammation' categories were shared by SU and UP datasets. Hierarchical clustering analyses selectively performed for both UP and SU datasets separated UTI and urothelial injury (ERY) cases from healthy control cases and EXF cases with few outliers (Figure 4). The EXF cases, revealing relatively high squamous epithelial contents in urine sediments, were often associated with urogenital commensal bacteria, in particular Lactobacillus and G. vaginalis. High levels of colonization with G. vaginalis has also been linked to bacterial vaginosis and, although rarely, to UTIs.
UP and SU datasets were clearly separated by the big clustering analysis (Figure 4). Analyzing a subset of samples,12 UTI and 12 HC subjects only, provided similar evidence (Supplemental Figure S8). A couple of outliers of SU datasets (SU_#8 and SU_#16) showed evidence of UTI and massive neutrophil infiltration in the urinary tract. This pathological process was inferred from high leukocyte counts via microscopy, high LE activities, and high abundances of neutrophil granule effector proteins in proteome datasets. In addition to their roles in phagocytic processes [46], such effector proteins are released from the cells via degranulation and neutrophil extracellular trap (NET) formation [55] [58]. The term pyuria which is associated with UTIs [59] probably implicates all three processes neutrophils use to kill the invading pathogen. Up to 28% and 62% of the total protein mass in SU and UP proteomes, respectively, pertained to the neutrophil effector proteins (Figure 2, #16). This data was further evidenced by another two UTI samples during validation (#34 and #35 in the cluster in Figure 4; clinical data was not obtained). We have no evidence for their presence in urinary exosomes, an non-cellular structure that forms in the absence of inflammation in the urinary tract [60]. Clustering analysis revealed distinct proteomic patterns shared by specimens that we associated with the EXF pathology. Among the proteins particularly enriched in the UP fractions were cornulin, stratifin, desmoplakin, periplakin, small proline-rich protein 3, and serpin B3. These proteins are essential, abundant components of the cytoskeleton of squamous epithelial and urothelial cells. While we had no evidence of specific underlying pathological conditions, the proteomic patterns were clearly different from those of healthy control specimens. While exfoliation of urothelial and stratified squamous epithelial cells in the distal urethra and proximal genital mucosal tissue in women is part of the normal mucosal renewal process, the observed proteomic differences comparing the HC samples with those of the EXF phenotype and additional evidence of inflammation for the latter, based on urinalysis data, suggested perturbations in the urogenital tract of the subjects. Contamination from inflamed vaginal tissue and the occurrence of bacterial vaginosis could not be excluded.[34]
We were interested in comparisons of host-pathogen and host-commensal interactions. Uropathogens, present in the 12 UTI cases, expressed iron and zinc acquisition and oxidative stress response proteins. In contrast, such proteins were not identified from proteomic data pertaining to the urogenital commensal organisms (Lactobacillus, Prevotella) and bacterial vaginosis-associated G. vaginalis. By subjecting one UTI dataset to in silico reconstruction of a protein network using the STRING prediction tool (Figure 6), the important role of neutrophils in the innate immune defense against pathogens in the urinary tract was highlighted. Our data encourage the assumption that proteins implicated in responses to oxidative stress and iron starvation are more highly produced in bacteria upon challenges by infiltrating immune cells such as neutrophils. The battle for iron and zinc implicates human proteins such as LTF and lipocalin, which are not only abundant in neutrophils [46] but also secreted by urothelial cells.[61] Pathogens such as E. coli, K. pneumoniae, and P. mirabilis express a range of proteins allowing iron acquisition: enzymes involved in siderophore biosynthesis; iron ABC transporter systems; and cell surface receptors for siderophores. Some of these have been characterized in E. coli and P. mirabilis.[59, 62] In some UTI cases, neither the level of inflammation nor the abundance of bacterial stress and starvation response proteins was high. Potential explanations are bacteria in dormant states and biofilms, not responding to the presence of antibacterial effectors, or invisibility to cells of the immune system by formation of intra-urothelial cell bacterial communities.[63] ROS inactivating peroxidases and superoxide dismutases, expressed in high abundance in bacterial pathogens in the UTI cases, likely are a response to the insults inflicted by NADPH oxidase, the main producer of ROS in neutrophils. Proteins involved in antibacterial activities, immune cell signaling, and chemotaxis were highly connected in the network analysis (Figure 6). In addition to neutrophil effectors (ELANE and MPO), these are mediators of inflammation and vascular function (KNG1, AMBP, SERPINA1, and EGF), and proteins involved in tissue repair (CLU, MMP9, and RAC1).
In conclusion, the present study characterizes the urinary proteome under pathological conditions (vascular injury, infection, inflammation, and high levels of exfoliation of squamous epithelial and/or urothelial cells) in comparison with HC samples. Using clustering analyses, we demonstrate that two distinct fractions (SU and UP) have different protein compositions and that both fractions contribute to information useful to discern health and disease in the urinary tract. There is evidence of dynamic movements of proteins among the two fractions. For instance, coagulation and complement proteins were enriched in the UP fraction following vascular injury. Indeed, such pathways depend on interactions at the soluble/cell surface interface and aggregation of protein structures. Neutrophil effector proteins, generally abundant in the UP fraction of UTI cases, were also prominently represented in corresponding SU fractions if there was evidence of massive infiltration with this cell type. This observation points towards extracellular release of such effectors to combat invading pathogens using mechanisms other than phagocytosis. Our efforts to expand the knowledge of the urinary proteome under perturbed conditions should be useful as reference dataset in the search of biomarkers examining patient cohorts afflicted by specific pathologies including urogenital cancers, interstitial cystitis, incontinence, neurogenic bladder, and diseases of the kidneys.
Abbreviations
CFU: colony-forming units; dtUTI: diagnostic test for UTI; ERY: erythrocyte leakage into urine; EXF: exfoliation of urothelial and squamous epithelial cells; GO: Gene Ontology; HC: healthy control; HCL: hierarchical clustering: ID: identification; LFQ: label-free quantitation; MWCO: molecular weight cut-off; PCA: principal component analysis; PSM: peptide-spectrum match; ROS: reactive oxygen species; RNS: reactive nitrogen species; SU: soluble urine; UP: urinary pellet: UTI: urinary tract infection.
Supplementary Material
Additional File 1Supplemental Figures.
Table S1.
Table S2.
Table S3.
Table S4.
Acknowledgements
We thank the National Institute of General Medical Sciences, National Institutes of Health, via grant 5R01GM103598-02, the J. Craig Venter Institute, and Dr. J. Craig Venter for funding the study. We thank the Ruggles Family Foundation for a contribution to fund the mass spectrometer used for the research. We thank Tamara Tsitrin for technical assistance in the laboratory, Dr. Harinder Singh for assistance with bioinformatics analyses, and David Haft for discussions on network analysis methods. The funding bodies did not have a role in study design, data collection and analysis, decision to publish, and preparation of the manuscript.
Competing Interests
The authors have declared that no competing interest exists.
References
1. Barratt J, Topham P. Urine proteomics: The present and future of measuring urinary protein components in disease. Can. Med. Assoc. J. 2007;177:361-368
2. Fliser D, Novak J, Thongboonkerd V, Argilés À, Jankowski V, Girolami MA. et al. Advances in urinary proteome analysis and biomarker discovery. J. Am. Soc. Nephrol. 2007;18:1057-1071
3. Decramer S, de Peredo AG, Breuil B, Mischak H, Monsarrat B, Bascands J-L. et al. Urine in clinical proteomics. Mol. Cell. Proteomics. 2008;7:1850-1862
4. Tryggvason K, Wartiovaara J. How does the kidney filter plasma? Physiology. 2005;20:96-101
5. Simerville JA, Maxted WC, Pahira JJ. Urinalysis: A comprehensive review. Am. Fam. Physician. 2005;71:1153-1162
6. Pisitkun T, Johnstone R, Knepper MA. Discovery of urinary biomarkers. Mol. Cell. Proteomics. 2006;5:1760-1771
7. Gupta A, Bansal N, Houston B. Metabolomics of urinary tract infection: A new uroscope in town. Expert Rev. Mol. Diagn. 2012;12:361-369
8. Wang X, Zhang A, Han Y, Wang P, Sun H, Song G. et al. Urine metabolomics analysis for biomarker discovery and detection of jaundice syndrome in patients with liver disease. Mol. Cell. Proteomics. 2012;11:370-380
9. Contrepois K, Jiang L, Snyder M. Optimized analytical procedures for the untargeted metabolomic profiling of human urine and plasma by combining hydrophilic interaction and reverse-phase liquid chromatography - mass spectrometry. Mol. Cell. Proteomics. 2015 doi: 10.1074/mcp.M1114.046508; In press
10. Chen Y-T, Chen H-W, Domanski D, Smith DS, Liang K-H, Wu C-C. et al. Multiplexed quantification of 63 proteins in human urine by multiple reaction monitoring-based mass spectrometry for discovery of potential bladder cancer biomarkers. J. Proteomics. 2012;75:3529-3545
11. Smith C, Batruch I, Bauca J, Kosanam H, Ridley J, Bernardini M. et al. Deciphering the peptidome of urine from ovarian cancer patients and healthy controls. Clinical Proteomics. 2014;11:23
12. Sigdel T, Nicora C, Hsieh S-C, Dai H, Qian W-J, Camp D. et al. Optimization for peptide sample preparation for urine peptidomics. Clinical Proteomics. 2014;11:7
13. Sylvester KG, Ling XB, Liu GY, Kastenberg ZJ, Ji J, Hu Z. et al. A novel urine peptide biomarker-based algorithm for the prognosis of necrotising enterocolitis in human infants. Gut. 2014;63:1284-1292
14. Lacroix C, Caubet C, Gonzalez-de-Peredo A, Breuil B, Bouyssie D, Stella A. et al. Label-free quantitative urinary proteomics identifies the arginase pathway as a new player in congenital obstructive nephropathy. Mol. Cell. Proteomics. 2014;13:3421-3434
15. Truong M, Yang B, Jarrard DF. Toward the detection of prostate cancer in urine: A critical analysis. J. Urol. 2013;189:422-429
16. Nkuipou-Kenfack E, Koeck T, Mischak H, Pich A, Schanstra JP, Zürbig P. et al. Proteome analysis in the assessment of ageing. Ageing Res. Rev. 2014;18:74-85
17. Hsueh M-F, Önnerfjord P, Kraus VB. Biomarkers and proteomic analysis of osteoarthritis. Matrix Biol. 2014;39:56-66
18. Carty DM, Siwy J, Brennand JE, Zürbig P, Mullen W, Franke J. et al. Urinary proteomics for prediction of preeclampsia. Hypertension. 2011;57:561-569
19. Keller S, Rupp C, Stoeck A, Runz S, Fogel M, Lugert S. et al. Cd24 is a marker of exosomes secreted into urine and amniotic fluid. Kidney Int. 2007;72:1095-1102
20. Valadi H, Ekstrom K, Bossios A, Sjostrand M, Lee JJ, Lotvall JO. Exosome-mediated transfer of mrnas and micrornas is a novel mechanism of genetic exchange between cells. Nat. Cell Biol. 2007;9:654-659
21. Hogan MC, Bakeberg JL, Gainullin VG, Irazabal MV, Harmon AJ, Lieske JC. et al. Identification of biomarkers for pkd1 using urinary exosomes. J. Am. Soc. Nephrol. 2015 DOI: 10.1681/asn.2014040354
22. Zubiri I, Posada-Ayala M, Sanz-Maroto A, Calvo E, Martin-Lorenzo M, Gonzalez-Calero L. et al. Diabetic nephropathy induces changes in the proteome of human urinary exosomes as revealed by label-free comparative analysis. J. Proteomics. 2014;96:92-102
23. Duijvesz D, Burnum-Johnson KE, Gritsenko MA, Hoogland AM, Vredenbregt-van den Berg MS, Willemsen R. et al. Proteomic profiling of exosomes leads to the identification of novel biomarkers for prostate cancer. PLoS One. 2013;8:e82589
24. Adachi J, Kumar C, Zhang Y, Olsen J, Mann M. The human urinary proteome contains more than 1500 proteins, including a large proportion of membrane proteins. Genome Biol. 2006;7:R80
25. Hüttenhain R, Soste M, Selevsek N, Röst H, Sethi A, Carapito C. et al. Reproducible quantification of cancer-associated proteins in body fluids using targeted proteomics. Sci. Transl. Med. 2012;4:142ra194
26. Kentsis A, Monigatti F, Dorff K, Campagne F, Bachur R, Steen H. Urine proteomics for profiling of human disease using high accuracy mass spectrometry. Proteom. Clin. Appl. 2009;3:1052-1061
27. Pieper R, Gatlin CL, McGrath AM, Makusky AJ, Mondal M, Seonarain M. et al. Characterization of the human urinary proteome: A method for high-resolution display of urinary proteins on two-dimensional electrophoresis gels with a yield of nearly 1400 distinct protein spots. Proteomics. 2004;4:1159-1174
28. Knepper MA, Pisitkun T. Exosomes in urine: Who would have thought..? Kidney Int. 2007;72:1043-1045
29. Friedrich MG, Weisenberger DJ, Cheng JC, Chandrasoma S, Siegmund KD, Gonzalgo ML. et al. Detection of methylated apoptosis-associated genes in urine sediments of bladder cancer patients. Clin. Cancer Res. 2004;10:7457-7465
30. Yu J, Zhu T, Wang Z, Zhang H, Qian Z, Xu H. et al. A novel set of DNA methylation markers in urine sediments for sensitive/specific detection of bladder cancer. Clin. Cancer Res. 2007;13:7296-7304
31. Johnson AC, Ware LB, Himmelfarb J, Zager RA. Hmg-coa reductase activation and urinary pellet cholesterol elevations in acute kidney injury. Clin. J. Am. Soc. Nephrol. 2011;6:2108-2113
32. Mataija-Botelho D, Murphy P, Pinto DM, MacLellan DL, Langlois C, Doucette AA. A qualitative proteome investigation of the sediment portion of human urine: Implications in the biomarker discovery process. Proteom. Clin. Appl. 2009;3:95-105
33. Fouts D, Pieper R, Szpakowski S, Pohl H, Knoblach S, Suh M-J. et al. Integrated next-generation sequencing of 16s rdna and metaproteomics differentiate the healthy urine microbiome from asymptomatic bacteriuria in neuropathic bladder associated with spinal cord injury. J. Transl. Med. 2012;10:174
34. Yu Y, Sikorski P, Bowman-Gholston C, Cacciabeve N, Nelson K, Pieper R. Diagnosing inflammation and infection in the urinary system via proteomics. J. Transl. Med. 2015;13:1-14
35. Lassek C, Burghartz M, Chaves-Moreno D, Otto A, Hentschker C, Fuchs S. et al. A metaproteomics approach to elucidate host and pathogen protein expression during catheter-associated urinary tract infections. Mol. Cell. Proteomics. 2015
36. Suh M-J, Kuntumalla S, Yu Y, Pieper R. Proteomes of pathogenic escherichia coli/shigella group surveyed in their host environments. Expert Rev. Proteomics. 2014;11:593-609
37. Ma B, Forney LJ, Ravel J. Vaginal microbiome: Rethinking health and disease. Annu. Rev. Microbiol. 2012;66:371-389
38. Whiteside SA, Razvi H, Dave S, Reid G, Burton JP. The microbiome of the urinary tract-a role beyond infection. Nat. Rev. Urol. 2015;12:81-90
39. Vizcaíno JA, Csordas A, del-Toro N, Dianes JA, Griss J, Lavidas I. et al. 2016 update of the pride database and its related tools. Nucleic Acids Research. 2015;44:447-456
40. Yu Y, Suh M-J, Sikorski P, Kwon K, Nelson KE, Pieper R. Urine sample preparation in 96-well filter plates for quantitative clinical proteomics. Anal. Chem. 2014;86:5470-5477
41. Yu Y, Pieper R. Urine sample preparation in 96-well filter plates to characterize inflammatory and infectious diseases of the urinary tract. In: (ed.) Gao Y. Urine proteomics in kidney disease biomarker discovery. Springer Netherlands. 2015:77-87
42. Yu Y, Pieper R. Urinary pellet sample preparation for shotgun proteomic analysis of microbial infection and host-pathogen interactions. Methods in Molecular Biology. 2015;1295:65-74
43. Yu Y, Smith M, Pieper R. A spinnable and automatable stagetip for high throughput peptide desalting and proteomics. Protocol Exchange. 2014 doi:10.1038/protex.2014.1033
44. Huang Y, Niu B, Gao Y, Fu L, Li W. Cd-hit suite: A web server for clustering and comparing biological sequences. Bioinformatics. 2010;26:680-682
45. Hettich RL, Pan C, Chourey K, Giannone RJ. Metaproteomics: Harnessing the power of high performance mass spectrometry to identify the suite of proteins that control metabolic activities in microbial communities. Anal. Chem. 2013;85:4203-4214
46. Lominadze G, Powell DW, Luerman GC, Link AJ, Ward RA, McLeish KR. Proteomic analysis of human neutrophil granules. Mol. Cell. Proteomics. 2005;4:1503-1521
47. Rørvig S, Østergaard O, Heegaard NHH, Borregaard N. Proteome profiling of human neutrophil granule subsets, secretory vesicles, and cell membrane: Correlation with transcriptome profiling of neutrophil precursors. J. Leukoc. Biol. 2013;94:711-721
48. Santucci L, Candiano G, Petretto A, Bruschi M, Lavarello C, Inglese E. et al. From hundreds to thousands: Widening the normal human urinome (1). J. Proteomics. 2015;112:53-62
49. Bourderioux M, Nguyen-khoa T, Chhuon C, Jeanson L, Tondelier D, Walczak M. et al. A new workflow for proteomic analysis of urinary exosomes and assessment in cystinuria patients. J. Proteome Res. 2014;14:567-577
50. Cretu D, Liang K, Saraon P, Batruch I, Diamandis E, Chandran V. Quantitative tandem mass-spectrometry of skin tissue reveals putative psoriatic arthritis biomarkers. Clinical Proteomics. 2015;12:1
51. Qian W-J, Jacobs JM, Liu T, Camp DG, Smith RD. Advances and challenges in liquid chromatography-mass spectrometry-based proteomics profiling for clinical applications. Mol. Cell. Proteomics. 2006;5:1727-1744
52. Xie F, Liu T, Qian W-J, Petyuk VA, Smith RD. Liquid chromatography-mass spectrometry-based quantitative proteomics. J. Biol. Chem. 2011;286:25443-25449
53. Dyer MD, Murali TM, Sobral BW. Computational prediction of host-pathogen protein-protein interactions. Bioinformatics. 2007;23:i159-i166
54. Jensen LJ, Kuhn M, Stark M, Chaffron S, Creevey C, Muller J. et al. String 8—a global view on proteins and their functional interactions in 630 organisms. Nucleic Acids Res. 2009;37:D412-D416
55. Urban CF, Ermert D, Schmid M, Abu-Abed U, Goosmann C, Nacken W. et al. Neutrophil extracellular traps contain calprotectin, a cytosolic protein complex involved in host defense against candida albicans. PLoS Pathog. 2009;5:e1000639
56. Nagaraj N, Mann M. Quantitative analysis of the intra- and inter-individual variability of the normal urinary proteome. J. Proteome Res. 2010;10:637-645
57. Weisser H, Nahnsen S, Grossmann J, Nilse L, Quandt A, Brauer H. et al. An automated pipeline for high-throughput label-free quantitative proteomics. J. Proteome Res. 2013;12:1628-1644
58. Brinkmann V, Reichard U, Goosmann C, Fauler B, Uhlemann Y, Weiss DS. et al. Neutrophil extracellular traps kill bacteria. Science. 2004;303:1532-1535
59. Nielubowicz GR, Mobley HLT. Host-pathogen interactions in urinary tract infection. Nat. Rev. Urol. 2010;7:430-441
60. Pisitkun T, Shen R-F, Knepper MA. Identification and proteomic profiling of exosomes in human urine. Proc. Natl. Acad. Sci. U. S. A. 2004;101:13368-13373
61. Weichhart T, Haidinger M, Hörl WH, Säemann MD. Current concepts of molecular defence mechanisms operative during urinary tract infection. Eur. J. Clin. Invest. 2008;38:29-38
62. Sabri M, Houle S, Dozois CM. Roles of the extraintestinal pathogenic escherichia coli znuacb and zupt zinc transporters during urinary tract infection. Infect. Immun. 2009;77:1155-1164
63. Rosen DA, Hooton TM, Stamm WE, Humphrey PA, Hultgren SJ. Detection of intracellular bacterial communities in human urinary tract infection. PLos Med. 2007;4:e329
Author contact
![]() Corresponding authors: Yanbao Yu, email: yayuorg, tel: (301) 795-7868, fax: (301) 795-7052; Rembert Pieper, email: rpieperorg, tel: (301) 795-7605, fax: (301) 795-7070.
Corresponding authors: Yanbao Yu, email: yayuorg, tel: (301) 795-7868, fax: (301) 795-7052; Rembert Pieper, email: rpieperorg, tel: (301) 795-7605, fax: (301) 795-7070.