Impact Factor
- Issue 13; 2026
- Issue 12; 2026
- Issue 11; 2026
- Issue 10; 2026
- Issue 9; 2026
- Volume 16; 2026
- Advance Articles
- Past Issues
- Cover Images
- Cover Suggestion
- Index & Coverage
- Special Issues
Introduction
Materials and Methods
Results and Discussion
Review of results
Abbreviations
Supplementary Material
Acknowledgements
References
International Journal of Biological Sciences
International Journal of Medical Sciences
 Global reach, higher impact

Theranostics 2017; 7(2):436-451. doi:10.7150/thno.17218 This issue Cite
Research Paper
Proton MR Spectroscopy and Diffusion MR Imaging Monitoring to Predict Tumor Response to Interstitial Photodynamic Therapy for Glioblastoma
Magali Toussaint1,2, Sophie Pinel1,2, Florent Auger3, Nicolas Durieux3, Magalie Thomassin1,2, Eloise Thomas6, Albert Moussaron6, Dominique Meng1,2, François Plénat1,2, Marine Amouroux1,2, Thierry Bastogne1,2, Céline Frochot4,5, Olivier Tillement6, François Lux6, Muriel Barberi-Heyob1,2 ![]()
1. CRAN UMR 7039, CNRS, Vandœuvre-lès-Nancy, France;
2. CRAN UMR 7039, Université de Lorraine, Vandœuvre-lès-Nancy, France;
3. Plateforme d'imagerie du vivant - Plateau Préclinique, Université de Lille - Droit et Santé, Lille, France;
4. LRGP UMR 7274 NRS, Nancy, France;
5. LRGP UMR 7274, Université de Lorraine, Nancy, France;
6. ILM UMR 5306 CNRS, Claude Bernard-University, Lyon, France.
Received 2016-8-16; Accepted 2016-10-12; Published 2017-1-5
Abstract

Despite recent progress in conventional therapeutic approaches, the vast majority of glioblastoma recur locally, indicating that a more aggressive local therapy is required. Interstitial photodynamic therapy (iPDT) appears as a very promising and complementary approach to conventional therapies. However, an optimal fractionation scheme for iPDT remains the indispensable requirement. To achieve that major goal, we suggested following iPDT tumor response by a non-invasive imaging monitoring. Nude rats bearing intracranial glioblastoma U87MG xenografts were treated by iPDT, just after intravenous injection of AGuIX® nanoparticles, encapsulating PDT and imaging agents. Magnetic Resonance Imaging (MRI) and Magnetic Resonance Spectroscopy (MRS) allowed us an original longitudinal follow-up of post-treatment effects to discriminate early predictive markers. We successfully used conventional MRI, T2 star (T2*), Diffusion Weighted Imaging (DWI) and MRS to extract relevant profiles on tissue cytoarchitectural alterations, local vascular disruption and metabolic information on brain tumor biology, achieving earlier assessment of tumor response. From one day post-iPDT, DWI and MRS allowed us to identify promising markers such as the Apparent Diffusion Coefficient (ADC) values, lipids, choline and myoInositol levels that led us to distinguish iPDT responders from non-responders. All these responses give us warning signs well before the tumor escapes and that the growth would be appreciated.
Keywords: Interstitial photodynamic therapy, Glioblastoma, In Vivo non-invasive imaging, Multifunctional nanoparticles, Image guided therapy, Therapy assessment.
Introduction
With a 5-years overall survival rate of about 2%, the medical management of patients with glioblastoma (GBM) requires major improvements [1]. Despite a heavy line of treatments composed of surgery, radiotherapy and chemotherapy unfortunately, a tumor recurrence is always reported [2]. Improvements for the follow-up of the patients will come from new therapeutic approaches as complementary line of treatment. In this context, photodynamic therapy (PDT) stands as an interesting complementary approach for recurrent GBM [3]. Briefly, PDT is a local therapy that uses non-ionizing light from a LASER diode to activate a photoactivatable molecule called photosensitizer such as porphyrin or chlorin derivatives. Activation of this photosensitizer requires a suitable wavelength of the light to produce reactive oxygen species (ROS) and free radicals. We previously demonstrated that PDT stimulates the expression of several inflammatory mediators, including tumor necrosis factor-{alpha}, IL-6 [4]. Photodynamic therapy causes direct cytotoxicity to malignant cells and also indirect effects upon various non-malignant components of the tumor microenvironment. This action can lead to PDT-mediated angiogenesis and inflammation, which are emerging as important determinants of PDT responsiveness [4] [5] [6]. In the case of iPDT, the light is fed directly into the tumor tissue, allowing a physical targeting. Unfortunately, biological effects are often limited by the photons propagation; indeed, light penetration through tissues depends on the tissue's specific optical properties [7].
A phase II clinical trial (NCT01966809) was suggested to use PDT for recurrent high grade gliomas in intraoperative to improve the quality of the resection by cleaning up the resection banks. PDT offers a localized treatment approach in which improvements in local control of GBM may result in significant improved survival[8] [9][10]. However, the limitation mainly relies on the difficulty to highlight very early the presence of residual neoplastic cells post-treatment. Indeed, improvements in the relapse detection might help the clinician to a better treatment planning. In the last decade, Magnetic Resonance Imaging (MRI) has become the method of choice for diagnosis, intraoperative guiding and also for the treatment follow-up [11]. The routine MRI sequences used in the clinical practices of GBM are T2/FLAIR and T1 pre- and post-gadolinium injection. Both are suggested for diagnostic, treatment planning and even for intraoperative navigation [12]. Nevertheless, these sequences separately used can lead to misinterpretation and delay in the establishment of the prognosis [13]. Advanced MRI techniques bestow much more relevant information on GBM development such as cellularity, invasiveness, mitotic activity, angiogenesis and necrosis, helping in the glioma grading before treatment and follow-up after treatment [11]. This is the reason why advanced MRI, such as Diffusion Weighted-Imaging (DWI), 1H-Magnetic Resonance Spectroscopy (MRS) could be excellent tools to characterize and follow-up the tumor response to iPDT.
Bobek-Billewicz et al. suggested using DWI to discriminate radiation necrosis from tumor recurrence and to adapt the clinical management more quickly [14]. Indeed, before the resumption of tumor growth or a change in contrast enhancement, molecular changes occur into the tumor tissue and could be detected earlier with other MRI sequences than T1 (pre- and post-gadolinium injection) and T2/FLAIR. DWI remains a very promising MR sequence that allows analyzing water mobility and collates relevant information on tissue architecture at a microscopic level [15] [16] [17] [Le-Bihan, D. Diffusion MRI: what water tells us about the brain EMBO Molecular Medicine, 2014, 6, 569-73; Kalpathy-Cramer, J.; Gerstner, E. R.; Emblem, K. E.; Andronesi, O. & Rosen, B. Advanced Magnetic Resonance Imaging of the Physical Processes in Human Glioblastoma Cancer Res, 2014, 74, 4622-4637; Schaefer, P. W.; Grant, P. E. & Gonzalez, R. G. Diffusion weighted MR Imaging of the Brain Radiology, 2000, 217, 331-45]. Precious additional clinical studies on its utility and effectiveness as prognosis response in cancer treatment have previously concluded that DWI could be suggested as a biomarker, requiring to be tested in more appropriated clinical trials [18]. The T2* weighted imaging is sensitive to the presence of hemoglobin and water content appears hyperintense into the tumor tissue. Mabray et al. present this sequence as a tool to follow chronic micro bleeds induced by radiation therapy [19] [20].
Magnetic Resonance Spectroscopy (MRS) offers a wide range of potential prognostic factors, but is still under investigation mainly due to the complexity of the data evaluation. MRS provides important information on tumor metabolism, such as N-acetyl-aspartate (NAA), choline, or creatine levels [21] [22]. This sequence could become a standard and represents a valuable diagnostic tool for evaluation of metabolic changes in intracranial neoplasms after radio surgical treatment [23]. Several studies have already suggested metabolites ratio such as choline/NAA or choline/creatine as an early predictive value in the tumor response after surgery and radiotherapy [24] [25].
Despite the wealth of information gathered by these MRI sequences, the lack of consensus on the methodology makes their routine clinical practice still difficult and under debate.
To demonstrate the feasibility of the iPDT followed by MRI, our team evaluated the potential of AGuIX® multifunctional nanoparticle composed by the combination of MRI contrast agents and a photosensitizer for iPDT [26]. We demonstrated a positive contrast enhancement of the tumor tissue using T1-weighted imaging few minutes post-intravenous (i.v.) injection of these multifunctional nanoparticles. These nanoparticles provide interesting possibilities for new avenues to significantly improve iPDT. The positive contrast enhancement of the tumor tissue allowed us to optimize the optical fiber implantation. Moreover, a judicious choice of iPDT regimens could be suggested to promote iPDT efficiency and to consider a rationalized fractionated treatment. In this original preclinical paper our goal was to characterize by MRS, DWI and T2* the direct and indirect iPDT effects on an orthotopic human GBM model in nude rats and to elicit early predictive values of the treatment efficiency. For the first time, we demonstrated the ability of a longitudinal follow-up to characterize the tumor response by structural, vascular and metabolic ways and unexpectedly, we clearly highlighted the ability to discriminate iPDT non-responding from responding animals.
Materials and Methods
Nanoparticles synthesis: AGuIX® nanoparticles were prepared in diethylene glycol (DEG) according to Le Duc et al [27]. AGuIX® nanoparticles (1500 µmol of Gd3+) were dispersed in water at a pH of 7.4 (3 mL, [Gd3+] = 500 mM). After 1 hour, the suspension was heated at 40°C and DEG (12 mL) already heated at 40°C was added. A solution of 5-(4-carboxyphenyl succinimide ester)-10,15,20-triphenylporphyrin (113.4 mg, 150 µmol, 10 Gd3+ per TPP) in dimethyl sulfoxide (DMSO) (7.56 mL, [TPP] = 15mL/mL) was added drop by drop to the dispersion of nanoparticles under stirring. The mixture was stirred at 40°C for 12 hours in the dark.
Number of TPP per Gd quantification: Lyophilized nanoparticles were first dispersed in water for one hour at room temperature, [Gd3+] =50 mM and pH=7.4. Then the solution was diluted in water to [Gd3+] = 0.5 mM and absorbance measured at 520 nm, 555 nm, 590 nm and 650 nm (Q bands). The nanoparticles solution was diluted to [Gd3+] = 27 µM in water and absorbance measured at 420 nm (Soret band). The average result gives 14 Gd3+ per TPP.
Photophysical properties: Absorption spectra were recorded on a Perkin-Elmer (Lambda 2, Courtaboeuf, France) UV-visible spectrophotometer. Fluorescence spectra were recorded on a SPEX Fluorolog-3 spectrofluorimeter (Jobin Yvon, Longjumeau, France) equipped with a thermo stated cell compartment (25°C), using a 450 W Xenon lamp. Fluorescence quantum yields (Φf) were determined using a TPP solution as a fluorescence standard. For the direct determination of singlet oxygen quantum yield (FD): excitation occurred with a Xe-arc, the light was separated in a SPEX 1680, 0.22 µm double monochromator. The detection at 1270 nm was done through a PTI S/N 1565 monochromator, and the emission was monitored by a liquid nitrogen-cooled Ge-detector model (EO-817L, North Coast Scientific Co).
Dynamic light scattering size and ζ-potential measurements: Direct measurements of the size distribution of the nanoparticles suspended in any medium were performed via Zetasizer NanoS DLS (Dynamic light scattering, laser He-Ne 633 nm) from Malvern Instrument. The ζ-potential of the nanoparticles was also performed via a Zetasizer NanoS. Prior to the experiment, the nanoparticles were diluted in an aqueous solution containing 0.01 M NaCl and adjusted to pH 7.4.
U87 Glioblastoma cell culture: U87 glioblastoma cells (ATCC, Manassas, VA, USA) were maintained in monolayer culture (37°C, 5% CO2, 95% O2) in Dulbecco's modified eagle medium (DMEM) supplemented with 10% fetal bovine serum (PAN biotech, GmbH, Aidenbach, Germany), 5% penicillin and streptomycin, 1.25% sodium pyruvate, 1% essential amino acid, 0.5% non-essential amino acid, 0.4% vitamins, 1% L-glutamine, L-serine, L-asparagine (Gibco, invitrogen, Saint Aubin, France).
Animals and stereotactic xenograft implantation: Animal procedures were performed according to institutional and national guidelines. All experiments were performed in accordance with animal care guidelines (Directive 2010/63/EU) and carried out by competent and authorized persons (personal authorization number 54-89 issued by the Department of Vetenary Services) in a registered establishment (establishment number C-54-547-03 issued by the Department of Vetenary Services). Male athymic nude rats (Hsd:RH-Foxn1rnu) were chosen for this study (Envigo, Gannat, France). The rats were used for tumor implantation at age of 8 weeks (180-220 g). During microsurgery (implantation or treatment protocol) and all acquisitions with microimaging, rats were anesthetized with a mixture of air and isoflurane concentrate (1.5-2% depending on the breathing) under sterile conditions. The rats were placed into a Kopf stereotactic frame (900M Kopf Instruments, Tujunga, CA). A midline incision was done and a burr hole was drilled 0.5 mm anterior and 2.7 mm lateral to the bregma. A skull anchor (Patent N° 11 55596) was fixed. 5.104 U87 cells were suspended in 5 µL Hank's Buffered Salt Solution (HBSS, 1X) and were injected in 4.4 mm into the brain parenchyma with a flow of 0.2 µL/min using a 10 µL Hamilton syringe. After injection, the scalp incision was sutured (Suture 6.0 filament) and the surface was antiseptically cleaned.
Nanoparticles preparation for in vivo studies: Nanoparticles were suspended in ultrapure water and NaCl 9% (20:80) to obtain an equivalent concentration of 2.5 mM TPP or 60 mM Gd. Each batch of nanoparticles was buffered in order to obtain an iso-osmolar solution and pH 7.4 and conserved at 5°C. Injected TPP amounted to 1.75 µmol/kg as previously described [26]. The injection solution was prepared by dissolution in 9% NaCl to obtain an injection volume of 600 µL (e.g. 0.525 µmol of TPP or 12.7 µmol of Gd for a body weight of 300 g) and injected, following by 600 µL of 9% NaCl were injected during 1 min.
Interstitial Photodynamic Therapy: The treatment happens 10-12 days after the graft when the tumor reached approximately 2.5±0.5 mm of diameter. The animal was maintained under volatile anesthesia (EZ-7000, WPi, Sarasota, USA) consisting in a mixture of 2% isoflurane (IsoFlo; Axience, Pantin, France) and air during MRI monitoring and treatment. The rats' temperature was maintained at 37°C thanks to the heating bed. The blood oxygenation was monitored all along the longitudinal follow-up and did not go down 87%. One hour prior the irradiation, the nanoparticles preparation was injected by intravenous administration in the caudal vein. Then the treatment was performed at 50 mW in fiber output (UltraSil ULS 272; OFS, Norcross, USA), 26 J and 652±1 nm with a laser diode (Biolitec, Jena, Germany). Sham rats received an injection of nanoparticles without photosensitizer one hour prior to iPDT.
MRI-guided iPDT and light delivery: Light delivery fiber was inserted through the skull anchor into the tumor tissue. The fiber tip (272 nm diameter, ULS 272, OFS, Norcross, U.S.A.) delivered the light (652 nm, 50 mw, 8 min 40 s, 26 J). A T1 weighted imaging in the coronal plane (TURBO-RARE, TR/TE: 400/9ms, NEX: 2, FOV: 4x4 cm, matrix: 256x256, SI: 1 mm) as a reference image before the injection of the nanoparticles, and a second T1 weighted MRI in the coronal plane to confirm their presence and to measure the coordinates for the fiber placement were performed. Then a density proton weighted image (TR/TE: 5000/33ms, NEX: 2, FOV: 4x4 cm, matrix: 256x256, SI: 1 mm) was performed before iPDT in order to control the positioning of the optical fiber inside the brain.
MRI acquisition protocol: The MR experiments were performed on a small animal 7 Teslas magnet (Bruker, Biospec 70/20 USR, Ettlingen Germany). A transmit body coil and a receive head coil were used for all acquisition except for the proton density weighted acquisition where just a transmit/receive body coil was used. The software Paravision 5.1 (Bruker, Ettlingen, Germany) was used to analyze the data. The MRI acquisition protocol was repeated at the eight times of the follow-up: the pre-treatment and post-treatment days (t=0), 1, 2, 3, 4 and 7 days post-treatment. The MRI acquisition protocol was composed by six images sequences and lasts 1h40: T2 weighted imaging (TURBO-Rapid Acquisition with Relaxation Enhancement TR/TE: 5000/77ms, NEX: 2, FOV: 4x4 cm, matrix: 256x256, SI: 1 mm) in axial and coronal planes to visualize the tumor in hyperintense. Diffusion-Weighted Imaging (DWI) on the slice of interest (Spin Echo-Echo Planar Imaging, TR/TE: 3000/30ms, six b values (100, 200, 400, 600, 800 and 1000 s/mm²), FOV: 4x4 cm, matrix: 128x128, SI: 1mm) defined from the fiber positioning. Taking into account the exponential diffusion signal decay, six b values were selected for a better fitting of the exponential curve. This has all been possible as we were not constrained by the movements of the anaesthetized animals and the duration of the acquisition. An Apparent Diffusion Coefficient map was calculated from the SE-EPI acquisition. This sequence was used to observe the water diffusion of the tissue.
Multi Gradient Echo-T2* acquisition (TR: 1500ms, 12 TE: range from 4 to 60ms, FOV: 4x4 cm, matrix: 256x256, SI: 1 mm) was performed on the same slice of interest. A T2* relaxation map was calculated from the T2* acquisition. The Bruker t2vtr-fitting function (Paravision 5, Bruker) based on the equation below was applied to calculate T2* relaxation time as a function of signal intensity and TE values of each image:
y= A+Cexp(-t/T2*)
With: A= absolute bias, C= signal intensity, T2*= spin-spin relaxation time All calculated T2* times were given in ms. 1H-MR spectroscopy PRESS-1H (Point RESolved Spectroscopy) sequence (TR/TE : 2500/20ms, NEX : 512, VOI : 2.5x2x3mm) combined with a water suppression sequence VAPOR (VAriable Power Optimized Relaxation delays) are used for acquiring in single voxel spectroscopy one spectrum from a voxel placed on the tumor and another one on the contralateral side. Before MRS and T2* weighted images, a second order shim was performed.
MRI monitoring: The tumor response to the treatment was monitored by MRI from the pre-treatment to 20 days after the treatment. Each MRI session included an anatomical MRI, a diffusion MRI, a T2* MRI and a MRS. MRI session were performed just before the treatment, just after the treatment and 1, 2, 3, 7 and 10 days after the treatment. All sequences of one MRI session were carried out consecutively without moving the animal.
Images analysis: The volume of the tumors was achieved with a segmentation software ITK-SNAP 3.0.0 [28]. Mean ADC value of the tumor comes from a ROI which circled the whole tumor on the T2 weighted images and which is then, replaced on the ADC map. The ADC ratios were calculated by dividing the tumor ADC value by the contralateral ADC value. Each ratio was then normalized to the pretreatment ratio. The VOI for MRS was drawn on the T2 weighted images, and included the whole initial tumor volume (7.2 ±3.1 mm3) and also the brain adjacent to tumor. For the final stages, the whole tumor (63.1 ± 56.6 mm3) was filling the VOI so that the voxel remains focused on tumor. Each brain tissue spectrum was analyzed using jMRUI software with a basis set of prior knowledge containing 17 peaks which correspond to 9 metabolites (Lipids/lactate (CH/CH2/CH3), N-Acetyl-Aspartate (NAA), glutamine, glutamate, glutamine-glutamate (GLX), creatine (Cr), choline (Cho), taurine, myo-inositol (MIn)) [29] [30]. The metabolites expression was determined using the water signal as a reference, and therefore all amplitudes were expressed semi quantitatively. AMARES algorithm is used for the quantitation [31].
The proportion of hemorrhage and the proportion of the water compartment came from T2* map. The ROIs have always the same size and enclosed the tumor and its periphery, in order to assess the micro hemorrhages and the water content changes, induced by iPDT, in and around the tumor. An arbitrary threshold was defined to quantify the hemorrhage or the water content. The proportion of hemorrhage or water content was respectively defined as the ratio of the number of pixels under or upper the threshold divided by the total number of pixels.
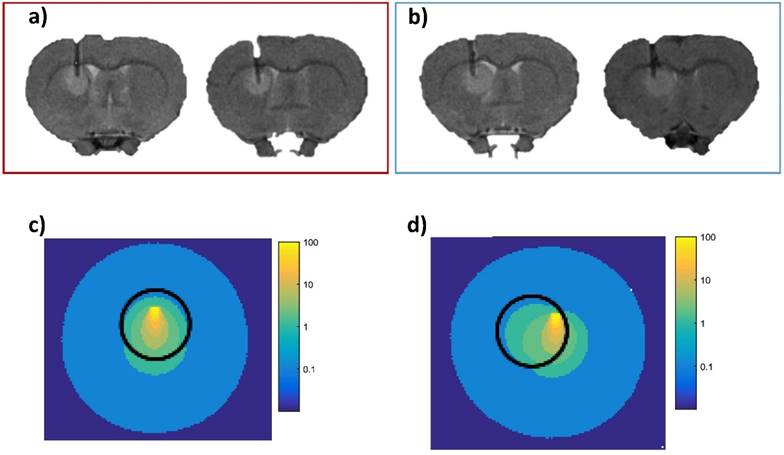
Light propagation Simulation: The simulation of photon propagation in the tumor volume and healthy tissues was made with Molecular Optical Simulation Environment (MOSE), a simulation platform for optical molecular imaging research co-developed by Xidian University, Institute of Automation, Chinese Academy of Sciences, China and Virginia Tech-Wake Forest University School of Biomedical Engineering & Sciences, USA. The parameters of the simulation were a sphere of the corresponding diameter for the tumor, a cube of 4 mm side for the healthy brain, a flat cylindrical light source at 652 nm (Figure 7c and d). The characterization of optical coefficients in various biological tissues of different species exists in the literature. However, there are very few studies evaluating these coefficients in vivo, and let alone in presence of nanoparticles. We used a method developed by our group to estimate the in vivo optical parameters. The in vivo values of the optical coefficients (absorption and scattering µa and µs, respectively) of subcutaneous U87MG tumors grafted in nude mice with and without AGuIX® nanoparticles were estimated by solving the inverse problem using fast Monte Carlo simulation and experimental spatially resolved diffuse reflectance spectra [32].
Simulation of the photons propagation. Two illustrative implantations of the fiber positioning into the tumor tissue of responder rats (red block); proton density weighted MRI (TR/TE: 5000/33 ms, NEX: 2, FOV: 4x4 cm, matrix: 256x256, SI: 1 mm) (a), and two other representative optical fiber implantation into the tumor of non-responder group (blue block) (b); proton density weighted MRI (TR/TE: 5000/33 ms, NEX: 2, FOV: 4x4 cm, matrix: 256x256, SI: 1 mm). Monte Carlo simulation of the light scattering through the tumor tissue (sphere of 2 mm diameter (black circle), µa = 0.094 mm-1 µs = 6.32 mm-1) and healthy tissue around (µa = 0.057 mm-1 µs = 28 mm-1 from [54]) which illustrates the isodoses distribution in the responder group (c) and in the non-responder group (d). Each colored line represents an irradiated volume receiving the same light dose. The isodose curves decrease with the distance from the light source from yellow to blue, corresponding to 80, 60, 40, 20, 10, 5 and 2 % of the initial light dose.
Immunohistochemistry: The brains were kept in formol® (CARLO ERBA Reagents S.A.S, Val de Reuil, France) during 10 days. The tissue samples were dehydrated in successive ethanol baths from 70° to 100° to finish in toluene. They were conserved as 5 µm thick slice in paraffine. Immunohistophatology was performed on deparaffined slices. The unmasking step was performed at 110°C/5min in citrate buffer. To detect tumor cellular proliferation, sections were incubated for one night at room temperature with the primary antibody (rabbit monoclonal antibody anti-Ki67, 1:200 dilution buffer; SP6, RM-9106-S0, S1, NeoMarkers, Labvision). After washing, the slides were incubated for 1 hour with the secondary goat polyclonal antibody anti-rat biotinylated IgG (1:400 dilution in PBS-Tween E0432, Dakocytomation, Denmark). The revelation of secondary biotinylated antibodies was performed with a streptavidin-horseradish peroxidase complex (1 h at room temperature, diluted 1:400 in PBS-Tween, Dakocytomation, Denmark) and the peroxidase substrate (5 min, Vector® NovoRedTM Substrate Kit for peroxidase, HistoGreen, Vector Laboratories, Paris). A hematoxylin counterstaining was performed to visualize the section by optical microscopy (Eclipse E600, Nikon France S.A, Champigny sur Marne, France). ImageJ was used to perform counting. KI67 index is the number of nuclei stained on the number of nuclei unstained, counting on 3 different images, x40 magnification.
In vivo PDT response variables: Following PDT, tumor volume was measured by segmentation on T2 weighted images. For the statistical analysis, we used an innovative approach developed by Bastogne et al. and based on the mixed-effect modeling of the tumor responses [33]. Its main advantage is to account for all the tumor kinetics and not only a specific end-point, which allows to significantly enhancing the statistical power of the tests. This method firstly required to define a parametric model of the kinetic response and secondly to determine the values of the model parameters with a maximum likelihood estimator. For the modeling step, originality was also to consider the equivalent diameter instead of the tumor volume. The diameter response generally showed a linear trend and therefore a simpler model [34] [35]. As previously described, an exponential-linear model structure was used:
x(t)=1-k1T(1-e-t/T)+k2(t-τ)
where x is the tumor diameter (D), t is the time variable, k1, T, k2, τ are the model parameters to be estimated from the experimental data [33]. This model was implemented in the computational environment Matlab© with the toolbox Monolix©. Three groups of animals were deduced from this model, a non-treated group (control), a partially treated group (non-responder) and completely treated group (responder). The growth rate k2 decreased of about 30% versus 57% for the non-responder and responder animals, respectively.
Statistical Analyses
Data were presented as mean ± standard deviation (SD). The GraphPad (Prism5.01, San Diego, USA) software was used to perform statistical tests. A non-parametric test Kruskal-Wallis with an additional Dunn's test were suggested to compare the three groups with p<0.05. A log rank test was used for the Kaplan-Meier curves. A non-parametric statistical test, the Mann-Whitney U was also used with p<0.05 or p<0.10.
Results and Discussion
Nanoparticles characterizations
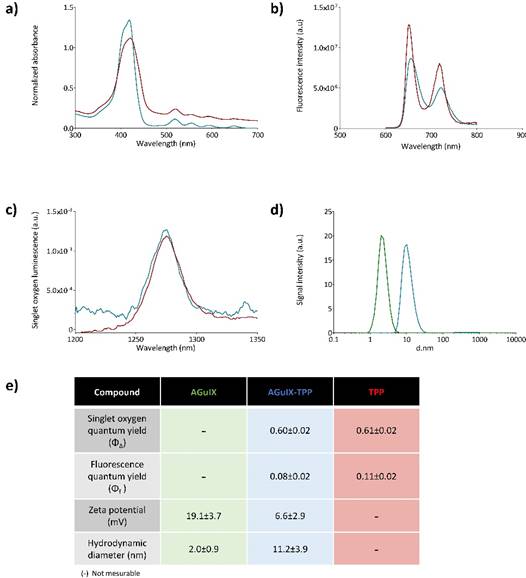
Figure 1 summarizes the chemical and photophysical characterizations of a 5-(4-carboxyphenyl)-10,15,20-(triphenyl)porphyrin (TPP) grafted onto AGuIX® nanoparticles (AGuIX-TPP) compared to AGuIX® alone and TPP molecule. AguIX® are sub-5 nm nanoparticles made of a polysiloxane matrix surrounded by gadolinium chelates covalently grafted to the inorganic matrix. The grafting of the TPP was obtained by the formation of a peptide bound between free amino function in the nanoparticle and the NHS ester on the TPP. Fluorescence (Figure 1a), absorption (Figure 1b) and 1O2 luminescence spectra (Figure 1c) were assessed in toluene for free TPP and in D2O for AGuIX-TPP. No significant changes in the quantum yields of fluorescence and 1O2 were observed between free TPP or grafted onto AGuIX® (Figure 1e). We demonstrated that the grafting of the TPP molecule on the AGuIX® did not modify its chemical and photophysical properties. Size distribution and zeta potential are given Figure 1d. The hydrodynamic diameters were 2.0±0.9 nm and 11.2±3.9 nm for AGuIX® and AGuIX-TPP, respectively (Figure 1d). The presence of TPP induces a decrease in the surface charge, as measured by zeta potential at pH 7.4. As previously demonstrated, the derivatization of the nanoparticles by tetra azacyclo dodecane tetra acetic acid (DOTA, an active chelator substance) rendered them water soluble in a wide pH range, including pH of biological fluid [26].
Photophysical properties of the free photosensitizer (TPP in red, in toluene), and after its coupling to the AGuIX nanoparticles (AGuIX-TPP in blue, in D2O). Absorption spectra (a), fluorescence emission spectra for the same absorbance (λexc = 419 nm) (b) and singlet oxygen emission spectra for the same absorbance after excitation at 419 nm (c). Size distribution determined by photon correlation spectroscopy of AGuIX® nanoparticles with (in blue) or without TPP (in green) (d). A table summarizing photophysical and chemical characteristics (e).
Tumor volume and apparent diffusion coefficient (ADC) post-iPDT
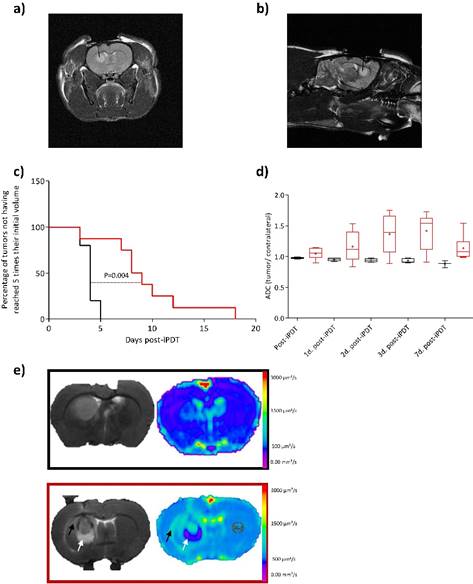
Using the same procedure than Bechet et al., the tumor volume visualized by T1-weighted imaging after injection of AGuIX-TPP, was illuminated via an optical fiber placed stereotactically into the brain of each rat. To perform iPDT, the optical fiber position was confirmed by a coronal and sagittal proton density-weighted MRI acquisition (Figure 2a and b) [26] [36] [37]. The sham rats were represented as control group (i.e. rats exposed to light 1 hour post-i.v. injection with AGuIX nanoparticles without photosensitizer). Using AGuIX-TPP nanoparticles, iPDT induced a statistically significant efficiency compared to the control group (Figure 2c). GBM tumor cellularity was evaluated by T2-weighted MR images and DWI which provides information on water molecular diffusion. Theoretically, a high cellularity may impede free water diffusion resulting in a reduction of the ADC values [38]. We examined the usefulness of DWI post-iPDT through the evaluation of response patterns based on ADC changes. Unexpectedly, the ADC values based on the entire tumor volume data, did not demonstrate any statistically significant differences between the control and the treated groups (Figure 2d). Nevertheless, as soon as 1 day post-iPDT, the ADC maps illustrated clearly a difference in the cytoarchitecture of the tumor tissue compared to the control group (Figure 2e). Indeed, an inflammatory effect with vasogenic and cytotoxic edema was evidenced 1 day post-treatment for the treated group. The hyperintense area of the T2 weighted images matches with the hyposignal area of the ADC map which means a low water mobility, making a finding of cytotoxic edema. No induction of the inflammatory effect was evidenced for the control group meaning that the insertion of the optical fiber through the cortex into the tumor led to no disruptive effect and that AGuIX® nanoparticles without photosensitizer were inert material.
Proton-weighted images (TR/TE: 5000/33ms, NEX: 2, FOV: 4x4 cm, matrix: 256x256, SI: 1 mm) showing the fiber insertion in coronal (a) and sagittal (b) planes. Kaplan-Meier survival curves for control rat (black line) versus treated rats (red line) by iPDT (radiant power = 50 mW; radiant energy = 26 J) with AGuIX®-TPP nanoparticles with the endpoint when the tumor volume reached 5 times their initial volume. Statistical analysis was performed using the log-rank test p= 0.003 (c). Using DWI (TR/TE: 3000/30ms, FOV: 4x4 cm, matrix: 128x128, SI: 1mm), the post-iPDT evolution of the ADC values in the tumor ROI of the treated rats (red boxes) and control rats (black boxes) (d). T2 weighted images (TR/TE: 5000/77ms, NEX: 2, FOV: 4x4 cm, matrix: 256x256, SI: 1 mm) (left) and ADC map (right) of a representative control rat (black rectangle) and treated rat (red rectangle) 1 day post-iPDT (e). The arrows indicate a representative vasogenic (black arrow) and cytotoxic edema (white arrow) only for the treated group.
MR Imaging of cellularity, edema and micro-hemorrhages
Two commonly used characteristics of tumor growth are the tumor growth delay and the tumor volume. We previously suggested the equivalent diameter as a pertinent tumor growth statistic tool that can be used as response variable [33]. Originality was to consider this equivalent diameter (D) instead of the tumor volume. D is a new tumor diameter growth model characterizing early, late and steady-state treatment effects [7]. Indeed, tumor volume and tumor growth delay responses only give quantitative information about the tumor growth at an event point but provide no information about the global behavior of the tumor before or after this event. Using this dynamic model from the experimental data (for details see Experimental section and [33]), we can clearly identify two different profiles of iPDT response concerning the treated group (Figure 3a), also underlined using Kaplan-Meier survival curves (Figure 3b). Taking into account this discrepancy, we decided to integrate this consideration by comparing the data from MRI analysis between these two sub groups, the responder group (Figure 3, red) and the non-responder group (Figure 3, blue).
Relative growth kinetics with the theoretical diameter D. Identification of two sub groups in the treated group (for details see Experimental Section In vivo PDT response variables) (a). Kaplan-Meier survival curves of U87MG tumors for control (black line), responder (red line), and non-responder (blue line) groups, considering the percentage of tumors not having reached 5 times their initial volume at the end point. Significant difference between responder and control groups is found with a log rank test: p=0.002 (b). ADC values relative to the pre-treatment from the tumor ROI of responder group (red boxes) increase significantly compared to control group (black boxes) and non-responder group (blue boxes) (c). The relative rate of hemorrhage normalized to the pre-treatment values comes from T2* map values for the control (black), responder (red) and non-responder (blue) groups (d). The relative rate of edema normalized to the pre-treatment values for the same different groups (e).
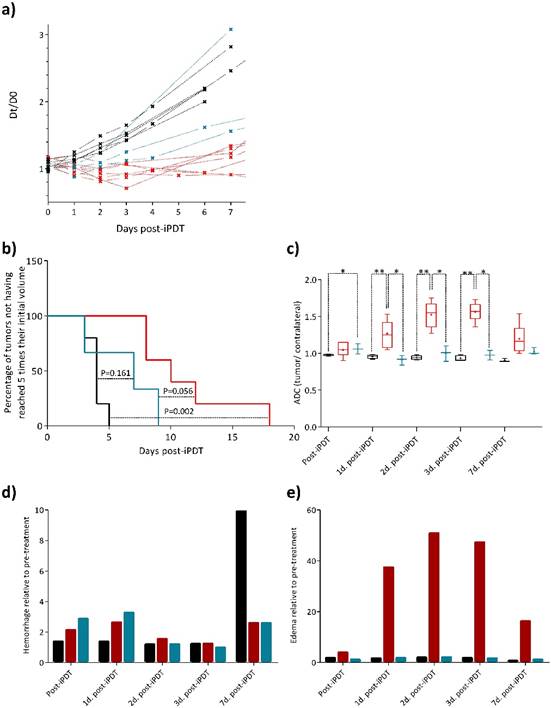
The ADC values of the tumor region of interest (ROI) demonstrated from one to three days post-iPDT firstly, statistically significant differences between the control and responder groups and secondly, statistically significant differences between both treated groups (i.e. responder vs. non-responder) (Figure 3c). These major results revealed a significantly higher frequency of high ADC values in the responder group, corresponding to a decreased cellularity into the tumor tissue due to the photodynamic effect. This efficiency was not observed in the non-responder group. Interestingly, seven days post-iPDT those discrepancies disappeared, meaning that this treatment effect did not remain a discriminant event. Many studies described variations of ADC values related to changes induced by treatments such as radiotherapy [39]. Just after treatment, some studies reported a transient decrease of ADC values due to a vascular collapsus and a cell swelling, arising from the reduction of extracellular space [40]. An extracellular edema and a cellular necrosis are events which coincide with an increase of the ADC values [41] [42] [43]. It is also perfectly well described that PDT induces membrane associated damages that occurs via protein cross linking and lipid peroxidation. This leads to alterations in membrane permeability with subsequent cellular swelling and lysis, a vascular shutdown and acute inflammatory/immune responses [44]. The early changes in ADC values of the responder group are in accordance with a necrosis process and a release of cell content in the extracellular space, leading to an inflammatory reaction and an increase in vessels permeability.
The major utility of T2* susceptibility sequence in brain tumor imaging is to provide information on radiation induced chronic micro-hemorrhages. Indeed, these sequences are very sensitive to blood products and may be very helpful to depict post-iPDT micro-hemorrhages. As described by [19] [20], susceptibility weighted imaging (SWI) could lead to an improved sensitivity to venous blood and hemorrhage compared to T2* sequence however only T2* weighted magnitude images can succeed to have quantitative T2* values, useful to discriminate states of tissues. For the non-responder group, micro-hemorrhages were observed immediately and 1-day post treatment and for the control group, a marked micro hemorrhagic process about 5-fold higher, appeared in later stage post treatment (Figure 3d). GBM is among the most vascularized of all solid tumors, and relies upon angiogenesis for growth and histological progression. A number of proangiogenic factors promote angiogenesis in GBM such as vascular endothelial growth factor (VEGF), basic fibroblast growth factor (bFGF), platelet-derived growth factor (PDGF) and angiopoietin-2 (Ang-2). For instance, overexpression of VEGF can degrade the capillary basement membranes of tumor vessels, causing them to become more permeable and leak plasma fluid and proteins from the intravascular compartment into the brain parenchyma. The extension of the micro-hemorrhages was differently localized between the responder and non-responder groups (Figure 4a and b). Non-responder rats described a major hemorrhage on the top of the tumor tissue area, corresponding to the brain adjacent to tumor (BAT) and a minor one inside compared to responder rats which demonstrated a predominant micro-hemorrhage into the tumor rim.
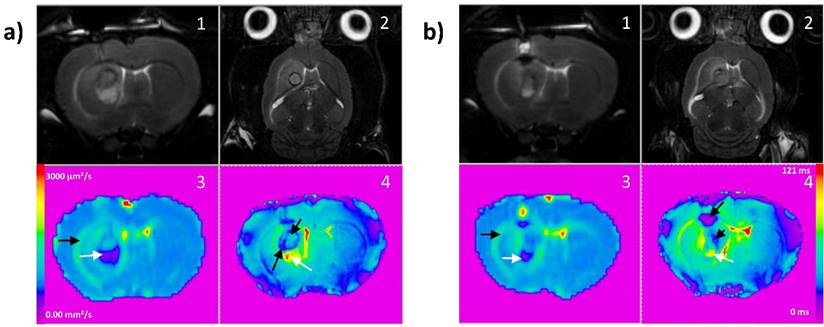
Board of T2 weighted images in coronal (1) and axial (2) planes (TR/TE: 5000/77ms, NEX: 2, FOV: 4x4 cm, matrix: 256x256, SI: 1 mm), ADC and T2* maps for a representative responder rat (a) and a non-responder rat (b). On ADC map (3), black arrows indicate vasogenic edema and white arrows cytotoxic edema. On T2* map (4), black arrows indicate micro-hemorrhage and white arrows cytotoxic edema.
It is now well established that complex interactions between cancer and stromal cells within the tumor microenvironment play major roles in cancer progression at both the primary and metastatic sites [45]. In GBM, the serine protease urokinase plasminogen activator (uPA), and matrix metalloproteases such as MMP-2/MMP-9 contribute to its invasive growth pattern. Indeed, the invasive growth of GBM relies strongly on the restructuring of the extracellular matrix (ECM). ECM restructuring typically involves three steps, adhesion, degradation and migration, and it is induced by the serine protease uPA and is carried out by plasmin and various MMPs. In the case of GBM, a prominent infiltration zone was created between the solid tumor and normal brain adjacent tissue, containing multiple tumor cell aggregates which could be potentially responsible for recurrent tumor growth. Thus, micro-hemorrhage into the BAT is thought to cause an initial early reversible opening of the brain blood barrier due to activation of MMPs, which is distinct from a delayed secondary opening caused by inflammatory response days later [46]. Figure 3e highlights the water content of the tumor tissue and the BAT. With no doubt, according to the DWI images a major inflammatory effect and vasogenic edema characterized the responder group.
Metabolic approach by MRS
With the recent advancement of MRS, biologically relevant intracellular metabolites can be detected. This non-invasive imaging with 1H-MRS, led us to perform analysis of the metabolism of tumor tissue and contralateral hemisphere post-iPDT. This approach allows measurements of metabolites for specific atomic nuclei and their components, including choline-containing components (Cho), creatine (Cr), N-acetyl aspartate (NAA), lipid such as CH/CH2/CH3 levels, myo-inositol (MIn), glutamate plus glutamine (GLX), and taurine. For instance, Opstad et al. demonstrated that the measurement of taurine in gliomas in vivo by non-invasive MRS could be a useful technique for monitoring tumor apoptosis in clinical practice [47]. NAA is a predictor for neuronal integrity since decreased levels are usually observed after brain injury. The second most commonly observed MRS finding after brain tumors is the increased of Cho levels via cell membrane disruption and altered phospholipid metabolism, which are biomarkers for cell membrane turnover [46]. The Cho level may be suggested to predict the malignancy of gliomas. The Cho level has also been found to correlate with the cellular density of tumors and the Cr peak appears to be an indicator of cell energy metabolism and can be used to distinguish pure tumors from pure necrosis. It was described that Cho, lipid and lactate levels normalized to Cr are strong predictors of survival [48].
The stability of metabolites rate in the contralateral side during the longitudinal follow of each rat was also checked to assume that iPDT had no effect on the healthy hemisphere. MRS spectra for each rat were acquired from the tumor and contralateral side. The analysis of the MRS spectra provided precious information on the metabolic state (Figure 5). The metabolite rates were normalized to the water amplitude of the contralateral side, usually used for its low variability [49]. The maximum variation of water amplitude reaches a mean value of 9% between 1 and 2 days post-iPDT (Figure 5a). Seven metabolites of the cerebral metabolism devoted all our attention lipid (CH/CH2/CH3), NAA, GLX, Cr, Cho, Tau and MIn (Figure 5b) and their expression was assessed at different days after iPDT for the three groups (Figs 4c-h). As expected, before treatment, all groups displayed comparable levels of each metabolite, considered as a metabolic signature of the tumor tissue (Figure 5c).
Metabolic profiles of the three groups. 1H-MR spectroscopy PRESS-1H sequence for the spectra acquisition were used (TR/TE: 2500/20ms, NEX : 512, VOI : 2.5x2x3mm). The variability of the water amplitude in the contralateral voxel compared day per day. The values vary up to 9% (a). The spectra of the tumor voxel (red spectrum) and the contralateral voxel (black spectrum) with the following peaks: CH/CH2/CH3 0.89, 1.31, 5.33; NAA 2.01, 2.49, 2.65, 2.05; glutamine 2.45; glutamate 2.35; GLX 2.35, 2.45, 2.04, 3.76; Cr 3.03, 3.92; Cho 3.22; tau 3.41, 3.24; Min 3.52, 3.63 (b). Relative amplitude (/water amplitude) for each metabolite for the responder group (red triangle), non-responder group (blue circle) and control group (black square) just before iPDT (c), just after iPDT (d), 1 day after iPDT (e), 2 days after iPDT (f), 3 days after iPDT (g) and 7 days after iPDT (h). Data are presented as mean ± standard deviation (SD), responder group n=5; non-responder group n=3; control group n=5. A non-parametric Mann-Whitney statistical test was used to compared the responder and non-responder groups with p<0.010¤ and responder to control groups with p<0.005*.
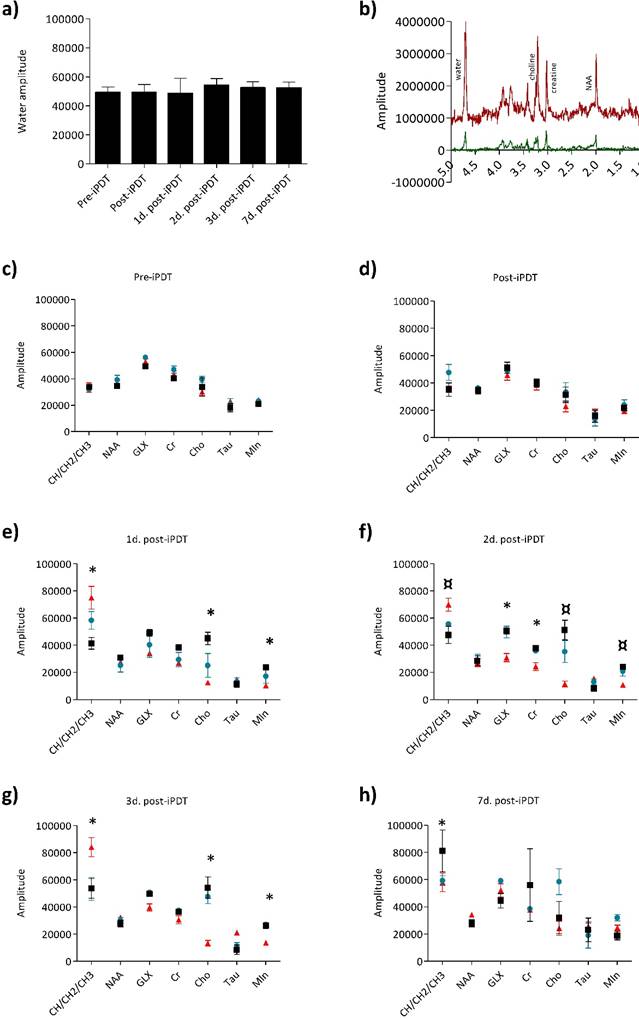
No significant difference appeared just after iPDT but very interestingly as soon as 1 day post-iPDT, the responder group distinguished itself from control and non-responder groups by the lipid amplitude which was, 2 days post-iPDT, statistically significantly higher whereas Cho and MIn amplitudes were reduced (Figure 5e). These discrepancies were accentuated 3 days post-treatment (Figure 5f and g).
For the responder group, the lipid level evolution was reversed from 3 days post-iPDT (Figure 5h). The observation of elevated lipid levels is believed to be associated with a membrane breakdown; it depicts necrosis process related to an insufficient blood flow leading to ischemia. It could also be the result of anaerobic glycolysis. According to these results, the lipid analysis may be very useful in an early differentiation of the tumor recurrence post-iPDT. Moreover, the hypothesis of a necrosis death pathway was also confirmed by the ADC map, illustrating a major increase in the tumor water mobility in the responder group (Figure 3c). After radiotherapy, a lipid signal is also observed and could originate from the change of metabolism of irradiated cells [50]. Kimura et al. show that the ratio Cho/lipid was also used in the attempt to diagnose radiation necrosis, describing in that case, a high lipid-dominant peak [51].
We also evidenced that from the first day post-iPDT the relative amplitudes of Cho and Min metabolites were statistically significantly different for the non-responder group. Choline is involved in the membrane metabolism and its decrease in the responder group indicated a rapid cellular membrane turnover. The third metabolite which emerged was MIn, found in great abundance within glial cells as indicator of the microglial activation and proliferation [52]. MIn is one of nine distinct isomers of inositol. It is found in phospholipids which function as cellular mediators of signal transduction, in metabolic regulation, and growth. Its decrease in the responder group argues the proliferation shutdown.
MRS modality highlights very precious qualitative data on the tumor response mechanisms. Three main metabolites, Lipids, Cho and MIn, could be suggested as early indicator of treatment response.
Vascular effects and proliferation rate
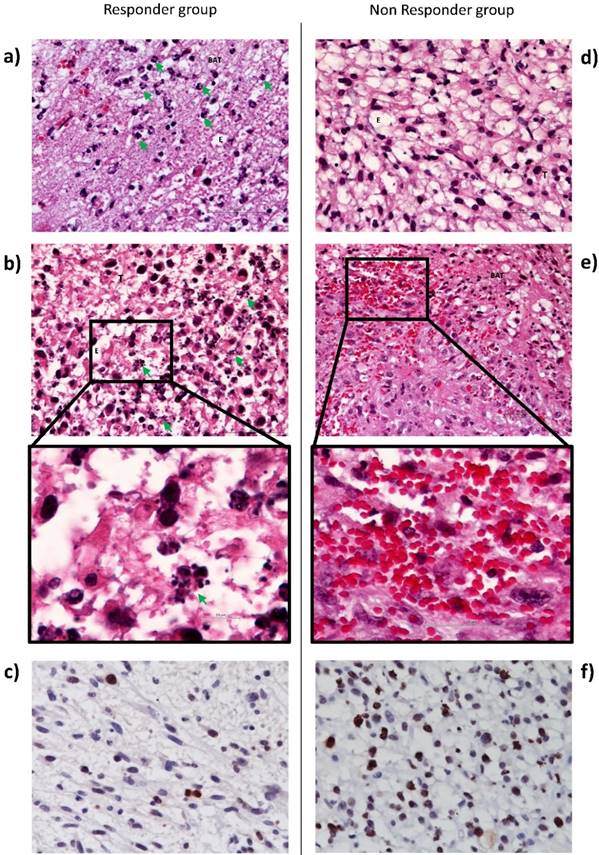
In order to argue the MRI observations, we also performed immunohistochemistry analysis. Histological examination of tissue sections taken from brain tissue 1 day after iPDT indicated an edema into both tumor and BAT areas (Figure 6). However, only responder rats exhibited a major inflammatory process with neutrophils infiltration (figure 6a and d). Li et al. also reported that immune response plays a key role in iPDT anti-tumor activity, inducing an increase in immune cells infiltration [53]. Figure 6b demonstrated the cell death induction by many apoptotic bodies into the tumor area. In accordance with the decrease of Cho and MIn levels, an intense decrease of Ki67 index was observed into the tumor tissue after iPDT for the responder group around 2 times less compared to the non-responder group (Figure 6c and f). For the non-responder group, iPDT induced major micro-hemorrhages into the BAT (Figure 6e). This observation is also in accordance with T2* map images.
Histological images of U87MG tumor and BAT, 1 day post-iPDT for the responder (left) and non-responder groups (right). Representative edema images of hematoxylin-eosin staining indicate in responder group a major neutrophils infiltration (green arrow) (a) and apoptotic bodies (green arrow) (b) versus a lack of neutrophil infiltration (d) and a bleeding process (x40) (e). Representative images of Ki67 staining counterstained with hematoxylin-eosin in responder group (c) and in non-responder group (f). Abbreviations: T: Tumor; BAT: Brain Adjacent to Tumor; E: Edema
Monte Carlo simulation of light scattering
To understand the differential tumor response within the treated group (i.e. responder and non-responder), we explored the notion of light dosimetry. To take into account the light dose deposition, we performed Monte Carlo simulation under MOSE software. The settings were estimated from our experimental in vivo conditions. They concerned the optical properties of the tumor and healthy tissues with AGuIX® nanoparticles, the fiber placement as well as the radiant power, the radiant energy and the light wavelength. Based on the scattering of the emitted photons and due to the optical fiber positioning, we determined that only the tumor tissue of the responder group received a sufficient photodynamic dose to the tumor bulk (Figure 7). The isodose curves were deduced by simulation from the light source, corresponding to 80, 60, 40, 20, 10, 5 and 2 % of the initial light dose and to complete these investigations, we also evaluated the percentage of photons into the tumor tissue. We obtained an average of about 71% versus 67% Figures 7c and 7d, respectively. This slight difference argues that the positioning of the optical fiber to the ring of the tumor volume could also be a strong contributing factor. Indeed, molecular oxygen concentration is heterogeneous within the tumor, due to differences in vascularization and oxygen supply and we previously demonstrated that the margins of the orthotopic human U87 GBM model xenografted in nude rat were more vascularized than its center [26].
The light distribution through the whole tumor volume in deep-seated tumor remains a limiting factor to reach an optimal PDT effect. To complicate matters, its planning depends mainly on photosensitizer concentration, light diffusion and oxygen consumption which can vary during treatment (e.g. photobleaching of the photosensitizer, variations of tissue optical properties and of molecular oxygen concentrations due to photochemical consumption during treatment and/or vascular damage). As opposed to chemotherapy, where the main factor is the drug dose, to be determined by a classical dose escalation methodology, PDT not only is linked to a molecule but is a complex technique wherein several factors (photosensitizer, light dose, and oxygen) interact with each other. A modification of the optical fiber positioning from the center to the ring led to a different photodynamic dose. These difficulties make the determination of the PDT modalities a nonlinear and multivariate optimization problem, and a successful dosimetry strategy has to take into consideration these particular aspects.
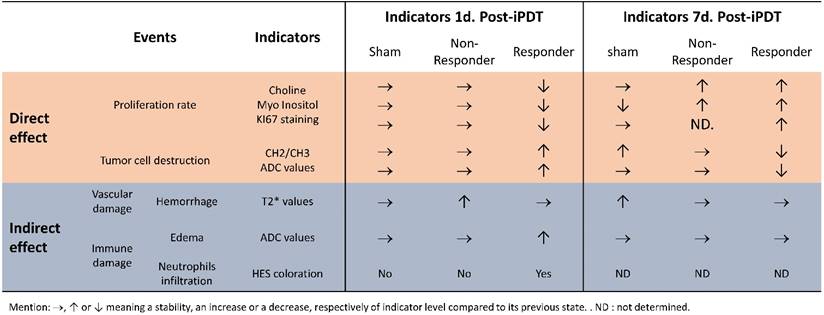
Review of results
As previously published by our group, we would like to point out that tumor response post-PDT once again demonstrates the crucial role of light dose deposition [7]. The multimodal MRI approach and MRS allow us to have a better understanding of the early effects induced by AGuIX® nanoparticles after iPDT. We selected the different aspects of the treatment response by their direct or indirect effects. Classically PDT leads to tumor eradication through the direct effect (destruction of tumor cell), and the indirect effect (collapse of tumor vascularization and activation of the immune and inflammatory response). We summarized the longitudinal tumor response in Table 1, characterized by a major inflammatory process with a cytotoxic and vasogenic edema, an ischemia and antiproliferative activity. The ischemia was validated by the rise in the CH/CH2/CH3 level. The antiproliferative effect was also confirmed by the higher level in lipids, the decrease in Cho and Min expression, and KI67 staining. A necrosis deduced from the high CH/CH2/CH3 level and ADC map was also observed, showing an increase of the water mobility in the tumor center.
An overview of the main results of direct and indirect effects 1 and 7 days post-iPDT in control, responder and non-responder groups.
In this original preclinical paper using an orthotopic human GBM model xenografted in nude rats, early predictive values were highlighted using MRI sequences at different times after iPDT. Moreover, with 1H-MRS, we applied the quantitative spectral analysis to measure and compare metabolites expression before and after iPDT for the tumor tissue and in the healthy contralateral hemisphere. For the first time, we demonstrated the ability of a longitudinal follow-up to characterize the tumor response by structural, vascular and metabolic ways in a time-dependent manner and unexpectedly, we clearly highlighted the ability to discriminate non-responding from responding animals. MR imaging techniques can potentially help evaluate the underlying key histopathological features of GBM by showing the physiologic changes and metabolic activities, thus improving radiation treatment efficiency. We currently suggest an optimal and rational fractionation scheme for iPDT using these MRI sequences. These functional tools provide a new window to guide and monitor the treatment of gliomas. Application of these imaging techniques could lead to sophisticated and personalized patient care.
Abbreviations
ADC: Apparent Diffusion Coefficient; AGuIX: Ultra-small gadolinium based particle; Ang-2: Angiopoietin-2; a.u.: arbitrary unit; BAT: Brain Adjacent Tumor; bFGF: basal Fibroblast Growth Factor; CH/CH2/CH3: Lipid(L)/ Lactate; Cho: Choline; Cr: Creatine; D2O: Deuterium oxide; DGR: Diameter Growth Rate; DLS: Dynamic Light Scattering; DOTA: tetraazacyclo-DOdecane Tetra-acetic Acid; DWI: Diffusion Weighted Imaging; E: Edema; ECM: ExtraCellular Matrix; FGR: Fluorescence-Guided Resection; FLAIR: FLuid Attenuated Inversion Recovery; FLASH: Fast Low-Angle Shot; FOV: Field of View; GBM: Glioblastoma Multiforme; GLX: Glutamine+Glutamate; HBSS: Hank's Buffered Salt Solution; iPDT: interstitial PhotoDynamic Therapy; MIn: Myo Inositol; MRI: Magnetic Resonance Imaging; MMP-2/9: Matrix Metalloproteinase 2/9; 1H-MRS: Magnetic Resonance Spectroscopy; NAA: N-acetyl-aspartate; NEX: acquisition number; PDD: PhotoDynamic Diagnosis; PDGF: Platelet Derived Growth Factor; PDT: PhotoDynamic Therapy; PET: Positron Emission Tomography; PRESS: Point-Resolved Spectroscopy Sequence; RARE: Rapid Acquisition with relaxation enhancement; ROI: Region Of Interest; ROS: Reactive Oxygen Species; SE-EPI: Spin Echo - Echo Planar Imaging; Tau: Taurine; TE: Echo Time; TR: Repetition time; TGD: Tumor Growth Delay; TPP-COOH: 5-(4-carboxyphenyl)-10,15,20-triphenylporphyrine; VAPOR: VAriable Power Optimized Relaxation delays; Φf: fluorescence quantum yield; FD: 1O2 quantum yield; T2*: T2 star; uPA: urokinase Plasminogen Activator; VEGF: Vascular Endothelial Growth Factor; VOI : Voxel Of Interest.
Supplementary Material
Supplementary figure 1.
Acknowledgements
The authors would like to thank Jordane Jasniewski, Philippe Arnoux, and Jean-Baptiste Tylcz for their technical assistances. This work was supported by the research funds of the French Ligue Nationale Contre le Cancer, l'Association pour la Recherche sur les Tumeurs Cérébrales (ARTC), Lions Club Nancy Commanderie, EURONANOMED II “PhotoBrain” project no. ANR-14-ENM2-0001-01.
Competing Interests
The authors have declared that no competing interest exists.
References
1. Carlsson s, Brothers S, Wahlestedt C. Emerging treatment strategies for glioblastoma multiforme. EMBO Mol Med. 2014;6:1359-70
2. Ducray F, Dutertre G, Ricard D. et al. Advances in adults' gliomas biology, imaging and treatment. Bull Cancer. 2010;97:17-36
3. Bechet D, Mordon S, Guillemin F Et al. Photodynamic therapy of malignant brain tumours: a complementary approach to conventional therapies. Cancer Treat Rev. 2014;40:229-41
4. Bechet D, Tirand L, Faivre B. et al. Neuropilin-1 Targeting Photosensitization-Induced Early Stages of Thrombosis via Tissue Factor Release. Pharm. Res. 2010;27:468-79
5. Tirand L, Frochot C, Vanderesse R. et al. A peptide competing with VEGF165 binding on neuropilin-1 mediates targeting of a chlorin-type photosensitizer and potentiates its photodynamic activity in human endothelial cells. J of Controlled Release. 2006;111:153-64
6. Mroz P, Yaroslavsky A, Kharkwal GB. et al. Cell Death Pathways in Photodynamic Therapy of Cancer. Cancers. 2011;3:2516-39
7. Tirand L, Bastogne T, Bechet D Et al. Response surface methodology: an extensive potential to optimize in vivo photodynamic therapy conditions. Int J Radiat Oncol Biol Phys. 2009;75:244-52
8. Stummer W, Beck T, Beyer W. et al. Long-sustaining response in a patient with non-resectable, distant recurrence of glioblastoma multiforme treated by interstitial photodynamic therapy using 5-ALA: case report. J Neurooncol. 2008;87:103-9
9. Stepp H, Beck T, Pongratz T. et al. ALA and malignant glioma: fluorescence-guided resection and photodynamic treatment. J Environ Pathol Toxicol Oncol. 2007;26:157-64
10. Stummer W, Pichlmeier U, Meinel T, Wiestler O. et al. Fluorescence-guided surgery with 5-aminolevulinic acid for resection of malignant glioma: a randomised controlled multicentre phase III trial. Lancet Oncol. 2006;7:392-401
11. Kao HW, Chiang SW, Chung HW. et al. Advanced MR Imaging of Gliomas: An Update. BioMed Research International. 2013 [Epub ahead of print]
12. Frappaz D, Chinot O, Bataillard A. et al. Summary version of the Standards, Options and Recommendations for the management of adult patients with intracranial glioma (2002). Br. J. Cancer. 2003;89:S73-S83
13. Hygino Da Cruz L, Rodriguez I, Domingues R. et al. Pseudoprogression and Pseudoresponse: Imaging Challenges in the Assessment of Posttreatment Glioma. AJNR Am J Neuroradiol. 2011;32:1978-85
14. Bobek-Billewicz B, Stasik-Pres G, Majchrzak H. et al. Differentiation between brain tumor recurrence and radiation injury using perfusion, diffusion-weighted imaging and MR spectroscopy. Folia Neuropathol. 2010;48:81-92
15. Le-Bihan D. Diffusion MRI: what water tells us about the brain. EMBO Molecular Medicine. 2014;6:569-73
16. Kalpathy-Cramer J., Gerstner E. R.; Emblem, K. E.; Andronesi, O. & Rosen, B. Advanced Magnetic Resonance Imaging of the Physical Processes in Human Glioblastoma Cancer Res. 2014;74:4622-4637
17. Schaefer P. W.; Grant, P. E. & Gonzalez, R. G. Diffusion weighted MR Imaging of the Brain Radiology. 2000;217:331-45
18. Padhani AR, Liu G, Mu-Koh D. et al. Diffusion-Weighted Magnetic Resonance Imaging as a Cancer Biomarker: Consensus and Recommendations. Neoplasia. 2009;11:102-25
19. Bian W, Hess CP, Chang SM, Nelson SJ. et al. Susceptibility-weighted MR imaging of radiation therapy-induced cerebral microbleeds in patients with glioma: a comparison between 3T and 7T. Neuroradiology. 2014;56:91-6
20. Mabray MC, Barajas RF, Cha S. Modern Brain Tumor Imaging. Brain Tumor Res Treat. 2015;3:8-23
21. Kwock L, Smith JK, Castillo M. et al. Clinical role of proton magnetic resonance spectroscopy in oncology: brain, breast, and prostate cancer. Lancet Oncol. 2006;7:859-68
22. Wang W, Hu Y, Lu P. et al. Evaluation of the Diagnostic Performance of Magnetic Resonance Spectroscopy in Brain Tumors: A Systematic Review and Meta-Analysis. Plos one. 2014:9 [Epub ahead of print]
23. Benard F, Romsa J, Hustinx R. Imaging gliomas with positron emission tomography and single-photon emission computed tomography. Semin.Nucl. Med. 2003;33:148-62
24. Oh J, Henry RG, Pirzkall A. et al. Survival Analysis in Patients With Glioblastoma Multiforme: Predictive Value of Choline-to-N-Acetylaspartate Index, Apparent Diffusion Coefficient, and Relative Cerebral Blood Volume. J. Magn. Reson. Imaging. 2004;19:546-54
25. Yu T, Feng Y, Feng X. et al. Prognostic factor from MR spectroscopy in rat with astrocytic tumour during radiation therapy. B. J. Radiol. 2015;880-10
26. Bechet D, Auger F, Couleaud P. et al. Multifunctional ultrasmall nanoplatforms for vascular-targeted interstitial photodynamic therapy of brain tumors guided by real-time MRI. Nanomedicine. 2015;11:657-70
27. Le Duc G, Roux S, Paruta-Tuarez A. et al. Advantages of gadolinium based ultrasmall nanoparticles vs molecular gadolinium chelates for radiotherapy guided by MRI for glioma treatment. Cancer Nanotechnol. 2014:5 [Epub ahead of print]
28. Yushkevich PA, Piven J, Hazlett HC. et al. User-guided 3D active contour segmentation of anatomical structures: Significantly improved efficiency and reliability. NeuroImage. 2006;31:1116-28
29. Naressi A, Couturier C, Castang I. et al. Java-based graphical user interface for MRUI, a software package for quantitation of in vivo/medical magnetic resonance spectroscopy signals. Comput Biol Med. 2001;31:269-86
30. Stefan D, Di Cesare F, Andrasescu A. et al. Quantitation of magnetic resonance spectroscopy signals: the jMRUI software package. Meas. Sci. Technol. 2009;20:104035
31. Vanhamme L, Van Den Boogaart A, Van Huffel S. Improved method for accurate and efficient quantification of MRS data with use of prior knowledge. J. Magn. Reson. 1997;129:35-43
32. Pery E, Blondel W, Thomas C. Monte Carlo modeling of multilayer phantoms with multiple luorophores: simulation algorithm and experimental validation. J. Biomed. Opt. 2002;14:024048
33. Bastogne T, Samson AA, Vallois P. et al. Phenomenological modeling of tumor diameter growth based on a mixed effects model. J. Theor. Biol. 2010;262:544-52
34. Mandonnet E, Pallud J, Clatz O. et al. Computational modeling of the WHO grade II glioma dynamics: principles and applications to management paradigm. Neurosurg. Rev. 2008;31:263-9
35. Ribba B, Watkin E, Tod M. et al. A model of vascular tumour growth in mice combining longitudinal tumour size data with histological biomarkers. Eur. J. Cancer. 2011;47:479-90
36. Tylcz JB, Bastogne T, Benachour H. et al. A Model-based Method of Characterizing the Pharmacokinetics of Engineered Nanoparticles in Pilot Studies. IEEE J NB. 2015;14:368-77
37. Benachour A, Seve A, Bastogne T. et al. Multifunctional Peptide-Conjugated Hybrid Silica Nanoparticles for Pho-todynamic Therapy and MRI. Theranostics. 2012;2:889-904
38. Hein PA, Eskey CJ, Dunn JF. et al. Diffusion-Weighted Imaging in the Follow-up of Treated High-Grade Gliomas: Tumor Recurrence versus Radiation Injury. AJNR Am. J. Neuroradiol. 2004;25:201-9
39. Patterson DM, Padhani AR, Collins DJ. et al. Technology Insight: water diffusion MRI a potential new biomarker of response to cancer therapy. Nat Clin Pract Oncol. 2008;5:220-33
40. Plaks V, Koudinova N Nevo U. et al. Photodynamic Therapy of Established Prostatic Adenocarcinoma with TOOKAD: A Biphasic Apparent Diffusion Coefficient Change as Potential Early MRI Response. Neoplasia. 2004;6:224-33
41. Chenevert TL, Stegman LD, Taylor JMG. et al. Diffusion Magnetic Resonance Imaging: an Early Surrogate Marker of Therapeutic Efficacy in Brain Tumors. J. Natl. Cancer Inst. 2000;92:2029-36
42. Hall D, Moffat B, Stojanovska J. et al. Therapeutic efficacy of DTI-015 using diffusion magnetic resonance imaging as an early surrogate marker. Clin Cancer Res. 2004;10:7852-9
43. Cui Y, Zhang XP, Sun YS. et al. Apparent Diffusion Coefficient: Potential Imaging Biomarker for Prediction and Early Detection of Response to Chemotherapy in Hepatic Metastases. Radiology. 2008;248:894-900
44. Allison RR, Moghissi K. Photodynamic Therapy: PDT Mechanisms. Clin endosc. 2013;46:24-9
45. Quail D, Joyce J. Microenvironmental regulation of tumor progression and metastasis. Nat. Med. 2013;19:1423-37
46. Yang Y, Rosenberg GA. Blood-brain barrier breakdown in acute and chronic cerebrovascular disease. Stroke. 2011;42:3323-8
47. Opstad K, Bell B, Griffiths J. et al. Taurine: a potential marker of apoptosis in gliomas. Br. J. Cancer. 2009;100:789-94
48. Marcus KJ, Astrakas LG, Zurakowski d. et al. Predicting survival of children with CNS tumors using proton magnetic resonance spectroscopic imaging biomarkers. Int J Oncol. 2007;30:651-7
49. Meyerand ME, Pipas JM, Mamourian A, el al. Classification of Biopsy-Confirmed Brain Tumors Using Single-Voxel MR Spectroscopy. AJNR Am. J. Neuroradiol. 1999;20:117-23
50. Sundgren P. MR Spectroscopy in Radiation Injury. AJNR: Am. J. Neuroradiol. 2009;30:1469-76
51. Kimura T, Sako K, Gotoh t. et al. In vivo single-voxel proton Mr Spectroscopi in brain lesion with ring-like enhancement. NMR biomed. 2001;14:339-49
52. Galanaud D, Nicoli F, Fur YL. et al. Multimodal magnetic resonance imaging of the central nervous system. Biochimie. 2003;85:905-14
53. Li F, Cheng Y, Lu J. et al. Photodynamic therapy boosts anti-glioma immunity in mice: a dependence on the activities of T cells and complement C3. J Cell Biochem. 2011;112:3035-43
54. Angell-Petersen E, Spetalen S, Madsen SJ. et al. Influence of light fluence rate on the effects of photodynamic therapy in an orthotopic rat glioma model. J Neurosurg. 2006;104:109-17
Author contact
![]() Corresponding author: CRAN UMR 7039 CNRS, Département SBS, Faculté de Médecine - Bâtiment D, 1er étage, 9 avenue de la Forêt de Haye, BP 184, 54505 Vandœuvre-lès-Nancy, France. +33 (0)3 83 68 32 08 Email: muriel.barberifr.
Corresponding author: CRAN UMR 7039 CNRS, Département SBS, Faculté de Médecine - Bâtiment D, 1er étage, 9 avenue de la Forêt de Haye, BP 184, 54505 Vandœuvre-lès-Nancy, France. +33 (0)3 83 68 32 08 Email: muriel.barberifr.