Impact Factor
- Issue 13; 2026
- Issue 12; 2026
- Issue 11; 2026
- Issue 10; 2026
- Issue 9; 2026
- Volume 16; 2026
- Advance Articles
- Past Issues
- Cover Images
- Cover Suggestion
- Index & Coverage
- Special Issues
Introduction
Materials and Methods
Results
Discussion
Supplementary Material
Acknowledgements
References
International Journal of Biological Sciences
International Journal of Medical Sciences
 Global reach, higher impact

Theranostics 2017; 7(3):513-522. doi:10.7150/thno.17596 This issue Cite
Research Paper
Precise Spatially Selective Photothermolysis Using Modulated Femtosecond Lasers and Real-time Multimodal Microscopy Monitoring
Yimei Huang1, 2, Harvey Lui1, 2, Jianhua Zhao1, 2, Zhenguo Wu1, 2, Haishan Zeng1, 2 ![]()
1. Imaging Unit - Integrative Oncology Department, BC Cancer Agency Research Center, Vancouver, BC, Canada.
2. Photomedicine Institute - Department of Dermatology and Skin Science, University of British Columbia and Vancouver Coastal Health Research Institute, Vancouver, BC, Canada.
Received 2016-9-15; Accepted 2016-11-17; Published 2017-1-6
Abstract

The successful application of lasers in the treatment of skin diseases and cosmetic surgery is largely based on the principle of conventional selective photothermolysis which relies strongly on the difference in the absorption between the therapeutic target and its surroundings. However, when the differentiation in absorption is not sufficient, collateral damage would occur due to indiscriminate and nonspecific tissue heating. To deal with such cases, we introduce a novel spatially selective photothermolysis method based on multiphoton absorption in which the radiant energy of a tightly focused near-infrared femtosecond laser beam can be directed spatially by aiming the laser focal point to the target of interest. We construct a multimodal optical microscope to perform and monitor the spatially selective photothermolysis. We demonstrate that precise alteration of the targeted tissue is achieved while leaving surrounding tissue intact by choosing appropriate femtosecond laser exposure with multimodal optical microscopy monitoring in real time.
Keywords: spatially selective photothermolysis, multiphoton absorption photothermolysis, reflectance confocal microscopy, two-photon fluorescence, second harmonic generation, modulated femtosecond laser.
Introduction
Laser therapy has been one of the major treatment modalities in dermatology. Its applications include skin disease therapy and cosmetic surgery, such as treatment of port wine stains, warts, spider veins, and acnes, hair removal, tattoo removal, and photorejuvenation. Laser therapy is largely based on the principle of conventional selective photothermolysis [1-10], in that the conversion of radiant laser energy into heat is confined to targeted chromophores by using an appropriate exposure of selected wavelength, pulse duration, and fluence. For example, 577 nm wavelength is chosen to treat vascular diseases where the targeted chromophore, hemoglobin, has a strong absorption band around 577 nm, while other competitive chromophores, such as melanin, has much lower absorption. The conventional selective photothermolysis relies strongly on the difference in absorption between the therapeutic target and its surrounding tissues. In situations where there is not sufficient differential absorption between the target and the surrounding tissue collateral damage may occur due to indiscriminate and nonspecific tissue heating, which would lead to side effects for the conventional selective photothermolysis [11-13]. In fact, in the case of hair removal, the highest incidence of side effects was seen in patients with darker skin because the increased melanin concentration in their skin reduces the differential absorption between the surrounding skin and the hair follicles, where the target treatment chromospheres are also melanin [13].
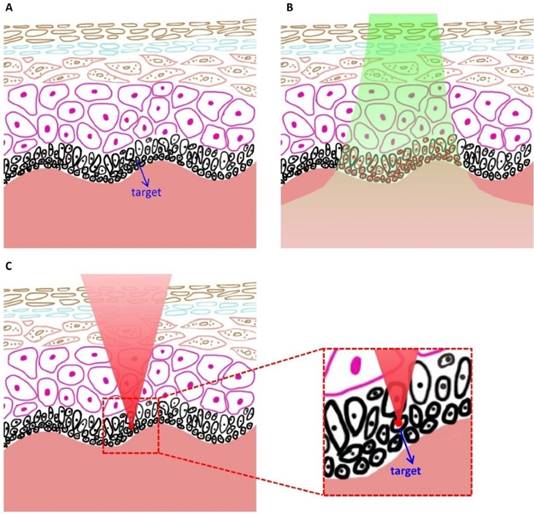
We introduce a novel spatially selective photothermolysis method based on multiphoton absorption and inspired by the preliminary results of our previous work [14]. A tightly focused near-infrared (NIR) femtosecond laser is used in spatially selective photothermolysis in order to achieve multiphoton absorption. As single photon absorption is low within this optical window wavelength range, the radiant energy can be directed spatially by aiming the laser focal point to the target of interest whereupon intensive multiphoton absorption will occur because its equivalent absorption wavelength falls in the UV range where tissue/cellular components such as proteins and nucleic acids have strong absorption, while outside of the focal point no multiphoton absorption will be generated since the light intensity is low. This approach to precise tissue alteration has two advantages over conventional selective photothermolysis, as shown schematically in Fig.1. First, spatially selective photothermolysis can be used on tissues where the optical absorption of the target is not intrinsically different from its surrounding structures, especially with targets exhibiting low absorption coefficients in the visible and NIR range. The other advantage is that the spatially selective photothermolysis confers high precision in both horizontal and vertical directions. Unlike conventional selective photothermolysis which has no inherent spatial selection in the vertical direction, spatially selective photothermolysis can selectively treat the target tissue at a specific depth while keeping the surrounding tissue immediately above and below intact.
Schematics showing the advantage of spatially selective photothermolysis over conventional selective photothermolysis. (A) Before treatment. (B) After the treatment with conventional selective photothermolysis, both the target cells and surrounding normal cells are altered when the target cells and the normal cells have similar absorptions. (C) After the treatment with spatially selective photothermolysis, the target cell is altered because the tightly focused femtosecond laser deposits the radiant energy in the target cell (the focal point) through multiphoton absorption, a non-linear optical phenomenon occurring only at the focal point with high enough energy density. The inset shows that the normal cells above the target cell are not altered although the femtosecond laser beam passes through them.
In this work, we realize precise spatially selective photothermolysis by modulating the femtosecond laser irradiation and monitoring the photothermolysis process in real-time. A multimodal optical microscope incorporating reflectance confocal (RCM), second harmonic generation (SHG), and two-photon fluorescence (TPF) was constructed to select the treatment target, monitor the treatment process, and characterize the effect of spatially selective photothermolysis on the target tissue in murine skin. Our optical configuration allowed us to systematically characterize the biological effects of the femtosecond laser exposure. The treatment laser irradiation was modulated with a programmable shutter to better confine the heat within the target.
Materials and Methods
Study design
The objective of this study was to realize precise spatially selective photothermolysis in tissue using real-time multimodal imaging monitoring and modulated femtosecond laser irradiation. A multimodal imaging system was configured to obtain the images of RCM, SHG, and TPF of mouse skins before, during, and after spatially selective photothermolysis. Histology was utilized to confirm whether multimodal images can be used to assess the alteration induced by the spatially selective photothermolysis. The relationship between the intensity change of the multimodal images and the treatment laser power was extracted to demonstrate whether multimodal images can be used to assess the alteration quantitatively. The real-time multimodal image intensities during the treatment process were recorded by reducing the detector gains. The treatment laser exposure was modulated with a programmable shutter to study the effect of laser exposure mode on the precision of the spatially selective photothermolysis.
Experimental setup
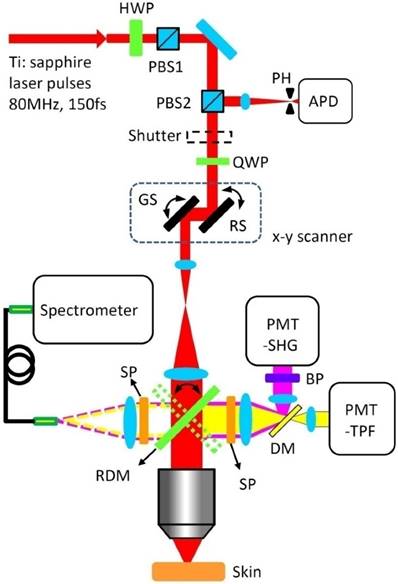
Figure 2 presents the schematic drawing of the integrated multimodal optical microscope for imaging-guided spatially selective photothermolysis. A tunable femtosecond Ti: sapphire laser beam (720-960 nm, 80 MHz, 150 fs) used for both multimodal imaging and treatment is directed to an x-y scanner and then focused onto mouse skin with a water-immersion microscope objective. The laser power for imaging and treatment is controlled by the combination of a motorized rotating half wave plate (HWP) and a polarizing beam splitter (PBS1). A second polarizing beam splitter (PBS2) and a quarter wave plate (QWP) are used to direct the descanned reflectance signals to an avalanche photodiode (APD) module with a 30 μm pinhole in the front for confocal imaging. Two independent photomultiplier tubes (PMT-SHG and PMT-TPF) are used for SHG and TPF imaging respectively. A piezoelectric scanner is used to perform z-scanning for 3D imaging or treatment at different depths. TPF and SHG spectra can be acquired with a spectrometer through a fiber bundle which is attached to the spectrometer port. Switching between spectroscopy and imaging is realized by flipping the rotating dichroic mirror (RMD). A programmable shutter located at the laser exit port is used to control the laser exposures for different treatment schemes.
Experimental set-up for spatially selective photothermolysis. HWP, half waveplate; PBS, polarizing beam splitter; PH, pinhole; APD, avalanche photodiode; QWP, quarter waveplate; RS, resonance scanner; GS, galvanometer scanner; PMT, photomultiplier tube; SHG, second harmonic generation; TPF, two-photon fluorescence; BP, bandpass filter; SP, shortpass filter; DM, dichroic mirror; RDM, rotating dichroic mirror.
Mouse skin preparation
All animal experiments were performed according to a protocol approved by the University of British Columbia Animal Care Committee (certificate number: A10-0338). Skin samples excised from the shaved backs of euthanized NODSCID mice were used in this study. The skin was oriented on a glass slide with the epidermal side up and then covered with a glass cover slip. Distilled water was added in between the cover slip and the microscope objective for refractive index matching.
Histology
The intact mouse skin and high power femtosecond laser treated mouse skin were fixed with 10% formaldehyde. Then dehydration, clearing, and infiltration were performed, followed by tissue processing and embedding with paraffin wax. The hardened block containing skin was then sectioned using microtome. Vertical sectioning was performed to obtain 7 μm thickness cross sections. To compare the difference between multimode images and histology, we measured the multimode images before staining. Haematoxylin and eosin (H&E) stain and Masson's trichrome (MT) stain were employed to assess the treatment effect.
Laser treatment and Imaging
The image field of view (FOV) was set at 200 μm × 200 μm. The imaging frame rate is 15 fps. The laser power was set at 40mW for imaging. To perform treatment, the FOV was set at 50 μm × 50 μm, the gains of avalanche photodiode and photomultiplier tubes were reduced, and the laser power was increased to desired values (400 mW for Fig. 3, Fig. 5 and Fig. 8; 200 mW for Fig. 7; 200-400 mW for Fig.4). To obtain 3D image, a stack of horizontal images (x-y) were collected at different depths from the surface to the bottom of the skin by moving the objective along the Z direction through the piezoelectric scanner. The step of the z scan is 1 μm. The 3D image was reconstructed using ImageJ software.
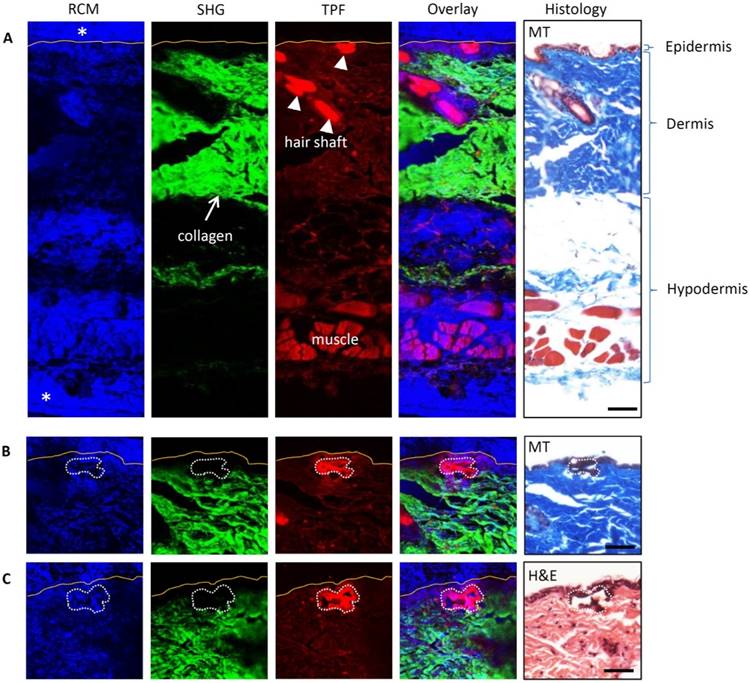
Multimodal images and histology of untreated and treated mouse skin. Multimodal images incorporate RCM, SHG, and TPF. In the overlay channel, blue is for RCM, green for SHG and red for TPF. The yellow lines in multimodal images indicate the skin surface boundary. In the histology photographs, MT is for Masson's trichrome stain and H&E for hematoxylin and eosin stain. (A) Untreated skin. Paraffin has strong RCM signal (marked with asterisks) but no SHG and TPF signal. (B, C) Two independent treated skin. The treated areas are marked with the white dotted freeform. The TPF signals of the treated areas are stronger than that of the intact surrounding tissues. The SHG signals of the treated area are weaker than that of the intact surrounding area. Scale bars, 50μm.
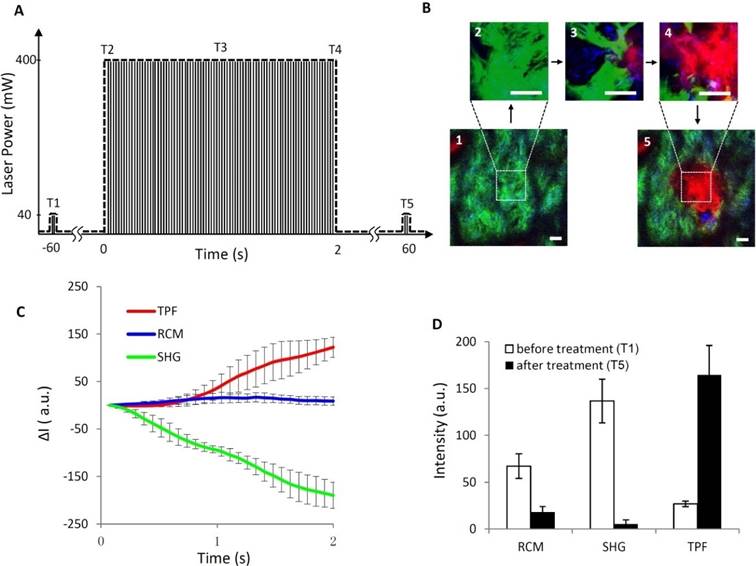
Process of spatially selective photothermolysis with real-time monitoring. (A) time profile of the laser power. T1-T5 represent time points at 60 second before (T1), the beginning (T2), the middle (T3), the end (T4), and 60 second (T5) after the treatment, respectively. (B) Multimodal images (RCM, blue; SHG, green; TPF, red) at the corresponding time points as shown in (A). Scale bars, 20μm. (C) Changes of TPF, RCM, and SHG intensities averaged over the targeted area during the treatment process. ΔI=It-IT2, where It is the intensity at time t, IT2 is the intensity at time point T2 in (A). (D) Intensities of RCM, SHG, and TPF before and after the treatment. The results are presented as the mean±SD (n=10), where SD is standard deviation, n is the sample size. See supplementary video 1 for detailed multimodal imaging video record of the treatment process.
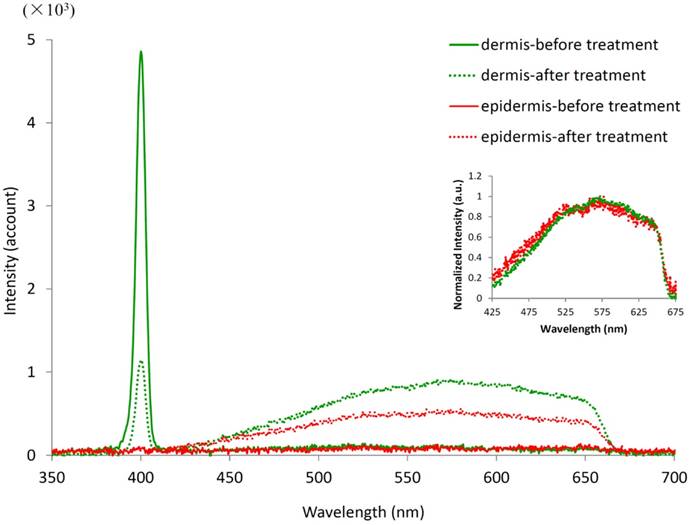
Spectra of the dermis and epidermis before and after laser treatment. The treatment area is 50 μm × 50 μm, located at 40 μm (for dermis) or 20 μm (for epidermis) beneath the skin surface. The excitation wavelength is 800 nm. The inset curves were normalized by the peak values between 425 and 675 nm.
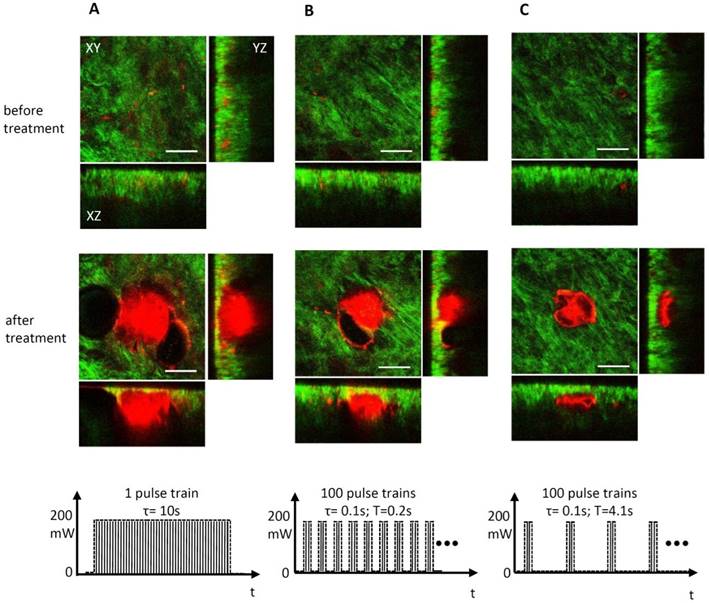
Precise spatially selective photothermolysis. The targeted area is 50 μm × 50 μm, located in the centre of the XY image and 40 μm beneath the tissue surface. Orthogonal views of three dimensional multiphoton images (SHG, green; TPF, red) before and after 200 mW laser treatment with different pulse train duration (τ) and period (T). In column (A), there is one pulse train, and the pulse train duration is 10 s. In column (B), there are 100 pulse trains with 0.1 s pulse train duration and 0.2 s pulse train period. In column (C), there are 100 pulse trains with 0.1s pulse train duration and 4.1s pulse train period. The bottom row in (A, B, C) shows the pulse train profiles. All scale bars in the images, 50μm.
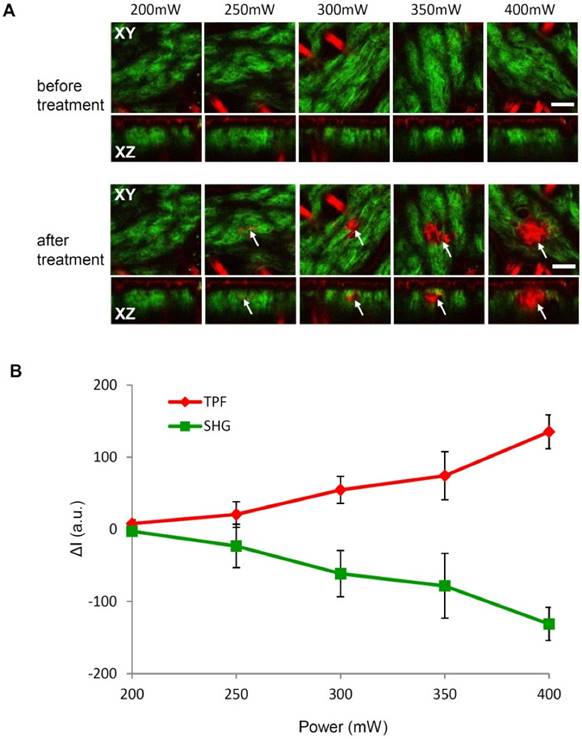
Spatially selective photothermolysis depends on laser power. (A) Multiphoton images (SHG, green; TPF, red) before and after laser treatment at various laser power with 2s treatment time. The targeted area is 50 μm × 50 μm, located in the centre of the XY plane image and 40 μm beneath the skin surface. The arrows indicate the alteration of target tissue. XY is the plane parallel to the skin surface; XZ is the plane perpendicular to the skin surface. Scale bar, 50μm. (B) Changes of TPF and SHG intensities before and after treatment averaged over the targeted area (ΔI=Iafter - Ibefore). The results are presented as the mean±SD (n=10), where SD is standard deviation, n is the sample size, a.u. is arbitrary unit.
Generation of treatment pulse train
Although a single laser pulse (150 fs) is far shorter than the thermal relaxation times of most target structures, heat accumulation and diffusion still occur in the experiments due to the high repetition rate of the pulses (i.e. 80 MHz, also regarded as quasi-continuous wave) and small scanning field of view (i.e. 50 μm × 50 μm). Therefore, in order to implement precise spatially selective photothermolysis in the target tissue, the high repetition rate femtosecond laser pulses are chopped with a programmable shutter to yield laser pulse trains of different pulse train duration and pulse train period.
Measure the optical spectra
The rotating dichroic mirror (RDM in Fig. 2) was rotated to the fiber bundle port to direct the spectral signal into the fiber bundle. To measure the spectra of dermis and epidermis, the laser beam was focused at 40 μm and 20 μm beneath the skin surface respectively and confirmed by the reflectance confocal microscopy images. The spectra of dermis and epidermis were acquired before and after treatment.
Results
Multimodal imaging for assessing photothermolysis
Multimodal images (RCM, SHG, and TPF) and histological photomicrographs of the untreated and treated mouse skin were compared to assess the utility of multimodal imaging for assessing the microscopic effects of spatially selective photothermolysis. The mouse skin was treated by scanning a tightly focused 800 nm femtosecond laser beam with 400 mW for 4 s (the treated area, 50 μm × 50 μm, 40 μm beneath the skin surface). It was then fixed immediately in 10% formalin for 48h followed by tissue processing and immersion in paraffin. The fixed and paraffin-embedded skin was sectioned into 7 μm thickness slices. Multimodal images of the skin sections with paraffin were obtained before further staining with Masson's trichrome (MT) [15] or hematoxylin and eosin (H&E) [16] to assess the thermal alteration. Figure 3 shows the multimodal images (RCM, SHG, and TPF) and corresponding MT and H&E stained histological photomicrographs of the untreated (Fig. 3A) and treated (Fig. 3B-C) skin. The three layers of untreated skin (epidermis, dermis, and hypodermis) can be identified clearly in both the multimodal images and the stained photomicrographs (Fig. 3A). The strong reflectance confocal signals appeared blue at the top and bottom of the RCM image and marked with asterisks are due to paraffin. There are no signals at the same locations in the SHG and TPF images, which indicates that paraffin does not produce SHG and TPF signals that in turn are therefore presumed to arise solely from the tissue itself. In other words, the paraffin can affect the RCM signal but not the TPF and SHG signals. Comparing the SHG, TPF images and the photomicrographs, we confirmed that the SHG signal is primarily from the collagen fibers in dermis, while the TPF signal can be detected in all the three layers (epidermis, dermis, and hypodermis). The hair shaft produces the strongest TPF signal as compared with other tissue components. From Fig. 3B-C, it can be seen that after treatment, the TPF signal is increased and the SHG signal is decreased in the treated area (marked with white dotted line) relative to the surrounding intact tissue (outside of the treated area). However, the change of the treated area in the RCM channel is not obvious, which may be due to the paraffin effect. The staining of the treated area changed from blue to dark or from pink to dark after MT or H&E staining, respectively, correlating well with the treatment effect demonstrated in the TPF and SHG images.
Irradiation power dependence of the spatially selective photothermolysis efficacy as quantified by multimodal imaging
To further demonstrate the spatially selective photothermolysis, we compared the multiphoton images (TPF and SHG) of excised fresh mouse skin before and after treatment with different laser powers from 200 mW to 400 mW, as shown in Fig. 4A. The targeted area is 50 μm × 50 μm, 40 μm beneath the skin surface. The treatment time is 2 seconds for all the different power levels. Consistent with previous results as in Fig. 3B-C, the TPF signal (red) is increased and the SHG signal (green) is decreased after treatment. The zone of tissue alteration, indicated by the white arrows, increases in size with the laser power. To quantify the relationship between the spatially selective photothermolysis and the laser power, we measured the averaged TPF and SHG intensities of the targeted area (50 μm × 50 μm ) before and after the treatment, as shown in Fig. 4B. It is found that TPF increases and SHG decreases with treatment laser power. These results and the histology indicate that multiphoton images are effective tools for assessing the alteration extent in the spatially selective photothermolysis.
Real-time monitoring of the treatment process of spatially selective photothermolysis
Monitoring the treatment process in real time is important in potential clinical applications of spatially selective photothermolysis. Figure 5 demonstrates a full process of spatially selective photothermolysis and the corresponding changes of SHG, TPF and RCM signals. Figure 5A shows the time profile of laser power for the spatially selective photothermolysis. T1-T5 represents 60 seconds before (T1), at the beginning (T2), in the middle point (T3), at the end (T4), and 60 seconds after the treatment (T5), respectively. Figure 5B shows the multimodal images of the targeted tissue at the corresponding time points as show in Fig. 5A. The imaging area before (1) and after (5) the treatment is 200 μm × 200 μm, and the targeted treatment area during the treatment (2-4), marked with white dash box in 1 and 5, is 50 μm × 50 μm. The changes in the intensities of RCM, TPF and SHG images of the treated area during the photothermolysis are plotted in Fig. 5C. We found that the TPF signal increases while the SHG signal decreases monotonically during the treatment. The changes of TPF and SHG before and after treatment shown in Fig. 5D have the same trend as that during the treatment process, which indicates that TPF and SHG signals during the treatment process can be two appropriate indicators to show whether the targeted tissue has been altered. Compared with TPF and SHG signals, the mean RCM signal intensity variation during the treatment is less remarkable, as shown in Fig. 5C. Although the mean RCM intensity doesn't change significantly during the treatment period, vacuoles could be visualized under RCM as shown in the supplementary video S1. Sixty seconds after the treatment (T5), these vacuoles dissipate, leading to the RCM intensity dropping below the value before treatment (T1) ( Fig. 5D).
Modulating femtosecond laser exposure to achieve precise spatially selective photothermolysis
Precise spatially selective photothermolysis depends on appropriate management of laser exposure. Although one single laser pulse duration (150 fs) is far shorter than most target thermal relaxation times, thermal diffusion still results in unwanted alteration beyond the targeted area, as shown in the Fig. 4A and Fig. 5B(5) (400 mW, 2s lengthy pulse train). To implement precise spatially selective photothermolysis, a programmable shutter was used to chop the 80 MHz femtosecond pulses into discrete pulses trains (Fig.6). Figure 7 demonstrates the treatment effect of three different pulse trains on the treatment precision. Long pulse train duration (Fig. 7A) or short pulse train period (Fig. 7B) results in tissue alteration beyond the light exposure area. Shorter pulse train duration combined with longer pulse train period appear to confine the alteration in the treatment area with high precision (as shown in Fig. 7C).
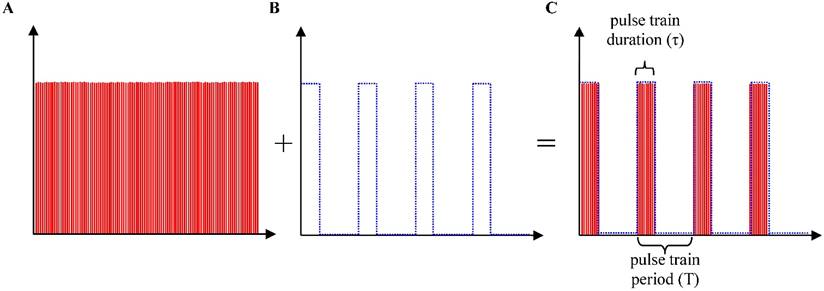
Generation of discrete pulse trains. A programmable shutter located at the laser exit port was used to control the exposure of high repetition rate femtosecond laser pulses (150 fs pulse duration, 80 MHz, regarded as quasi-continuous wave) to yield the treatment pulse train. (A) High repetition rate (80MHz) femtoseocnd laser pulses (quasi-continuous wave). (B) Chopping pulses produced by a programmable shutter. (C) Pulse trains generated for treatment
Tissue spectral changes by spatially selective photothermolysis
The whole spectra of target tissue were measured before and after spatially selective photothermolysis, as shown in Fig.8.
The fluorescence spectra (425-675 nm) of dermis and epidermis are flat and of the same low level in intensity before treatment. The fluorescence spectra of both the dermis and the epidermis increase after treatment with a broad peaking around 575 nm. Although the increment of fluorescence intensity of dermis is higher than that of epidermis, the normalized fluorescence spectra of the dermis and epidermis have similar shape (see the inset in Fig. 8). The sharp edge at 650 nm in the TPF signals after treatment is due to the cutoff wavelength of the filter which is used to block the excitation laser light. The change of TPF signal intensity and shape after treatment suggests that one or more new fluorophores are generated as a result of the treatment. It is worth noting that there is a strong peak signal in the dermis spectra which corresponds to the second harmonic generation (SHG) signal, located at 400 nm, exactly half of the excitation wavelength. The intensity of the SHG peak decreases after the laser treatment, indicating that the collagen fibers in the dermis are altered.
Discussion
We have demonstrated the proposed precise spatially selective photothermolysis in a mouse skin model using multimodal imaging monitoring in real time. The increase of TPF signal and the decrease of SHG and RCM signals can be used to assess the alteration of the targeted tissue, which is confirmed by histology. The change of the TPF spectrum (Fig. 8) suggests one or more new fluorophores are generated, the identity of which is uncertain. One study suggested that bityrosine structures yielded from collagen is the reason why the TPF signal increases after collagen thermal alteration [17]. Our results, however, show that the change of TPF signal of the epidermis (without collagen) has similar characteristics of the dermis (containing large amount of collagen). Moreover, there is one sharp fluorescence peak at 408 nm for bityrosine [18], which is very different from the peak we observed at 575 nm. We speculate that the increase of the TPF signal after treatment might be attributed to carbonization of the target tissue for two reasons. One reason is that high temperature over 100 °C at the treated area could have been achieved as vacuoles were observed in our experiment (see supplementary materials: movie S1). The other reason is that carbon nanoparticles have fluorescence spectra similar to what we measured in figure 8 [19]. Further studies are under way to reveal the mechanisms of the TPF signal increase after spatially selective photothermolysis. The decrease of the SHG after spatially selective photothermolysis is in agreement with previous observations [15, 17, 20-22]. It is well known that the SHG signal decreases after thermal alteration because the triple helical molecular structure of collagen changes to a random coil [21].
As with conventional selective photothermolysis, short pulse train duration and long pulse train period can confine the heat in the focal point to obtain precise treatment in the spatially selective photothermolysis. It should be noted that some degree of thermal diffusion beyond the focal point in the spatially selective photothermolysis could be utilized to enhance the treatment efficiency for treating lager target structure since the thermal diffusion could be controlled elaborately with our real-time monitoring method.
Although we used the skin model to demonstrate the precise spatially selective photothermolysis, the applications of spatially selective photothermolysis are not limited to dermatology. It can be applied in many other fields such as neuroscience which requires high precise and non-invasive surgery.
Supplementary Material
Movie S1. Multimode imaging video of the treatment process. Blue channel, RCM; Green channel, SHG; Red channel, TPF. The bottom part of the frame at 2.03 s is black because the shutter is closing.
Acknowledgements
We greatly appreciate the fruitful discussions with Dr. David I. McLean during the course of the project. This work was supported by the Canadian Institutes of Health Research (Grant #: MOP130548), the Canadian Dermatology Foundation, the VGH & UBC Hospital Foundation, and the BC Hydro Employees Community Services Fund.
Competing Interests
The authors declare no competing financial interests.
References
1. Anderson RR, Parrish JA. Selective photothermolysis: precise microsurgery by selective absorption of pulsed radiation. Science. 1983;220:524-7
2. Anderson RR, Margolis RJ, Watenabe S. et al. Selective photothermolysis of cutaneous pigmentation by Q-switched Nd: YAG laser pulses at 1064, 532, and 355 nm. J Invest Dermatol. 1989;93:28-32
3. Tan OT, Sherwood K, Gilchrest BA. Treatment of children with port-wine stains using the flashlamp-pulsed tunable dye laser. N Engl J Med. 1989;320:416-21
4. Alster TS, Williams CM. Treatment of keloid sternotomy scars with 585 nm flashlamp-pumped pulsed-dye laser. The Lancet. 1995;345:1198-200
5. Nelson JS, Milner TE, Anvari B. et al. Dynamic epidermal cooling during pulsed laser treatment of port-wine stain: A new methodology with preliminary clinical evaluation. Arch Dermatol. 1995;131:695-700
6. Grossman MC, Dierickx C, Farinelli W. et al. Damage to hair follicles by normal-mode ruby laser pulses. J Am Acad Dermatol. 1996;35:889-94
7. Lask G, Elman M, Slatkine M. et al. Laser-assisted hair removal by selective photothermolysis preliminary results. Dermatol Surg. 1997;23:737-9
8. Manstein D, Herron GS, Sink RK. et al. Fractional photothermolysis: a new concept for cutaneous remodeling using microscopic patterns of thermal injury. Lasers Surg Med. 2004;34:426-38
9. Laubach HJ, Tannous Z, Anderson RR. et al. Skin responses to fractional photothermolysis. Lasers Surg Med. 2006;38:142-9
10. Dierickx CC, Casparian JM, Venugopalan V. et al. Thermal relaxation of port-wine stain vessels probed in vivo: the need for 1-10-millisecond laser pulse treatment. J Invest Dermatol. 1995;105:709-14
11. Wlotzke U, Hohenleutner U, Abd-El-Raheem T. et al. Side-effects and complications of flashlamp-pumped pulsed dye laser therapy of port-wine stains. A prospective study. Br J Dermatol. 1996;134:475-80
12. Nanni CA, Alster TS. Laser-assisted hair removal: side effects of Q-switched Nd: YAG, long-pulsed ruby, and alexandrite lasers. J Am Acad Dermatol. 1999;41:165-71
13. Lanigan SW. Incidence of side effects after laser hair removal. J Am Acad Dermatol. 2003;49:882-6
14. Wang H, Zandi S, Lee AMD. et al. Imaging directed photothermolysis through two-photon absorption demonstrated on mouse skin-a potential novel tool for highly targeted skin treatment. J Biophotonics. 2014;7:534-41
15. Tanaka R, Fukushima S, Sasaki K. et al. In vivo visualization of dermal collagen fiber in skin burn by collagen-sensitive second-harmonic-generation microscopy. J Biomed Opt. 2013;18:061231
16. Nicolodelli G, Angarita DPR, Inada NM. et al. Effect of photodynamic therapy on the skin using the ultrashort laser ablation. J Biophotonics. 2014;7:631-7
17. Hovhannisyan V, Lo W, Hu C. et al. Dynamics of femtosecond laser photo-modification of collagen fibers. Opt Express. 2008;16:7958-68
18. Sahar FM, Stephen EB. Laser-excited fluorescence of dityrosine. Appl Spectrosc. 1995;49:1669-76
19. S.C. R, Arindam S, Nikhil RJ, et al. Fluorescent carbon nanoparticles: synthesis, characterization, and bioimaging application. J Phys Chem C. 2009;113:18546-51
20. Hovhannisyan V, Ghazaryan A, Chen YF. et al. Photophysical mechanisms of collagen modification by 80 MHz femtosecond laser. Opt Express. 2010;18:24037-47
21. Yeh AT, Kao B, Jung WG. et al. Imaging wound healing using optical coherence tomography and multiphoton microscopy in an in vitro skin-equivalent tissue model. J Biomed Opt. 2004;9:248-53
22. Lin SJ, Hsiao CY, Sun Y. et al. Monitoring the thermally induced structural transitions of collagen by use of second-harmonic generation microscopy. Opt Lett. 2005;30:622-4
Author contact
![]() Corresponding author: hzengca.
Corresponding author: hzengca.