Impact Factor
- Issue 14; 2026
- Issue 13; 2026
- Issue 12; 2026
- Issue 11; 2026
- Issue 10; 2026
- Volume 16; 2026
- Advance Articles
- Past Issues
- Cover Images
- Cover Suggestion
- Index & Coverage
- Special Issues
Introduction
Materials and Methods
Results
Discussion
Acknowledgements
Supplementary Material
References
International Journal of Biological Sciences
International Journal of Medical Sciences
 Global reach, higher impact

Theranostics 2017; 7(3):573-593. doi:10.7150/thno.17433 This issue Cite
Research Paper
Direct Administration of Nerve-Specific Contrast to Improve Nerve Sparing Radical Prostatectomy
Connor W. Barth1, Summer L. Gibbs1,2,3 ![]()
1. Biomedical Engineering Department, Oregon Health & Science University, Portland, OR 97201.
2. Knight Cancer Institute, Oregon Health & Science University, Portland, OR 97201.
3. OHSU Center for Spatial Systems Biomedicine, Oregon Health & Science University, Portland, OR 97201.
Received 2016-9-1; Accepted 2016-11-16; Published 2017-1-7
Abstract

Nerve damage remains a major morbidity following nerve sparing radical prostatectomy, significantly affecting quality of life post-surgery. Nerve-specific fluorescence guided surgery offers a potential solution by enhancing nerve visualization intraoperatively. However, the prostate is highly innervated and only the cavernous nerve structures require preservation to maintain continence and potency. Systemic administration of a nerve-specific fluorophore would lower nerve signal to background ratio (SBR) in vital nerve structures, making them difficult to distinguish from all nervous tissue in the pelvic region. A direct administration methodology to enable selective nerve highlighting for enhanced nerve SBR in a specific nerve structure has been developed herein. The direct administration methodology demonstrated equivalent nerve-specific contrast to systemic administration at optimal exposure times. However, the direct administration methodology provided a brighter fluorescent nerve signal, facilitating nerve-specific fluorescence imaging at video rate, which was not possible following systemic administration. Additionally, the direct administration methodology required a significantly lower fluorophore dose than systemic administration, that when scaled to a human dose falls within the microdosing range. Furthermore, a dual fluorophore tissue staining method was developed that alleviates fluorescence background signal from adipose tissue accumulation using a spectrally distinct adipose tissue specific fluorophore. These results validate the use of the direct administration methodology for specific nerve visualization with fluorescence image-guided surgery, which would improve vital nerve structure identification and visualization during nerve sparing radical prostatectomy.
Keywords: nerve sparing radical prostatectomy, fluorescence image-guided surgery, nerve-specific fluorophore, prostate cancer, direct administration.
Introduction
Prostate cancer is the most prevalent cancer in men and the second leading cause of male cancer death in the United States [1]. The main treatment options are watchful waiting, radiotherapy, and radical prostatectomy [2]. Radical prostatectomy is the most effective prostate cancer therapy, significantly reducing prostate cancer mortality as compared to watchful waiting [3] or radiotherapy [4-6]. While the ultimate goal of radical prostatectomy is cancer cure, preserving the nerve structures responsible for continence and potency is vital to quality of life. To enhance nerve preservation, the nerve sparing method was developed over 30 years ago [7]. However, nerve damage continues to plague radical prostatectomy and is reported in up to 60% of patients one-year post surgery [8, 9]. Furthermore, the outcome of the nerve sparing procedure is highly reliant on the surgeon's experience and ability to master the technique [10, 11]. These shortcomings are largely due to the inability to directly visualize the vital nerve structures intraoperatively. Surprisingly, no clinically approved method exists to enhance direct nerve visualization in the surgical suite. Current nerve detection is completed through a combination of palpation and visual inspection, which is hampered by the small size of the vital nerves as well as the depth and narrowness of the pelvis making distinguishing nerves from surrounding tissues challenging [12, 13].
Fluorescence image-guided surgery offers the potential for improved visualization of specifically highlighted tissues, such as nerves, intraoperatively in real time. Using optical imaging technologies, fluorescence image-guided surgery can provide real time imaging with specific labeling in minimally invasive systems that are readily implemented into current surgical workflows [14-18]. Other technologies, such as confocal endomicroscopy and optical coherence tomography, have demonstrated visualization of the nerves surrounding the prostate intraoperatively with high resolution, however these lack widefield imaging functionality, diminishing the ability to identify nerve tissues in real time [19-22]. In addition, these imaging probe based technologies often require that the probe be in direct contact with the nerve tissue, generating point based measurements instead of images and potentially interferring with minimally invasive procedures. Non-imaging technologies such as optical nerve stimulation have also been used to identify nerves by measuring intracavernous pressure upon stimulation of nerve tissue, however without direct imaging capability and a lag time of 2-5 s between stimulation and measurement, real time nerve identification is again difficult to achieve [23-26]. The utility of fluorescence image-guided surgery has been demonstrated using developed imaging systems, such as the FLARE [14, 16, 17, 27-29], Fluobeam 800 [30], Photodynamic eye [31], HyperEye Medical System [32], and the FDA approved fluorescence-imaging channel in the da Vinci surgical robot (Intuitive Surgical, Inc., Sunnyvale, CA). However, to date, only two FDA approved near infrared (NIR) fluorescent contrast agents exist, including methylene blue and indocyanine green, both blood pool agents that do not provide nerve-specific contrast. Fluorescence imaging in the NIR region (650-900 nm) is advantageous as endogenous tissue chromophore absorbance, scattering and autofluorescence are all at local minima, creating a black background upon which tissue-specific contrast can be added [33]. Fluorophores positioned in the NIR window can be visualized with minimal background at up to centimeter depths in tissue, compared to micron to millimeter depths in the visible region, due to increased photon penetration [18, 34]. Several classes of small molecule fluorophores have been shown to stain nerve and/or brain tissue in preclinical in vivo studies, including stilbene derivatives [35], a coumarin analog [36], distyrylbenzene derivatives [14, 37-41], styryl pyridinium fluorophores [42, 43], a tricarbocyanine fluorophore [44], and an oxazine fluorophore [45]. These fluorophores have been shown to readily penetrate the blood-nerve barrier (BNB) and/or blood-brain barrier (BBB) following systemic administration providing nerve- and/or myelin-specific contrast. However, only three classes of these fluorophores have demonstrated red to near infrared (NIR) excitation and/or emission wavelengths, where the oxazine fluorophore, Oxazine 4, has demonstrated both strong nerve specificity following systemic administration as well as red-shifted excitation and emission wavelengths [45].
Although systemic administration of Oxazine 4 highlights all nerve tissue [45], utility for radical nerve sparing prostatectomy may be limited. The prostate is a highly innervated organ where the nerves responsible for continence and potency branch from the pelvic plexus and lie within fibrofatty tissue along the lateral surfaces of the prostate [46, 47]. During nerve sparing prostatectomy, preservation of all nerve tissue is not possible. Fortunately, only preservation of the cavernous nerves, which are thought to lie within the neurovascular bundle (NVB), are required for recovery of urinary continence and erectile function post-surgery [48, 49]. Therefore, systemic administration of Oxazine 4 would potentially diminish the signal-to-background ratio (SBR) of the cavernous nerves due to extensive nerve fluorescence throughout the prostate. A direct administration methodology where the fluorophore is applied to the nerve tissue of interest to highlight the desired nerve structure has the potential to alleviate these difficulties by selectively labeling the vital nerve structures during nerve sparing radical prostatectomy. This selective labeling technique would be feasible during a nerve-sparing procedure where the prostatic pedicles containing the prostatic arteries and NVB are isolated following incision of the lateral prostatic fascia, allowing application of the nerve-specific fluorophore to an isolated region within the prostate containing the vital nerve structures [50]. In addition, by only highlighting relevant prostatic nerves rather than every nerve in the body via systemic administration, a direct administration methodology would inherently require a significantly lower dose of fluorophore, making clinical translation more feasible.
The goal of the current work was to develop a direct administration methodology that provided at least equivalent nerve contrast to systemic administration and could be completed within a clinically relevant time frame through optimization of several unique parameters. Direct administration cannot create nerve-specific contrast using biodistribution and clearance afforded to an intravenously injected fluorophore. Therefore, significant non-specific tissue accumulation can occur following direct tissue application that must be removed to create nerve-specific contrast. Through optimization of the fluorophore dose, incubation time, and washing protocol, non-specific fluorescence background signal was minimized while maintaining nerve-specific fluorescence. Furthermore, to ensure nerve-specific staining could be completed in a clinically relevant time frame (15-20 minutes), the total length of the direct administration methodology was reduced to facilitate seamless integration into current surgical practice. Additionally challenging to development of a direct administration methodology, was the well documented non-specific accumulation of nerve-specific fluorophores in adipose tissue due to their inherent lipophilicity [14, 37, 39, 40]. Since the vital nerve structures in the prostate are embedded in a fibrofatty plate in the pelvic region [47, 51], a dual fluorophore staining protocol using Oxazine 4 to highlight nerves and Nile Red to delineate adipose was also developed to mitigate non-specific adipose fluorescence, which would diminish nerve SBR. Nile Red is a fluorogenic, lipid-specific oxazine fluorophore that is spectrally distinct from Oxazine 4 [52-56], facilitating separation of nerve and adipose tissue fluorescence using a two-color imaging strategy. Translation of the optimized direct administration methodology to radical nerve-sparing prostatectomy could significantly improve cavernous nerve visualization and preservation, decreasing patient morbidity and improving post-surgical quality of life for prostate cancer survivors.
Materials and Methods
Study Design
This study was designed to optimize the direct administration of nerve-specific fluorophores for image-guided surgery as a clinically relevant alternative to systemic administration. Aspects of the fluorophore dose, incubation time, and removal of non-specific fluorophore accumulation were optimized in murine nerve models in vivo, specifically utilizing the readily accessible brachial plexus and sciatic nerves. The performance of each dose, incubation time, and washing protocol variation was evaluated using a custom-built small animal imaging system to detect fluorescence signal to background ratio at the selected nerve site as well as color images of the surgical field of view. The optimal direct administration protocol developed in murine peripheral nerves was applied to rat autonomic nerves to demonstrate the utility of the optimized staining procedure in a surgically accessible rodent model of the prostatic nerves.
For direct administration studies, only 2 nerve sites per mouse or rat were stained and imaged due to detectable non-specific accumulation of the fluorophores in other areas of the body following completion of the staining and imaging procedures on the initial nerve sites. Staining on 2 nerve sites per animal was performed concurrently on either the brachial plexus or sciatic nerve sites in mice or on the aortic plexus and hypogastric nerve sites in rats. Power analysis performed on preliminary data showed that n=3 nerve sites were needed for each group to obtain power of 0.9 and alpha of 0.01. Direct administration optimization studies were completed with 3 replicates (2 brachial plexuses and 1 sciatic nerve) per treatment group, while systemic administration, optimized direct administration, and rat autonomic nerve studies were completed with 4 replicates per treatment group (2 brachial plexuses and 2 sciatic mouse nerves or 2 aortic plexuses and 2 hypogastic rat nerves, respectively per treatment group).
Contrast Agents
Oxazine 4 perchlorate was obtained from Fisher Scientific Inc. (Pittsburgh, PA). Nile Red was obtained from Sigma-Aldrich (Saint Louis, MO). To solubilize both fluorophores a slightly modified version of the previously reported co-solvent formulation containing 10% dimethyl sulfoxide (DMSO), 5% Kolliphor EL, 65% serum, and 20% phosphate buffered saline (PBS) was used [14]. Oxazine 4 had peak absorbance in PBS, pH 7.4 at 616 nm and peak emission at 635 nm [45]. Nile Red had peak absorbance in model lipids representing the main molecular composition of adipose tissue at 530-550 nm and peak emission at 620-635 nm [54]. The absorbance and emission spectra of each fluorophore was determined using a SpectraMax M5 microplate reader (Molecular Devices, Sunnyvale, CA). Absorbance and emission spectra were collected in PBS, co-solvent formulation, and olive oil at 10 μM fluorophore concentration in each solvent. Olive oil was chosen as the solvent to mimic a lipid environment for accurate representation of Nile Red's absorption and emission in vivo, which is solvatochromic where emission maximum shifts based on the solvent polarity and degree of solubility [54].
Animals
Approval for the use of all animals in this study was obtained from the Institutional Animal Care and Use Committee (IACUC) at Oregon Health and Science University (OHSU). Male CD-1 mice weighing 22-24g and Male Sprague Dawley rats weighing 276-300g were purchased from Charles River Laboratories (Wilmington, MA). Prior to surgery, animals were anaesthetized with 100 mg/kg ketamine and 10 mg/kg xylazine (Patterson Veterinary, Devens, MA). The brachial plexus, aortic plexus, hypogastric and sciatic nerves were surgically exposed by removal of overlaying adipose and muscle tissues for direct nerve staining and imaging.
Intraoperative Fluorescence Imaging System
A custom-built small animal imaging system capable of real-time color and fluorescence imaging was used to acquire rodent in vivo images. The imaging system consisted of a QImaging EXi Blue monochrome camera (Surrey, British Columbia, CA) for fluorescence detection with a removable Bayer filter for collecting co-registered color and fluorescence images. A PhotoFluor II light source (89 North, Burlington, VT) was focused onto the surgical field through a liquid light guide and used unfiltered for white light illumination. For fluorescence excitation, the PhotoFluor II was filtered with a 545 ± 12.5 nm or a 620 ± 30 nm bandpass excitation filter for Nile Red or Oxazine 4, respectively. Resulting fluorescence was collected with a 605 ± 35 nm or a 700 ± 37.5 nm bandpass emission filter for Nile Red or Oxazine 4 image collection, respectively (Fig. S1). All filters were obtained from Chroma Technology (Bellows Falls, VT). Camera exposure times ranged from 2.5 - 300 ms for fluorescence image collection. All images collected for comparison between treatment groups were acquired with the same exposure time and are displayed under equal normalized brightness and contrast levels where indicated. For dual fluorophore tissue separation studies, Oxazine 4 and Nile Red fluorescence merged images were created in ImageJ [57] by subtracting the Oxazine 4 fluorescence image from the coregistered Nile Red fluorescence image after which the two fluorescence images were merged with the Oxazine 4 image false colored green and Nile Red image false colored red. For rat autonomic nerve and prostate staining studies, Oxazine 4 fluorescence and color merged images were created in ImageJ [57] by converting the color image to an RGB stack, copying and pasting the coregistered fluorescence image into the green channel of the RGB stack with the paste transfer setting set to “maximum”, and then converting the merged image back to an RGB color image.
Single Fluorophore Direct Administration Dose Ranging Studies
For direct administration of the nerve-specific fluorophore Oxazine 4, mouse brachial plexus or sciatic nerves were exposed and 100 μL of fluorophore co-solvent solution was applied covering the entire nerve site, submerging surrounding muscle, cut muscle, and adipose tissues in the fluorophore solution. Fluorophore dose optimization studies were performed where 2.475 - 79.2 μg Oxazine 4 or 0.995 - 15.92 μg Nile Red in the co-solvent formulation were applied to the selected nerve site formulated in 100 μL of the co-solvent formulation (n=3 nerve sites/group; 6 Oxazine 4 groups, 5 Nile Red groups). Fluorophore solutions were incubated on the nerve site for 5 min before being removed by absorption with a clean gauze pad. Following removal of the fluorophore solution, the nerve site was washed using the incubation wash method where enough washing solution was applied to cover the nerve site and incubated for 1 min prior to removal. Three incubation washes were performed following fluorophore incubation with varied washing solutions including blank co-solvent formulation, PBS + 0.1% Triton X-100, and PBS + 0.1% Tween 20 in that order. The optimal Oxazine 4 and Nile Red doses were determined based on the calculated nerve and adipose to background tissue ratios, respectively.
Dual Fluorophore Staining for Spectral Tissue Separation & Cross Talk Quantification
Dual fluorophore staining and cross talk studies were performed using the optimal Oxazine 4 and Nile Red doses, which were determined to be 4.95 μg Oxazine 4 and 1.99 μg Nile Red in the co-solvent formulation. The Oxazine 4 and Nile Red solutions were incubated on the nerve site serially in both orders, Oxazine 4 then Nile Red (Oxa4/NR) or Nile Red then Oxazine 4 (NR/Oxa4), with a single wash of blank co-solvent formulation between incubations. Additionally, Oxazine 4 and Nile Red were also incubated on the nerve site simultaneously as a mixed co-stain solution containing both fluorophores in the co-solvent formulation (n=3 nerve sites/group; 3 groups). Each fluorophore solution was incubated on the nerve site for 5 min, followed by three incubation washes, 1 min in length each using blank co-solvent formulation, PBS + 0.1% Triton X-100, then PBS + 0.1% Tween 20. The ideal dual fluorophore staining order and degree of cross talk between Oxazine 4 and Nile Red fluorescence in vivo was determined based on the calculated nerve and adipose to background tissue ratios.
Optimal Fluorophore Incubation Time for Direct Administration
Incubation time optimization studies using a serial stain of 4.95 μg Oxazine 4 in co-solvent formulation followed by 1.99 μg Nile Red in co-solvent formulation were performed with a 1, 3, or 5 min incubation time for each fluorophore with a single wash of blank co-solvent formulation between fluorophore incubations (n=3 nerve sites/group; 3 groups). Following the final fluorophore incubation, three incubation washes were performed using blank co-solvent formulation, PBS + 0.1% Triton X-100, then PBS + 0.1% Tween 20. The optimal staining time for Oxazine 4 and Nile Red fluorescence in vivo was determined based on the calculated nerve and adipose to background tissue ratios.
Nonspecific Fluorophore Removal Through Optimization of Washing Technique
The efficacy of incubation washing (1 min per wash with the three washing solutions including blank co-solvent formulation, PBS + 0.1% Triton X-100, and PBS + 0.1% Tween 20 utilized in that order) vs. flushing the nerve site with excess washing solution was tested using a serial stain of 4.95 μg Oxazine 4 in co-solvent formulation followed by 1.99 μg Nile Red in co-solvent formulation with 5 min incubation times for each fluorophore. Incubation washing was completed by applying enough washing solution to cover the nerve site and incubating for 1 min prior to removal. Flushing was completed by adding excess washing solution to the nerve site followed by removing it directly after application three times (n=3 nerve sites/group; 2 groups). For washing solution studies, PBS, PBS + 0.1% Tween 20, PBS + 0.1% Triton X-100, or blank co-solvent formulation was used as the sole washing solution per group and a series of 10 flush type washes were performed. The first flush step was completed during the serial staining procedure between Oxazine 4 and Nile Red fluorophore incubations and was considered flush step 1 with 9 subsequent flush steps following the Nile Red fluorophore incubation to reach 10 total flush steps (n=3 nerve sites/group; 4 groups). The ideal washing protocol and number of necessary flush steps was determined based on the calculated nerve and adipose to background tissue ratios.
Optimized Direct Administration of Fluorophores and Comparison to Systemic Administration in Murine Nerve Models
The optimal fluorophore dose, incubation time, washing method, and washing solution were used for final direct administration studies to complete direct nerve staining on a clinically relevant time scale. 4.95 μg Oxazine 4 in 100 uL of the co-solvent formulation was incubated for 5 min on the nerve site for the Oxazine 4 individual stain and dual fluorophore staining groups. Blank co-solvent formulation was incubated on the nerve site for the control group (n=4 nerve sites per group; 3 groups). Following the first incubation, 3 flush steps were performed with 3 flushes of PBS per step. For the individual stain and control studies, blank co-solvent formulation was incubated on the nerve site for 5 min. For the dual fluorophore staining group, 1.99 μg Nile Red in 100 uL of the co-solvent formulation was incubated for 5 min on the nerve site following Oxazine 4 incubation serving both to stain adipose tissue and wash the Oxazine 4 stained tissue with the co-solvent formulation. Following the second incubation with either Nile Red or blank co-solvent formulation, 3 additional flush steps were performed with 3 flushes of PBS per step. During the final direct administration studies, the entire staining procedure was timed to quantify total staining time.
The nerve to background tissue ratios were compared between the optimized direct administration methodology and systemically administered fluorophore. For systemic administration of the nerve-specific fluorophore, the kinetics and dose of Oxazine 4 were previously optimized for rodent studies and utilized herein [45]. The Nile Red dose was scaled from the optimal direct administration dose determined in this study. For mice 200 nmol (79.2 μg) of Oxazine 4 or 100 nmol (31.8 μg) of Nile Red were administered intravenously, each formulated in 100 μL of co-solvent formulation. Intravenous administration was performed 4 hours prior to imaging, which has been shown previously to provide the highest nerve to background tissue fluorescence for Oxazine 4 and several other nerve specific fluorophores [14, 37, 45]. Animals were administered either Oxazine 4 individually for nerve-specific fluorescence imaging or both Oxazine 4 and Nile Red for dual fluorophore staining studies. Animals were administered blank co-solvent formulation for all control images (n=4 nerve sites/group; 3 groups).
Fluorophore Peritoneal Murine Biodistribution
To assess peritoneal background fluorescence, mice were administered 200 nmol (79.2 μg) of Oxazine 4 or 100 nmol (31.8 μg) of Nile Red intravenously in 100 μL of co-solvent formulation. 4 hours after administration the peritoneal cavity was exposed by excising overlying skin and muscle tissue. Images of the exposed peritoneal cavity were collected to include liver, stomach, intestine, pancreas, spleen, kidney, adipose, muscle, and bladder tissues. Mice were administered either Oxazine 4 individually or both Oxazine 4 and Nile Red. Mice were administered blank co-solvent formulation for all control images (n=3 mice/group; 3 groups).
Optimized Direct Administration of Fluorophores and Comparison to Systemic Administration to Highlight Autonomic Nerves in Rat Models
Rat hypogastric nerves and aortic plexuses were stained using the optimized direct administration methodology developed in murine models. The hypogastric nerves and aortic plexus were selected as representative autonomic nerves with close proximity to the prostatic nerves that were surgical accessible in the peritoneal cavity of rats [51, 58, 59]. Nerve SBR in the hypogastic nerves and aortic plexuses after direct administration was compared to nerve SBR in these same nerve structures following systemic administration. For direct administration, the Oxazine 4 and Nile Red doses were scaled by body surface area from murine studies to 9.9 µg and 3.98 µg, respectively formulated in 200 µl of co-solvent maintaining equivalent fluorophore concentration to that used for murine studies. Similar to the murine direct administration studies, formulated fluorophore was applied to the exposed nerve site fully submerging the nerve as well as the surrounding muscle and adipose tissues. For comparison to systemic administration, Oxazine 4 and Nile Red doses were again scaled by body surface area to 158.4 µg and 63.6 µg, respectively which were each administered in 200 µl of co-solvent formulation [60].
For direct administration studies, the nerve sites were exposed and stained using the optimized protocol for either Oxazine 4 alone or Oxazine 4 and Nile Red dual fluorophore staining as described for mouse studies. For systemic administration, Oxazine 4 alone or Oxazine 4 and Nile Red were administered intravenously 4 hours prior to exposure of the selected nerve sites for imaging. The nerve SBR for each administration route using both single and dual staining techniques were compared (n=4 nerve sites/group; 5 groups). To aid in visualization of the nerves in the context of prostate tissue, the rat nerves stained using the direct administration method were resected along with surrounding muscle, adipose and connected prostate tissue following sacrifice. The resected tissue was imaged to show the nerve-specific signal modeling the pedicle isolation completed during radical nerve-sparing prostatectomy as well as show the retrograde transport of the fluorophore in the nerves tissue following completion of direct administration staining. Additionally, the stained hypogastric and aortic plexus nerve sites were covered in varying amounts of blood and imaged to simulate light and heavy bleeding that could occur during a prostatectomy procedure. To further demonstrate the ability to stain prostate innervation using the direct administration procedure, rat prostate and hypogastric nerve tissue was stained in vivo using the direct administration procedure and imaged following resection.
Histological Confirmation of Rat Autonomic Nerve Tissue
Rat hypogastric nerve tissue stained in vivo with the optimized direct administration procedure was resected along with adjacent muscle following euthanasia 30 min after the final flush step of the staining procedure and snap frozen in optimal cutting temperature (OCT) compound using liquid nitrogen. Serial cryosections were cut at 10 µm onto superfrost plus slides (Fisherbrand, Fisher Scientific). Three consecutive sections were stained with hematoxylin and eosin (H&E), left unstained and mounted with glycerol for imaging of Oxazine 4 fluorescence, or costained first with FluoroMyelin Red (ThermoFisher Scientific, Waltham, MA) fluorescent myelin stain (1:300 dilution in deionized water) and then NeuroTrace Blue (ThermoFisher Scientific, Waltham, MA) fluorescent Nissl stain (1:100 dilution in PBS) according to the manufacturer's instructions. Fluorescence and color microscopy images were collected on an AxioObserver inverted fluorescence microscope (Zeiss, Thornwood, NY) at 10x magnification. Color H&E images were collected using the built in transillumination white light unfiltered and an Axiocam 105 color camera (Zeiss). For fluorescence excitation, a Photofluor LM-75 light source (89 North, Burlington, VT) filtered with a 405 ± 20 nm, 545 ± 12.5 nm, or 620 ± 60 nm was used to excite Neurotrace Blue, Fluoromyelin Red, or Oxazine 4 fluorescence, respectively. Resulting fluorescence was collected with a 550 ± 25 nm, 605 ± 35 nm, or 700 ± 37.5 nm bandpass emission filter for Neurotrace Blue, Fluoromyelin Red, or Oxazine 4 image collection, respectively (Fig. S1). All filters were obtained from Chroma Technology (Bellows Falls, VT). Fluorescence images were acquired using an Axiocam 506 (Zeiss). Camera exposure times ranged from 50 - 6000 ms for fluorescence image collection.
Intraoperative Nerve Imaging and Image Analysis
Nerve specific contrast was assessed for all fluorophore optimization studies using the intraoperative fluorescence imaging system to collect images of the nerves and surrounding tissues. For systemic administration mouse studies, the brachial plexus and sciatic nerves were exposed and images were collected for each mouse 4 hours post injection. For systemic administration rat studies, the hypogastic nerve and aortic plexus were exposed and images were collected for each rat 4 hours post injection. Additional vehicle injected control animals were imaged to assess tissue autofluorescence for comparison to the systemically administered animals. For direct administration mouse studies, the brachial plexus and sciatic nerves were exposed and images were collected prior to any staining enabling each animal to act as its own control. Similarly, for direct administration rat studies, the hypogastic and aortic plexus were exposed and images were collected prior to any staining enabling each animal to act as its own control. In addition, the optimized direct administration procedure was completed with blank co-solvent formulation to ensure no nerve-specific fluorescence could be attributed to the co-solvent formulation alone. For all murine direct administration optimization studies, images were collected following every incubation or wash step. For the final murine direct administration studies, images were collected prior to the second co-solvent incubation, after the final wash step, and at 5 min intervals for up to 30 min after the final wash step to observe any changes in SBR that occurred following completion of staining. For the rat direct administration studies, images were collected after the final wash step and 30 min after the completion of the final wash step to observe any changes in the SBR that occurred following completion of staining.
Region of interest analysis was performed for each collected image of the nerve site to determine the fluorescence intensity from nerve, muscle, cut muscle, and adipose tissues. For images captured of Oxazine 4 fluorescence, the nerve to muscle (N/M), nerve to cut muscle (N/CM), and nerve to adipose (N/A) ratios were calculated using the intensity measurements for each tissue type. For images captured of Nile Red fluorescence, the adipose to muscle (A/M), adipose to cut muscle (A/CM), and adipose to nerve (A/N) ratios were calculated. This enabled the mean nerve to background tissue ratios (N/M, N/CM, N/A) and adipose to background tissue ratios (A/M, A/CM, and A/N) to be calculated for each group. Due to differences in the surgical model, no cut muscle tissue was stained during the rat direct administration studies, so this tissue type was excluded from that analysis. For murine peritoneal biodistribution studies, region of interest analysis was performed for each image of the peritoneal cavity to determine the fluorescence intensity from liver, stomach, intestine, pancreas, spleen, kidney, adipose, muscle, and bladder tissue. The peritoneal cavity fluorescence intensities were then divided by the exposure time in seconds to obtain intensity per second measurements for each tissue type.
Statistical Analysis
Significant differences between fluorophore incubation group means were evaluated using a one-way ANOVA followed by Tukey's multiple comparison test to compare all mean nerve and adipose to background tissue ratios in each study with three or more treatment groups. For the incubation time optimization study, an unpaired two-tailed Student's t test with equal variance was used to evaluate significant differences between the two incubation times. To compare the optimized direct administration procedure with systemic administration in both the final murine and rat nerve studies an unpaired two-tailed Student's t test with equal variance was used to evaluate significant differences between the two administration routes. The α value was set to 0.05 for all analyses. Results were presented as mean ± standard deviation (S.D.). All statistical analysis was performed using GraphPad Prism (La Jolla, CA).
Results
Single Fluorophore Dose Ranging Studies
A range of Oxazine 4 (2.475 - 79.2 μg/nerve site) or Nile Red (0.995 - 15.92 μg/nerve site) doses in co-solvent formulation (10% dimethyl sulfoxide (DMSO), 5% Kolliphor EL, 65% serum, and 20% phosphate buffered saline (PBS) [14, 61]) were tested to optimize the fluorophore dose for direct administration to nerve tissue. Co-solvent formulated Oxazine 4 or Nile Red was applied to exposed murine brachial plexus or sciatic nerves in vivo (Fig. 1). Images of each nerve site were collected following washing to remove unbound fluorophore using a 2.5 ms exposure time for equal comparison across all doses. Lower doses of fluorophore resulted in decreased nerve or adipose tissue fluorescence intensity. However, a greater decrease in non-specific muscle tissue fluorescence with decreasing fluorophore dose led to an increase in the nerve to muscle (N/M) contrast for Oxazine 4 (Fig. 1A) and adipose to muscle (A/M) contrast for Nile Red (Fig. 1B).
Single fluorophore direct administration dose ranging studies. Representative fluorescence images of the brachial plexus and sciatic nerve sites following direct fluorophore administration are shown for (A) Oxazine 4 and (B) Nile Red. All images are representative of data collected for n=3 nerve sites per dose. Doses were administered in a 100 μL volume of co-solvent formulation. All images were collected after the final wash step at 2.5 ms exposure time and images within each row labeled “Normalized” are displayed with equal contrast and brightness. The images labeled “Auto Contrast” are displayed with optimal contrast and brightness for each image to enable visualization of the nerve and adipose to background tissue contrast. The nerve to background tissue (C) and adipose to background tissue (D) ratios were determined using region of interest analysis on images collected following the final wash step, presented as the mean +/- the standard deviation. N/M = nerve to muscle ratio, N/CM = nerve to cut muscle ratio, N/A = nerve to adipose ratio, A/M = adipose to muscle ratio, A/CM = adipose to cut muscle ratio, A/N = adipose to nerve ratio. * = p value < 0.05, ** = p value < 0.01.
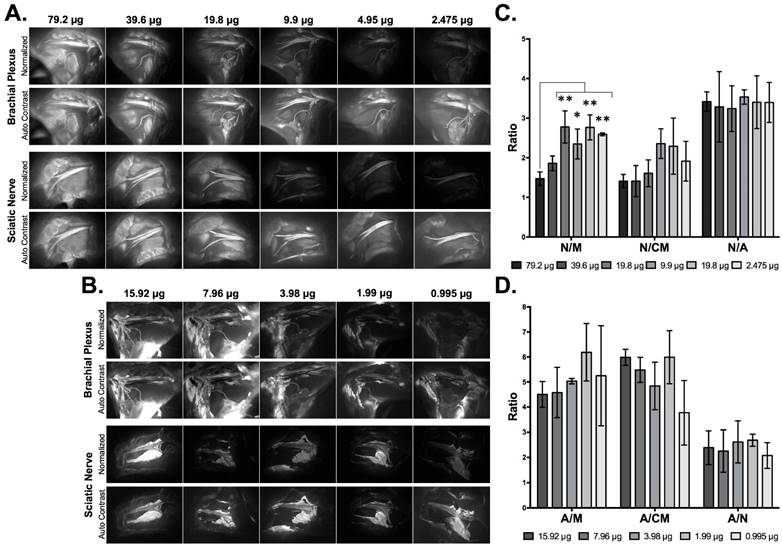
Region of interest analysis was performed to calculate the N/M, nerve to cut muscle (N/CM), nerve to adipose (N/A), A/M, adipose to cut muscle (A/CM), and adipose to nerve (A/N) ratios from representative tissues. Lower doses of Oxazine 4 (19.8 - 2.475 μg/nerve site) had significantly higher N/M ratios than the highest Oxazine 4 dose (79.2 μg/nerve site: p=0.0011 for 19.8 μg, p=0.023 for 9.9 μg, p=0.0011 for 4.95 μg, and p=0.0038 for 2.475 μg). The N/M ratio linearly increased for Oxazine 4 as the fluorophore dose was reduced from 79.2 to 19.8 μg/nerve site, while minimal N/M ratio change was observed when the fluorophore dose was further reduced to 2.475 μg/nerve site. The N/CM ratio linearly increased for Oxazine 4 when the dose was reduced from 39.6 to 9.9 μg/nerve site. Little N/CM difference was seen when the dose was reduced from 79.2 to 39.6 μg/nerve site or from 9.9 to 4.95 μg/nerve site. However, the mean N/CM ratio decreased when the Oxazine 4 dose was reduced from 4.95 to 2.475 μg/nerve site. The mean N/A ratio remained relatively constant across all tested doses (Fig. 1C). The Oxazine 4 dose that yielded the highest N/M and N/CM ratios was 4.95 μg/nerve site, which was selected as the optimal dose for direct administration.
The mean A/M ratio showed no significant change across the entire tested Nile Red dose range (15.92 - 0.995 μg/nerve site). The mean A/CM ratio showed no significant change following doses ranging from 15.92 to 1.99 μg/nerve site, however the mean A/CM ratio decreased at the lowest tested dose (0.995 μg/nerve site). The mean A/N ratio also showed no significant change across all tested doses (Fig. 1D). The optimal Nile Red dose selected for direct administration was 1.99 μg/nerve site, which minimized fluorophore dose while maintaining high A/M, A/CM, and A/N ratios.
Dual Fluorophore Staining for Spectral Nerve and Adipose Tissue Separation
Adipose tissue accumulation has plagued previous nerve-specific fluorophores, yielding relatively low N/A ratios [14, 37, 39, 40]. A dual fluorophore staining technique was investigated using the optimal dose of the nerve-specific Oxazine 4 (4.95 μg/nerve site) and adipose-specific Nile Red (1.99 μg/nerve site) to specifically highlight both nerve and adipose tissues (Fig. 2). The optimal dual staining protocol was tested where serial staining, in which Oxazine 4 was incubated first followed by Nile Red (Oxa4/NR) or vice-versa (NR/Oxa4), and simultaneous staining, where both fluorophore solutions were co-incubated on the tissue, were tested. The serial staining techniques yielded higher nerve and adipose to background tissue contrast than the simultaneous staining technique. While the serial and simultaneous staining techniques yielded similar nerve and adipose fluorescence intensities, the non-specific muscle fluorescence was lower using the serial staining technique (Fig. 2A).
Dual fluorophore staining technique for nerve and adipose spectral separation. (A) Representative color and fluorescence images for serial and simultaneous dual fluorophore tissue separation staining techniques using Oxazine 4 and Nile Red are shown. All images are representative of data collected for n=3 nerve sites per staining technique. All images were collected after the final wash step at 2.5 ms exposure time. Merged images were created by merging the Oxazine 4 signal false colored green with the Nile Red false colored red minus the Oxazine 4 signal (to remove any potential overlap due to crosstalk). (B) The Oxazine 4 nerve to background tissue ratios and (C) Nile Red adipose to background tissue ratios were determined using region of interest analysis on images collected after the final wash step for individual and dual fluorophore staining techniques in each fluorophore's respective channel, presented as the mean +/- standard deviation. N/M = nerve to muscle ratio, N/CM = nerve to cut muscle ratio, N/A = nerve to adipose ratio, A/M = adipose to muscle ratio, A/CM = adipose to cut muscle ratio, A/N = adipose to nerve ratio. * = p value < 0.05.
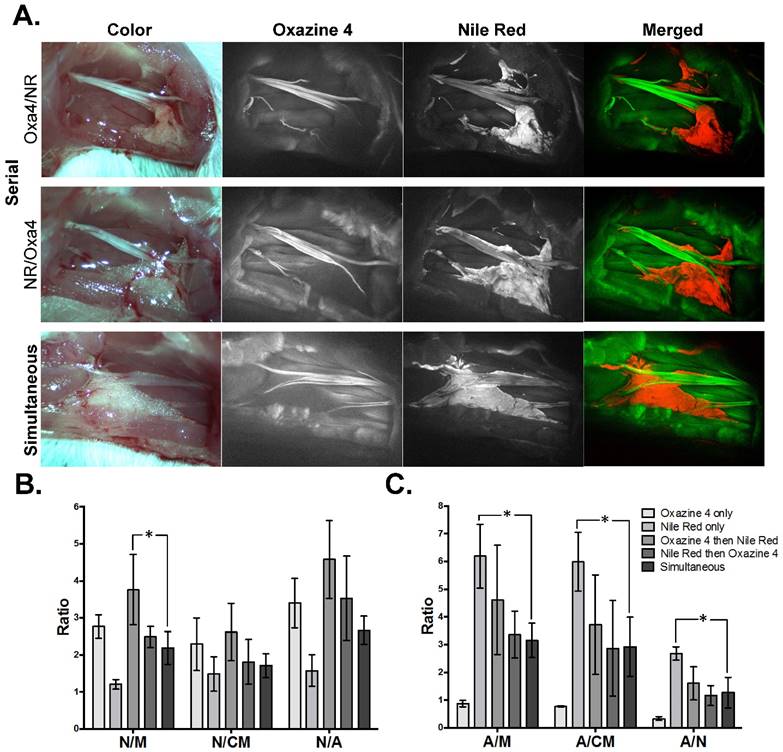
The Oxa4/NR serial stain resulted in the highest mean N/M, N/CM, and N/A ratios when compared to the NR/Oxa4 serial, simultaneous dual or individual fluorophore staining techniques, with a significantly higher N/M ratio than the simultaneous dual staining technique (p=0.023, Fig. 2B). The Oxa4/NR serial stain also resulted in the highest mean A/M, A/CM, and A/N ratios compared to the other dual fluorophore staining techniques. The Nile Red individual staining yielded the highest mean adipose to background tissue ratios, however, this was not pursued further in the current study as our goal was to provide nerve-specific contrast.
Both the Nile Red and Oxazine 4 fluorophores have relatively broad emission spectra with some overlap (Fig. S1), necessitating quantification of the degree of cross talk between the intraoperative imaging channels. The fluorescence intensities for nerve, muscle, cut muscle, and adipose tissues stained serially, simultaneously, or individually were determined using region of interest analysis throughout the staining procedure to quantify cross talk between Oxazine 4 and Nile Red using the in vivo fluorescence imaging system (Figs. S2A and S2B). Nile Red fluorescence was not detected in the Oxazine 4 imaging channel (Fig. S2A). However, staining with Oxazine 4 prior to the Nile Red incubation showed an increase in fluorescence intensity from baseline for nerve, muscle, and cut muscle tissues in the Nile Red channel (Fig. S2B). These results suggest that Oxazine 4 fluorescence was detected in the Nile Red channel, but no Nile Red fluorescence was detected in the Oxazine 4 channel. Therefore, there was no interference with the nerve specific fluorescence imaging from the addition of the adipose specific fluorophore.
To elucidate the mechanism of nerve and adipose tissue contrast following direct administration, the N/M, N/CM, N/A, A/M, A/CM, and A/N ratios were calculated after each step in the direct administration staining protocol (Figs. S2C and S2D). As previously demonstrated, the serial Oxazine 4 then Nile Red staining yielded the highest mean N/M, N/CM, and N/A ratios (Fig. S2C). This co-staining technique resulted in similar nerve tissue intensity, but lower nonspecific muscle, cut muscle, and adipose tissue intensities, than all other nerve tissue staining techniques (Fig. S2A). As expected, the Nile Red individual staining technique yielded the highest mean A/M, A/CM, and A/N ratios (Fig. S2D). Individual Nile Red staining showed similar nonspecific nerve, muscle, and cut muscle tissue intensities to all other Nile Red staining techniques, but higher adipose tissue intensity (Fig. S2B). Thus, nerve and adipose to background tissue contrast using Oxazine 4 and Nile Red were created by two different mechanisms. Oxazine 4 initially stained nerve, muscle and adipose tissue where muscle and adipose tissue fluorescence was largely removed through washing of unbound fluorophore. On the other hand, Nile Red staining created specific fluorescence in the adipose tissue with little detectable fluorescence signal in surrounding nerve and muscle tissues.
Optimal Fluorophore Incubation Time
The optimal fluorophore dose and dual fluorophore staining technique were determined using a 5-min fluorophore incubation time. In an effort to reduce the total direct administration protocol time, fluorophore incubation times of 1 and 3 min were tested (Fig. 3). The shorter incubation times of each fluorophore during the dual fluorophore tissue stain resulted in decreased nerve and adipose tissue fluorescence intensity. Since the fluorescence intensities of the background tissues did not decrease to the same extent, this led to decreased nerve (Fig. 3A) and adipose (Fig. 3B) to background tissue contrast using 1 and 3 min fluorophore incubation.
Direct administration optimal fluorophore incubation time. Representative fluorescence images for each incubation time in the (A) Oxazine 4 or (B) Nile Red channels are shown. All images are representative of data collected for n=3 nerve sites per incubation time. All images were collected after the final wash step at 2.5 ms exposure time. Images within each row labeled “Normalized” are displayed with equal contrast and brightness. The images labeled “Auto Contrast” are displayed with optimal contrast and brightness for each image to enable visualization of the nerve and adipose to background tissue contrast. (C) The nerve and (D) adipose to background tissue ratios were determined using region of interest analysis on images collected following the final wash step, presented as the mean +/- standard deviation. N/M = nerve to muscle ratio, N/CM = nerve to cut muscle ratio, N/A = nerve to adipose ratio, A/M = adipose to muscle ratio, A/CM = adipose to cut muscle ratio, A/N = adipose to nerve ratio.
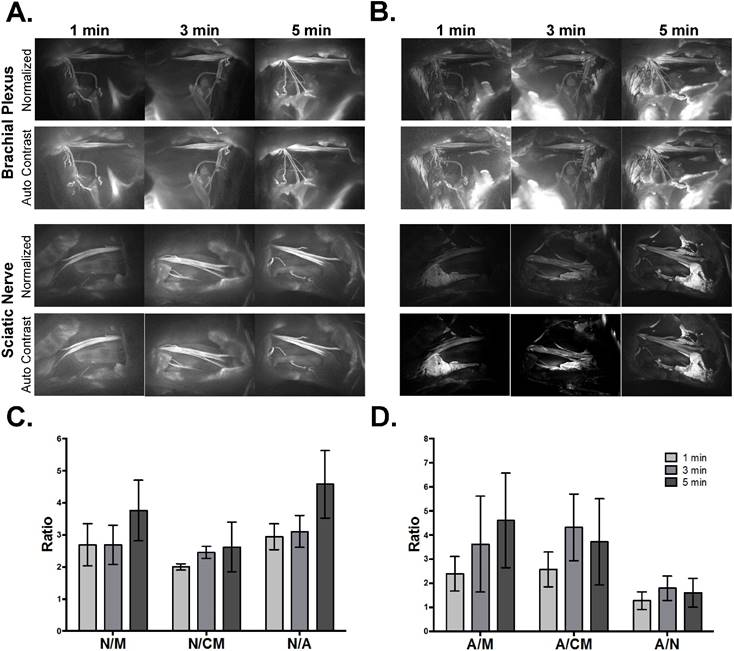
The nerve and adipose to background tissue ratios were calculated using region of interest analysis to quantify the observed contrast loss at the shorter incubation times. Decreased mean nerve and adipose to background tissue ratios were observed in all but two cases. The 3-min incubation time resulted in a slight increase in the mean A/CM ratio and A/N ratio, however these changes were not significant (Figs. 3C and 3D). Five min was selected as the optimal incubation time for direct administration since the shorter incubation times yielded lower nerve to background tissue contrast, A/M ratio, and did not provide significant improvement in the A/CM or A/N ratios.
Nonspecific Fluorophore Removal Through Optimization of Washing Technique
Generation of nerve-specific contrast following Oxazine 4 incubation was dependent on removal of unbound fluorophore from surrounding muscle and adipose tissues, highlighting the importance of an optimized washing technique. The washing method, solution composition, and duration were optimized to maximize the removal of nonspecific fluorescence in the shortest possible time for clinical feasibility. In the dose ranging, incubation time and dual fluorophore staining studies, washing was completed using 1 min incubations of washing solution on the nerve site. These “incubation washes” were completed using a 1 min incubation of a series of solutions including co-solvent formulation without fluorophore (blank co-solvent), PBS + 0.1% Triton X-100, and PBS + 0.1% Tween-20 in that order. To shorten the washing protocol, nerve site flushing was tested. The flushing technique used three short flushes of the nerve site with washing solution, instead of incubating the washing solution on the tissue (Fig. 4A). Importantly, this reduced the necessary time to perform each wash step by 50%, decreasing the time for the direct administration staining procedure by 3 min. Washing with three short flushes removed nonspecific fluorescence similarly to incubation washing, with no significant difference between the two washing types for any nerve or adipose to background tissue ratio (Fig. 4A).
Nonspecific fluorophore removal through optimization of washing technique. (A) The nerve and adipose to background tissue ratios were determined using region of interest analysis on images collected after the final wash step for incubation and flush type washes, presented as the mean +/- standard deviation. (B) Representative fluorescence images for nerve sites washed with PBS in a series of 10 flush steps are shown. All images are representative of data collected for n=3 nerve sites following completion of each fluorophore incubation and flush step. All images were collected at 2.5 ms exposure time. (C) The nerve and adipose to background tissue ratios were determined using region of interest analysis on images collected after each of 10 flush steps for all washing solutions tested, presented as the mean +/- standard deviation. N/M = nerve to muscle ratio, N/CM = nerve to cut muscle ratio, N/A = nerve to adipose ratio, A/M = adipose to muscle ratio, A/CM = adipose to cut muscle ratio, A/N = adipose to nerve ratio.
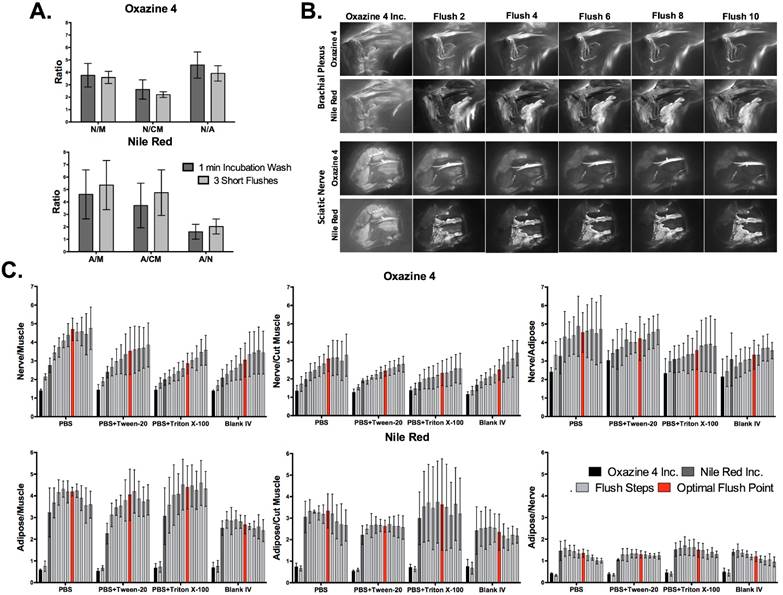
To further simplify the washing protocol, flushing with a single washing solution per nerve site was tested. PBS, PBS + 0.1% Tween-20, PBS + 0.1% Triton X-100, and blank co-solvent formulation were tested as the sole washing solution using a series of 10 flushes (Figs. 4B and S3). The detergents Tween-20 and Triton X-100 were chosen as surfactants that could potentially improve removal of non-specific fluorescence, both of which are commonly used as excipients in vaccines at concentrations up to 0.4% [62, 63]. Fluorescence images were collected following each flush step to calculate the nerve and adipose to background tissue ratios. All tested washing solutions showed a similar improvement in the nerve and adipose to background tissue ratios, with the blank co-solvent formulation yielding the lowest tissue contrast ratios and all three PBS solutions providing improved tissue contrast ratios (Fig. 4C).
PBS without any added detergents or surfactants was chosen as the ideal washing solution since it is most clinically relevant, without any potential regulatory obstacles from added solubilizers or surfactants. The images collected following each flush step were used to determine the optimal number of flush steps. Nonspecific muscle fluorescence decreased considerably after two flush steps (Figs. 4B, 4C, and S3). However, calculated nerve and adipose to background tissue ratios indicate that the N/M and N/CM ratios increased linearly up to the sixth flush step for PBS washed nerve sites. The N/A ratio reached its highest level after just two flush steps and did not decrease over the ten performed flush steps. In addition, the A/M and A/CM ratios increased within the first 2-3 flush steps and remained at peak levels through the sixth flush step, after which they decreased (Fig. 4C).
Direct Administration vs. Systemic Administration: Comparison and Assessment of Clinical Viability in Murine Models
The optimized direct administration protocol was completed using a clinically relevant scenario with the optimal fluorophore doses, dual fluorophore staining technique, incubation time, and washing methodology. Images were collected at a single time point during direct administration and the entire protocol was timed to quantify the total time required for staining and imaging. For comparison, systemic administration of Oxazine 4 and Nile Red was performed with the ideal fluorophore doses and imaging interval according to previous studies [45, 64] (Figs. 5A and 5B). The necessary exposure time to collect fluorescence images without saturation was 10 ms for the direct administration group in both the Oxazine 4 and Nile Red channels. By comparison, the exposure time to collect fluorescence images without saturation for the systemic administration group was 150 ms for Oxazine 4 and 300 ms for Nile Red. Although the fluorescence intensity was low, 10 ms exposure time images of the systemic administration groups were also collected for equal comparison with the direct administration groups and to represent images taken at video-rate exposure times. As demonstrated by the differences in exposure time, direct administration yielded higher fluorescence intensity in all cases as compared to systemic administration. The direct administration methodology highlighted finer nerve branches and smaller adipose tissue deposits than systemic administration enabling a higher level of detail to be resolved due to improved fluorophore specificity (Figs. 5A and 5B).
Direct administration vs. systemic administration: comparison and assessment of clinical viability in murine peripheral nerve models. Representative color and fluorescence images for (A) individual Oxazine 4 or (B) dual fluorophore stained nerve sites for direct and systemic administration methods are shown. All images are representative of data collected for n=4 nerve sites either 30 min following the final flush step for direct administration or 4 hrs following intravenous injection for systemic administration. (C) The nerve and adipose to background tissue ratios were determined using region of interest analysis on images collected at the same time intervals for direct and systemic administration methods. The data for the ideal exposure time graphs was determined using 10 ms exposure time images for the direct administration groups and 150 or 300 ms exposure time images for the systemic administration groups in the Oxazine 4 or Nile Red channel, respectively. The data for the video rate graphs was determined using 10 ms exposure time images only. (D) The nerve to background tissue ratios were determined following completion of the optimized direct administration protocol of Oxazine 4 individual stain. (E) The nerve and adipose to background tissue ratios were determined for the optimized direct administration dual staining technique. Quantification for the data in (D) and (E) was completed following 3 flush steps, following 6 flush steps, and every 5 min for 30 min following completion of the staining procedure. The data was determined from images collected at 10 ms. All quantified data is presented as mean +/- standard deviation. FL = fluorescence, N/M = nerve to muscle ratio, N/CM = nerve to cut muscle ratio, N/A = nerve to adipose ratio, A/M = adipose to muscle ratio, A/CM = adipose to cut muscle ratio, A/N = adipose to nerve ratio. * = p value < 0.05, ** = p value < 0.01, *** = p value < 0.001, *** = p value < 0.0001.
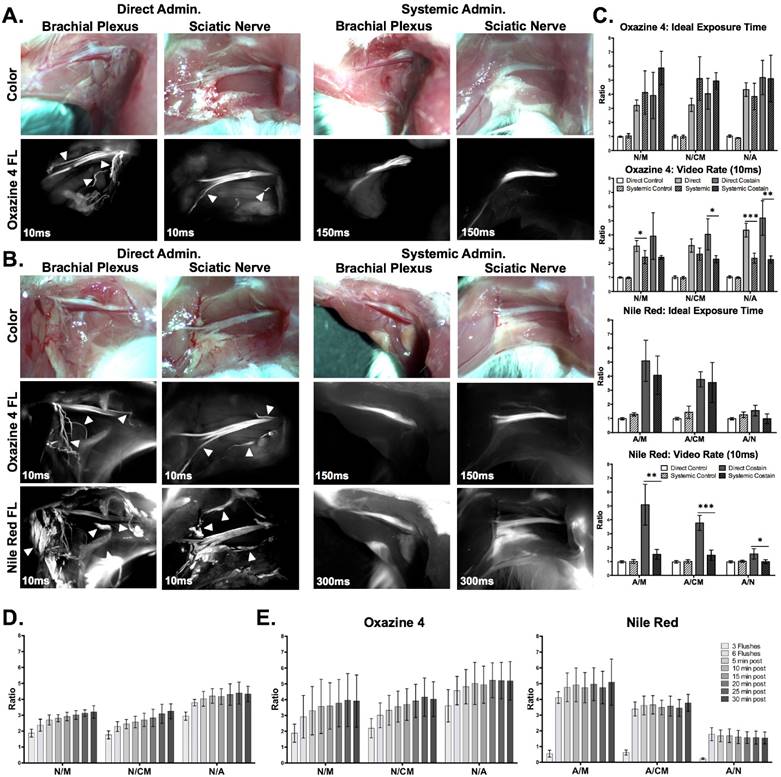
The nerve and adipose to background tissue ratios were quantified from both administration types as well as a blank co-solvent administered control group (Figs. 5C and S4). The direct (10 ms) and systemic (150 ms) Oxazine 4 administration groups both had significantly higher N/M, N/CM, and N/A ratios than the control group for both the individual stain (direct administration: p=0.0092 for N/M, p=0.0098 for N/CM, and p<0.0001 for N/A, systemic administration: p=0.0007 for N/M, p<0.0001 for N/CM, and p<0.0001 for N/A) and the dual fluorophore stain (direct administration: p=0.0074 for N/M, p<0.0001 for N/CM, and p=0.0005 for N/A, systemic administration: p=0.0001 for N/M, p<0.0001 for N/CM, and p=0.0004 for N/A). Dual fluorophore stained tissue at ideal exposure times (10 ms direct, 300 ms systemic, Nile Red channel) had significantly higher A/M and A/CM ratios than the control group in both the direct (p=0.0004 for A/M and p=0.0016 for A/CM) and systemic administration groups (p=0.0094 for A/M and p=0.0123 for A/CM). At the optimal exposure time for each administration technique, direct administration provided equivalent nerve to background tissue contrast to systemic administration in both the individual Oxazine 4 (p=0.29 for N/M, p=0.060 for N/CM, and p=0.3883 for N/A) and the dual fluorophore staining (p=0.10 for N/M, p=0.19 for N/CM, and p=0.94 for N/A) groups as no significant differences were seen (Figs. 5A and 5B). In addition, no significant difference was seen between direct and systemic Nile Red administration groups for adipose to background tissue ratios at the ideal exposure times for each administration route (p=0.35 for A/M, p=0.78 for A/CM, p=0.064 for A/N).
However, at video rate exposure time (10 ms), the direct administration group had significantly higher N/M and N/A ratios for the individual stain (p=0.042 for N/M and p=0.0006 for N/A) and significantly higher N/CM and N/A ratios for the dual fluorophore stain (p=0.021 for N/CM and p=0.0033 for N/A) than the systemic administration group (Fig. 5C). Video rate imaging of systemically administered Oxazine 4 resulted in no significant difference in N/M and N/A ratios from the control group for the dual fluorophore stain (p=0.12 for N/M and p=0.056 for N/A). Additionally, at the video rate exposure time the direct administration group had significantly higher adipose to background tissue ratios than systemic administration (p=0.0032 for A/M, p=0.0004 for A/CM, and p=0.032 for A/N) (Fig. 5C). Video rate imaging of the systemic administration group did not have significantly higher adipose to background tissue ratios than the control group (p=0.78 for A/M and p=0.29 for A/CM).
Following completion of the optimized direct administration protocol, images were collected at 5 min intervals for up to 30 min after the final wash step to quantify the nerve and adipose to background tissue ratios over time (Figs. 5D and 5E). The N/M and N/CM ratios increased steadily over the 30-min period in both the Oxazine 4 individual stain (Fig. 5D) and dual fluorophore staining groups (Fig. 5E), indicating continued clearance of nonspecific muscle uptake over time. Overall, the optimized direct administration nerve staining protocol was completed within 15 minutes, after which peak nerve contrast was maintained for up to 30 minutes. By comparison, systemic administration required 5 minutes to complete the injection and 4 hours to obtain peak nerve to background tissue contrast. In addition, direct administration required 16x less dose as well as 15x lower exposure time than systemic administration for an equivalent nerve to background tissue contrast (Table 1). Biodistribution of Oxazine 4 and Nile Red were evaluated following systemic administration. A mixture of hepatic and renal clearance was observed with significant accumulation in the bladder at the peak fluorophore administration to imaging interval of 4 hours (Fig. S5). Due to the proximity of the prostate to the bladder, this would cause significant background fluorescence that may overwhelm desired nerve-specific fluorescent signal.
Clinical viability of direct and systemic administration methods.
| Parameter | Direct Administration | Systemic Administration |
|---|---|---|
| Dose: | 4.95 μg (12.5 nmol) per nerve site | 79.17 μg (200 nmol) per mouse |
| Time to complete staining procedure: | 15 minutes | <5 minutes via IV injection |
| Time to peak fluorescence: | 20-30 minutes | 4 hours |
| Total staining time: | 15 minutes | 4 hours 5 minutes |
| Nerve to muscle ratio at ideal exposure time: | 3.211 +/- 0.390 | 4.128 +/- 1.538 |
| Nerve to muscle ratio at video rate: | 3.211 +/- 0.390 | 2.428 +/- 0.467 |
Direct Administration vs. Systemic Administration: Comparison and Assessment of Clinical Viability in Rat Autonomic Nerve Models
The optimized direct administration protocol was applied to the rat hypogastric nerve and aortic plexus, which served as surgically accessible autonomic nerves that model the composition and smaller size of the cavernous nerves as compared to the brachial plexus and sciatic nerves used for murine studies [51, 58, 59]. The rat doses of Oxazine 4 and Nile Red for both direct and systemic administration were scaled from the murine studies by body surface area equivalence [65]. Direct administration was compared to systemic administration of individual staining using Oxazine 4 alone (Fig. 6A) as well as dual fluorophore staining using both Oxazine 4 and Nile Red to highlight nerve and adipose tissue, respectively (Fig. 6B). Nerve-specific fluorescence was observed using Oxazine 4 administered either directly or systemically in the hypogastric nerve. However, only direct administration of Oxazine 4 created sufficient contrast in the aortic plexus for visualization (Figs. 6A and 6B). Direct administration of either Oxazine 4 alone or in combination with Nile Red provided equivalent N/M, A/M and A/N ratios to systemic administration (Fig. 6C). Interestingly, the N/M ratio was not significantly different from the control blank co-solvent administered group (Fig. 6C) for either the direct or systemically administered fluorophore groups. This relatively low N/M ratio resulted for different reasons in the directly and systemically administered groups. In the direct administration group, there was visible nerve-specific fluorescence and relatively high nonspecific muscle signal following Oxazine 4 staining, which decreased the overall N/M ratio. In the systemic administration group, the low N/M ratio was the result of relatively low overall signal in both the nerve and muscle tissues (Fig. 6A). This difference in fluorescence intensity between the direct and systemic administration groups was demonstrated by both the difference in exposure times (10 ms for direct vs. 150 ms for systemic administration) as well as the inability to visualize the aortic plexus, the smaller of the two stained autonomic nerve sites (Figs. 6A and 6B).
Direct administration vs. systemic administration: comparison and assessment of clinical viability in rat autonomic nerve models. Representative color and fluorescence images for (A) individual Oxazine 4 or (B) dual fluorophore stained rat hyogastric and aortic plexus nerve sites for direct and systemic administration methods are shown. All images are representative of data collected for n=4 nerve sites either 30 min following the final flush step for direct administration or 4 hrs following intravenous injection for systemic administration. (C) The nerve and adipose to background tissue ratios were determined using region of interest analysis on images collected at the same time intervals for direct and systemic administration methods. (D) The stained nerve and surrounding adipose tissue was resected along with the prostate with representative images displayed. In the Oxazine 4 fluorescence images the arrows depicts the stained hypogastric nerve, while the arrowhead shows the stained aortic plexus. All quantified data is presented as mean +/- standard deviation. FL = fluorescence, N/M = nerve to muscle ratio, N/CM = nerve to cut muscle ratio, N/A = nerve to adipose ratio, A/M = adipose to muscle ratio, A/CM = adipose to cut muscle ratio, A/N = adipose to nerve ratio. * = p value < 0.05, ** = p value < 0.01
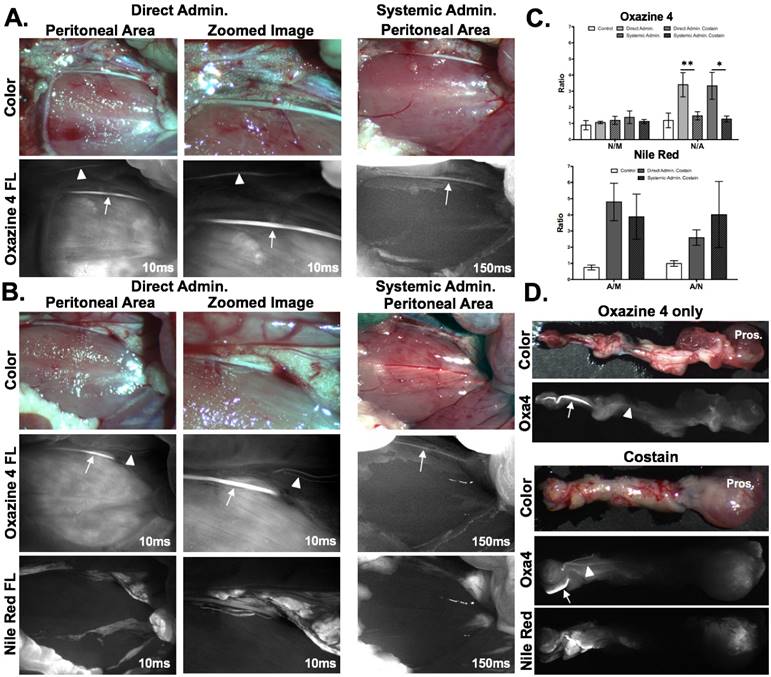
Notably, the N/A ratio was significantly higher for the direct administration group as compared to the systemic administration group (p=0.0082 for Oxazine 4 alone, p=0.014 for Oxazine 4 and Nile Red dual staining, Fig. 6C). Nerve to adipose contrast is of critical importance for visualization of the NVB during nerve sparing radical prostatectomy, since this nerve tissue is embedded in a fibrofatty plate in humans [46, 47]. The N/A ratios generated using Oxazine 4 alone or in combination with Nile Red have the potential to facilitate intraoperative NVB visualization. This was further demonstrated using the direct administration technique on the aortic plexus and hypogastric nerves, which were stained using the direct administration methodology in vivo and then resected with their surrounding tissues to show their proximity to the prostate (Fig. 6D). During radical nerve sparing prostatectomy, the tissue pedicles containing the NVB are isolated from the prostate and surrounding fascia [50], modeled by the visual isolation shown in Fig. 6D, where the hypogastric nerve as well as the smaller aortic plexuses were readily visible above any background tissue staining. Additionally, due to the size of these nerves, visualization using conventional white light illumination was challenging (Fig. 6D), similar to visualization of the NVB during prostatectomy [12, 13].
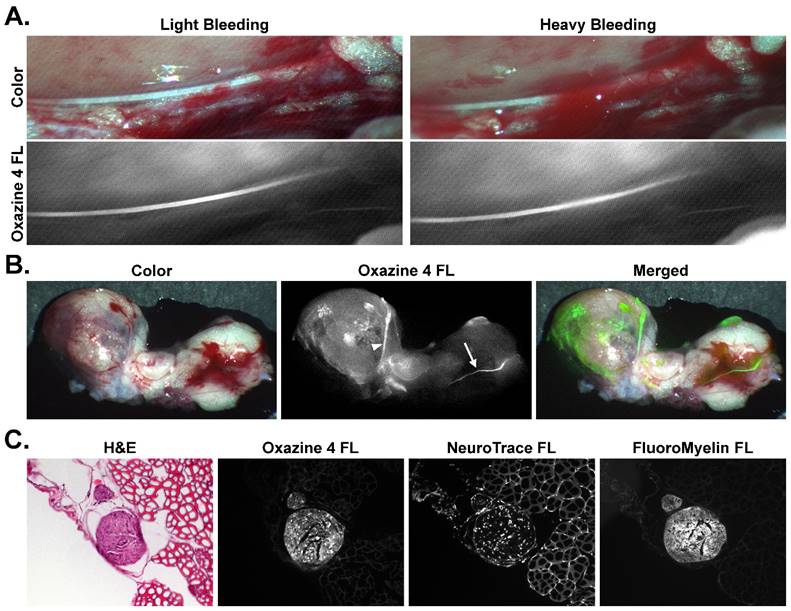
To show the utility of fluorescence image-guided surgery in a surgically relevant example of nerve-sparing prostatectomy, varying amounts of blood were placed on top of the stained hypogastric nerve tissue to simulate light and heavy bleeding that can occur during a prostatectomy procedure. Even in the presence of substantial blood cover the nerve tissue, the nerve-specific fluorescence was still clearly visible and easily discernable from the surrounding tissue (Fig. 7A). For confirmation that the direct administration methodology would highlight prostate innervation, the prostate was stained in vivo along with the hypogastric nerve and aortic plexus (Fig 7B). Upon resection and imaging, the hypogastric nerve and the nerve tissue closely associated with the prostate were clearly visible via Oxazine 4 fluorescence, although difficult to identify under white light illumination due to the nerve's small size and bleeding that had occurred in the surrounding tissue. The merged fluorescence and color image demonstrated how the fluorescence signal could be overlaid onto a color video image for rapid nerve identification intraoperatively (Fig. 7B). Histological confirmation of the hypogastric nerve tissue was performed using tissue sections of resected nerve and surrounding muscle tissue that had been stained in vivo using the direct administration methodology (Fig. 7C). H&E, NeuroTrace, and FluoroMyelin staining was used to confirm the morphology and examine the nerve specific fluorescence microscopically. NeuroTrace and FluoroMyelin are fluorescent stains specific for Nissl substance and myelin, respectively, both of which are abundant in neuronal cells. H&E staining provided clear identification of the nerve from the surrounding muscle tissue and the Oxazine 4 fluorescence signal correlated with both nerve-specific fluorescence stains, confirming the fluorophore's specificity for nerve tissue and providing histological confirmation of the hypogastric nerve.
Rat hypogastric and prostate autonomic direct administration nerve staining with bleeding and histological confirmation. (A) Color and fluorescence images for Oxazine 4 stained rat hypogastric and aortic plexus nerve sites with varying degrees of blood over the nerve tissue are shown. All images were collected 30 min following the final flush step of the direct administration procedure. (B) Color, fluorescence, and merged fluorescence images for resected rat prostate and hypogastric nerve tissue stained in vivo with Oxazine 4 are shown. The tissue was resected and imaged following euthanasia 30 min after the final flush step of the direct administration procedure. In the Oxazine 4 fluorescence images the arrows depicts the stained hypogastric nerve, while the arrowhead shows the stained prostate nerve tissue. (C) Histological confirmation of rat hypogastric nerve tissue stained in vivo by direct administration of Oxazine 4 is shown with H&E, NeuroTrace, and FluoroMyelin staining. H&E, Oxazine 4 fluorescence, and NeuroTrace/Fluoromyelin costain fluorescence images were acquired from three serial sections of rat hypogastric nerve tissue and adjacent muscle tissue. FL = fluorescence.
Discussion
The primary goal of radical prostatectomy is prostate cancer cure; however, preserving the nerves surrounding the prostate is crucial for post-surgical quality of life. Although nerve-sparing methods have been practiced for decades [7], nerve identification using current visualization and palpation techniques continues to leave patients with nerve damage following radical prostatectomy [8-11]. Fluorescence guided surgery offers a potential solution, providing the ability to enhance nerve visualization with specific contrast in real time, where several classes of small molecule fluorophores have shown nerve specificity following systemic administration in preclinical models [14, 35-45]. The prostate is highly innervated where all nerve tissue cannot be spared, but preservation of the cavernous nerves has been shown to be sufficient for maintenance of continence and potency post prostatectomy [48, 49]. Systemic administration of a nerve specific fluorophore would highlight all nerve tissue in and around the prostate leading to high background fluorescence and diminished cavernous nerve SBR, hindering the surgeon's ability to identify and visualize the vital nerve structures. Additionally, the candidate nerve-specific contrast agent used herein, Oxazine 4, shows significant renal clearance, accumulating in the urine (Fig. S5) creating increased background fluorescence for prostatectomy following systemic administration.
A direct administration methodology has been developed that allows for selective nerve labeling as a clinically viable method for enhancing visualization of the cavernous nerves during nerve sparing prostatectomy. Application of the fluorophores directly to the tissue pedicles containing the vital nerve structures would allow cavernous nerve visualization without diminishing the SBR by highlighting all nerves surrounding the prostate. This methodology overcame the non-specific binding that occurred upon direct tissue administration of fluorophores through systematic optimization of the dose, incubation and washing of Oxazine 4 fluorescence in murine model nerve tissues. The resulting nerve to background tissue contrast utilizing the optimized direct administration methodology was demonstrated to be equivalent or better than systemic administration in peripheral mouse nerves (Fig. 5) and autonomic rat nerves (Fig. 6). Further, by utilizing flush type washing and PBS as the sole washing solution, the direct administration protocol can be completed within 15 minutes, making it viable for nerve sparing prostatectomy and compatible with current clinical methodology (Fig. 4 and Table 1). Direct administration of Oxazine 4 would provide peak nerve contrast for the entirety of the nerve sparing procedure, with nerve to background tissue ratios increasing for up to 30 min following completion of the staining procedure due to clearance of nonspecific fluorophore from surrounding muscle and adipose tissues (Figs. 5D and 5E).
A significantly lower Oxazine 4 dose was required to provide equivalent nerve contrast using the direct administration methodology as compared to systemic administration (Figs. 5 and 6), where lower doses decreased the nonspecific tissue fluorescence and improved nerve to background tissue ratios (Fig. 1). Overall, direct administration required 16x less dose at 4.95 μg/nerve site as compared to 79.2 μg for systemic administration in murine models (Table 1). Even the use of two doses of Oxazine 4 to highlight both cavernous nerves during a nerve-sparing prostatectomy would still result in an 8x lower dose to the patient than systemic administration. This drastic decrease in the required dose has the potential to facilitate clinical translation of nerve-specific fluorophores. Systemic toxicity would be minimized using the direct administration methodology, posing less concern for blood nerve and blood brain barrier fluorophore penetration and accumulation. When the selected Oxazine 4 dose was scaled from mouse to humans by body surface area [60], the resulting 59.38 μg direct administration dose falls within the Food and Drug Administration (FDA) “microdose” range (≤100 μg), allowing for clinical studies to be performed under exploratory investigational new drug (IND) guidelines without prior clinical safety studies [65], a significant financial consideration for any agent administered in clinical trials.
Another key benefit of direct administration over systemic administration was the order of magnitude increase in fluorescence signal intensity observed, where nerve fluorescence was readily visualized with 10 ms exposure times following direct administration in both murine and rat models. This provided average nerve tissue fluorescence intensity 8x greater than systemic administration, which required at least 150 ms for visualization. Subsequently, direct administration afforded significantly higher nerve to background tissue ratios than systemic administration at video rate exposure times (Figs. 5 and 6). The required exposure time following systemic administration was ~3x times that of video rate refresh rate, resulting in either increased time for the nerve-sparing procedure or lack of adoption due to inability to be seamlessly integrated into existing surgical workflow. Direct administration also enabled visualization of finer nerve branches and smaller adipose deposits than systemic administration (Figs. 5 and 6). Direct administration could thus enhance visibility of the delicate structures associated with the cavernous nerve for a more complete nerve sparing procedure.
Since the NVB is embedded in fatty tissue [46, 47] and many nerve specific small molecule fluorophores have been plagued with non-specific adipose accumulation due to the molecular lipophilicity [14, 37, 39, 40], we developed a dual fluorophore staining method using spectrally-distinct, adipose and nerve-specific fluorophores. Nile Red, which emits orange fluorescence, was chosen as the adipose specific fluorophore for its strong adipose specificity and spectral separation from Oxazine 4 [52-56]. Co-staining tissue with both fluorophores enabled image post processing to improve the N/A contrast (Fig. 2). Such image processing could be performed in real time to provide enhanced tissue separation intraoperatively using clinically available fluorescence imaging systems with dual color functionality, such as the FLARE imaging system [14-18]. Interestingly, the optimal dual fluorophore tissue staining method provided higher nerve to background tissue ratios than Oxazine 4 staining alone (Fig. 2), where nerve tissue contrast was highest when a serial co-staining technique was used beginning with Oxazine 4 followed by Nile Red. This co-stain technique would be ideal for clinical nerve-specific visualization because in addition to providing the highest nerve and adipose contrast, it facilitates application of nerve specific contrast first to assess if dual fluorophore tissue staining would be necessary prior to application of the adipose specific fluorophore. The improvement in the nerve to background tissue contrast with the dual fluorophore staining techniques was a result of incubation with co-solvent formulation containing Nile Red, which removed nonspecific Oxazine 4 fluorophore effectively lowering background fluorescence. Therefore, utilization of the dual fluorophore staining method did not lengthen the direct administration procedure, as the Nile Red incubation served to both stain the adipose tissue and remove non-specific Oxazine 4 fluorescence (Figs. 5D and 5E). Similar to Oxazine 4 direct administration, Nile Red direct administration required a much lower dose than systemic administration to obtain equivalent adipose to background tissue contrast, while yielding a higher intensity signal and more detailed adipose tissue fluorescence images (Fig. 5B).
Tissue-specific fluorescence intensity was measured in the Nile Red and Oxazine 4 channels following individual and dual fluorophore tissue staining to confirm that Nile Red fluorescence was spectrally separated from Oxazine 4 fluorescence in vivo. (Fig. S2). While Oxazine 4 fluorescence showed some cross talk into the Nile Red fluorescence channel, Nile Red fluorescence did not cross talk into the Oxazine 4 fluorescence channel and thus did not affect the nerve to background tissue contrast. Therefore, Nile Red was not only compatible with Oxazine 4 for nerve and adipose differentiation, but would also have utility as an adipose tissue counterstain for use in dual fluorophore staining with a further red shifted or NIR nerve-specific fluorophore. Of note, the mechanisms for nerve and adipose tissue contrast generation using Oxazine 4 and Nile Red respectively were distinct. Oxazine 4 nerve contrast was increased by the removal of non-specific tissue fluorescence through adequate washing, while Nile Red adipose contrast was increased by obtaining the highest adipose specific accumulation of the fluorophore, requiring less washing to obtain optimal adipose staining (Fig. S2). These observations support the selected ideal Oxa4/NR serial dual staining strategy, where Oxazine 4 staining was enhanced by incubation with Nile Red in co-solvent, while Nile Red adipose-specific fluorescence required less washing. The difference in nonspecific tissue fluorescence between the two fluorophores can likely be attributed to the fluorogenic properties of Nile Red. Nile Red is quenched in a primarily aqueous environment and brightly fluorescent in hydrophobic, lipid rich environments, making lipid poor tissue such as muscle have inherently low Nile Red fluorescence signal, reducing the need to remove nonspecific Nile Red accumulation through washing [54].
The optimized direct administration method using Oxazine 4 alone and in combination with Nile Red was scaled to rat imaging studies to facilitate imaging of surgically available autonomic nerves that were in close anatomical proximity to the prostate with similar composition to the cavernous nerves [51, 58, 66]. The aortic plexus and hypogastric nerves were selected for direct administration studies where the hypogastric nerves were larger and more easily visualized than the aortic plexuses. Direct and systemic administration were compared using the optimized dose scaled by body surface area from murine studies. The N/M, A/M, and A/N ratios were found to be equivalent for the direct and systemically administered groups. The N/A ratios were significantly higher for direct administration as compared to systemic administration groups (Fig. 6). Unlike the murine nerve imaging studies, the N/M ratio in the rat studies was similar to control, no fluorophore administered animals. However, when the images were examined significant nerve fluorescence was visible in the rat autonomic nerves (Figs. 6A and 6B). The low N/M ratio likely stemmed from increased muscle background fluorescence in the peritoneal area for the direct administration group, while in the systemic administration group overall fluorescence signal was low in the nerve resulting in low N/M ratio. The increase in background muscle fluorescence was unexpected and additional formulation strategies are being investigated to decrease nonspecific accumulation in muscle tissue. The utility of the direct administration method for radical nerve-sparing prostatectomy was highlighted by the N/A ratio which is vital to the success of this technique since the NVB is embedded in adipose tissue. Additionally, during radical nerve-sparing prostatectomy tissue pedicles containing the NVB are isolated from the prostate, which largely contain adipose tissue. Direct administration of nerve contrast to these tissue pedicles has the potential to provide the desired contrast to specifically illuminate the cavernous nerves. This possibility was highlighted by resecting the stained autonomic nerves along with the rat prostate where white light visualization of these small nerve structures was difficult, but fluorescence imaging readily detected both the hypogastric nerve as well as the much smaller aortic plexus (Fig. 6D). Further, direct innervation of the prostate was readily visible alongside hypogastric nerve fluorescence in prostate tissue stained via direct administration (Fig. 7B). Microscopic evaluation of hypogastric nerve tissue stained via direct administration in vivo provided histological confirmation for the nerve specific fluorescence signal (Fig. 7C). Importantly, Oxazine 4 signal showed positive correlation with other ex vivo nerve specific fluorescence stains including FluoroMyelin and NeuroTrace. The possibility to highlight nerve structures intraoperatively using the direct administration methodology was further demonstrated by visualizing nerve specific fluorescence signal through varying amounts of blood (Fig. 7A). Although monitored closely, heavy bleeding can occur during a prostatectomy procedure [67], which can interfere with visible fluorescence signals because of hemoglobin's light absorption characteristics [34]. However, the absorption and emission of Oxazine 4 are sufficiently red shifted negating any effect on fluorescence intensity in the presence of blood. Additional fluorophore development of NIR nerve-specific fluorophores would further negate any fluorescence changes in the presence of blood during surgery.
The characterized and validated direct administration methodology provided selective nerve highlighting for fluorescence-guided nerve sparing prostatectomy, with at least equivalent contrast to the previously utilized systemic administration method while yielding a significantly higher intensity signal at an order of magnitude lower dose. In addition, the dual fluorophore staining technique developed here sets the stage for improving nerve specific contrast with spectrally distinct targeted background tissue fluorescence. Further studies are underway to translate these findings towards clinical trials including tissue depth penetration studies following direct fluorophore administration and the utility of improved formulation strategies to diminish background fluorophore uptake such as micellar encapsulation, which has demonstrated improved nerve-specificity in systemically administered models [61]. Direct administration of nerve-specific contrast has the potential to improve nerve identification and visualization during radical nerve-sparing prostatectomy through specific labeling of the vital nerve structures in a highly-innervated organ. Of specific note, the validated direct administration methodology falls within the microdosing range facilitating clinical trials through an eIND, something not possible using systemically administered nerve contrast. The developed direct administration strategy could also highlight vital nervous structures in a variety of other surgical procedures such as retroperitoneal lymph node dissection for testicular cancer, radical pelvic gastrointestinal or gynecologic surgery, and radial neck dissection, potentially improving post-surgical quality of life for numerous surgically treated diseases.
Acknowledgements
We would like to thank Meaghan McCoy for experimental assistance and Dr. Theresa Koppie for insightful discussions. This study was supported by grants from the Oregon Clinical and Translational Research Institute and the National Institute of Biomedical Imaging and Bioengineering (#K01-EB-010201, SLG).
Supplementary Material
Supplementary figures.
Competing Interests
The authors have declared that no competing interest exists.
References
1. Siegel R, Ma J, Zou Z, Jemal A. Cancer statistics, 2014. CA: a cancer journal for clinicians. 2014;64:9-29
2. Jacobs BL, Zhang Y, Schroeck FR, Skolarus TA, Wei JT, Montie JE. et al. Use of advanced treatment technologies among men at low risk of dying from prostate cancer. Jama. 2013;309:2587-95
3. Bill-Axelson A, Holmberg L, Garmo H, Rider JR, Taari K, Busch C. et al. Radical prostatectomy or watchful waiting in early prostate cancer. The New England journal of medicine. 2014;370:932-42
4. Abdollah F, Schmitges J, Sun M, Jeldres C, Tian Z, Briganti A. et al. Comparison of mortality outcomes after radical prostatectomy versus radiotherapy in patients with localized prostate cancer: a population-based analysis. International journal of urology: official journal of the Japanese Urological Association. 2012;19:836-44
5. Sooriakumaran P, Nyberg T, Akre O, Haendler L, Heus I, Olsson M. et al. Comparative effectiveness of radical prostatectomy and radiotherapy in prostate cancer: observational study of mortality outcomes. Bmj. 2014;348:g1502
6. Hoffman RM, Koyama T, Fan KH, Albertsen PC, Barry MJ, Goodman M. et al. Mortality after radical prostatectomy or external beam radiotherapy for localized prostate cancer. Journal of the National Cancer Institute. 2013;105:711-8
7. Walsh PC, Donker PJ. Impotence following radical prostatectomy: insight into etiology and prevention. The Journal of urology. 1982;128:492-7
8. Ficarra V, Novara G, Ahlering TE, Costello A, Eastham JA, Graefen M. et al. Systematic review and meta-analysis of studies reporting potency rates after robot-assisted radical prostatectomy. European urology. 2012;62:418-30
9. Ghavamian R, Knoll A, Boczko J, Melman A. Comparison of operative and functional outcomes of laparoscopic radical prostatectomy and radical retropubic prostatectomy: single surgeon experience. Urology. 2006;67:1241-6
10. Ficarra V, Novara G, Rosen RC, Artibani W, Carroll PR, Costello A. et al. Systematic review and meta-analysis of studies reporting urinary continence recovery after robot-assisted radical prostatectomy. Eur Urol. 2012;62:405-17
11. Damber JE, Khatami A. Surgical treatment of localized prostate cancer. Acta Oncol. 2005;44:599-604
12. Tewari A, Peabody JO, Fischer M, Sarle R, Vallancien G, Delmas V. et al. An Operative and Anatomic Study to Help in Nerve Sparing during Laparoscopic and Robotic Radical Prostatectomy. European Urology. 2003;43:444-54
13. Walz J, Graefen M, Huland H. Basic principles of anatomy for optimal surgical treatment of prostate cancer. World journal of urology. 2007;25:31-8
14. Gibbs-Strauss SL, Nasr KA, Fish KM, Khullar O, Ashitate Y, Siclovan TM. et al. Nerve-highlighting fluorescent contrast agents for image-guided surgery. Molecular imaging. 2011;10:91-101
15. Gioux S, Choi HS, Frangioni JV. Image-guided surgery using invisible near-infrared light: fundamentals of clinical translation. Molecular imaging. 2010;9:237-55
16. Lee BT, Hutteman M, Gioux S, Stockdale A, Lin SJ, Ngo LH. et al. The FLARE intraoperative near-infrared fluorescence imaging system: a first-in-human clinical trial in perforator flap breast reconstruction. Plastic and reconstructive surgery. 2010;126:1472-81
17. Troyan SL, Kianzad V, Gibbs-Strauss SL, Gioux S, Matsui A, Oketokoun R. et al. The FLARE intraoperative near-infrared fluorescence imaging system: a first-in-human clinical trial in breast cancer sentinel lymph node mapping. Annals of surgical oncology. 2009;16:2943-52
18. Vahrmeijer AL, Hutteman M, van der Vorst JR, van de Velde CJ, Frangioni JV. Image-guided cancer surgery using near-infrared fluorescence. Nature reviews Clinical oncology. 2013;10:507-18
19. Lopez A, Zlatev DV, Mach KE, Bui D, Liu JJ, Rouse RV. et al. Intraoperative Optical Biopsy during Robotic Assisted Radical Prostatectomy Using Confocal Endomicroscopy. The Journal of urology. 2016;195:1110-7
20. Boyette LB, Reardon MA, Mirelman AJ, Kirkley TD, Lysiak JJ, Tuttle JB. et al. Fiberoptic imaging of cavernous nerves in vivo. The Journal of urology. 2007;178:2694-700
21. Rais-Bahrami S, Levinson AW, Fried NM, Lagoda GA, Hristov A, Chuang Y. et al. Optical coherence tomography of cavernous nerves: a step toward real-time intraoperative imaging during nerve-sparing radical prostatectomy. Urology. 2008;72:198-204
22. Aron M, Kaouk JH, Hegarty NJ, Colombo JR Jr, Haber GP, Chung BI. et al. Second prize: preliminary experience with the Niris optical coherence tomography system during laparoscopic and robotic prostatectomy. J Endourol. 2007;21:814-8
23. Tozburun S, Hutchens TC, McClain MA, Lagoda GA, Burnett AL, Fried NM. Temperature-controlled optical stimulation of the rat prostate cavernous nerves. Journal of biomedical optics. 2013;18:067001
24. Tozburun S, Lagoda GA, Burnett AL, Fried NM. Continuous-wave laser stimulation of the rat prostate cavernous nerves using a compact and inexpensive all single mode optical fiber system. J Endourol. 2011;25:1727-31
25. Tozburun S, Stahl CD, Hutchens TC, Lagoda GA, Burnett AL, Fried NM. Continuous-wave infrared subsurface optical stimulation of the rat prostate cavernous nerves using a 1490-nm diode laser. Urology. 2013;82:969-73
26. Tozburun S, Lagoda GA, Burnett AL, Fried NM. Subsurface near-infrared laser stimulation of the periprostatic cavernous nerves. J Biophotonics. 2012;5:793-800
27. Tummers QR, Verbeek FP, Schaafsma BE, Boonstra MC, van der Vorst JR, Liefers GJ. et al. Real-time intraoperative detection of breast cancer using near-infrared fluorescence imaging and Methylene Blue. European journal of surgical oncology: the journal of the European Society of Surgical Oncology and the British Association of Surgical Oncology. 2014;40:850-8
28. Ashitate Y, Stockdale A, Choi HS, Laurence RG, Frangioni JV. Real-time simultaneous near-infrared fluorescence imaging of bile duct and arterial anatomy. The Journal of surgical research. 2012;176:7-13
29. Verbeek FP, van der Vorst JR, Schaafsma BE, Swijnenburg RJ, Gaarenstroom KN, Elzevier HW. et al. Intraoperative near infrared fluorescence guided identification of the ureters using low dose methylene blue: a first in human experience. The Journal of urology. 2013;190:574-9
30. Hirche C, Engel H, Kolios L, Cognie J, Hunerbein M, Lehnhardt M. et al. An experimental study to evaluate the Fluobeam 800 imaging system for fluorescence-guided lymphatic imaging and sentinel node biopsy. Surgical innovation. 2013;20:516-23
31. Gotoh K, Yamada T, Ishikawa O, Takahashi H, Eguchi H, Yano M. et al. A novel image-guided surgery of hepatocellular carcinoma by indocyanine green fluorescence imaging navigation. Journal of surgical oncology. 2009;100:75-9
32. Kitagawa H, Namikawa T, Munekage M, Akimori T, Kobayashi M, Hanazaki K. Visualization of the Stomach's Arterial Networks During Esophageal Surgery Using the HyperEye Medical System. Anticancer research. 2015;35:6201-5
33. Gibbs SL. Near infrared fluorescence for image-guided surgery. Quantitative imaging in medicine and surgery. 2012;2:177-87
34. Chance B. Near-infrared images using continuous, phase-modulated, and pulsed light with quantitation of blood and blood oxygenation. Annals of the New York Academy of Sciences. 1998;838:29-45
35. Wu C, Wei J, Tian D, Feng Y, Miller RH, Wang Y. Molecular probes for imaging myelinated white matter in CNS. Journal of medicinal chemistry. 2008;51:6682-8
36. Wang C, Popescu DC, Wu C, Zhu J, Macklin W, Wang Y. In situ fluorescence imaging of myelination. The journal of histochemistry and cytochemistry: official journal of the Histochemistry Society. 2010;58:611-21
37. Gibbs SL, Xie Y, Goodwill HL, Nasr KA, Ashitate Y, Madigan VJ. et al. Structure-activity relationship of nerve-highlighting fluorophores. PloS one. 2013;8:e73493
38. Stankoff B, Wang Y, Bottlaender M, Aigrot MS, Dolle F, Wu C. et al. Imaging of CNS myelin by positron-emission tomography. Proceedings of the National Academy of Sciences of the United States of America. 2006;103:9304-9
39. Cotero VE, Siclovan T, Zhang R, Carter RL, Bajaj A, LaPlante NE. et al. Intraoperative fluorescence imaging of peripheral and central nerves through a myelin-selective contrast agent. Molecular imaging and biology: MIB: the official publication of the Academy of Molecular Imaging. 2012;14:708-17
40. Cotero VE, Kimm SY, Siclovan TM, Zhang R, Kim EM, Matsumoto K. et al. Improved Intraoperative Visualization of Nerves through a Myelin-Binding Fluorophore and Dual-Mode Laparoscopic Imaging. PloS one. 2015;10:e0130276
41. Bajaj A, LaPlante NE, Cotero VE, Fish KM, Bjerke RM, Siclovan T. et al. Identification of the protein target of myelin-binding ligands by immunohistochemistry and biochemical analyses. The journal of histochemistry and cytochemistry: official journal of the Histochemistry Society. 2013;61:19-30
42. Gibbs-Strauss SL, Vooght C, Fish KM, Nasr KA, Siclovan TM, Barnhardt NE. et al. Molecular imaging agents specific for the annulus fibrosus of the intervertebral disk. Molecular imaging. 2010;9:128-40
43. Meyers JR, MacDonald RB, Duggan A, Lenzi D, Standaert DG, Corwin JT. et al. Lighting up the senses: FM1-43 loading of sensory cells through nonselective ion channels. The Journal of neuroscience: the official journal of the Society for Neuroscience. 2003;23:4054-65
44. Wang C, Wu C, Popescu DC, Zhu J, Macklin WB, Miller RH. et al. Longitudinal near-infrared imaging of myelination. The Journal of neuroscience: the official journal of the Society for Neuroscience. 2011;31:2382-90
45. Park MH, Hyun H, Ashitate Y, Wada H, Park G, Lee JH. et al. Prototype nerve-specific near-infrared fluorophores. Theranostics. 2014;4:823-33
46. Walz J, Burnett AL, Costello AJ, Eastham JA, Graefen M, Guillonneau B. et al. A critical analysis of the current knowledge of surgical anatomy related to optimization of cancer control and preservation of continence and erection in candidates for radical prostatectomy. Eur Urol. 2010;57:179-92
47. Walz J, Epstein JI, Ganzer R, Graefen M, Guazzoni G, Kaouk J. et al. A Critical Analysis of the Current Knowledge of Surgical Anatomy of the Prostate Related to Optimisation of Cancer Control and Preservation of Continence and Erection in Candidates for Radical Prostatectomy: An Update. Eur Urol. 2016;70:301-11
48. Tewari A, Takenaka A, Mtui E, Horninger W, Peschel R, Bartsch G. et al. The proximal neurovascular plate and the tri-zonal neural architecture around the prostate gland: importance in the athermal robotic technique of nerve-sparing prostatectomy. BJU international. 2006;98:314-23
49. Patel VR, Schatloff O, Chauhan S, Sivaraman A, Valero R, Coelho RF. et al. The role of the prostatic vasculature as a landmark for nerve sparing during robot-assisted radical prostatectomy. European urology. 2012;61:571-6
50. Stolzenburg JU, Do M, Rabenalt R, Pfeiffer H, Horn L, Truss MC. et al. Endoscopic extraperitoneal radical prostatectomy: initial experience after 70 procedures. The Journal of urology. 2003;169:2066-71
51. Costello AJ, Brooks M, Cole OJ. Anatomical studies of the neurovascular bundle and cavernosal nerves. BJU international. 2004;94:1071-6
52. Bonilla E, Prelle A. Application of nile blue and nile red, two fluorescent probes, for detection of lipid droplets in human skeletal muscle. Journal of Histochemistry & Cytochemistry. 1987;35:619-21
53. Fowler SD, Greenspan P. Application of Nile red, a fluorescent hydrophobic probe, for the detection of neutral lipid deposits in tissue sections: comparison with oil red O. The journal of histochemistry and cytochemistry: official journal of the Histochemistry Society. 1985;33:833-6
54. Greenspan P, Fowler SD. Spectrofluorometric studies of the lipid probe, nile red. Journal of lipid research. 1985;26:781-9
55. Greenspan P, Mayer EP, Fowler SD. Nile red: a selective fluorescent stain for intracellular lipid droplets. The Journal of cell biology. 1985;100:965-73
56. Maeder U, Marquardt K, Beer S, Bergmann T, Schmidts T, Heverhagen JT. et al. Evaluation and quantification of spectral information in tissue by confocal microscopy. Journal of biomedical optics. 2012;17:106011
57. Schneider CA, Rasband WS, Eliceiri KW. NIH Image to ImageJ: 25 years of image analysis. Nat Methods. 2012;9:671-5
58. Kim SW, Lee SH, Paick JS. In vivo rat model to measure hypogastric nerve stimulation-induced seminal vesicle and vasal pressure responses simultaneously. Int J Impot Res. 2004;16:427-32
59. Diaz R, Garcia LI, Locia J, Silva M, Rodriguez S, Perez CA. et al. Histological modifications of the rat prostate following transection of somatic and autonomic nerves. Anais da Academia Brasileira de Ciências. 2010;82:397-404
60. Guidance for Industry. Estimating the Maximum Safe Starting Dose in Initial Clinical Trials for Therapeutics in Adult Healthy Volunteers In: US Department of Health and Human Services FaDA, Center for Drug Evaluation and Research, editor. Washington DC, USA. 2005
61. Hackman KM, Doddapaneni BS, Barth CW, Wierzbicki IH, Alani AW, Gibbs SL. Polymeric Micelles as Carriers for Nerve-Highlighting Fluorescent Probe Delivery. Molecular pharmaceutics. 2015
62. Pasteur S. Fluzone® Prescribing Information. 2015.
63. Nema SL, John D. Pharmaceutical Dosage Forms - Parenteral Medications, Third Edition: Volume 3: Regulations, Validation and the Future. 119 Farringdon Road, London EC1R 3DA, UK: Informa Healthcare. 2010
64. Choi HS, Gibbs SL, Lee JH, Kim SH, Ashitate Y, Liu F. et al. Targeted zwitterionic near-infrared fluorophores for improved optical imaging. Nature biotechnology. 2013;31:148-53
65. US Department of Health, Human Services FaDA, Center for Drug Evaluation, Research. Guidance for Industry, Investigators, and Reviewers. Exploratory IND Studies. Washington DC, USA. 2006
66. Diaz R, Garcia LI, Locia J, Silva M, Rodriguez S, Perez CA. et al. Histological modifications of the rat prostate following transection of somatic and autonomic nerves. An Acad Bras Cienc. 2010;82:397-404
67. Liatsikos E, Rabenalt R, Burchardt M, Backhaus MR, Do M, Dietel A. et al. Prevention and management of perioperative complications in laparoscopic and endoscopic radical prostatectomy. World journal of urology. 2008;26:571-80
Author contact
![]() Corresponding author: Summer L. Gibbs, Ph.D. Oregon Health & Science University, Collaborative Life Sciences Building, 2730 SW Moody Ave, Mail Code: CL3SG, Portland, OR 97201. Email: gibbssedu, Phone: 503-494-8940.
Corresponding author: Summer L. Gibbs, Ph.D. Oregon Health & Science University, Collaborative Life Sciences Building, 2730 SW Moody Ave, Mail Code: CL3SG, Portland, OR 97201. Email: gibbssedu, Phone: 503-494-8940.