Impact Factor
- Issue 14; 2026
- Issue 13; 2026
- Issue 12; 2026
- Issue 11; 2026
- Issue 10; 2026
- Volume 16; 2026
- Advance Articles
- Past Issues
- Cover Images
- Cover Suggestion
- Index & Coverage
- Special Issues
Introduction
Results and Discussion
Conclusions
Materials and Methods
Supplementary Material
Acknowledgements
References
International Journal of Biological Sciences
International Journal of Medical Sciences
 Global reach, higher impact

Theranostics 2017; 7(3):677-693. doi:10.7150/thno.16357 This issue Cite
Research Paper
Targeting and Regulating of an Oncogene via Nanovector Delivery of MicroRNA using Patient-Derived Xenografts
Shuyang Sun1,2*, Yilong Wang3*, Rong Zhou1,2, Zicheng Deng3,4, Yong Han1,2, Xiao Han3,4, Wenjie Tao1,2, Zi Yang3,4, Chaoji Shi1,2, Duo Hong1,2, Jiang Li2,5, Donglu Shi3,6 ![]() , Zhiyuan Zhang1,2
, Zhiyuan Zhang1,2 ![]()
1. Department of Oral and Maxillofacial-Head Neck Oncology, Ninth People's Hospital, Shanghai Jiao Tong University, School of Medicine, Shanghai 200011, P. R. China;
2. Shanghai Key Laboratory of Stomatology, Shanghai 200011, P. R. China;
3. The Institute for Translational Nanomedicine, Shanghai East Hospital, the Institute for Biomedical Engineering & Nano Science, Tongji University School of Medicine, Shanghai 200092, P. R. China;
4. School of Materials Science and Engineering, Tongji University, Shanghai 200092, P. R. China;
5. Department of Oral Pathology, Ninth People's Hospital, Shanghai Jiao Tong University, School of Medicine, Shanghai 200011, P. R. China.
6. The Materials Science and Engineering Program, College of Engineering and Applied Science, University of Cincinnati, Cincinnati, OH 45221, USA.
* These authors contributed equally.
Received 2016-6-1; Accepted 2016-12-18; Published 2017-1-15
Abstract

In precision cancer nanomedicine, the key is to identify the oncogenes that are responsible for tumorigenesis, based on which these genetic drivers can be each specifically regulated by a nanovector-directed, oncogene-targeted microRNA (miRNA) for tumor suppression. Fibroblast Growth Factor Receptor 3 (FGFR3) is such an oncogene. The molecular tumor-subtype harboring FGFR3 genomic alteration has been identified via genomic sequencing and referred to as the FGFR3-driven tumors. This genomics-based tumor classification provides further rationale for the development of the FGFR3-targeted miRNA replacement therapy in treating patients with FGFR3 gene abnormity. However, successful miRNA therapy has been hampered by lacking of an efficient delivery vehicle. In this study, a nanovector is developed for microRNA-100 (miR-100) -mediated FGFR3 regulation. The nanovector is composed of the mesoporous magnetic clusters that are conjugated with ternary polymers for efficient miRNA in-vivo delivery. The miRNA-loading capacity of the nanovector is found to be high due to the polycation polymer functionalized mesoporous structure, showing excellent tumor cell transfection and pH-sensitive miRNA release. Delivery of miR-100 to cancer cells effectively down-regulates the expression of FGFR3, inhibits cell proliferation, and induces cell apoptosis in vitro. Patient-derived xenografts (PDXs) are used to evaluate the efficacy of miRNA delivery in the FGFR3-driven tumors. Notably, sharp contrasts are observed between the FGFR3-driven tumors and those without FGFR3 genomic alteration. Only the FGFR3-driven PDXs are significantly inhibited via miR-100 delivery while the non-FGFR3-driven PDXs are not affected, showing promise of precision cancer nanomedicine.
Keywords: mesoporous nanovector, oncogene, microRNA, Patient-Derived Xenografts, precision medicine.
Introduction
In cancer therapy, there has been an increasing need to utilize the genomics data in clinical oncology for the so-called precision medicine [1]. The integration of genomics information into clinical treatment has led to a new classification of cancer which is therapeutically more relevantly based on molecular characteristics of cancers rather than traditional anatomic and histological criteria [2]. In this fashion, cancers, as the genomic disease caused by a diverse genomic alteration of oncogenes, can be classified by their signature oncogenes based on which the treatment can be tailored to individual patients. In the frame work of genomics-driven medicine, tumor suppressors can be specifically developed that predominately target these oncogenes.
Fibroblast Growth Factor Receptor 3 (FGFR3) has been characterized as an oncogenic driver, and the molecular tumor-subtype harboring FGFR3 genomic alteration is, accordingly, defined as the FGFR3-driven tumors [3-5]. Although the FGFR3-targeted strategies are the keys in treating the cancer patients with FGFR3 gene abnormity, great challenges lie within developing the specific therapeutics in precision medicine [6, 7]. MicroRNA-100 (miR-100) is known for inhibition of the key target gene FGFR3. Based on the aberrantly expressed miRNAs, the so-called "miRNA replacement therapy" has been developed by regulating its gain or loss of function in cancer [8-11]. This significant progress in miRNA-based therapeutics enables the development of the FGFR3-targeted miRNA in treating patients with FGFR3 gene abnormity; however, successful miRNA replacement therapy is hampered by lacking of an effective delivery system for a specific target gene in precision cancer therapy.
The key is therefore to develop a nanovector for efficient miRNA delivery that predominately targets FGFR3 for the FGFR3-driven tumors. Viral vectors have been employed to enable stable inhibition of gene expression, but their systemic toxicity and immunogenicity have posted considerable concerns [12]. Recently, nanometer-scale systems such as cationic lipids, polymeric materials [13, 14], polycation polymer-based carriers [15-17], and inorganic nanoparticles [18, 19], with specific size, shape, structure, and surface functionality, have been developed to deliver miRNA for cancer therapy. Among them, the PEI-functionalized inorganic mesoporous nanovectors demonstrated several advantages over their polymeric counterparts: straightforward surface modification, long-term structural stability, and high gene payload in pores [20]. However, to utilize the mesoporous silica for efficient gene carrying, complicated procedures are needed to expand the pore size [21]. Furthermore, toxic reagents are required in order to graft low molecular PEI inside the pores [22]. It is, therefore, important to develop an ideal nano structure by a straightforward processing approach that not only results in high miRNA payload but also low toxicity.
Upon successful identification of the precise oncogene by genome sequencing for certain types of tumors, a more advanced animal model is needed to accurately evaluate the efficacy of nanovector-mediated miRNA replacement therapy. Most of the current preclinical models, such as the standard cell-line xenograft, cannot recapitulate the heterogeneity of tumors in patients as they encounter significant genetic drift in cell culture during passaging in vitro, causing phenotypic transformation [23, 24]. This tumor genetic complexity makes it difficult to evaluate the therapeutic responses to miRNA delivery in patients by using the standard cell-line xenograft. For instance, the current preclinical models fail to represent the biologic and complex genetic characteristics of patients' tumors with FGFR3 aberration. As a result, they cannot provide accurate therapeutic evaluation of systemic miRNA delivery.
Recently, patient-derived xenograft (PDX) is emerging as the highly preferred preclinical model for accurate clinical predictability in targeted drug screening and predictive biomarker development [25-28]. In PDX models, the xenograft is established from patient's tumor tissue without in vitro manipulation to preserve the molecular heterogeneity and biological features of cancer. In this way, the implanted xenograft retains its genetic structure of the original tumor in the patient when passaged in mice. The integration of high-throughput techniques in PDXs enables comprehensive characterization of each model at multiple genetic levels [29, 30]. Consequently, large panels of PDXs can be classified and selected based on genetic characterization and treated as cancer patient surrogates [31, 32]. These genomic classification criteria in PDXs are highly adaptable to cancer patients which represent the clinical procedure of patient selection and targeted drug application. Hence, these PDXs would further facilitate the identification of genetic biomarkers that predict clinical efficacy and provide a rapid pipeline for evaluation of precision therapeutics towards clinical application [30].
The main objective of this study was to develop a miRNA delivery nanovector that can target FGFR3 using the PDX models. For this purpose, the research was focused on the design and development of a nanovector miRNA delivery system that can predominately target and suppress FGFR3. The nanovector is hierarchically functionalized with ternary polymers and structurally composed of magnetic nanocrystals with microchannels among them. The microchannels are functionalized with polycationic polymer PEI and PGA for high miRNA payload. For biocompatibility and colloidal stability, the spherical nanovector is further functionalized with the negatively charged polyacrylic acid (PAA) molecules [33]. Furthermore, the genomics-driven miRNA nano-delivery was carried out using PDX for reliably evaluating the efficacy of FGFR3-targeted miRNA delivery. The unique and effective strategy systematically combines the following four components in a synergized fashion: 1) identification of the precise oncogene for FGFR3-driven tumors by genome sequencing; 2) design of a nanovector delivery system for in-vivo miRNA delivery via a facile and reproducible process; 3) efficient miRNA delivery predominately targeting at FGFR3, and 4) down-regulation of the FGFR3 pathway by miRNA using PDXs in vivo. In this comprehensive fashion, the preclinical model of effective miRNA replacement therapy can be developed for patients harboring FGFR3 aberrations.
Whole-exome sequencing, gene-expression microarray, and copy-number assessment were performed to characterize and, more importantly, categorize PDX models based on their genetic features and potential drug susceptibility. The key target oncogene of miRNA-100 (miR-100), FGFR3, for head-and-neck squamous cell carcinoma, was identified and selected among a panel of PDX models. The nano miRNA replacement therapy targeting FGFR3 using PDX is schematically described in Scheme 1. As shown in Scheme 1A, the PDX panel is established by direct implantation of tumor tissue from a group of HNSCC patients into immune-deficient mice. To represent the subtype of FGFR3-driven cancer patients, the PDXs harboring FGFR3 amplification are selected from the PDX panel upon genetic characterization and classification. A unique nanovector is designed and tailored to specific requirements for efficient miRNA delivery. As depicted in Scheme 1B, the nanovector-miRNA complex is structurally composed of mesoporous superparamagnetic nanoclusters [34-36], conjugated with biocompatible ternary-polymers (γ-PGA, PEI, and PAA), capable of high payload and delivery of miR-100 to cancer cells in vitro and down-regulating FGFR3 pathways in FGFR3-amplified PDXs in vivo.
The schematic diagram showing the translation procedures of cancer therapeutics based on gene targeted miRNA nano delivery using PDX (patient-derived xenograft).
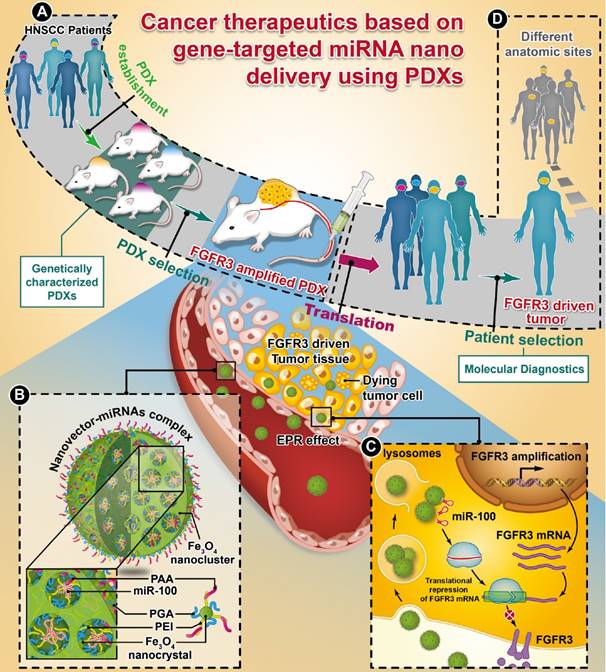
Upon intravenous (IV) injection into each PDX model, the nanovector-miRNA complex is accumulated in the tumor tissues via the EPR effect. The abundant amino groups in the nanovector-miRNA complex facilitate the cell uptake and lysosomal escape. Subsequently, the nanovector-miRNA complex collapses in the low pH environment of the tumor cell and releases miRNA for gene regulation [37]. Successful delivery of miR-100 to cancer cells can repress FGFR3 leading to inhibition of cell proliferation and induction of cell apoptosis (Scheme 1C). Upon in-vivo miR-100 delivery, the PDXs with FGFR3 amplification are exquisitely sensitive to nanovector-miR-100 compared to the PDXs without FGFR3 genetic abnormality. More importantly, the nano-miR-100 treatment enables effective down-regulation of FGFR3 expression, therefore serving as a promising therapeutic strategy for the molecularly-defined, FGFR3-driven tumors from different anatomic sites (Scheme 1D).
Results and Discussion
Synthesis and characterization of the nanovectors
Figure 1A illustrates the formation pathway of the nanovector (polyacrylic acid (PAA)-modified mesoporous magnetic nanocrystal clusters, PMMNCs). As shown in this figure, the PGA/PEI co-stabilized Fe3O4 nanocrystals are assembled into the mesoporous magnetic nanoclusters (MMNCs) in situ by a modified hydro-thermal reaction [37]. By introducing PEI molecules with PGA for stabilization of the magnetic nanocrystals, the amino groups are abundantly available both inside the mesopores and on the cluster surfaces for complexation with miRNAs. The amino groups on the surface can also facilitate further modification by PAA molecules through strong electrostatic interaction. Using this facile and reproducible strategy, basic requirements for high miRNA payload are satisfied in terms of colloidal stability, stable structure, cellular uptake, and low cytotoxicity.
Mesoporous magnetic nanoclusters preparation, surface functionalization and characterization. (A) Schematic illustration of preparation pathway of the nanovector (PMMNCs). (B) Hydrodynamic size of the nanovectors before and after surface functionalization, and PMMNCs-miRNA complex in DI water measured by dynamic light scattering (DLS). (C) TEM and SEM (inset) image of nanovector (PMMNCs), inset scale bar is 100 nm. (D) Colloidal stability of PMMNCs in PBS (pH 7.4) measured by DLS.
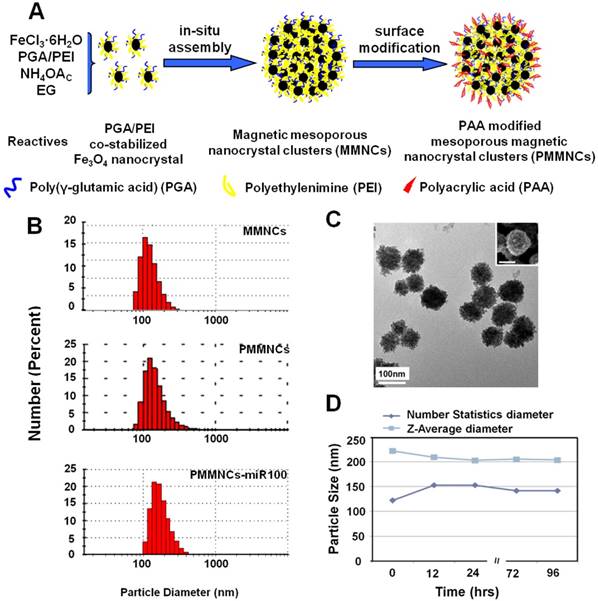
Figure 1B shows the dynamic light scattering (DLS) size distributions of MMNCs, PMMNCs, and PMMNCs-miR-100 complex in aqueous solutions. As shown in this figure, no obvious size change is observed for the MMNCs, PMMNCs and PMMNCs-miR-100 complexes in DI water. However, when dispersed in PBS solution (pH=7.4), the hydrodynamic size of MMNCs increases to 606.5 nm due to aggregation. The size of PMMNCs in PBS solution was determined to be 242.0 nm, indicating well-improved colloidal stability after PAA modification.
The average size of PMMNCs is 125 nm, determined by both SEM and TEM as shown in Figure 1C. It can be seen that each magnetic nanocluster is assembled by a large number of Fe3O4 nanocrystals less than 10 nm. The nanoclusters are morphologically composed of the coarse surfaces and microchannels within them. Upon miRNA loading, the hydrodynamic size of PMMNCs increases to 244.1 nm, as expected. The ζ-potential of the PMMNCs-miR-100 complex reaches -30.8±2.6 mV due to nanovector adsorption of miRNAs. The increased negative surface potential is consistent with a previously reported study [38]. The PMMNCs show good stability in PBS solution (pH=7.4) by intermittent measurement within 96 hrs at intervals between 12 and 24 hrs (Figure 1D). The PMMNCs-miR-100 complex also exhibited good colloidal stability in PBS solution with 5% FBS. The Z-average diameter measured by DLS NanoSizer ZS90 was 331.6 nm.
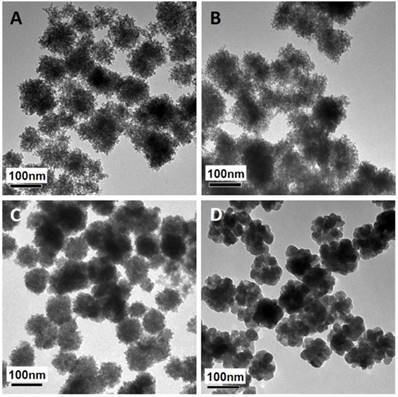
The mesoporous structure and PEI functionalization are both essential for efficient miRNA loading. It has been reported that γ-PGA is critical for iron oxide mesoporous nanocluster formation [37]. Different γ-PGA/PEI input mass ratios (100:0, 45:55, 20:80 and 0:100) were optimized for structural alteration and polycation functionalization. The diameters and corresponding ζ-potential data of the MMNCs with different PGA/PEI ratios are shown in Supplementary Table S1. It can be seen in this table that the hydrodynamic sizes of MMNCs at different PGA/PEI ratios of 100:0, 45:55, 20:80 and 0:100 in DI Water are, respectively, 273.7, 229.8, 225.1 and 1015 nm. Meanwhile, the zeta-potentials of the MMNCs with these PGA/PEI ratios are -8.29, +14.2, +20.6 and +7.28 mV, respectively. It can also be seen that the zeta potential of the magnetic nanoclusters gradually becomes more positive with increasing PEI proportion. At 100% of PEI, the zeta potential is lowered due to particle aggregation. At 20:80, the zeta potential changes from +20.6 mV to -22.0 mV after PAA modification, indicating a successful surface functionalization. Figure 2 shows the TEM images of magnetic nanocrystals clusters stabilized by different polymer compositions. As can be seen in this figure, the morphologies of the nanoclusters are significantly affected by the γ-PGA/PEI input mass ratios. For γ-PGA/PEI mass ratios of 100:0 (Figure 2A), 45:55 (Figure 2B), 20:80 (Figure 2C), the TEM images show high densities of mesopores. In particular, the ratio of 20:80 was selected for the following experiments considering its highest PEI proportion while maintaining the optimized mesoporous structure (Figure 2C). In contrast, at ratio of 0:100, the nanoclusters exhibit a coarse surface morphology (Figure 2D) with dramatically decreased mesopores and reduced miRNA loading capacity. The loading efficacy of miRNA was found to be 52.0 %, while that of miRNA by MMNCs 87.8% with a typical PGA/PEI ratio of 20:80. This large difference in loading efficacy is associated with their different nanostructures, showing the critical role of PGA in producing the ideal mesopores in the nanovector.
TEM images of magnetic nanoclusters stabilized by different polymer composition: (A) 100% γ-PGA, (B) 45% γ-PGA and 55% PEI, (C) 20% γ-PGA and 80% PEI, and (D) 100% PEI.
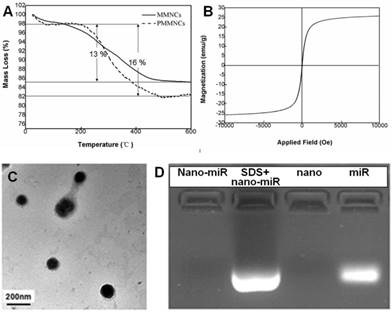
Langmuir surface area of the typical nanoclusters was shown to be 77.8 m2·g-1 by BET measurement, and the pore size of MMNCs broadly ranged from 3.0~13.0 nm due to self-assembly of the original Fe3O4 nanocrystals (Supplementary Figure S1). The TGA results of MMNCs and PMMNCs showed 13 % mass loss, attributed to the γ-PGA and PEI polymers. An extra of 3 % mass loss resulted from the decomposition of the functionalized PAA molecules (Figure 3A). Furthermore, PMMNCs was characteristically superparamagnetic with a reversible hysteresis and saturated magnetization of 25 emu·g-1 (Figure 3B).
(A) TGA curves of mesoporous magnetic nanocrystal clusters and PAA-modified mesoporous magnetic nanocrystal clusters. (B) Magnetization of PAA-modified mesoporous magnetic nanocrystal clusters measured at room temperature. (C) TEM image of miRNA encapsulated PAA-modified mesoporous magnetic nanoclusters. (D) Evaluation of the miR-100 encapsulated in PAA-modified mesoporous magnetic nanoclusters (nano) by electrophoretic mobility shift assay. Nano-miR refers to PMMNCs-miR.
The cytotoxicities of MMNCs and PMMNCs were investigated by using a head-and-neck cancer cell line, HN-13. Supplementary Figure S2 shows the dose dependent toxicities of MMNCs and their functionalized counterparts. The PAA-modified nanoclusters were rendered with low cytotoxicity due to partial coverage of the surface cationic charge. Note that PEI 25kDa may post some bio incompatibility. To reduce its cytotoxicity, the nanocarriers were further modified by polyacrylic acid. Our current research deals with constructing of the similar nanocarriers functionalized by low molecular weight PEI network to balance the RNA payload and cytotoxicity.
Physicochemical Characterization of miR-100-Loaded PMMNCs
As shown in the TEM image of PMMNCs-miR-100 complex (Figure 3C), miRNA is attached on both inner mesopores and the nanovector surface. Nanodrop 1000 measurement yielded a miRNA payload of 43.6 μg·mg-1 by PMMNCs. The loading efficacy of miRNA by PMMNCs is 67.9 %. Compared to the payload of miRNA by MMNCs (55.0 μg·mg-1, the loading efficacy is 87.8%) before PAA modification, there was a 20.7 % decrease. This reduction in payload is attributed to the negatively charged PAA molecules being repelled apart from miRNAs while the majority of miR-100 permeates into the pores of the PMMNCs. We found that the electrostatic binding of miRNA to PEI-functionalized mesopores not totally retarded upon coating of MMNCs with PAA polymers. These experiment results are similar to the positively-charged DOX with high loading by the PEI-coated phosphonate mesoporous silica particles [39]. The encapsulated miR-100 in PMMNCs can also be seen from gel electrophoretic assay (Figure 3D). Compared to naked miR-100 (Lane 4), the gel assay showed negligible release of miRNA when bound to PMMNCs during electrophoresis, as migration of miR-100 into the gel was largely prevented by nanocluster encapsulation (Lane 1). MiR-100 was released again after treatment of PMMNCs with SDS prior to electrophoresis (Lane 2). These behaviors indicate miR-100 being carried by the modified nanoclusters via electrostatic interaction and released from carriers after SDS treatment. In this way the required dose of the nanovector-miRNA-complex would be reduced for less side-effect.
To determine whether the nanovector PMMNCs could protect miR-100 from degradation in serum, we performed the serum stability assay. To this end, miR-100 loaded in PMMNCs or the equal amount of naked miR-100 was added into 100 μL FBS. The intact miR-100 was measured by qPCR at 1, 12, 24, 48 hrs after incubation. It was found that over 90% of naked miR-100 degraded within the first 24 hrs of incubation (Supplementary Fig. S3). However, more than 70% of miR-100 loaded in PMMNCs was still detected at 48-hr time point (Supplementary Fig. S3). These results demonstrate that PMMNCs well protected miR-100 from the action of serum nucleases.
Cellular Uptake of PMMNCs-MiR-100 complex
The cellular uptake of PMMNCs-miR-100 complex, referred as to nano-miR-100, was evaluated by confocal microscopic observation after co-incubation with HN-13 cells, a cell line that was derived from HNSCC. MiR-100 mimics were labeled with fluorescent dye Cy3 (red) for tracking the nanovectors. CD44, a ubiquitously expressed surface marker in HNSCC [40], was stained with fluorescein isothiocyanate (FITC) (green). The cell nucleus was stained with 4', 6-diamidino-2-phenylindole dihydrochloride (DAPI) solution (blue). Figure 4A shows that the PMMNCs-miR-100 complex are localized in the periplasmic space of the cells at the early stage (2 hrs of incubation), and dispersed in cytoplasm over time (4 hrs of incubation). The accumulation of the PMMNCs-miR-100 inside the cells was found to increase within 4 hrs (Supplementary Figure S4). To further quantify cellular uptake efficiency, HN-13 cells were treated with PMMNCs-miR-100 for 24 hrs. From fluorescence staining and qRT-PCR assays, miR-100 was found to be effectively delivered into HN-13 cells by PMMNCs. We observed that, for HN-13 cells treated with 10 pmols and 100 pmols of delivered miR-100 by PMMNCs, the intracellular miR-100 level was respectively 585-fold and 6271-fold higher than in the HN-13 cells with either PMMNCs alone or PBS blank control (Figure 4B).
PMMNCs-MiR-100 Complex Cellular Uptake. (A) Confocal fluorescent microscope images of HN-13 cells treated with Nano-miR-100 (PMMNCs-miR-100) for indicated time. CD44 was labeled in green and miR-100 in red; nuclei were counterstained with DAPI (blue). Scale bar, 10 μm. (B) Quantification of the miR-100 expression level in HN-13 cells delivered by PMMNCs loaded with miR-100 (nano-miR-100) at different concentrations (10 and 100 pmols) and pure PMMNCs and control by qPCR assay. (C) Western blot analysis showing that nano-miR-100 transfection significantly decreased the protein expression of miR-100 target gene FGFR3. All error bars indicate standard deviation. *, p<0.01 versus the control group.
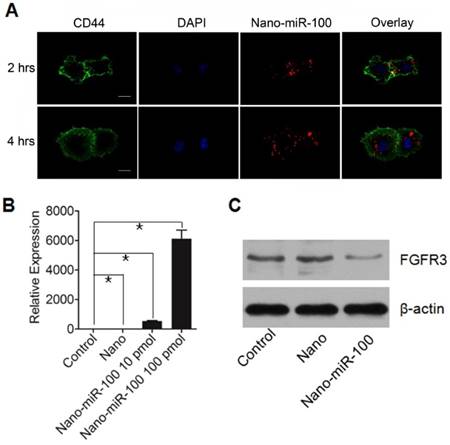
FGFR3 has been reported as the major target of miR-100 in various types of malignancies including HNSCC. Western blot analysis was utilized to detect the protein expression of FGFR3 after 4 hrs incubation with either PMMNCs or PMMNCs-miR-100. PBS-treated cells were used as blank control. As shown in Figure 4C, delivery of miR-100 by PMMNCs significantly reduces FGFR3 expression compared with that in the HN-13 cells with only PMMNCs, indicating a strong evidence of effective delivery of miR-100 into HN-13 cells.
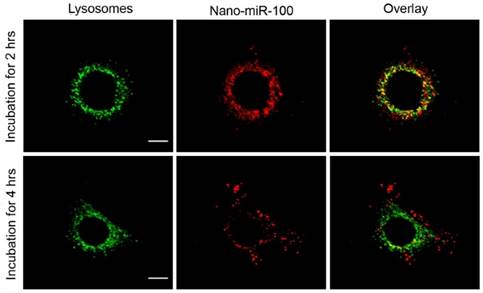
The confocal fluorescence microscopy images at different resolutions are shown in Figure 5 and Supplementary Figure S5, respectively, for investigation on the endosome-related transportation and lysosomal escape of the nanovectors in cells. Upon incubation with PMMNCs-miR-100 for 2 hrs, the confocal fluorescent microscopy images (Figure 5) show the majority of red fluorescence inside endosomes and lysosomes. At 4 hrs, a large amount of red fluorescence spreads inside the cytoplasm of cells in a punctuate pattern. This clearly indicates cell uptake and lysosomal escape of the complexes.
Confocal microscopy images of HN-13 cells stained by LysoTracker green at two different time points after exposure to nano-miRNA-100 (P MMNCs-miR-100). Lysosomes in green and miR-100 in red. Scale bar, 10 μm. Figure 4. PMMNCs-MiR-100 Complex Cellular Uptake. (A) Confocal fluorescent microscope images of HN-13 cells treated with Nano-miR-100 (PMMNCs-miR-100) for indicated time. CD44 was labeled in green and miR-100 in red; nuclei were counterstained with DAPI (blue). Scale bar, 10 μm. (B) Quantification of the miR-100 expression level in HN-13 cells delivered by PMMNCs loaded with miR-100 (nano-miR-100) at different concentrations (10 and 100 pmols) and pure PMMNCs and control by qPCR assay. (C) Western blot analysis showing that nano-miR-100 transfection significantly decreased the protein expression of miR-100 target gene FGFR3. All error bars indicate standard deviation. *, p<0.01 versus the control group.
Transfection with PMMNCs-miR-100 inhibits cell proliferation and induces cell apoptosis
In addition to target gene regulation, transfection with PMMNCs-miR-100 significantly lowered the rate of cell growth in culture (Figure 6A). Bromodeoxyuridine (BrdU) is a synthetic nucleoside which is an analog of thymidine and can be incorporated into the newly-synthesized DNA of replicating cells. Thus, BrdU incorporation assay is a common method used for assessing cell proliferation. As shown in Figure 6B, BrdU incorporation assay shows that nano-miR-100 transfection significantly decreased the percentage of BrdU-positive HN-13 cells. Representative images of BrdU assay are shown in Figure 6D. BrdU is labeled in green and miR-100 labeled with Cy-3 (red). Nuclei are counterstained with DAPI (blue). Compared to cells treated with either PMMNCs alone or PBS control, a significantly decreased green fluorescence signal was observed in the nano-miR-100 treated group.
Transfection with PMMNCs-miR-100 (nano-miR-100) inhibits the proliferative ability of HN-13 cells. (A) Growth curves of HN-13 cells with indicated treatments, showing that nano-miR-100 transfection effectively inhibited the growth of HN-13 cells in culture. (B) BrdU incorporation assay showing that nano-miR-100 transfection significantly decreased the percentage of BrdU-positive HN-13 cells. (C) Flow cytometry-based cell cycle analysis showing that nano-miR-100 transfection significantly decreased the percentage of HN-13 cells in S-phase. (D) Representative images of BrdU assay. BrdU is labeled in green and miR-100 in red; nuclei were counterstained with DAPI (blue). Scale bar, 100 μm. (E) The representative images of flow cytometry-based analysis; the significantly decreased proliferation of the PMMNCs-miR-100-treated cells is reflected by the reduced shaded area of cell cycle S-phase. All error bars indicate standard deviation. N.S., no statistical signification; *, p<0.01 versus the control group.
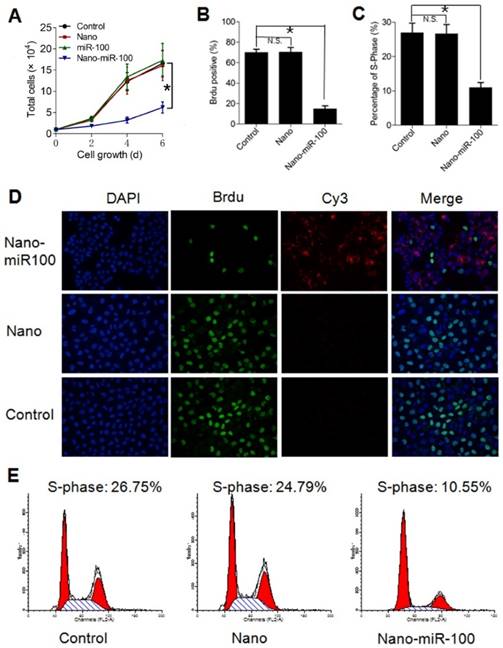
We also used flow cytometry-based cell-cycle analysis to distinguish cells in different phases of the cell cycle. S-phase occurs between the G1 and G2 phase in the cell cycle, during which the DNA is replicated. S-phase of the cell cycle was estimated to determine proliferation of cancer cells. The cell percentage in S-phase was found to dramatically decrease in the PMMNCs-miR-100 treated HN-13 cells compared with those incubated with either PMMNCs or PBS control (Figure 6C), demonstrating that effective miR-100 delivery by PMMNCs significantly inhibits proliferation of HN-13 cells. Figure 6E shows the representative images of flow cytometry-based analysis; the significantly decreased proliferation in the PMMNCs-miR-100-treated cells is reflected by the reduced shaded area of cell cycle S-phase.
To determine the effects of PMMNCs-miR-100 on cell apoptosis, the Annexin V-FITC assay was conducted by flow cytometry. Annexin V is used to identify apoptotic cells because of its ability to bind to phosphatidylserine, a marker of cell apoptosis when it is translocated from the inner to outer leaflet of the plasma membrane. 4'6-diamidino-2-phenylindole (DAPI), a standard flow cytometric viability molecular probe, is used to distinguish viable cells from non-viable cell population. The quantities of viable cells, early apoptosis cells, and late apoptosis/necrosis cells were determined by the percentage of Annexin V-/DAPI-, Annexin V+/DAPI-, Annexin V-/DAPI+, and Annexin V+/DAPI+. The experimental results showed that PMMNCs-miR-100 transfection obviously induced the apoptotic cell death, as compared to PMMNCs-treated group (Supplementary Figure S6A). Statistical data on the percentage of early apoptotic cells are shown in Supplementary Figure S6B.
Inhibition of tumor growth by systemic PMMNCs-miR-100 delivery in genetically characterized patient-derived xenografts (PDXs)
PDXs are considered to represent the heterogeneity of human cancers and advanced preclinical models [25-28]. More recently, genetically characterized PDXs are shown to be an effective strategy for precision cancer therapy [29-32]. As we previously reported [41], once the volume of the xenograft reached 1000-1500 mm3, it was removed and re-transplanted into new mice for issue expansion and drug evaluation.
To characterize the comprehensive molecular landscape of PDXs, we performed integrated bioinformatics analyses in 24 PDXs. Whole Exome Sequencing (WES) was used to investigate protein-coding regions of the genome to uncover single nucleotide variants (SNVs) and insertion-deletions (indels) [5]. We identified a non-hotspot missense mutation in FGFR3 located in exon 7 (G258A) in HN-04-002 PDX. Genome-wide human-SNP-Array-6.0 was used to determine the copy number variation (CNV) across the entire human genome in 24 PDXs. Genes that exhibited copy number of 2 was regarded as normal. Gene amplification and deletion cutoffs were selected to be 3.0 and 1.3, respectively, based on an assessment of replicate samples from the SNP arrays [42]. We found FGFR3 amplified in 5 out of 24 PDX models (Supplementary Figure S7A).
To investigate the therapeutic ability of PMMNCs-miR-100, two FGFR3-amplified PDXs (HN-04-002 and HN-04-020) were selected. We also selected one non-FGFR3-amplified PDX (HN-03-09) as the control. Concordant FGFR3 miRNA over-expression was observed in these selected FGFR3-amplified PDXs (Supplementary Figure S7B), indicating FGFR3 amplification, which is strongly associated with high gene expression, discriminating the subtype of PDXs that is more sensitive to FGFR3-targeted therapeutics.
When the PDX volume reached 150~200 mm3, mice were stratified into six groups and treated as follows: (i) vehicle (phosphate buffer saline, PBS); (ii) cisplatin or docetaxel; (iii) miR-100; (iv) nano (PMMNCs); (v) nano-miR-100 (PMMNCs-miR-100), and (vi) a combination of nano-miR-100 with either cisplatin or docetaxel. All miR-100 loaded nanovectors were administrated intravenously (IV) while the chemotherapy drug intraperitoneally (IP) injected. In the present study, the miRNA-based treatments were administered by IV injections in the mouse model, which was the more viable and clinical relevant approach considering drug bio-distribution and pharmacokinetics [43]. Body weight changes were recorded during the treatment period and less than 20% loss of body weight was considered a sign of drug toxicity [44]. All treatments showed no apparent toxicity as determined by body weight change (Figure 7B, 7D, 7F).
Therapeutic efficiency of conventional chemotherapy and systemic nano-miR-100 (PMMNCs-miR-100) delivery or their combination in three PDXs. (A, C, and E) Tumor volume (mm3) measured in different treatment groups over time in FGFR3-amplified PDX HN-04-002 (A), FGFR3-amplified PDX HN-04-020 (C), and non-FGFR3-amplified PDX HN-03-09 (E). Dose schedules in different treatment groups are illustrated. IV, intravenously injection; IP, intraperitoneal injection; QW, once a week; BIW, twice a week. (B, D, and F) Body weight change of mice receiving different treatments over time in FGFR3-amplified PDX HN-04-002 (B), FGFR3-amplified PDX HN-04-020 (D), and non-FGFR3-amplified PDX HN-03-09 (F). Vehicle, phosphate buffer saline (PBS). All error bars indicate standard deviation.
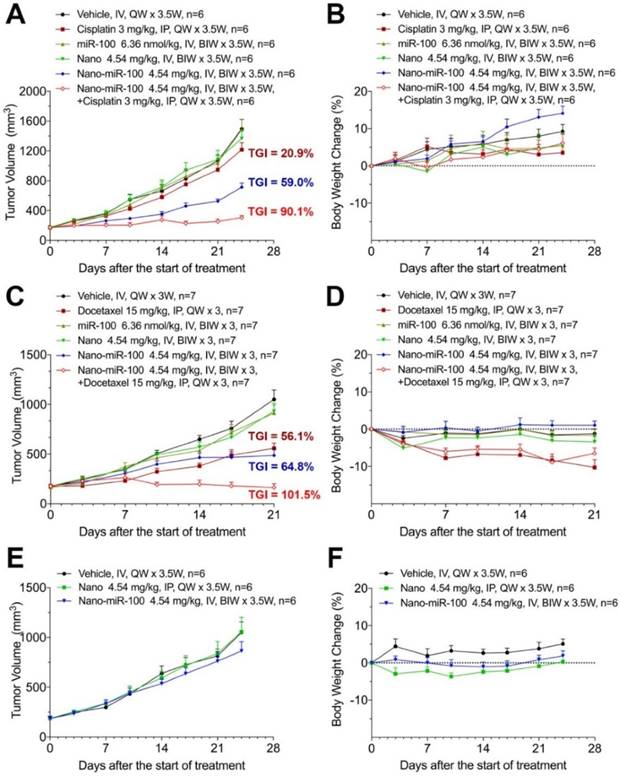
The antitumor efficiency of treatment was evaluated by the percentage of tumor growth inhibition (%TGI) as previously reported [45]. As shown in Figure 7A, treatment with either PMMNCs (Nano group, TGI=9.96 %, p-Value=0.824) or miR-100 (miR-100 group, TGI=0.78 %, p-Value>0.95) fails to suppress tumor growth compared to the vehicle control in PDX HN-04-002, whereas PMMNCs-miR-100 significantly suppresses tumor growth (Nano-miR-100 group, TGI=59.0%, p-Value<0.001). The representative images of tumors from the mice receiving the final treatments are shown in Supplementary Figure S8A. Similar result was obtained in another FGFR3-amplified PDX HN-04-020 (Figure 7C). In contrast, only a modest anti-tumor efficiency of PMMNCs-miR-100 was observed in the non-FGFR3-amplified PDX HN-03-09 (Figure 7E).
The surface-functionalized nanovector exhibited high colloidal stability in both PBS and serum/PBS solution. This resulted in passive retention (an EPR effect) of 7.4 % of the administered particle dose at the tumor site, as determined by quantification of the Fe content in the harvested organs using ICP-AES (Supplementary Figure S8B). The nanovector-miRNA complex was accumulated in the liver, spleen, and the major organs of the mononeuclear phagocyte and the reticulo-endothelial systems. The PGA-functionalized magnetic nanoclusters have been reported to exhibit acid-responsive drug release behavior at pH of 4.8 [37]. In this study, increased H+ adsorption by PEI embedded PMMNCs resulted in a slight increase of pH value of PBS solution to 5.4 from 4.8 at 24 hrs. The nanovectors showed acid-dependent degradation at pH of 4.5 in the in-vitro experiment. It would be expected that most of the loaded miRNA was released without harming other normal cells and organs in vivo.
Inhibition of Cell Proliferation and Induction of Apoptotic Cell Death by PMMNCs-miR-100 delivery
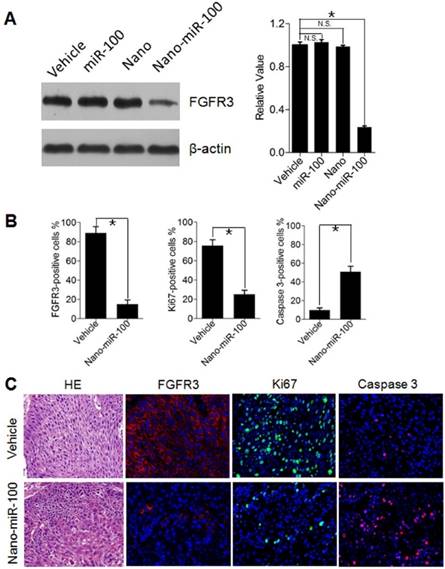
To investigate cell proliferation inhibition and induced cell apoptosis in PDXs by systemic PMMNCs-miR-100 delivery, mice from different groups were sacrificed after 24 days of treatment and xenografts were harvested for Western blot analysis and immunohistochemistry staining. As previously mentioned, oncogenic FGFR3 was identified the key target genes of miR-100. Human Ki-67 protein is a well-established marker to determine the growth fraction of a given cell population. Caspase-3 protein (member of the cysteine-aspartic acid protease family) plays a dominant role in the apoptotic pathways and is used to distinguish apoptotic cells from non-apoptotic cells. By utilizing the Western blot analysis, it is clearly observed that PMMNCs-miR-100 treatment significantly inhibits the protein expression of FGFR3 (Figure 8A). The Immunofluorescence results further show that tumors treated with PMMNCs-miR-100 showed reduced levels of proliferation and increased levels of apoptosis, as measured by Ki67 and caspase 3 expressions, respectively (Figure 8B). The representative images of immunofluorescence staining are shown in Figure 8C. Consistent with the in-vitro results, the in-vivo data provided further evidences that systemic delivery of exogenous miR-100 inhibited the growth of xenograft through suppression of tumor cell proliferation and induction of apoptosis. We also demonstrated the anti-tumor effects of nano-miR-100, at least in part, through inhibition of FGFR3.
Inhibition of Cell Proliferation and Induction of Apoptotic Cell Death by PMMNCs-miR-100 (nano-miR-100) delivery in PDXs. (A) The FGFR3 protein expression in PDXs with indicated treatment was determined by Western blot analysis (left) and further normalized on the expression level of vehicle treatment group (right). (B~C) Quantification (B) and representative tumor tissue sections (C) stained for FGFR3, Ki67, and Caspase 3 expression by immunohistochemistry. Original magnification: 20×. The PDXs treated as indicated were collected and processed 2 hrs after the final treatments. All error bars indicate standard deviation. N.S., no statistical signification; *, p<0.01 versus the control group.
The systematic delivery of PMMNCs-miR-100 in PDXs harboring FGFR3 amplification demonstrated significant antitumor effect compared to their counterparts without FGFR3 genetic abnormality. Therefore, down-regulating FGFR3 pathway via PMMNCs-miR-100 may serve as a potential therapeutic strategy for cancer patients with FGFR3 pathway aberrations.
Enhanced therapeutic efficiency of conventional chemotherapy by systemic PMMNCs-miR-100 delivery
Recent studies have shown that replacing the depleted tumor suppressor miRNA or abating oncogenic miRNA could synergize with conventional chemotherapy during cancer treatment [46-48]. The development of the miRNA-based therapeutics in combination with conventional chemotherapy provides an alternative approach to enhance the therapeutic efficacy and improve treatment outcome for cancer patients. We therefore further investigated the synergistic effects of PMMNCs-miR-100 with conventional chemotherapy. As shown in Figure 7A, cisplatin treatment shows limited therapeutic efficacy in PDX HN-04-002 (TGI=20.9 %), whereas PMMNCs-miR-100, combined with cisplatin, substantially increases the anti-tumor suppression rate (TGI=90.1 %). Additionally, PMMNCs-miR-100 (nano-miR-100) treatment in combination with docetaxel significantly increases the anti-tumor effects (TGI=101.5 %) compared with docetaxel alone (TGI=56.1 %, Figure 7C). These experimental results indicate the intensified tumor sensitivity by combining miR-100 with conventional chemotherapy.
Conclusions
In conclusion, we have shown that miRNA replacement therapy can be highly effective for the molecularly-defined tumors. The results of this study have demonstrated clear evidence on FGFR3-driven tumor suppression via gene-targeted miR-100 delivery. In sharp contrast, tumor growth inhibition was comparatively insignificant in the non-FGFR3-amplified PDXs. To achieve this genomics-driven therapy, a unique nanovector was developed with mesopores tailoring to the specific requirements in miRNA delivery in vivo, including carrier structural stability and high payload. The miRNA delivery by the nanovector induced pH-sensitive RNA release and facilitated endosomal escape. The delivery of miR-100 to cancer cells significantly down-regulated the expression of FGFR3 and inhibited cell proliferation in vitro. PDXs with FGFR3 amplification were found much more sensitive to the miR-100 nanovector compared to the non-FGFR3-amplified PDXs. Furthermore, the miR-100 nanovector, when combined with conventional chemotherapy, was found to suppress tumor growth even more effectively in FGFR3 genetically abnormal PDXs. These findings show promise in nano miR-100 suppression of FGFR3 for “FGFR3-driven” cancer patients in the clinical setting and pave a new path for personal and precision therapy.
Materials and Methods
Materials
Polyethylenimine (PEI MW 25000), Iron (III) chloride hexahydrate (FeCl36H2O), ammonium acetate (NH4OAc), ethylene glycol (EG), and anhydrous ethanol were purchased from Sinopharm Chemical Reagent Co., Ltd. (China). Poly (γ-glutamic acid) (γ-PGA MW 1700000) was purchased from Nanjing Huaweiruike Company (China). Polyacrylic acid (PAA MW 3000) was purchased from Aladdin Chemistry Company (China). The Cy3-labeled microRNA100 was synthesized by Shanghai GenePharma Co., Ltd. (China) and the sequence was 5'-AACCCGUAGAUCCGAACUUGUG-3'. All chemicals and gene oligonucleotides were used as received. Deionized water was used in all syntheses experiments. DEPC water was used in miRNA loading experiments. Nano-miRNA complex was dispersed in PBS (pH=7.4 with 0.1% DEPC) buffer solution.
Synthesis of Mesoporous Magnetic Nanocrystal Clusters
The mesoporous magnetic nanocrystal clusters (MMNCs) were synthesized by a modified solvo-thermal reaction. In the typical synthesis: 0.579 g FeCl3 6H2O, 1.65 g NH4OAc, 0.2912g PEI, and 0.0725 g PGA (PGA/PEI=20:80) were dissolved in 30 mL of ethylene glycol by ultrasonication. The mixture was stirred vigorously at 160 oC under N2 protection for 1 hr to form a homogeneous brownish solution and then transferred into a Teflon-lined stainless-steel autoclave (50 mL capacity). The autoclave was heated to 200 oC and maintained at this temperature for 12 hrs. It was then cooled to room temperature. The black MMNCs were rinsed three times with ethanol and DI water separately under ultrasonic conditions to effectively remove the solvent. During each rinsing step, the MMNCs were separated from the supernatant by using magnet.
In control syntheses experiments, different PGA/PEI ratios (PGA/PEI=100:0, 45:55, 0:100) were used for preparation of magnetic nanoclusters while keeping other condition the same as the typical process.
Synthesis of PAA-modified Mesoporous Magnetic Nanocrystal Clusters (PMMNCs)
PAA (MW 3000) (30 mg) was dissolved in 5 mL mixture of DI water and methanol, followed by adding NaCl (876 mg). The pH of the mixture was adjusted to 7.0 using NaOH solution. The mixture was ultrasonicated for 15 min. Then, 15 mg of MMNCs was added and the reaction stirred for another hour. The product (PMMNCs) was obtained upon washing by methanol and DI water, and magnetically separated and collected. The amounts of PAA used in surface modification were 10, 20, 30, and 40 mg, respectively. 30 mg input was selected for having no effect on the Zeta potential of the PMMNCs.
Characterization
Transmission electron microscopy (TEM) images were taken by Philips Tecnai 20 transmission electron microscope at an accelerating voltage of 200 kV. Scanning electron microscopy (JEOL S4800) was used to observe the surface morphology of the nanoclusters. The size and Zeta potentials of the nanoparticles were determined using a DLS Particle Size analyzer (Zetasizer Nano-ZS, Malvern, U.K.). For DLS measurement, 0.1 mg/mL of nanocluster or complex solution was dispersed by 5 min sonication. Ultraviolet-visible (UV-vis) absorption spectra of miR-100 were performed on a NanoDrop 1000 (Thermo Scientific) ultraviolet-visible spectrophotometer. The vibrating sample magnetometer (LakeShore 7407, USA) was used to study the magnetic properties of the PMMNCs at room temperature. Thermogravimetric (TG) analysis data was obtained with a Pyrisis-1 (Perkin Elmer, USA) thermal analysis system under a flowing nitrogen atmosphere at a heating rate of 20 oC min-1 from 25 to 600 oC. Brunauer-Emmett-Teller (BET) surface area of MMNCs was determined by N2 adsorption/desorption on the Micromeritics ASAP 2020 accelerated surface area and porosimetry analyzer (Micromeritics Co. Ltd.) at 77 K after being degassed at 150 oC.
In-vitro miRNA loading and Gel retardation analysis
MiRNA-PMMNCs complex was prepared by mixing 1.0 mg PMMNCs with 200 μL of miRNA/DEPC water solution (21.2 μmol·L-1) for 3 hrs at room temperature. The loading capacity of miRNA by the clusters was confirmed by nanodrop measurement and gel retardation assay, as detailed below. The original miRNA concentration and the remained miRNA after adsorption in the supernatant were measured by Nanodrop 1000 (Thermo Scientific). Average value of each sample was calculated from three independent measurements. The loading capacity of miR-100 by PMMNCs was calculated from the difference between the initial miRNA input and the rest in the supernatant considering the natural decrease of miRNA within three hours in the DEPC solution as the background. The miRNA loading efficacy (E) was calculated by this formula:
E = (CC-C1)/C0 * 100%
Where we defined C0 as the original concentration of miRNA measured by Nanodrop-1000 before the loading process; CC means the natural loss of miRNA during the loading period in the absence of PMMNCs; C1 means the concentration of miRNA in supernatant after loading by PMMNCs.
Moreover, agarose gel retardation assay was used to determine the RNA binding ability of PMMNCs. Upon adsorption, 10 μL of the complex solution mixed with 2 μL of 6× loading buffer was electrophoresed on 2% agarose gel containing 0.5 μg·mL-1 ethidium bromide (EB) with tris-acetate-ethylenediamine tetraacetic acid (TAE) running buffer (pH 8.0) at 110 V for 10 min. To analyze electrophoretic mobility shift, 5 μL of the mixture of 10% glycerin and 2% SDS were added to the sample. Gel electrophoresis was carried out at 110 V for 10 min. Pure PMMNCs were set as blank and pure miRNA as the marker. RNA bands were visualized by a UV (254 nm) illuminator and photographed with a Bio-Rad imaging system.
In-vitro cell cytotoxicity test
The in-vitro cytotoxicity of nanoclusters before and after surface modification against head-and-neck cancer cell line HN-13 cells was assessed using the MTT method. Specifically, 100 μL of cells was seeded in a 96-well flat culture plate at a density of 1×10⁴ cells per well and subsequently incubated for 24 hrs to allow attachment. The samples with different concentrations were then added to each group (three wells) for 24 hrs. 20 μL MTT solution (5 mg·mL-1 in PBS) was added to the wells and incubated for 4 hrs. MTT internalization was terminated by aspiration of the media, and the cells were lysed with 150 μL DMSO. The absorbance of the formazan dissolved in DMSO solution was measured at 490 nm on a microplate reader. Cell viability was calculated by means of the following formula: The cell viabilities of MMNCs and PMMNCs against cancer cells were measured by the MTT assay. The experiment was carried out by using an in-vitro cytotoxicity method. Cell viability graphs were plotted as particle concentration.
Cell Culture
HN-13 cells were cultured using the recommended media (Invitrogen) supplemented with 10% FBS (Gibco) and penicillin streptomycin at 37 oC in 5% CO2.
Confocal fluorescence microscopy
Cells were plated on confocal dishes (6×10⁴ per dish) for 24 hrs prior to incubation with PMMNCs-miR-100 complex (25 µg·mL-1) in DMEM medium, followed by rinsing in PBS and staining with LysoTracker green (25 nmol·L-1, 37℃, 10 min) according to the operation manual in the co-localization experiments. Confocal fluorescence imaging was performed with an Olympus FV1000 laser scanning fluorescence microscope and a 60× oil immersion objective lens. Excitation of cancer cells, incubated with PMMNCs-miR-100 labeled with Cy3, was performed at 550 nm. LysoTracker green was excited at 504 nm. For real-time observation, after incubation with PMMNCs-miR-100 for a certain time, the medium was replaced with fresh nanovector-free medium and observed using confocal fluorescence microscopy.
Patient primary specimens
Patient HNSCC specimens were collected within one hour after surgery under guidelines approved by the Institutional Review and the Ethics Boards at Shanghai Jiao Tong University School of Medicine (Shanghai, China). Written informed consent was obtained from patients in all cases at the time of enrollment. Histologic examination was carried out by two different pathologists and diagnosis was made according to the American Joint Committee on Cancer/International Union Against Cancer staging system.
Establishment of HNSCC PDXs
At the time of primary tumor reductive surgery, a specimen was cut into approximately 3-5 mm pieces and implanted into the flanks of NOD/SCID mice (aged 4~5 weeks and weighing 18~22 g). Volume of tumor was calculated using the formula: (Length × Width2)/2. When the tumors reached approximately 1000-1500 mm3, mice were anaesthetized with intraperitoneal injections of xylazine (10 mg·kg-1) and ketamine (80 mg·kg-1), and sacrificed. Xenografts were collected for formalin-fixed-paraffin embedding (FFPE), snap frozen in liquid nitrogen or subsequently implanted into another set of mice using the same procedure. In this study, the third generation of xenograft was expanded for drug treatment. Tumor growth inhibition (%TGI) was determined twice weekly during the dosing period by the formula: TGI (%) =[1-(Tt-T0)/(Vt-V0)] × 100%, where Tt is the average tumor volume of a treatment group on a given day; T0 is the average tumor volume of the treatment group on the first day of treatment; Vt is the average tumor volume of the vehicle control group on the same day with Tt, and V0 is the average tumor volume of the vehicle group on the first day of treatment. The differences of tumor volumes between groups were analyzed for significance using t test or one-way ANOVA. The animal study was approved by the Animal Research Committee of Ninth People's Hospital, Shanghai Jiao Tong University School of Medicine.
Tissue processing for genomic studies
DNA and RNA were isolated from each sample and used to generate libraries for exome sequencing using the QIAamp DNA mini kit (Qiagen) and RNeasy protect mini kit (Qiagen), respectively. The concentrations were quantified using NanoDrop ND-1000 spectrophotometer (NanoDrop, Wilmington, DE). DNA samples were measured using UV spectroscopy, where the A260/A280 between 1.8 and 2.0 and A260/A230 ratios above 2.0 were determined for WES and SNP 6.0 array analyses. RNA samples with an RNA integrity number above 8.0 and A260/280 ratios above 2.0 from the samples were used for gene expression array.
Gene expression array
Total RNA was extracted and purified from the xenograft, amplified and fragmented using the GeneChip® 3′ IVT expression kit (Affymetrix, Santa, Clara, CA). For hybridisation, 15 μg of fragmented RNA was incubated with GeneChip Human Genome U133A 2.0. Microarrays were scanned with Affymetrix GeneChip® scanner 3000 7G (Affymetrix). The scanned images were analysed to generate raw data files saved as CEL files that were used for microarray analysis and statistics. Signal intensities of the microarray were normalized by the robust multiarray average (RMA) normalization method.
Whole exome sequencing
A series of samples was prepared using the TruSeq DNA HT Library Preparation kit, then pooled using the TruSeq Exome Enrichment kit (Illumina), and sequenced on the HiSeq 2000 system (Illumina). Raw FASTQ files were first processed by a proprietary algorithm to filter out mouse sequence contaminations as previously reported. In reference to human reference genome hg19/GRCh37, these data were processed to SNP calling by GATK 1.6.
Copy number analysis
DNA was fragmented, labelled, and hybridised to Affymetrix GeneChip® genome-wide human SNP array 6.0 arrays according to Affymetrix protocols. Data were analyzed using R software (version 2.12). Raw probe intensity data (CEL Files) obtained from the GeneChip Scanner 3000 system (Affymetrix) were imported to R, segmented using CRLMM algorithm and copy number variantion was estimated by the VanillaICE and DNAcopy methods.
Western blot analysis
After protein extraction, the protein concentration was determined using BCA Protein Quantification Kit. The samples (50 μg of protein/lane) were separated on a 12% SDS-PAGE, and then electrophoretically transferred onto polyvinylidene difluoride (PVDF) membranes using a wet transfer system. The membranes were blocked with 5% skim milk in PBS containing 0.1% Tween 20 for 2 hrs and probed with rabbit anti-FGFR3 antibody at 4 oC overnight. After thorough washing, the blots were incubated with fluorescent-conjugated anti-rabbit IgG secondary antibody (1:1000) for 1 hr. The blots were developed and the immunoreactive bands were scanned and observed using an Odyssey Infrared Imaging System. β-actin was used as internal control.
qRT-PCR
qRT-PCR was performed using TaqMan MicroRNA assays (Applied Biosystems, Foster City, CA, USA). U6 snRNA was used as an internal control. The cycle threshold (Ct) was defined as the number of cycles required for the fluorescent signal to cross the threshold in qPCR. Expression of miR-100 was evaluated using delta Ct values, which were calculated by subtracting the CT values of U6 snRNA from those of the miR-100. All samples were run in triplicate in each experiment.
Cell Proliferation and Cell cycle analysis
Colony formation assays were performed in HN-13 cell line after treatment with nano-miR-100, nanoparticle, or control. Growth curve assays were performed in triplicate and quantified using the Vi-Cell XR Cell Viability Analyzer (Beckman Coulter) or in real time in quadruplicate with the xCELLigence System (Roche Applied Science), with the sensitivity of as few as 100 cells per well. xCELLigence plates were seeded with 5,000 and 10,000 cells per well, and growth was reported as the cell index, a dimensionless, relative measure of impedance reflecting viable, adherent cells, with a consistent, logarithmic relationship to cell number. The rate of cell proliferation of HN-13 after treatment was determined using a BrdU incorporation assay kit (Roche, 1647229). HN-13 cells were placed on 96-well plates at a seeding density of 3×10³ cells per well for 24 hrs, and treated with nano-miR-100, nanoparticle, or control for another 24 hrs before applying BrdU labeling solution. BrdU incorporation was detected according to manufacturer's instructions. Cells were trypsinized, fixed, and stained using the standard propidium iodide method 48 hrs after treatment. Cell cycle analysis was performed using BD FACS Diva software.
Cell apoptosis assay
HN-13 cells (2 × 10⁵ cells/well) were seeded into 24-well plates and treated with PMMNCs or PMMNCs-miR100 for 24 hrs. DMEM was used as control and the final concentration of miR-100 in the culture medium was 25 μg·mL-1 in all of the experiments. Cells were resuspended in 100μl of Binding Buffer (BD Biosciences) and treated with 5 μl of FITC Annexin V and 5 μl DAPI (BD Biosciences, final concentration 0.1 μg·mL-1). Subsequently, cells were collected and the apoptotic cells were measured by BSR LSR II flow cytometer (BD Biosciences) after incubation for 15 minutes in the dark. The results were analyzed using Flowjo 7.6.1 software.
Immunofluorescence Staining
Xenograft tissue blocks were cut into 4µm sections for hematoxylin and eosin (H&E)-staining and immunofluorescence staining. The sections were deparaffinized with xylene followed by graded alcohol rinses. Sections were stained with H&E to assess cellular morphology. For immunofluorescence staining, the sections were immersed in citrate buffer (10 mmol·L-1; pH=6) for 20 minutes at 95°C for antigen retrieval and blocked for 20 minutes with PBS containing 3% of bovine serum albumin. Sections were then incubated with specific primary antibodies at 4°C overnight: FGFR3 (Abcam 1:250); Ki67 (Abcam 1:200), and caspase-3 (Abcam 1:100). Double immunostaining was performed with the corresponding secondary antibodies conjugated to FITC (Invitrogen) or Cy3 (Invitrogen) for 1 hr at room temperature. Nuclei were stained with DAPI (Sigma). A Nikon fluorescence microscope was used to visualize fluorescence and acquire images. The immunohistochemistry presented in this study was independently evaluated by two pathologists (Jiang Li and Lizhen Wang). The number of cells was recorded from at least five visual fields of each tumor slide at 20× magnification. The ratio of the marker-positive cells to DAPI-positive cells was used to quantify the FGFR3-positive, Ki67-positive, and caspase 3-positive cells.
Immunofluorescence staining of adhesion cells after treatment was performed as follows: cells were fixed in 4% paraformaldehyde and rewashed with PBS and permeabilized in methanol for 10 minutes at room temperature. After rewashed with PBS and blocked in Odyssey blocking buffer (LI-COR) for 1 hr, cells were incubated overnight at 4 oC with primary antibody CD44 (Abcam 1:100). After rewashed with PBS, cells were then incubated with secondary antibody conjugated to Alexa Fluor 488 (Invitrogen) for 40 min at room temperature. Slides were counterstained with DAPI (Sigma) and mounted in Vectashield anti-fade mounting media (Vector Laboratories). Confocal images were taken with Leica confocal microscope TCS SP8 (Shanghai Institute of Immunology, Shanghai Jiao Tong University School of Medicine).
Statistical analysis
Statistical analysis was carried out using SPSS 10.0. A two-tailed Student's t test, paired Student's t test or one-way analysis of variance (ANOVA) was used for statistical analysis. A probability value of p < 0.05 was considered significant. Statistical software was used for all analyses.
Supplementary Material
Table S1, Fig.S1, Fig.S2, Fig.S3, Fig.S4, Fig.S5, Fig.S6, Fig.S7, and Fig.S8.
Acknowledgements
We greatly thank Dr. Jiang Li and Dr. Lizhen Wang for histochemical diagnosis. This work was supported by grants from the National Natural Science Foundation of China (81572656, 31571018, 81202131), the Science and Technology Commission of Shanghai Municipality (15ZR1443200), the China Postdoctoral Science Foundation (2013M531191), and the Shanghai Postdoctoral Sustentation Fund, China (13R21415100), and Shanghai Summit & Plateau Disciplines.
Competing Interests
The authors have declared that no competing interest exists.
References
1. Lyman GH, Moses HL. Biomarker Tests for Molecularly Targeted Therapies-The Key to Unlocking Precision Medicine. N Engl J Med. 2016;375:4-6
2. Cortés J, Calvo E, Vivancos A. et al. New approach to cancer therapy based on a molecularly defined cancer classification. CA Cancer J. Clin. 2014;64:70-4
3. Turner N, Grose R. Fibroblast growth factor signalling: from development to cancer. Nature reviews. Cancer. 2010;10:116-29
4. Dieci MV, Arnedos M, Andre F. et al. Fibroblast growth factor receptor inhibitors as a cancer treatment: from a biologic rationale to medical perspectives. Cancer Discov. 2013;3:264-79
5. Cancer Genome Atlas. Comprehensive genomic characterization of head and neck squamous cell carcinomas. Nature. 2015;517:576-82
6. Dienstmann R, Rodon J, Prat A. et al. Genomic aberrations in the FGFR pathway: opportunities for targeted therapies in solid tumors. Ann Oncol. 2014;25:552-63
7. Pouessel D, Neuzillet Y, Mertens LS. et al. Tumor heterogeneity of fibroblast growth factor receptor 3 (FGFR3) mutations in invasive bladder cancer: implications for perioperative anti-FGFR3 treatment. Ann Oncol. 2016;27:1311-6
8. Bartel DP. MicroRNAs: target recognition and regulatory functions. Cell. 2009;136:215-33
9. Li Z, Rana TM. Therapeutic targeting of microRNAs: current status and future challenges. Nat. Rev. Drug Discov. 2014;13:622-38
10. Bader AG, Brown D, Winkler M. The promise of microRNA replacement therapy. Cancer Res. 2010;70:7027-30
11. Berindan-Neagoe I, Monroig Pdel C, Pasculli B. et al. MicroRNAome genome: a treasure for cancer diagnosis and therapy. CA Cancer J. Clin. 2014;64:311-36
12. Yin H, Kanasty RL, Eltoukhy AA. et al. Non-viral vectors for gene-based therapy. Nat. Rev. Genet. 2014;15:541-55
13. ChenY Zhu X, Zhang X et al. Nanoparticles Modified With Tumor-targeting scFv Deliver siRNA and miRNA for Cancer Therapy. Mol. Ther. 2010;18:1650-6
14. Liu XQ, Song WJ, Sun TM. et al. Targeted Delivery of Antisense Inhibitor of miRNA for Antiangiogenesis Therapy Using cRGD-Functionalized Nanoparticles. Mol. Pharm. 2011;8:250-9
15. Chiou GY, Cherng JY, Hsu HS. et al. Cationic polyurethanes-short branch PEI-mediated delivery of Mir145 inhibited epithelial-mesenchymal transdifferentiation and cancer stem-like properties and in lung adenocarcinoma. J. Control Release. 2012;159:240-50
16. Deng XW, Cao M, Zhang JK. et al. Hyaluronic acid-chitosan nanoparticles for co-delivery of MiR-34a and doxorubicin in therapy against triple negative breast cancer. Biomaterials. 2014;35:4333-44
17. Chen HP, Liu XP, Dou Y. et al. A pH-responsive cyclodextrin-based hybrid nanosystem as a nonviral vector for gene delivery. Biomaterials. 2013;34:4159-72
18. Crew E, Rahman S, Razzak-Jaffar A. et al. MicroRNA Conjugated Gold Nanoparticles and Cell Transfection. Anal. Chem. 2012;84:26-9
19. Hom C, Lu J, Liong M. et al. Mesoporous Silica Nanoparticles Facilitate Delivery of siRNA to Shutdown Signaling Pathways in Mammalian Cells. Small. 2010;6:1185-90
20. Kim MH, Na HK, Kim YK. et al. Facile Synthesis of Monodispersed Mesoporous Silica Nanoparticles with Ultralarge Pores and Their Application in Gene Delivery. ACS Nano. 2011;5:3568-76
21. Wu MY, Meng QS, Chen Y. et al. Large Pore-Sized Hollow Mesoporous Organosilica for Redox-Responsive Gene Delivery and Synergistic Cancer Chemotherapy. Adv. Mater. 2016;28:1963-9
22. Rosenholm JM, Penninkangas A, Lindén M. Amino-functionalization of large-pore mesoscopically ordered silica by a one-step hyperbranching polymerization of a surface-grown polyethyleneimine. Chem. Commun. 2006:3909-11
23. Daniel VC, Marchionni L, Hierman JS. et al. A primary xenograft model of small-cell lung cancer reveals irreversible changes in gene expression imposed by culture in vitro. Cancer Res. 2009;69:3364-73
24. Gould SE, Junttila MR, de Sauvage FJ. Translational value of mouse models in oncology drug development. Nat. Med. 2015;21:431-9
25. Townsend EC, Murakami MA, Christodoulou A. et al. The Public Repository of Xenografts Enables Discovery and Randomized Phase II-like Trialsin Mice. Cancer Cell. 2016;29:574-86
26. Hidalgo M, Amant F, Biankin AV. et al. Patient-derived xenograft models: an emerging platform for translational cancer research. Cancer Discov. 2014;4:998-1013
27. Aparicio S, Hidalgo M, Kung AL. Examining the utility of patient-derived xenograft mouse models. Nat. Rev. Cancer. 2015;15:311-6
28. Girotti MR, Gremel G, Lee R. et al. Application of Sequencing, Liquid Biopsies, and Patient-Derived Xenografts for Personalized Medicine in Melanoma. Cancer Discov. 2016;6:286-99
29. Gao H, Korn JM, Ferretti S. et al. High-throughput screening using patient-derived tumor xenografts to predict clinical trial drug response. Nat. Med. 2015;21:1318-25
30. Gandara DR, Mack PC, Bult C. et al. Bridging tumor genomics to patient outcomes through an integrated patient-derived xenograft platform. Clin. Lung Cancer. 2015;16:165-72
31. Stewart EL, Mascaux C, Pham NA. et al. Clinical Utility of Patient-Derived Xenografts to Determine Biomarkers of Prognosis and Map Resistance Pathways in EGFR-Mutant Lung Adenocarcinoma. J. Clin. Oncol. 2015;33:2472-80
32. Ambrogio C, Gómez-López G, Falcone M. et al. Combined inhibition of DDR1 and Notch signaling is a therapeutic strategy for KRAS-driven lungadenocarcinoma. Nat. Med. 2016;22:270-7
33. Trubetskoy VS, Wong SC, Subbotin V. et al. Recharging cationic DNA complexes with highly charged polyanions for in vitro and in vivo gene delivery. Gene Ther. 2003;10:261-71
34. Wang F, Pauletti GM, Wang JT. et al. Dual Surface-Functionalized Janus Nanocomposites of Polystyrene/Fe3O4@SiO2 for Simultaneous Tumor Cell Targeting and Stimulus-Induced Drug Release. Adv. Mater. 2013;25:3485-9
35. Shi DL, Cho HS, Chen Y. et al. Fluorescent Polystyrene-Fe3O4 Composite Nanospheres for In Vivo Imaging and Hyperthermia. Adv. Mater. 2009;21:2170-3
36. Cho H, Dong Z, Pauletti GM. et al. Fluorescent, superparamagnetic nanospheres for drug storage, targeting, and imaging: a multifunctional nanocarrier system for cancer diagnosis and treatment. ACS Nano. 2010;4:5398-404
37. Luo B, Xu S, Luo A. et al. Mesoporous Biocompatible and Acid-Degradable Magnetic Clloidoal Nanocrystal Clusters with Sustainable Stability and High Hydrophobic Drug Loading Capacity. ACS Nano. 2011;5:1428-35
38. Devulapally R, Sekar NM, Sekar TV. et al. Polymer Nanoparticles Mediated Codelivery of AntimiR-10b and AntimiR-21 for Achieving Triple Negative Breast Cancer Therapy. ACS Nano. 2015;9:2290-302
39. Meng H, Liong M, Xia T. et al. Engineered Design of Mesoporous Silica Nanoparticles to Deliver Doxorubicin and P-Glycoprotein siRNA to Overcome Drug Resistance in a Cancer Cell Line. ACS Nano. 2010;4:4539-50
40. Mack B, Gires O. CD44s and CD44v6 expression in head and neck epithelia. PLoS One. 2008;3:e3360
41. Sun S, Liu S, Duan SZ. et al. Targeting the c-Met/FZD8 Signaling Axis Eliminates Patient-Derived Cancer Stem-like Cells in Head and Neck Squamous Carcinomas. Cancer Res. 2014;74:7546-59
42. Wang K, Lim HY, Shi S. et al. Genomic landscape of copy number aberrations enables the identification of oncogenic drivers in hepatocellular carcinoma. Hepatology. 2013;58:706-17
43. Swenson S, Costa F, Minea R. et al. Intravenous liposomal delivery of the snake venom disintegrin contortrostatin limits breast cancer progression. Mol. Cancer Ther. 2004;3:499-511
44. Pain and distress in laboratory rodents and lagomorphs. Report of the Federation of European Laboratory Animal Science Associations (FELASA) Working Group on Pain and Distress accepted by the FELASA Board of Management November 1992. Lab. Anim. 1994;28:97-112
45. Wong H, Choo EF, Alicke B. et al. Antitumor activity of targeted and cytotoxic agents in murine subcutaneous tumor models correlates with clinical response. Clin. Cancer Res. 2012;18:3846-55
46. Liu G, Yang D, Rupaimoole R. et al. Augmentation of response to chemotherapy by microRNA-506 through regulation of RAD51 in serous ovarian cancers. J Natl Cancer Inst. 2015:107 pii: djv108
47. Napoli M, Venkatanarayan A, Raulji P. et al. ΔNp63/DGCR8-Dependent MicroRNAs Mediate Therapeutic Efficacy of HDAC Inhibitors in Cancer. Cancer Cell. 2016;29:874-88
48. Park EY, Chang E, Lee EJ. et al. Targeting of miR34a-NOTCH1 axis reduced breast cancer stemness and chemoresistance. Cancer Res. 2014;74:7573-82
Author contact
![]() Corresponding authors: zhzhyedu.cn and donglu.shiedu.
Corresponding authors: zhzhyedu.cn and donglu.shiedu.