Impact Factor
- Issue 13; 2026
- Issue 12; 2026
- Issue 11; 2026
- Issue 10; 2026
- Issue 9; 2026
- Volume 16; 2026
- Advance Articles
- Past Issues
- Cover Images
- Cover Suggestion
- Index & Coverage
- Special Issues
Introduction
Principles and Techniques of...
Clinical Applications of...
Conclusion
Abbreviations
References
International Journal of Biological Sciences
International Journal of Medical Sciences
 Global reach, higher impact

Theranostics 2017; 7(5):1303-1329. doi:10.7150/thno.18650 This issue Cite
Review
Ultrasound Elastography: Review of Techniques and Clinical Applications
Rosa M.S. Sigrist1, Joy Liau1, Ahmed El Kaffas1, Maria Cristina Chammas2, Juergen K. Willmann1 ![]()
1. Department of Radiology, Molecular Imaging Program at Stanford, Stanford University, School of Medicine, Stanford, CA, USA.
2. Department of Ultrasound, Institute of Radiology, Hospital das Clínicas, Medical School of University of São Paulo
Received 2016-12-7; Accepted 2017-1-4; Published 2017-3-7
Abstract

Elastography-based imaging techniques have received substantial attention in recent years for non-invasive assessment of tissue mechanical properties. These techniques take advantage of changed soft tissue elasticity in various pathologies to yield qualitative and quantitative information that can be used for diagnostic purposes. Measurements are acquired in specialized imaging modes that can detect tissue stiffness in response to an applied mechanical force (compression or shear wave). Ultrasound-based methods are of particular interest due to its many inherent advantages, such as wide availability including at the bedside and relatively low cost. Several ultrasound elastography techniques using different excitation methods have been developed. In general, these can be classified into strain imaging methods that use internal or external compression stimuli, and shear wave imaging that use ultrasound-generated traveling shear wave stimuli. While ultrasound elastography has shown promising results for non-invasive assessment of liver fibrosis, new applications in breast, thyroid, prostate, kidney and lymph node imaging are emerging.
Here, we review the basic principles, foundation physics, and limitations of ultrasound elastography and summarize its current clinical use and ongoing developments in various clinical applications.
Keywords: Elastography, Ultrasound, Strain Imaging, Shear Wave Imaging, Liver, Breast, Thyroid, Kidney, Prostate, Lymph nodes.
Introduction
Ultrasound elastography (USE) is an imaging technology sensitive to tissue stiffness that was first described in the 1990s [1]. It has been further developed and refined in recent years to enable quantitative assessments of tissue stiffness. Elastography methods take advantage of the changed elasticity of soft tissues resulting from specific pathological or physiological processes [2]. For instance, many solid tumors are known to differ mechanically from surrounding healthy tissues. Similarly, fibrosis associated with chronic liver diseases causes the liver to become stiffer than normal tissues. Elastography methods can hence be used to differentiate affected from normal tissue for diagnostic applications.
Conventional ultrasound (US) has the advantage of being an inexpensive, versatile, and widely available modality that can be used at the bedside, which also applies to USE. USE has been explored for several clinical applications in recent years and has been introduced into clinical routine for specific applications such as liver fibrosis assessment or breast lesion characterization. Elasticity imaging by USE provides complementary information to conventional US by adding stiffness as another measurable property to current US imaging techniques [3].
In this review, we provide an overview of the principles and concepts of USE, describe various USE techniques, and discuss clinical applications of USE in the liver, breast, thyroid, kidney, prostate and lymph nodes.
Principles and Techniques of Ultrasound Elastography
The following provides a brief summary of USE physics and current techniques. More in depth reviews of elastography physics can be found elsewhere [2, 4, 5].
Ultrasound elastography physics
Elastography assesses tissue elasticity, which is the tendency of tissue to resist deformation with an applied force, or to resume its original shape after removal of the force. Assuming that a material is entirely elastic and its deformation has no time dependency (i.e. viscosity), elasticity can be described by Hooke's Law:
(eqn.1)
where stress (σ) is the force per unit area with units kilopascals (i.e. N/m2) (Figure 1, top row), strain (ε) is the expansion per unit length which is dimensionless (Figure 1, second row), and the elastic modulus (Γ) relates stress to strain with units kilopascals (Figure 1, third row).
Ultrasound elastography physics, deformation models. Static deformations of entirely elastic materials can be described by stress σ (force per unit area, top row), strain ε (expansion per unit length, middle row), and elastic modulus Γ (stress divided by strain, bottom row). This is applied to normal (perpendicular to surface, first column), shear (tangential to surface, second column), and bulk (normal inward or pressure, third column) forces used in ultrasound elastography.
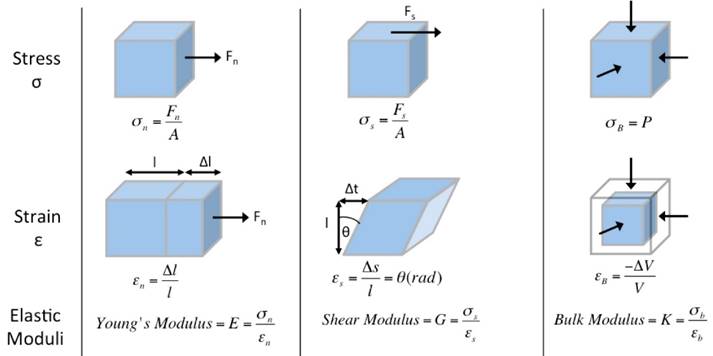
There are three types of elastic moduli Γ defined by the method of deformation: Young's modulus (E), shear modulus (G), and bulk modulus (K).
1) Young's modulus E is defined by the following equation when a normal stress (σn) produces a normal strain (εn), where normal is perpendicular to the surface (Figure 1, first column):
(eqn.2)
2) Shear modulus G is defined by the following equation when a shear stress (σs) produces a shear strain (εs), where shear is tangential to the surface (Figure 1, second column):
(eqn.3)
3) Bulk modulus K is defined by the following equation when a normal inward force or pressure (σB) produces a bulk strain or change in volume (εB) (Figure 1, third column):
(eqn.4)
The higher the elastic modulus Γ, the more a material tends to resist deformation, which can be thought of as increased stiffness.
In strain imaging, the normal strain εn is measured after application of normal stress σn to yield estimates of Young's modulus E via Equation 2, as will be later described.
In addition to the above equations which describe static deformations, the elastic modulus Γ also characterizes the propagation speed of waves:
(eqn.5)
where ρ is the material density and c is the wave speed.
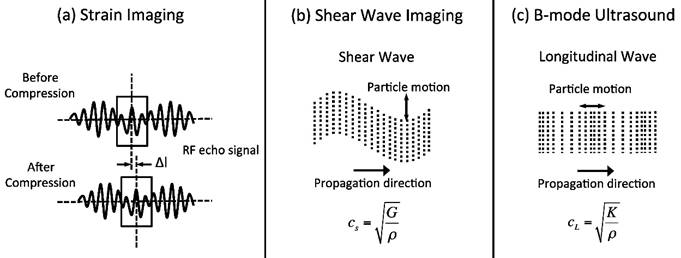
There are two types of wave propagation in ultrasound: longitudinal waves and shear waves:
1) Longitudinal waves have particle motion parallel to the direction of wave propagation (Figure 2c), and are defined using the bulk modulus K as:
Ultrasound elastography physics, measurement methods. In strain imaging (a), tissue displacement is measured by correlation of RF echo signals between search windows (boxes) in the states before and after compression. In shear wave imaging (b), particle motion is perpendicular to the direction of wave propagation, with shear wave speed cS related to shear modulus G. In B-mode ultrasound (c), particle motion is parallel to the direction of wave propagation, with longitudinal wave speed cL related to bulk modulus K.
(eqn.6)
where the longitudinal wave speed (cL) is approximately 1540 m/s in soft tissues. While longitudinal waves are used in B-mode US, the relatively small differences in wave speed and hence K between different soft tissues do not allow adequate tissue contrast for elastography measurements.
2) Shear waves have particle motion perpendicular to the direction of wave propagation (Figure 2b), and are defined using the shear modulus G as:
(eqn.7)
where the shear wave speed (cS) is approximately 1-10 m/s in soft tissues. The low wave speed in soft tissues allows for high differences in G between tissues, giving suitable tissue contrast for elastography measurements.
The three types of deformations and elastic moduli are not independent, but have relationships as the solid attempts to retain its original volume, the success of which is described by the Poisson's ratio (v). Although the proof is outside of the scope of this review, the relationship between Young's modulus E and shear modulus G is as follows [2]:
(eqn.8)
Given the high-water content of soft tissue, the Poisson's ratio v is near 0.5 of an incompressible medium, and E = 3G. Using this with Equation 7, we obtain:
(eqn.9)
where measurement of cS allows estimation of E and G. Density ρ has units kg/m3 and cS has units m/s so ρcS2 has units kg/(m*s2) which is equivalent to N/m2 or kilopascals, the units of E and G.
The relationships between Young's modulus E, shear modulus G, and shear wave speed cS are important because different parameters are reported according to the elastography technique and vendor. MR elastography reports the magnitude of the complex shear modulus G, which has both elastic and viscous components and is calculated from phase-contrast multiphase pulse sequence data [5]. Ultrasound shear wave imaging directly measures shear wave speed cS, which is either reported or converted to Young's modulus E. While it is technically easy to convert between E and G via equation 9, estimations of these values depend on the used frequency of excitation, making comparison of E reported in USE and G in MR elastography difficult.
Prior USE studies have reported results in varying units, including Young's modulus E in kilopascal and shear wave speed cS in m/s or cm/s. A recent consensus advocates reporting results as shear wave speed cS in m/s as part of a standardized approach [6]. To convert units from Young's modulus E in kilopascal and shear wave speed cS in m/s, Equation 9 can be rewritten as:
(eqn.10)
Young's modulus E is given in kilopascals, which is equal to N/m2 or kg/(m*s2). Since density ρ has units kg/m3, the units of the term E/(3ρ) is m2/s2. Per Equation 10, taking the square root of the term E/(3ρ) yields shear wave speed cS in the preferred unit of m/s.
Ultrasound elastography techniques
From these principles, the different currently available USE techniques can be classified by the measured physical quantity (Figure 3):
Ultrasound Elastography Techniques. Currently available USE techniques can be categorized by the measured physical quantity: 1) strain imaging (left), and 2) shear wave imaging (right). Excitations methods include quasi-static mechanically-induced displacement via active external compression or passively-induced physiologic motion (orange), dynamic mechanically-induced compression via a “thumping” transducer at the tissue surface to produce shear waves (green), and dynamic ultrasound-induced tissue displacement and shear waves by acoustic radiation force impulse excitation (blue).
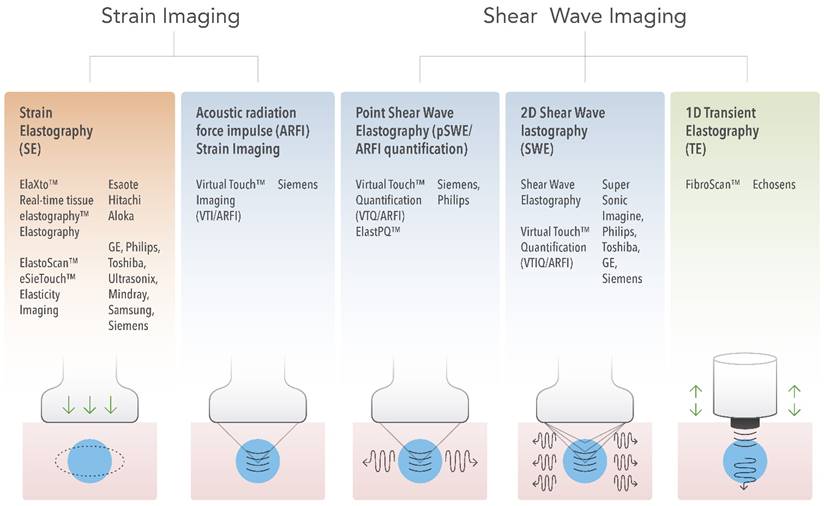
1) Strain imaging: In this technique, a normal stress σn is applied to tissue and the normal strain εn is measured (Figure 1, first column); Equation 2 is used to provide a qualitative evaluation of Young's modulus E.
2) Shear wave imaging (SWI): In this technique, a dynamic stress is applied to tissue by using a mechanical vibrating device in 1D transient elastography (1D-TE) or acoustic radiation force in point shear wave elastography (pSWE) and 2D shear wave elastography (2D-SWE). Shear waves created by the excitation are measured perpendicular to the acoustic radiation force application or parallel to the 1D transient elastography excitation; the shear wave speed cs is reported, or Young's modulus E is computed and reported using Equation 9.
Strain imaging
Strain imaging was the first introduced USE technique [7] and there are two approaches for strain imaging using ultrasound: Strain elastography (SE) and acoustic radiation force impulse (ARFI) strain imaging (Figure 3).
Strain Elastography
Strain elastography can be further subdivided by the excitation method:
1) In the first method, the operator exerts manual compression on the tissue with the ultrasound transducer [7]. Manual compression works fairly well for superficial organs such as the breast and thyroid but is challenging for assessing elasticity in deeper located organs such as the liver [8].
2) In the second excitation method, the ultrasound transducer is held steady, and tissue displacement is generated by internal physiologic motion (e.g. cardiovascular, respiratory). Since this method is not dependent on superficially applied compression, it may be used to assess deeper located organs [1].
The induced tissue displacement in the same direction as the applied stress is then measured by a number of different methods dependent on the manufacturer, including radiofrequency (RF) echo correlation-based tracking, Doppler processing, or a combination of the two methods. We review RF echo correlation-based tracking, one of the most common and simplest methods. In this method, 2D RF A-lines are measured along the axis of displacement (Figure 2a). Correlation of the RF echo signal between search windows in different acquisitions allows measurement of the tissue displacement Δl and estimation of the normal strain εn (Figure 1).
The manually or physiologically applied stress is not quantifiable, but by assuming uniform normal stress σn, the measured normal strain εn provides a qualitative measure of Young's modulus E and thus tissue elasticity (Figure 1, first column, last row) [9]. The strain measurements are displayed as a semitransparent color map called an elastogram, which is overlaid on the B-mode image. Typically, low strain (stiff tissue) is displayed in blue, and high strain (soft tissue) is displayed in red, although the color scale can vary depending on the ultrasound vendor [1, 10]. A pseudo-quantitative measurement called the strain ratio can be used, which is the ratio of strain measured in adjacent (usually normal) reference tissue region of interest (ROI) to strain measured in a target lesion ROI. A strain ratio >1 indicates that the target lesion compresses less than the normal reference tissue, indicating lower strain and greater stiffness [11].
Acoustic radiation force impulse (ARFI) strain imaging
This is an alternative approach for measuring strain. In this technique a short-duration (0.1-0.5 ms) high-intensity (spatial peak pulse average = 1400 W/cm2, spatial peak temporal average = 0.7 W/cm2) acoustic “pushing pulse” (acoustic radiation force) is used to displace tissue (displacement of ~ 10-20 μm) in the normal direction, i.e. perpendicular to the surface [12]. The displacement within a specified ROI is subsequently measured by the same methods as in strain elastography. Also, similar to strain elastography, the displacements may be displayed as an elastogram overlaid on the B-mode image [13]. This imaging approach is implemented for example as Siemens Virtual TouchTM Imaging (VTI).
Shear wave imaging
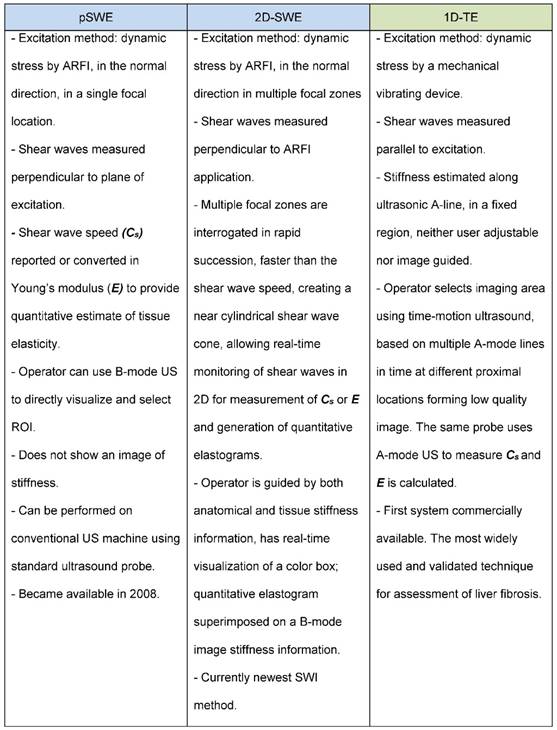
In contrast to strain imaging, which measures physical tissue displacement parallel to the applied normal stress, SWI employs a dynamic stress to generate shear waves in the parallel or perpendicular dimensions. Measurement of the shear wave speed results in qualitative and quantitative estimates of tissue elasticity. There are currently three technical approaches for SWI: 1) 1 dimensional transient elastography (1D-TE), 2) point shear wave elastography (pSWE), and 3) 2 dimensional shear wave elastography (2D-SWE) (Figure 3). The main characteristics of each method are summarized in Figure 4.
Summary of Shear Wave Imaging methods.
1D Transient Elastography
The first SWI system commercially available was a 1D-TE system FibroScanTM (Echosens, Paris, France) for assessment of the liver [14]. It is the most widely used and validated technique for assessment of liver fibrosis, and it is often used by clinicians in the office.
The FibroscanTM probe is a single device that contains both an ultrasound transducer and a mechanical vibrating device. Although 1D-TE is an US-based technique, it is used without direct B-mode image guidance. The operator selects the imaging area using time-motion ultrasound (based on multiple A-mode lines in time at different proximal locations assembled to form a low quality image) to locate a liver portion 2.5 - 6.5 cm below the skin surface and free of large vascular structures. The mechanical vibrating device then exerts a controlled vibrating external “punch” on the body surface to generate shear waves which propagate through the tissue. The same probe then uses A-mode US to measure the shear wave speed and Young's modulus E is calculated [15]. Measurements assess a tissue volume of approximately 1 cm wide x 4 cm long, which is >100 times larger than the average volume of a biopsy sample [16, 17]. The examiner takes repeated measurements with the following criteria for validation: (1) at least 10 valid measurements, (2) ratio of number of valid measurements to the total number of measurements is ≥ 60%, (3) interquartile range (IQR), which reflects the variability of measurements, is less than 30% of the median value of liver stiffness measurements [16]. The entire exam takes approximately 5 minutes [17].
Point shear wave elastography
In this technique, ARFI is used to induce tissue displacement in the normal direction in a single focal location, similar to ARFI strain imaging. Unlike ARFI strain imaging, the tissue displacement itself is not measured. Instead, a portion of the longitudinal waves generated by ARFI is intra-converted to shear waves through the absorption of acoustic energy [12]. The speed of the shear waves perpendicular to the plane of excitation cs are measured, which are either directly reported or converted Young's modulus E and reported to provide a quantitative estimate of tissue elasticity.
Unlike 1D-TE, pSWE can be performed on a conventional ultrasound machine using a standard ultrasound probe [17].
In liver applications, there are several advantages of pSWE compared to 1D-TE. First, the operator can use B-mode US to directly visualize the liver to select a uniform area of liver parenchyma without large vessels or dilated bile ducts. Also, unlike 1D-TE where the shear waves are produced by excitation at the body surface, pSWE produces shear waves which originate locally inside the liver, making pSWE less affected by ascites and obesity [5, 6, 18].
Currently, there are two commercially available products using pSWE: Virtual TouchTM Quantification (VTQ/ARFI) by Siemens available since 2008 and the newer Elast-PQTM by Philips introduced in 2013.
Two-dimensional (2D) Shear wave elastography
Two-dimensional (2D) SWE is the currently newest SWI method that uses acoustic radiation force. Instead of a single focal location as in ARFI strain imaging and pSWE, multiple focal zones are interrogated in rapid succession, faster than the shear wave speed. This creates a near cylindrical shear wave cone, allowing real-time monitoring of shear waves in 2D for measurement of shear wave speed or Young's modulus E and generation of quantitative elastograms [4]. To date, the following commercially available systems use 2D-SWE technology: Virtual TouchTM Imaging Quantification (VTIQ/ARFI) by Siemens, Shear WaveTM Elastography by SuperSonic Imagine (SSI), Shear Wave Elastography by Philips, Acoustic Structure QuantificationTM (ASQ) by Toshiba, and 2D-SWE by GE Healthcare [2, 4].
The advantages of this technique include real-time visualization of a color quantitative elastogram superimposed on a B-mode image [19], enabling the operator to be guided by both anatomical and tissue stiffness information [20].
Technical Limitations of Ultrasound Elastography
With a growing clinical interest in developing new USE applications, or refining existing ones, it is essential to understand current technical limitations that hinder reproducibility of measurements. Several technical confounders are known to affect USE. A number of these can be traced back to general sonography limitations such as shadowing, reverberation, and clutter artifacts, or the operator-dependent nature of free-hand ultrasound systems [6, 21]. Similarly, tissue attenuation decreases ultrasound signal as a function of depth, limiting accurate assessment of deeper tissue or organs. Fluid or subcutaneous fat also attenuates propagation of the external stimulus applied at the skin surface (i.e. FibroscanTM), which can invalidate measurements in the setting of obesity or abdominal ascites [21]. System settings and parameters (i.e. ultrasound frequency, sampling rate, gains, etc.) can also produce biased results if not standardized across patient groups and time points in longitudinal applications. In addition, the lack of uniformity of commercial system design and settings makes comparing measurements from one manufacturer system to another a difficult task [4, 6, 19, 21, 22]. However, efforts are underway to address some of these concerns; for example, an initiative by the Quantitative Imaging Biomarkers Alliance (QIBA) is attempting to use phantoms to standardize quantitative measurements from different USE techniques [22, 23].
Of the USE methods described above, measurements from methods that utilize external stimuli, such as strain elastography, are the most challenging to reproduce. Measurements in these modes are highly subjective since the magnitude of the applied stress is difficult to control with operator dependent manual compression and the inherent variability of physiologic motion when used as a stimulus. Selection of the ROI is also operator dependent and can introduce variability [18]. In addition, the extent of stress induced by an operator can result in strain concentration artifacts around specific structures, which then distort the strain field and generate artifacts in images or erroneous measurements [6, 19, 24]. As a result, SE methods only allow semi-quantitative assessments of stiffness that are difficult to compare longitudinally. Elastography in general is also susceptible to internal sources of stress (i.e. cardiac, breathing). For example in liver applications, it is preferable to measure stiffness in the right lobe over the left lobe to minimize internal stimulations generated by the nearby palpating heart which can result in erroneous measurements. In the case of elastography modes that utilize internal sources of excitation stress (i.e. cardiac) that cannot be regulated by the operator, it is important to note that these stresses are complex, difficult to quantify and variable through time (as a function of physiology), thus can tamper with measured strain responses.
Furthermore, commercially available USE modes rely on a set of assumptions about the tissue material being examined to simplify analysis and interpretation of measurements/imaging. Core assumptions are that the tissue is:
- linear; resulting strain linearly increases as a function of incremental stress (Equation 1)
- elastic; tissue deformation is not dependent on stress rate, and tissue returns to original non-deformed equilibrium state
- isotropic; the tissue is symmetrical/homogeneous and responds to stress the same from all directions
- incompressible; the overall volume of tissue remains the same under stress applied.
To date, these assumptions have held in specific clinical scenarios (i.e. fibrosis), but have been shown to fail in other imaging applications (i.e. in patients with high body mass index) [4, 21]. In principle, these assumptions violate conventional models that describe soft tissue mechanical properties as complex and heterogeneous materials that have both a viscous and an elastic mechanical response when probed [21]. For instance, linearity breaks down since the force-deformation relationship changes as a function of stress; tissue stiffness increases with compression, leading to decreased strain and increased shear wave speed [2, 4]. The assumption that tissue is isotropic (homogeneous) is violated at tissue interfaces, where shear wave reflection at structural interfaces may lead to incorrect speed estimates [2]. Similarly, incompressibility is incorrect since tissues can lose volume when compressed (usually in the form of fluids). Finally, the assumption of pure tissue elasticity neglects the presence of tissue viscosity, which introduces a dependency of shear wave speed on excitation frequency. This dependency complicates comparison of shear wave speed measurements among different US vendors that use different excitation frequencies [2, 23]. Also, although assumptions made to date facilitate the process of elastography imaging/measurements, these are likely inaccurate depictions of tissue mechanics. The adoption of elastography to new clinical applications, such as characterizing highly heterogeneous tumor masses or organs, will likely require the adoption of more complex modeling that accounts for tissue viscoelasticity [25, 26]. This is in part due to a tumor's highly heterogeneous microenvironment, which contains stiff elastic regions (e.g., fibrosis, calcifications) as well as soft viscous regions (e.g., blood pools, cystic degeneration areas) with variations at different length-scales [27-29].
Nonetheless, USE is a promising method undergoing rapid development and active research. Despite limitations detailed above, USE has great clinical promise as measurements have shown remarkable correlation to diffuse and focal disease states in multiple organs.
With an understanding of the basic USE physical principles and techniques, we next review the performance of USE in the liver, breast, thyroid, kidney, prostate, and lymph nodes.
Clinical Applications of Ultrasound Elastography
Liver
Diffuse Liver Disease
Chronic liver disease (CLD) is a major public health problem throughout the world. In the United States, CLD was the 12th leading cause of death in 2013, accounting for 1.4% of all deaths [30]. The multiple causes of CLD (including hepatitis viral disease, nonalcoholic fatty liver disease, alcoholic liver disease and autoimmune liver disease) follow a common pathway towards liver fibrosis and finally cirrhosis, increasing the risk for the development of portal hypertension (PH), hepatic insufficiency, and hepatocellular carcinoma (HCC) [31]. Nonetheless, hepatic fibrosis can be reversed, stabilized, or prevented if the underlying cause of liver fibrosis is removed and/or the patient is treated with immunosuppressive, anti-inflammatory, or anti-viral drugs or by new adjunctive anti-fibrotic agents such as anti-oxidants and angiotensin inhibitors [32].
Currently, liver biopsy is the best available reference standard for evaluating and classifying stages of liver fibrosis/cirrhosis, with the METAVIR score being the most widely used histopathologic grading system. According to this system, the fibrosis stages are: F0= normal liver, F1= minimal fibrosis, F2= significant fibrosis, F3= severe fibrosis and F4= cirrhosis. However, liver biopsy has several limitations. It is invasive and can cause minor complications including temporary pain in approximately 20% of cases. Major complications, such as bleeding, hemobilia, bile peritonitis, bacteremia, sepsis, pneumothorax, hemothorax and even death, occur in 1.1% of liver biopsies [33]. Liver biopsy is also limited by under-sampling, with a typical biopsy core only representing roughly 1/50,000 of the entire liver volume [19, 34]. Inter-observer agreement among pathologists in grading liver fibrosis/cirrhosis is also not perfect, with kappa statistic ranging from 0.5 to 0.9, depending on the pathologist's expertise [35].
Accurate staging of liver fibrosis/cirrhosis is important since treatment recommendations vary by the type of CLD. Evidence supports treatment for all patients infected with Hepatitis C virus (HCV). However, in places where resources are limited, the stage of liver fibrosis is used to prioritize treatment. For example, patients with F3 or F4 fibrosis are at the highest priority for treatment due to the risk of severe complications, whereas those with F2 fibrosis are at high but lesser priority for treatment owing to relatively lower risk of complications [36]. For Hepatitis B virus (HBV), patients with a minimum F2 fibrosis and HBV DNA > 2000 IU/ml are being considered for antiviral therapy even if their alanine aminotransferase (ALT) levels are below two times the upper limits of normal [37]. A quantitative non-invasive test such as USE that allows accurate longitudinal monitoring of liver stiffness would be clinically helpful with these therapeutic decisions.
Since the liver becomes stiffer as fibrosis progresses due to collagen deposition and microstructural changes, USE has the potential to monitor these histopathologic changes through noninvasive quantitative measures of liver stiffness, using different stiffness cut-off values to simulate the METAVIR score. However, USE has limitations distinguishing between consecutive stages that will be described further below.
Assessment of Liver Fibrosis with Different Liver Elastography Techniques
A standardized liver elastography technique is critical to obtain reliable and accurate results. The patient is imaged in supine or slight (30º) left lateral decubitus position, with the right arm elevated above the head to open the intercostal spaces and improve the acoustic window to the liver. Since cardiac motion can confound elastography measurements, it is recommended to sample measurements in the right liver lobe, which has shown the most reliable results [38, 39]. Transducer pressure on the skin should be similar to regular anatomical B-mode imaging. When using SWE techniques, the acoustic radiation force push pulse should be applied perpendicular to the liver capsule, with measurements obtained 4-5 cm deep to the skin and within a minimum 1-2 cm of liver parenchyma to limit refraction of the pulse. Since the assessed tissue extends 1.0 cm above and below the user-designated ROI, the operator should verify that these areas are free of vascular and biliary structures and rib shadows. Furthermore, the patient needs to be coached in breathing (to stop breathing at the end of normal expiration or inspiration) so measurements are taken in a neutral position, as Valsalva maneuver or deep expiration can falsely increase stiffness measurements [6].
Liver 1D Transient Elastography
One dimensional TE studies have found that liver stiffness values correlated with histopathologic fibrosis stages in CLD patients (Table 1). A recent large multicenter 2-phase study in the United States in patients with HCV (n = 700) or HBV (n = 53) compared 1D-TE with liver biopsy. In phase 1 of the study optimal stiffness cut-off values for identification of F2 to F4 fibrosis were identified, and in phase 2 the cut-off values were tested in a second and different patient cohort (Table 1,[40]). 1D-TE showed reasonably high area under the receiver operating characteristic curves (AUROCs) in the HCV group (AUROC F≥2 0.89, F≥3 0.92, F4 0.92) and in the HBV group (F≥2 0.73, F≥3 0.83, F4 0.90), confirming previous results indicating that 1D-TE allows staging of significant fibrosis [41, 42]. A meta-analysis comprised of mostly Asian studies using 1D-TE with 2772 chronic HBV patients found similar results (AUROC F≥2 0.86, F≥3 0.89, F4 0.93) (Table 1,[43]). Another meta-analysis of 50 studies in patients with various etiologies of CLD (n=518) using liver biopsy as the reference standard highlighted that 1D-TE was more accurate in diagnosing F4 fibrosis than F2 or F3 fibrosis (AUROC F4 0.93 vs. F≥2 0.87, F≥3 0.91), regardless of the underlying cause of liver disease (Table 1,[17]). Overall, 1D-TE is considered useful to diagnose cirrhosis (F4 fibrosis) and for distinguishing significant (≥ F2) from non-significant (F0 and F1) fibrosis. However, distinguishing between individual fibrosis stages is still not well validated.
Summary of ultrasound elastography studies assessing liver fibrosis in chronic liver disease.
| Sens. | Specif. | |||||||
|---|---|---|---|---|---|---|---|---|
| Disease | Nº Patients | Techniq. | Parameter | Cut-off | AUC | (%) | (%) | Author |
| HCV | 183 | 1D-TE | LSM (kPa) | 7.1 (F≥2) | 0.83 | 67 | 89 | Castera et al., 2005 |
| 9.5 (F≥3) | 0.9 | 73 | 91 | |||||
| 12.5 (F=4) | 0.95 | 87 | 91 | |||||
| HCV | 327 | 1D-TE | LSM (kPa) | 8.8 (F≥2) | 0.89 | 56 | 91 | Ziol et al., 2005 |
| 9.6 (F≥3) | 0.91 | 86 | 85 | |||||
| 14.6 (F=4) | 0.97 | 86 | 96 | |||||
| HBV | 2772 | 1D-TE | LSM (kPa) | 7.9 (F≥2) | 0.86 | 74.3 | 78.3 | Chon et al., 2012 |
| 8.8 (F≥3) | 0.89 | 74 | 63.8 | |||||
| 11.7 (F=4) | 0.93 | 84.6 | 81.5 | |||||
| CLD | 518 | pSWE | SWV (m/s) | 1.34 (F≥2) | 0.87 | 79 | 85 | Friedrich et al., 2012 |
| 1.55 (F≥3) | 0.91 | 86 | 86 | |||||
| 1.8 (F=4) | 0.93 | 92 | 86 | |||||
| HCV, HBV | 188 (1) | 1D-TE | LSM (kPa) | 8.4 (F≥2) | 0.89 (1) | 81.9 | 70 | Afdhal et al., 2015 |
| 0.73 (2) | 57.9 | 74.9 | ||||||
| 560 (2) | 9.6 (F≥3) | 0.92 (1) | 88.3 | 81.9 | ||||
| 0.83 (2) | 71.8 | 80.1 | ||||||
| 12.8 (F=4) | 0.92 (1) | 84.2 | 86 | |||||
| 0.90 (2) | 75.9 | 85.1 | ||||||
| CLD | 349 | 2D-SWE | LSM (kPa) | 8.0 (F≥2) | 0.89 | 83 | 82 | Cassinotto et al., 2014 |
| 8.9 (F≥3) | 0.92 | 90 | 81 | |||||
| 10.7 (F=4) | 0.92 | 85 | 83 | |||||
| 1D-TE | LSM (kPa) | 8.5 (F≥2) | 0.83 | 76 | 81 | |||
| 8.5 (F≥3) | 0.86 | 88 | 71 | |||||
| 14.5 (F=4) | 0.9 | 77 | 91 | |||||
| pSWE | SWV (m/s) | 1.38 (F≥2) | 0.81 | 72 | 81 | |||
| 1.5 (F≥3) | 0.89 | 79 | 81 | |||||
| 1.61 (F=4) | 0.9 | 81 | 77 | |||||
| CLD | 120 (intention to diagnose) | 2D-SWE | LSM (kPa) | 12.4 (F≥2) | 0.87 | __ | __ | Gerber et al.,2015 |
| 21.6 (F≥3) | 0.91 | __ | __ | |||||
| 26.5 (F=4) | 0.88 | __ | __ | |||||
| 1D-TE | LSM (kPa) | 10 (F≥2) | 0.91 | __ | __ | |||
| 26.3 (F≥3) | 0.94 | __ | __ | |||||
| 33 (F=4) | 0.89 | __ | __ | |||||
| pSWE | SWV (m/s) | 1.76 (F≥2) | 0.92 | __ | __ | |||
| 2.47 (F≥3) | 0.93 | __ | __ | |||||
| 2.89 (F=4) | 0.9 | __ | __ | |||||
| CLD | 1163 | 1D-TE | LSM (kPa) | (F≥2) | __ | 78 | 84 | Bota et al.,2013 |
| (F=4) | __ | 89 | 87 | |||||
| pSWE | SWV (m/s) | 1.3 (F≥2) | __ | 74 | 83 | |||
| 1.8 (F=4) | __ | 87 | 87 | |||||
LSM = Liver stiffness measurement; No data available = '—'.
Liver Point Shear Wave Elastography
Published pSWE studies have overall shown good results in assessing liver fibrosis, with most studies using VTQ/ARFI (Table 1). A meta-analysis of pSWE (VTQ/ARFI) studies including 518 patients with biopsy-proven CLD predominantly from HCV showed AUROCs of F≥2 0.87, F≥3 0.91 and F=4 0.93 (Table 1,[17]). The same meta-analysis compared a subset of 312 patients that were assessed with both pSWE (VTQ/ARFI) and 1D-TE (FibroScanTM), and found that 1D-TE was slightly more accurate than pSWE in diagnosing significant fibrosis (AUROC of 0.92 vs. 0.87) and cirrhosis (0.97 vs. 0.93) (Table 1,[17]). In contrast, another meta-analysis which included 1163 patients with CLD found that pSWE (VTQ/ARFI) showed similar predictive value to that of 1D-TE for significant fibrosis (AUROC 0.74 vs. 0.78) and cirrhosis (0.87 vs. 0.89) (Table1,[44]).
Liver 2D Shear Wave Elastography
Among the four US systems that have 2D-SWE (as described above), Shear WaveTM Elastography by SuperSonic Imagine (SSI) is currently the most validated system for assessing liver fibrosis. The first study comparing 2D-SWE (SSI) and 1D-TE was performed in 121 patients with chronic HCV using liver biopsy as a reference standard. 2D-SWE was more accurate than 1D-TE in assessing significant fibrosis (F≥2) (AUROC of 0.92 vs. 0.84; p=0.002) [20], with the optimal cut-off values for 2D-SWE summarized in Table 2. In an intra-individual prospective comparison study comparing 2D-SWE (SSI), pSWE (VTQ/ARFI) and 1D-TE (FibroscanTM) in 349 consecutive patients and using liver biopsy as gold standard, 2D-SWE was shown to have higher diagnostic accuracy than 1D-TE in the diagnosis of severe fibrosis (F≥3) (AUROC of 0.93 vs. 0.87; p=0.0016, respectively) and higher than pSWE in the diagnosis of significant fibrosis (F≥2) (AUROCs of 0.88 vs. 0.81; p = 0.0003, respectively). The optimal cut-off values used in this study are summarized in Table 1 [45]. In another study (Table 1, [46]) there was no significant difference in AUROCs for 2D-SWE, pSWE, and 1D-TE in the diagnosis of significant fibrosis (F≥2: 0.87, 0.92, 0.91), advanced fibrosis (F≥3: 0.91, 0.93, 0.94) and liver cirrhosis (F=4: 0.88, 0.90, 0.89), respectively between the three methods.
Summary of cut-off values for fibrosis staging according to manufacturers/literature.
| US based method | F≥2 | F≥3 | F=4 |
|---|---|---|---|
| pSWE - VTQ/ARFI - Siemens (Friedrich et al., 2012) | 1.34 m/s (5.7 kPa) | 1.55 m/s (7.3 kPa) | 1.8 m/s (10 kPa) |
| pSWE - ElastPQTM - Philips* | 1.37 m/s (5.7 kPa) | 2.00 m/s (12 kPa) | 2.64 m/s (21.0 kPa) |
| 2D-SWE - GE * | 1.66 m/s (8.3 kPa) | 1.77 m/s (9.4 kPa) | 1.99 m/s (11.9 kPa) |
| 2D-SWE - SSI (Ferraioli et al., 2012) | 1.50 m/s (7.1 kPa) | 1.70 m/s (8.7 kPa) | 1.90 m/s (10.4 kPa) |
| 2D-SWE - ASQTM - Toshiba* | n/a | n/a | 2.23 m/s (15 kPa) |
| TE - FibroScan TM - Echosens (Afdhal et al, 2015) | 1.67 m/s (8.4 kPa) | 1.70 m/s (9.6 kPa) | 2.10 m/s (12.8 kPa) |
* Value provided by manufacture
Comparing results obtained by the different elastography techniques is challenging because terminology, reported parameters, shear-wave frequency, and other technical factors are not standardized [24]. For example, some SWE-based techniques report different units (e.g., m/s or kPa) [6] and apply different cut-off values which are defined by each manufacturer and can vary between systems as summarized in Table 2. In an attempt to quantify the differences between commercial clinical shear wave speed (SWS)-capable systems (FibroscanTM, Philips, Siemens S2000, SSI Aixplorer) as well as experimental systems, the Ultrasound Shear Wave Speed technical committee of the Radiological Society of North America Quantitative Imaging Biomarker Alliance (QIBA) used dynamic mechanical tests of phantom materials. Shear wave speed was estimated in pairs of phantoms (one soft and one hard phantom) in three depths. There was a statistically significant difference in SWS estimates among systems and with depth into the phantom (demonstrated with all imaging systems). The results show that the differences in measurements between machines and observers can vary on the order of 12%; these findings have yet to be validated in clinical studies [6].
Quantification of Portal Hypertension
Portal hypertension (PH) is one of the most important complications of CLD and cirrhosis. When portal pressures and hepatic venous pressure gradient (HVPG) rise to a level the body cannot compensate for, complications such as ascites, variceal bleeding, and hepatic encephalopathy may develop [47]. At an HVPG ≥ 10 mmHg, patients have clinically significant PH and are at high risk of developing varices. At an HVPG ≥ 12 mmHg, PH is defined to be severe with an increased risk for acute variceal bleeding, which bears a mortality rate of approximately 15% [48]. The gold standards to assess PH in cirrhotic patients are the direct measurement of HVPG using angiographic techniques as well as upper gastrointestinal endoscopy to assess for the presence and grade of esophageal varices [49]; both are invasive tests.
Ultrasound elastography may become a non-invasive alternative by measuring liver stiffness (LS) and/or spleen stiffness (SS). In SS, the same techniques are applied in the spleen as described above for the liver. Recent studies using 1D-TE found that LS was more accurate than SS for the diagnosis of clinically significant PH (AUROCs of 0.95 vs. 0.85 [50]; 0.78 vs. 0.63 [51]). In contrast, another study in 60 cirrhotic patients examined with pSWE and using HVPG as a reference standard found that SS was the most accurate test in diagnosing both clinically significant (AUROC: 0.943) and severe PH (AUROC: 0.963) [47]. In that study, SS cut-off values of 3.36 m/s and 3.51 m/s identified patients with esophageal varices and high-risk esophageal varices, respectively, with a negative predictive value of 96.6% and 97.4% respectively. Several additional studies have found SS to be predictive of esophageal varices. For example, a study using pSWE of the spleen in 340 cirrhotic patients and 16 healthy volunteers with invasive endoscopy as the reference standard found that a shear wave velocity cut-off value of 3.30 m/s identified high risk esophageal varices with a negative predictive value, sensitivity and accuracy of 0.994, 0.989 and 0.721 respectively [52]. Overall results suggest that both SS and LS are promising parameters that may allow non-invasive screening for PH and the presence of esophageal varices. Additional studies are needed to further validate current results and to assess whether LS, SS, or the combination of the two result in the most accurate assessment.
Characterization of Focal Liver Lesions
Currently, the use of ultrasound elastography for characterization of focal liver lesions (FLLs) is still investigational but a few studies have shown promising results (Table 3).
Summary of ultrasound elastography studies assessing malignancy of masses in the liver, breast, thyroid, kidney, prostate, and lymph nodes.
| No. | Sensitivity | Specificity | ||||||
|---|---|---|---|---|---|---|---|---|
| Patients | Lesions | Malignant | Technique | Parameter | (%) | (%) | Author | |
| Liver | 384 | 448 | 228 | 1D-TE pSWE | __ | 85 | 84 | Ma et al., 2013 |
| 134 | 134 | 41 | pSWE | SWV (m/s) | 83.3 | 77.9 | Guo et al., 2015 | |
| SWV ratio | 59.6 | 77.3 | ||||||
| 373 | 373 | 290 | pSWE | Stif. value | 74 | 84 | Lu et al., 2015 | |
| Stif. ratio | 82 | 28 | ||||||
| 117 | 117 | __ | pSWE | SWV (m/s) | 97 | 66 | Goya et al., 2015 | |
| 140 | 154 | 112 | pSWE | SWV (m/s) | 81.3 | 92.9 | Zhang et al., 2015 | |
| 81 | 62 | 24 | pSWE | SWV (m/s) | no stat. dif. | no stat. dif. | Heide et al., 2010 | |
| 75 | 79 | 36 | pSWE | SWV (m/s) | no stat. dif. | no stat. dif. | Frulio et al., 2013 | |
| Breast | 143 | 143 | 48 | SE | EI/B-mode ratio | 98 | 87 | Barr, 2015 |
| 100 | 114 | 33 | SE | ES | 69.7 | 95.1 | Mohey et al., 2014 | |
| 370 | 401 | 155 | SE | ES | 72.3 | 91.9 | Zhi et al., 2012 | |
| 1874 | 2087 | 667 | SE | SR | 88 | 83 | Sadigh et al., 2012 | |
| 395 | 450 | 131 | SE | EI/B-mode ratio | 98 | 72 | ||
| 4266 | 4713 | __ | SE | ES | 83 | 84 | Gong et al., 2011 | |
| SR | 88 | 81 | ||||||
| 201 | 201 | 116 | SE | SR | 95 | 74 | Fischer et al., 2011 | |
| 208 | 251 | 54 | SE | EI/B-mode ratio | 100 | 95 | Barr, 2010 | |
| 135 | 111 | 52 | SE | ES | 86.5 | 89.8 | Itoh et al., 2006 | |
| 143 | 143 | 48 | SWI | SWV (m/s) | 93 | 89 | Barr, 2015 | |
| 82 | 83 | 38 | SWI | max. stif. | 94 | 73 | Feldmann et al., 2015 | |
| 2424 | 2584 | 1244 | SWI | max. stif. (kPa) | 93 | 81 | Chen et al., 2014 | |
| mean stif. (kPa) | 94 | 71 | ||||||
| Thyroid | 530 | 639 | 153 | SE | ES and/or stif. index | 92 | 90 | Bojunga et al., 2010 |
| 676 | 703 | 217 | SE | ES (4 point) | 65.4 | 58.2 | Moon et al., 2012 | |
| ES (5 point) | 15.7 | 95.3 | ||||||
| 706 | 912 | 86 | SE | ES | 80.2 | 70.3 | Azizi et al., 2013 | |
| 446 | 498 | 126 | SE | ES | 81 | 62 | Trimboli et al., 2012 | |
| 2147 | 2436 | 745 | pSWE | SWV (m/s) | 80 | 85 | Zhan et al., 2015 | |
| 1451 | 1617 | __ | pSWE | YM (kPa) | 86.3 | 89.5 | Dong et al., 2015 | |
| 35 | 35 | 11 | 2D-SWE | YM (kPa) | 82 | 88 | Samir et al., 2015 | |
| Kidney | 60 | 60 | 36 | SWI | SWV (m/s) | 88 | 54 | Goya et al., 2015 |
| 42 | 42 | 12 | SWI | SWV (m/s) | no stat. dif. | no stat. dif. | Guo et al., 2014 | |
| 71 | 71 | 42 | SE | Strain Index Value | 82.9 | 82.7 | Onur, et al., 2015 | |
| 47 | 47 | 19 | SE | SR | 95 | 100 | Tan et al.,2013 | |
| Prostate | 184 | 1040* | 129* | SWI | YM (kPa) | 96 | 85 | Correas et al., 2015 |
| 87 | 1058* | 79* | SWI | YM (kPa) | 43 | 80.8 | Woo et al., 2014 | |
| 53 | 318* | 26* | SWI | YM (kPa) | 96.2 | 96.2 | Barr et al., 2012 | |
| 60 | 703* | 141** | SWI | YM (kPa) | 80.9 | 69.1 | Boehm et al., 2015 | |
| 50 | __ | 33** | SWI | YM (kPa) | 90 (PSA<20) | 88 (PSA<20) | Ahmad et al.,2103 | |
| 93(PSA>20) | 93(PSA>20) | |||||||
| 508 | __ | __ | SE | __ | 72 | 76 | Zhang et al., 2014 | |
| 229 | 1374* | 894* | SE | Color pattern pattern | 51 | 72 | Brock et al., 2011 | |
| 527 | __ | __ | SE | Color pattern/SI | 62 | 79 | Teng et al., 2012 | |
| 2278 | __ | __ | SE | __ | 71-82 | 60-95 | Aboumarzouk et al., 2012 | |
| Lymph nodes | 545 | 835 | 440 | SE | ES | 74 | 90 | Ying et al., 2012 |
| SR | 88 | 81 | ||||||
| 89 | 89 | 52 | SE | ES | 88.4 | 35.1 | Teng et al., 2012 | |
| SR | 98.1 | 64.9 | ||||||
| 37 | 85 | 53 | SE | ES | 83 | 100 | Alam et al., 2008 | |
| 50 | 53 | 23 | SE | SR | 83 | 96 | Paterson et al., 2012 | |
| 46 | 55 | 31 | 2D-SWE | YM (kPa) | 41.9 | 100 | Bhatia et al., 2012 | |
| 100 | 100 | 57 | pSWE | SWV (m/s) | 78.9 | 74.4 | Cheng et al., 2016 | |
Elasticity score (ES), Strain ratio (SR), Shear Wave Imaging (SWI), Strain Index (SI), Young's Modulus (YM), Strain Elastography (SE)
* Peripheral zone sextants
** Number of patients
No data available = '—'.
A meta-analysis of 6 studies (4 using pSWE, 2 SE) with histology as the gold standard showed that the pooled sensitivity, specificity, positive likelihood ratio (LR), and negative LR of elastography for the differentiation of malignant from benign lesions were 85%, 84%, 5.69 and 0.17, respectively, with a summary AUROC of 0.93 (Table 3, [53]). In another recent study, a cut-off value of 2.52 m/s using VTQ/ARFI allowed differentiation of malignant from benign FLLs with a sensitivity and specificity of 97% and 66%, respectively (Table 3, [54]).
Since FLLs may occur on different background liver parenchyma, it was reasoned that reporting the ratios (SWV ratio or stiffness ratio) between values obtained in the FLL and the surrounding liver tissue could be more accurate. However, a recent study with VTQ/ARFI in 134 patients with FLLs found that a cut-off values of 2.13 m/s for SWV showed superior performance (sensitivity and specificity of 83.3% and 77.9%, respectively) compared to a cut-off value of 1.37 for SWV ratio (59.6% and 77.3%, respectively) in differentiating malignant from benign FLLs (Table 3, [55]). This was also shown in a larger-scale study in 373 patients using pSWE (by Philips) with an AUROC of 0.87 vs. 0.67, sensitivity of 74% vs. 82% and specificity of 84% vs. 28% (Table 3, [56]).
Although the above studies were promising, other studies have reported less favorable results. A study of 62 patients using VTQ/ARFI found no significant difference in the stiffness of malignant versus benign FLLs (p=0.28) (Table 3, [57]). Another study of 79 biopsy-proven FLLs using VTQ/ARFI also found no significant difference between the stiffness of malignant and benign FLLs (mean SWV 2.60 ± 1.15 m/s vs. 2.53 ± 0.83 m/s respectively, p>0.05), with mean SWV values: hepatic adenoma = 1.90 ± 0.86 m/s, hemangioma = 2.14 ± 0.49 m/s, FNH = 3.14 ± 0.63 m/s, HCC = 2.4 ± 1.01 m/s, liver metastasis = 3.0 ± 1.36 m/s (Table 3, [58]).
To date, the evaluation of USE for FLL characterization appears limited and large ranges of stiffness values for both benign and malignant lesions have been reported, with HCC SWV values ranging from 1.15 m/s (soft) to > 4.0 m/s (stiff) in one study [58]. This variability could reflect tumor heterogeneity, since inclusion of internal hemorrhage or necrosis in malignant tumors decreases stiffness. Although benign lesions are in general softer than malignant lesions, some benign lesions such as focal nodular hyperplasia (FNH), which is mainly composed of hyperplastic hepatic cells and vessels, also have fibrous septa and a central scar which can increase its stiffness. More research is warranted before USE can be recommended for characterization of focal liver lesions.
Limitations of Liver Ultrasound Elastography
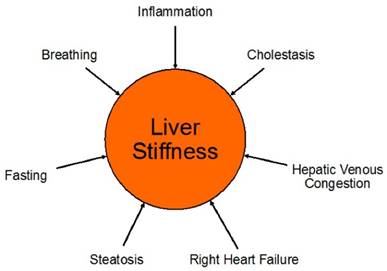
Liver USE measurements can be confounded by both pathologic and normal physiologic processes (Figure 5). Notably, since the liver is surrounded by a stiff minimally distensible capsule (Glisson's capsule), any increase in liver volume also increases its stiffness and elevates elasticity measurements [18]. Besides physiologic differences such as the patient's level of inspiration and expiration and postprandial state, several disease processes including liver inflammation, passive hepatic congestion for example in cardiac insufficiency, cholestasis and hepatic steatosis, have been reported to influence USE measurements [24]. Presence of hepatic steatosis as a possible confounder warrants further discussion since inconsistent results have been reported in the literature on the effects of hepatic steatosis on shear wave measurements [59]. Using 1D-TE in 253 biopsy-proven patients with non-alcoholic fat liver disease (NAFLD), Petta et al found that steatosis grade was an independent predictor of higher liver stiffness measurement (p=0.03), leading to a false-positive rate of 23.6% in the diagnosis of significant liver fibrosis [59]. A multi-center 1D-TE study including 650 patients with chronic HCV assessed the influence of steatosis on liver stiffness USE measurements with comparison to quantitative and precise morphometric measurements of liver histology obtained by biopsy. The liver biopsy histology slides were scanned to obtain high quality images to be evaluated by morphometry. They found that 12.6% of F0/1 were misclassified as F2 when the steatosis area of the liver specimen (area of steatosis vesicles over complete liver surface estimated by morphometry) was < 4.0 %. When the steatosis area was ≥ 4%, the rate of misclassification rose to 32.4% [60]. However, other studies suggested that presence of steatosis did not influence fibrosis estimation. Samir et al used 2D-SWE (SSI) to evaluate 136 patients with CLD, and found that steatosis did not correlate with SWE measurements obtained in the upper right liver lobe (r=0.45, p=0.06), lower right liver lobe (r=0.26, p=0.09), and biopsy site (r=0.04, p=0.62) [38]. Similarly, Wong et al found no influence of the presence of steatosis on liver stiffness measurements (p=0.31) [61].
Pathologic and normal physiologic processes which can be confounders of liver stiffness measurements. Among other causes, right heart failure can lead to hepatic venous congestion with consecutive elevation of liver stiffness due to the increased venous pressure. Increased levels of inspiration and expiration (Valsalva maneuver) can also increase liver stiffness and, therefore, patients need to be coached regarding breathing instructions when obtaining liver stiffness measurements.
Other limitations relate to the specific USE methods. Since in 1D-TE excitations are applied at the skin surface, it is limited by patient obesity, narrow intercostal spaces and the presence of perihepatic ascites [19]. Also, 1D-TE requires specialized equipment and annual or biannual probe recalibration [6]. The equipment does not provide B-mode images, which can limit selection of an appropriate sampling area. These factors contribute to a high rate of unreliable results (approximately 16%) with 1D-TE [62]. The newer methods including pSWE and 2D-SWE are available on conventional US systems and do not require specialized equipment. However, greater technical and anatomical expertise is needed with these methods, which are therefore usually performed by a radiologist or sonographer [5].
Finally, since both pSWE and 2D-SWE are newer technologies compared to 1D-TE, more validation studies are needed to assess their diagnostic accuracy in grading liver fibrosis, prediction of esophageal varices, or characterization of FLLs [6].
In summary, while the main clinical application of liver USE is to detect, stage, and monitor liver fibrosis in CLD patients, the World Federation for Ultrasound in Medicine and Biology (WFUMB) guidelines only recommends its use in distinguishing significant (F≥2) or advanced fibrosis (F≥3) from non-significant fibrosis (F0-F1) because of USE's current limitations in differentiating between individual fibrosis stages [18]. Similarly, the Society of Radiologists in Ultrasound Consensus Conference Statement recommends liver USE to discriminate patients with no or minimal fibrosis (F0-F1) from those with severe fibrosis or cirrhosis (F3-F4) [6]. Future work to improve application of liver USE includes technical developments to increase accuracy of differentiation between fibrosis stages and standardization of elastography techniques among vendors to allow comparison of results across studies from different sites.
Breast
Breast cancer is the most common malignancy in United States for women, with an approximately 12.3% lifetime diagnosis rate according to the National Cancer Institute. Early diagnosis of breast cancer through screening tests allows for the possibility of a complete cure [13].
The two most common imaging methods for breast cancer screening are mammography and US; however both have limitations, such as false negative results in mammographic evaluation of dense breasts and poor specificity of B-mode US [63]. USE provides a complementary tool to improve noninvasive characterization of breast lesions [13].
Studies have shown breast USE have favorable results compared to B-mode US and mammography. For example, a recent study comparing SE USE with B-mode US and mammography (114 total lesions, 33 malignant lesions verified by histology) showed USE was the most specific of the 3 modalities (specificity=95.1%) [64]. In a study by Fischer et al. comparing SE USE with B-mode US and mammography (116 histologically proven malignant lesions), the sensitivity (95%) and specificity (74%) of USE was also greater than that of mammography and B-mode US [65]. Given the diagnostic improvement with USE results, the addition of USE to B-mode US and mammography can help radiologists choose the most appropriate category of the Breast Imaging Reporting and Data System (BI-RADS) classification to guide management. Recently, qualitative USE elasticity measurements (soft, intermediate, or hard) of breast lesions have been incorporated as an associated finding in the 2nd edition of the BI-RADS US lexicon.
Strain Imaging in Breast Lesions
Several parameters have been used to characterize benign and malignant breast masses by strain imaging. The most common parameters are the Tsukuba score (elasticity score) [9], the EI/B mode ratio (width ratio or length ratio), and the strain ratio (fat-to-lesion ratio FLR) [66].
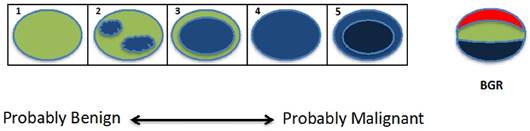
The Tsukuba score (a five-point color scale) is based on a stiffness map of the tissue in and around the lesion, where the score is computed based on the lesion stiffness relative to the background tissue stiffness [9]. As shown in Figure 6, Tsukuba scores are assigned as: 1) lesion is less than or equal stiffness to the surrounding tissue; 2) lesion has mixed (increased, decreased or equal) areas of stiffness compared to the surrounding tissues; 3) lesion is stiffer than the surrounding tissue and is a smaller size on the elastogram than the B-mode US; 4) lesion is stiffer than the surrounding tissue and is the same size on the elastogram and B-mode US; and 5) lesion is stiffer than the surrounding tissue and is larger in size on the elastogram than the B-mode US [67]. Higher scores correspond to a greater probability of malignancy, with scores 1-3 indicating a probably benign lesion, and scores 4-5 requiring a biopsy.
Graphical demonstration of the Tsukuba score. The lesion is shown as an oval, with colors indicating lesion stiffness (blue=increased, red=decreased) compared to the surrounding tissue. With increasing Tsukuba score (1-5), lesions have a higher probability of malignancy. The tri-laminar appearance of blue, green and red (BGR) bands (far right image) is diagnostic of a cyst when visualized using several ultrasound vendors (e.g. Hitachi, Toshiba) (figure adapted from Itoh et al, 2006 [9]).
The Tsukuba score has been widely used to differentiate between benign and malignant breast lesions. For example, Itoh et al. showed the Tsukuba score has a sensitivity, specificity and accuracy of 86.5%, 89.9% and 88.3% respectively [9]. In a meta-analysis of 22 strain imaging studies, most of which used the 5-point Tsukuba score, the overall mean sensitivity was 83% and mean specificity was 84% for the diagnosis of malignant breast lesions [68]. In a study with 370 patients with breast lesions (155 malignant) evaluated with SE using the Tsukuba score in addition to B-mode US, the BI-RADS accuracy was overall improved with increased specificity (68.3% to 87.8%) and slightly decreased sensitivity (90.3% to 83.9%) [69].
In the EI/B-mode ratio, the lesion size measured on the elastogram is divided by the lesion size measured on the B-mode US. This ratio utilizes the finding that the transverse diameter of a benign lesion on an elastogram is smaller than in the corresponding B-mode US. Conversely, the transverse diameter of a malignant lesion is larger on an elastogram than in the B-mode US since the stromal response to breast cancer increases both the stiffness of the tumors and the surrounding tissues. The validity of the EI/B-mode ratio has been demonstrated by one study which assessed 54 histologically proven malignant breast lesions using EI/B-mode ratio cut-offs of ≥ 1.0 as malignant and < 1.0 as benign. This study showed excellent sensitivity and specificity (100% and 95%, respectively) in differentiating malignant from benign breast lesions [70].
The strain ratio is the ratio of the strain in a mass to the strain in the subcutaneous fat. Since fat has a constant elastic modulus over various compressions, the ratio is a semi-quantitative measurement that reflects the relative stiffness of the lesion [71].
Both the EI/B-mode ratio and strain ratio have been widely studied, as demonstrated by a meta-analysis including 12 USE studies reporting either strain ratio (9 studies, 2087 breast lesions) or EI/B-mode ratio (3 studies, 450 breast lesions) for characterization of focal breast lesions (Table 3). Pooled sensitivity and specificity were good for the strain ratio studies (88%, 83%, respectively) and the EI/B-mode ratio studies (98%, 72%, respectively) (Table 3, [72]).
Shear Wave Imaging in Breast Lesions
In SWI, a quantitative measure of the shear wave velocity (m/sec) or Young's modulus (kPa) in a lesion is obtained either as a single value in a small fixed region of interest (ROI) or for each pixel in a field of view (FOV) box displayed as a color map [19, 67]. Usually, a color scale ranging from 0 (dark blue = soft) to 180kPa (red=hard) is used in breast USE [73] (Figure 7).
Side-by-side display of anatomical B-mode US image (left) and overlaid color map of simultaneous shear wave measurements (right) of a breast lesion obtained with 2D-SWE on a SuperSonic Imagine (SSI) AixplorerTM. In this system, red color represents stiff tissue and blue color reflects soft tissue. The suspicious hypoechoic lesion (shown within rectangle on B-mode image) has an irregular border, angular margins, is slightly wider than tall and shows posterior acoustic shadowing. The elastogram suggested malignant etiology due to increased stiffness (red/yellow/green) and ductal adenocarcinoma was confirmed on subsequent biopsy. Image courtesy by Dr. Osmar Saito.
Several studies have validated the use of SWI to characterize breast lesions (Table 3). In a recent meta-analysis of 11 SWI studies assessing breast lesions (2424 patients), a variety of quantitative elasticity values were obtained, including mean stiffness and maximum stiffness, the most commonly used parameters. In this meta-analysis, good pooled sensitivities and specificities for SWI were shown based on maximum stiffness (93%, 81%, respectively) and on mean stiffness (94%, 71%, respectively) (Table 3, [74]). Another SWI study of 83 breast lesions found a similar sensitivity and specificity of 94% and 73% respectively (Table 3, [75]).
Several studies also evaluated whether the addition of SWI can improve the performance of B-mode US in assessing breast malignancy (Table 3). For example, Feldmann et al. used qualitative (homogeneous or heterogeneous appearance) and quantitative (size, stiffness values (E) and ratio values (R)) 2D-SWE parameters in addition to B-mode US to differentiate between malignant and benign breast lesions. The most discriminating 2D-SWE features were found to be the appearance on the SWE color map and a peri-lesion ratio value (Rperilesion) with a threshold at 4.32. The Rperilesion assesses the hardest portion of the peri-lesion area (Eperilesion) and the softest healthy fatty tissue (Efat) through the ratio: Rperilesion = Eperilesion/ Efat. They showed that using benign SWI signs (homogeneity and Rperilesion < 4.32), to selectively downgrade B-mode US classified BI-RADS 4a (low suspicion for malignancy) and BI-RADS 4b (intermediate suspicion for malignancy) lesions improved specificity of US (13% to 51%) without loss in sensitivity (100%) (Table 3, [75]). Berg et al. performed a study with 958 women with breast lesions showing that SWI improved the specificity of B-mode US (61.1% to 78.5%) (Table 3, [76]). Therefore, if a lesion classified as BI-RADS 4a has benign SWI features, it can be downgraded to BI-RADS 3 (probably benign), warranting follow-up rather than biopsy. This technique shows promise to improve patient management and reduce unnecessary biopsies, but additional studies are warranted for further validation.
Limitations of Breast Ultrasound Elastography
The following limitations have been highlighted in the literature:
- Elastogram color coding and scoring are not standardized [13].
- Occasionally a malignant lesion may appear soft in SWI. The surrounding tissues should then be carefully studied to help identify the stiffest part of the lesion. The increased shear wave speed in the surrounding tissues is relevant to help characterize the lesion as malignant [67].
- It is difficult to characterize heterogeneous lesions with mixed benign (cystic) and malignant (necrotic) features [13].
- Some benign lesions (e.g. hyalinized fibroadenomas, fibrosis and fat necrosis) may also be stiff [13].
- Masses in the posterior breast are difficult to assess because deep tissues may not be displaced by compression forces applied at the breast surface [13].
In summary, current applications of clinical breast ultrasound elastography are highlighted in the recent WFUMB guidelines, which state that strain imaging or SWI should only be performed and interpreted in conjunction with B-mode US for characterization of an abnormality identified on B-mode. According to these recommendations, it is reasonable to downgrade lesions with soft elasticity which are BI-RADS 3 (criteria: score 1 on strain imaging, or a maximum color of dark blue or a maximum elasticity of ≤ 20 kPa on SWI) [73] or BI-RADS 4A (criteria: score of 1 or 2 on strain imaging and a maximum elasticity color of light blue or a maximum elasticity of ≤ 80 kPa on SWI for an aggressive strategy, and a score of 1 on strain imaging and a maximum elasticity color of dark blue or maximum elasticity of ≤30 kPa on SWI for a conservative strategy) [76]. If a BI-RADS 3 lesion has characteristics of malignancy on SE or SWI (E Max> 160 kPa (7.3 m/s) or E Color=red with SWI scale set at 180 kPa (7.7 m/s) [76], it should be upgraded to a biopsy [67].
However, there is still much work to be done to support the current clinical applications of breast USE. For example, while both strain imaging and SWI can improve characterization of breast masses, no comparative studies have been performed to show superiority of one method over the other. It is possible that using more than one USE method at a time on a patient may improve the confidence of findings [77]. Additional areas needing further research include the determination of appropriate cut-off values of strain or shear wave velocity in different USE systems, and assessment of the diagnostic performance of USE in lesions of different sizes and at different breast tissue depths when used in combination with B-mode US [71].
Thyroid
Thyroid nodules are a common finding in the general population, present in up to 67% of adults by high resolution B-mode US [78, 79] and in ~50% of pathologic examinations at autopsy [80]. It is important to distinguish the subset of thyroid nodules that are malignant, as morbidity and mortality from thyroid cancer increases with disease stage. Despite the high prevalence of thyroid nodules, only 4-8% of nodules sampled by fine needle aspiration (FNA) are found to be malignant [78, 81]. B-mode US features are initially used to select thyroid nodules for FNA. Features such as spiculated margins, taller than wide shape, marked hypoechogenicity, and microcalcifications are suggestive of malignancy [82]. FNA is then typically used for confirmation of malignancy.
Although FNA is considered the gold standard for diagnosis, it is yet imperfect as up to 15-30% of samples are considered non-diagnostic or indeterminate [78, 79, 83]. Repeat FNA provides conclusive results in the majority of these nodules, but inconclusive results are again obtained for 9.9-50% of nodules with initial non-diagnostic cytology and 38.5-43% of nodules with initial indeterminate cytology [79]. While some inconclusive FNA results are attributable to technical factors such as insufficient sampling, a subset of these results are due to the less easily remedied dilemma of follicular neoplasms, which can comprise 6.7% of total FNA results or 22% of the inconclusive FNA results [81]. Follicular neoplasms are malignant 15-30% of the time, requiring a total thyroidectomy, but malignancy is difficult to determine by FNA, core biopsy, or even frozen section analysis [78, 84].
Thyroid ultrasound elastography is a noninvasive method of assessing thyroid nodules that provides complementary information to B-mode US and FNA. The combined use of thyroid USE with B-mode US may improve the ability to discriminate benign from malignant thyroid nodules and reduce the number of needed FNAs. Thyroid USE may also aid with the difficult problem of distinguishing between malignant and benign follicular neoplasms.
Thyroid Ultrasound Strain Imaging
Thyroid ultrasound strain imaging studies can be classified by the types of stimuli and scoring systems. The most common stimulus used in thyroid ultrasound strain imaging is operator applied external compression via the ultrasound transducer (Figure 8). Alternatively, physiologic stimulus using carotid artery pulsations to induce movement of the adjacent thyroid gland has been studied with encouraging results [85]. Scoring systems for thyroid ultrasound strain imaging include two qualitative elasticity scores (the Asteria criteria, a 4-point score similar to that of breast ultrasound elastography, [84] or the Rago criteria, a 5-point score [86]) and a semi-quantitative thyroid stiffness index (strain in background normal thyroid / strain in thyroid nodule) [85, 87]. The Asteria criteria is based on four classes of tissue stiffness: score 1 for soft nodules; scores 2 and 3 for nodules with an intermediate degree of stiffness; score 4 for stiff lesions [84]. Similarly, the Rago criteria ranges from score 1 (even elasticity in the whole nodule) to score 5 (no elasticity in the nodule or in the area showing posterior shadowing) [86].
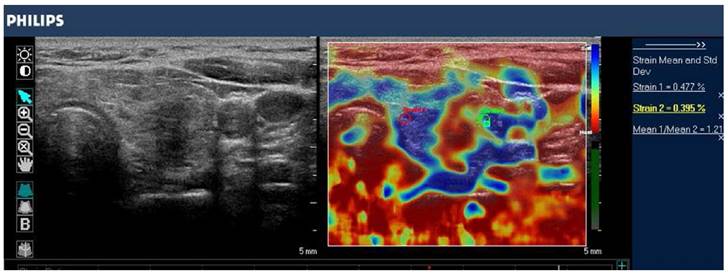
B-mode image (left) and color-coded elastogram (right) of a thyroid nodule in the left thyroid gland, imaged with SE on a Philips iU22 system. The nodule appears hypoechoic with ill-defined borders on anatomical B-mode image. The elastogram shows normal thyroid tissue encoded with blue color (soft tissue) and the nodule with red color (stiff tissue), suggesting a malignant nodule. This was confirmed by histology which showed papillary thyroid carcinoma.
Studies using ultrasound strain imaging to assess thyroid nodules have shown mixed results (Table 3). A meta-analysis including 639 thyroid nodules found strain imaging useful for assessment of malignancy, with overall mean sensitivity of 92% and mean specificity of 90% (Table 3, [88]). These findings were challenged by the results of a recent retrospective study with 703 nodules, which found that the sensitivity of strain imaging measurements (15.7% 5-point Rago criteria, 65.4 % 4-point Asteria criteria) was less than that of B-mode US features (91.7%) (Table 3, [89]). More recently, a prospective study with 912 nodules found strain imaging to be superior to B-mode US features in predicting malignancy, with a sensitivity of 80.2% and specificity of 70.3% (Table 3, [90]).
Since B-mode US and strain imaging provide independent measures, the combination of the measurements have been hypothesized to be superior to either alone for assessment of malignancy. This was supported by the results of Trimboli et al, where the combination of the two modalities resulted in a sensitivity of 97% and negative predictive value of 97%, which is higher than using SI alone (sensitivity = 81%, negative predictive value = 91%) or B-mode features alone (sensitivity = 85%, negative predictive value = 91%) [91]. In contrast, Moon et al found the combination of SI measurements and B-mode US features was inferior to using B-mode features only for assessment of malignancy [89].
These mixed results of thyroid ultrasound strain imaging studies may be due to the different populations and exclusion criteria used in the various studies. Specifically, the percentage of malignant thyroid nodules vary between studies, ranging from 9.4% in Azizi et al [90] to 31% in Moon et al [89]. Further prospective studies with larger cohort size are needed to assess the clinical value of strain imaging in characterizing thyroid nodules.
Thyroid Shear Wave Imaging
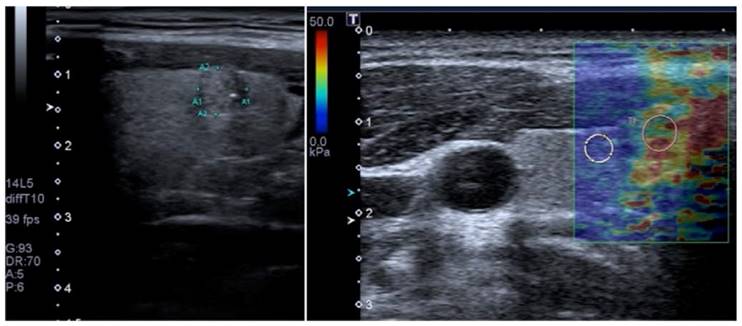
In contrast to strain imaging, SWI of thyroid nodules provides quantitative measurements (Figure 9). A number of recent SWI meta-analyses have shown promising results [92-95], with similarities between the results owing at least in part to the significant overlap in the included studies. Zhan et al included pSWE studies and was the largest meta-analysis (2436 thyroid nodules); they found pSWE was useful for differentiating benign from malignant nodules (mean sensitivity = 80%, mean specificity = 85%, Table 3) [92]. The meta-analysis by Dong et al also included pSWE studies and found similarly good results (1617 thyroid nodules, pooled sensitivity = 86.3%, pooled specificity = 89.5%, Table 3) [95].
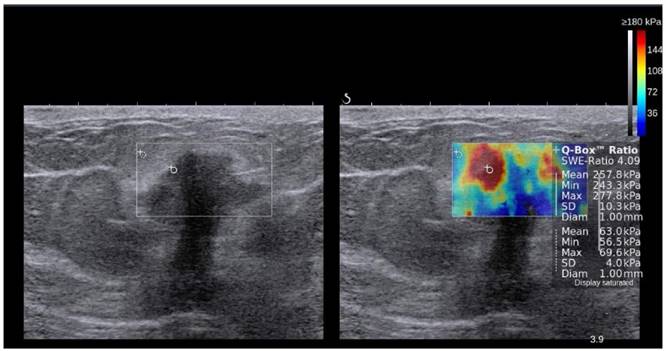
Transverse B-mode image (left) shows small heterogeneous thyroid nodule (lesion within region of interest) with ill-defined margins and microcalcifications in the right thyroid lobe, suggesting malignant etiology. Corresponding color elastogram obtained with 2D-SWE on a Toshiba Aplio 500 (right) shows increased stiffness in the nodule (pink ROI; 32.7 kPa) compared to surrounding normal parenchyma (white ROI; 7.4 kPa), suggesting that the nodule is malignant. Subsequent biopsy confirmed papillary carcinoma.
A recent prospective study specifically addressed the question of whether 2D-SWE could distinguish between benign and malignant follicular thyroid neoplasms (Table 3, [78]). In this work, 35 patients with thyroid nodules that had an FNA diagnosis of follicular neoplasms were assessed with B-mode US and 2D-SWE prior to surgery. Although B-mode US features were not predictive of follicular malignancy, higher Young's modulus estimates were associated with follicular malignancy (AUC = 0.81, cut-off value = 22.3 kPa, sensitivity = 82%, specificity = 88%, positive predictive value = 75%, negative predictive value = 91%) [78].
The growing number of studies of thyroid nodule SWI has overall provided encouraging results. Particularly exciting is the finding that SWI may be helpful with the difficult diagnosis and thus clinical management of malignancy in follicular neoplasms. If the malignancy of follicular neoplasms were better assessed prior to surgery, a hemi-thyroidectomy could be preferentially performed for suspected benign follicular neoplasms, saving patients from the obligation of lifetime thyroid hormone replacement from an unnecessary total thyroidectomy.
Limitations of Thyroid Ultrasound Elastography
The following limitations have been highlighted in the literature:
- Manual external compression in strain imaging leads to operator dependent variability [96].
- Nonlinearity of tissue stiffness results in greater stiffness measurements at high degrees of compression [96].
- Fibrosis within both benign and malignant nodules can increase stiffness [96].
- Many previous studies are limited due to small cohort size with patient selection bias and lack of standardized technique (elastogram color scale, cut-off values) [97].
- Thyroid nodules greater than 3 cm in diameter may be unable to be adequately compressed in strain imaging [97].
- Ultrasound elastography does not give meaningful information with nodules that have cystic components, as fluid movement does not reflect stiffness of the solid component of interest [86, 97].
- Ultrasound elastography cannot be performed on nodules with a calcified shell because the sound waves do not penetrate the calcifications to evaluate the central non-calcified portion of interest [86].
- Coarse calcifications in benign thyroid nodules can lead to misleading measurements indicating increased stiffness, which would otherwise be characteristic of malignancy [84].
In summary, results using ultrasound elastography to distinguish benign from malignant thyroid nodules are overall encouraging, offering non-invasive complementary information to B-mode US. One study even suggests that shear wave imaging may aid in diagnosis of follicular malignancy when invasive FNA results are indeterminate [78]. Heterogeneous results of available studies are at least in part due to selection bias (varying percentages of malignant nodules) and use of non-uniform scoring systems (e.g. 4 point or 5 point elasticity score, stiffness index). In order for these promising preliminary results to gain widespread clinical application, further validation with large cohort prospective studies and standardization of techniques are necessary.
Kidney
Renal Fibrosis
Chronic kidney disease (CKD) in native kidneys and interstitial fibrosis in allograft kidneys are the two major kidney fibrotic pathologies where USE may be clinically useful. Both these conditions can lead to extensive morbidity, mortality, and high health care costs. CKD is a prevalent pathology affecting approximately 14% of the population [98] and it can progress to end-stage renal disease requiring dialysis or renal transplant. Allograft renal interstitial disease can lead to renal transplant failure. Currently, biopsy is the standard method for renal fibrosis staging. Ultrasound elastography methods of strain imaging and SWI can potentially be useful to noninvasively detect, stage and monitor renal fibrosis, reducing the need for renal biopsy [99].
The superficial location of allograft kidneys allows assessment by strain imaging. Orlacchio et al. evaluated 50 patients with allograft kidneys by SE (Philips) and compared USE results with the degree of histopathologic fibrosis (F1=mild, F2=moderate, F3=severe). SE was shown to be useful for predicting fibrosis in renal transplant patients, mainly for F2-F3 cases, with overall accuracy of 95%. Sensitivity, specificity, PPV and NPV were 85.7%, 95.5%, 96% and 84% respectively (using a tissue mean elasticity cut-off value of 46 a.u. - arbitrary units) to diagnose F2-F3 [100].
Strain imaging has also been used to assess native kidneys, although the difficulty of applying external compression to the native kidney in the retroperitoneal location can limit the accuracy of strain elastograms [99]. Menzilcioglu et al. used SE to compare native kidneys in patients with and without CKD. They found the mean strain index value of renal parenchyma in CKD patients (1.81±0.88) was significantly higher than in healthy individuals (0.42±0.30) (p<0.001). However, SE was not able to distinguish between different stages of CKD (Table 4, [101]).
Summary of ultrasound elastography studies assessing CKD and normal kidneys.
| Sens. | Specif. | |||||||||
|---|---|---|---|---|---|---|---|---|---|---|
| No. Pat. | Tech. | Parameter | CKD | Normal | Cut-off | AUC | (%) | (%) | P value | Author |
| 98 | SE | SIV | 1.81±0.88 | 0.42±0.30 | 0.935 | 0.956 | 88 | 95 | 0.001 | Menzilcioglu et al., 2015 |
| 45 | SWE | YM (kPa) | 9.4 | 4.4 | 5.3 | 0.78 | 80 | 75 | 0.02 | Samir et al., 2015 |
| 195 | SWE | SWV (m/s) | 2.00±0.29 (sev.) | 2.81±0.36 | 2.33 | 0.895 | 96.4 | 78.4 | 0.001 | Hu et al., 2014 |
| 2.47±0.39 (mod.) | 2.5 | 0.63 | 71.2 | 69.8 | 0.001 | |||||
| 2.60±0.37(mild) | 2.65 | 0.735 | 63.8 | 75 | 0.001 | |||||
| 391 | SWE | SWV (m/s) | 1.69±0.42 | 2.15±0.51 | 1.88 | 0.752 | 71.87 | 69.69 | 0.001 | Guo et al., 2013 |
| 104 | SWE | SWV (m/s) | 2.06±0.79 | 2.26±0.81 | 2.26 | 0.692 | 86.7 | 48.3 | 0.008 | Bob et al., 2015 |
| 45 | SWE | SWV (m/s) | 2.74 ± 0.57 (CKD1) | __ | __ | __ | __ | __ | >0.05 1 | Wang, et al., 2014 |
| 2.30 ± 0.27 (CKD2) | ||||||||||
| 2.85 ± 0.26 (CKD3) | ||||||||||
| 2.60 ± 0.40 (CKD4) |
1 comparison between CKD stages.
No data available = '—'.
SWI is advantageous to strain imaging in evaluating kidney fibrosis in both allograft and native kidneys since it does not depend on external compression [99]. The majority of studies using SWI to evaluate CKD (Table 4, [102-105]) have shown that the shear wave velocity of the renal parenchyma of CKD patients was significantly lower than in normal patients. Furthermore, studies have shown significant correlations between shear wave velocity and biochemical parameters of CKD. For example, Guo et al used VTQ/ARFI to show that shear wave velocity correlated significantly with estimated glomerular filtration rate, urea nitrogen and serum creatinine (Table 4,[105]), and Hu et al concluded that shear wave velocity correlated significantly with serum creatinine and glomerular filtration rate (Table 4, [103]). In contrast to the above promising results, Wang et al. used VTQ/ARFI to assess 45 patients with CKD referred for renal biopsy and concluded that shear wave velocity measurements did not correlate with any histologic indicators of fibrosis (glomerular sclerosis index, tubular atrophy, interstitial fibrosis) and could not distinguish between CKD stages (Table 4, [106]).
Interestingly in SWI of kidney fibrosis, a negative correlation has been reported between shear wave velocity and the progression of CKD. For example, Bob et al. showed that the shear wave velocity decreased with increasing CKD stage (Table 4, [104]). This is supported by other studies that found significantly decreased shear wave velocity in CKD compared to normal kidneys (Table 4 [103, 105]). These findings are opposite to SWI findings in liver fibrosis, where increasing liver fibrosis corresponds to increasing shear wave velocity. The reason for this difference remains unclear. Asano et al. hypothesized that the decreased renal blood flow in patients with CKD reduces kidney stiffness, resulting in decreased shear wave velocities [107].
Characterization of Focal Renal Lesions
USE may also be helpful for characterizing focal renal lesions since B-mode US features are not specific for malignancy. For example, while benign angiomyolipomas (AMLs) typically appear hyperechoic on B-mode US, renal cell carcinoma (RCC) can also present as a hyperechoic lesion in approximately 10% of cases [108]. Renal cell carcinoma can also be hypoechoic in 10% of the times, and potentially be confused with benign cysts [109]. If USE were able to distinguish benign from malignant renal masses, additional studies requiring intravenous contrast and/or using CT or MRI would be unnecessary. This question has been addressed by several studies using both strain imaging and SWI [110-113].
Studies using strain imaging to assess focal renal masses have shown promising results (Table 3), although a direct comparison of the studies is difficult due to differences in technique (strain scales and US vendors). In a study comparing strain imaging in 28 AMLs and 19 RCCs, strain ratios measured in AMLs by two radiologists (0.15 ± 0.06 and 0.18 ± 0.09, respectively) were significantly lower compared to RCCs (0.64 ± 0.15 and 0.63 ± 0.19), with the best cut-off value of 0.3 (sensitivity = 95%, specificity = 100%) (Table 3, [110]). Another study in 71 patients with histologically examined renal masses compared the strain index values of malignant and benign renal masses and concluded that malignant masses are 2.8 times stiffer than benign masses with mean strain index values of 4.05 and 1.43, respectively. The sensitivity, specificity, positive predictive value and negative predictive value were 82.9%, 82.7%, 87.2% and 77.4% respectively. They also found that the strain index values of RCCs (4.30 ± 2.27) was significantly higher than that for AMLs (1.28 ± 1.01) (p<0.0001), with sensitivity and specificity of 90.9% and 82.6% respectively (Table 3, [111]).
Studies using SWI to assess renal masses have shown inconsistent results (Table 3). Goya et al. showed promising results using VTQ/ARFI to assess 60 patients with renal masses, with substantially lower mean shear wave velocities of AMLs (2.19 ± 0.63 m/s) compared to RCCs (3.18 ± 0.72 m/s*; * value corrected by the author after email contact). Also, they found shear wave velocity values could distinguish between benign and malignant masses with the best cut-off value of 2.34 m/s (AUROC = 0.728), and sensitivity and specificity of 88% and 54% respectively (Table 3, [112]). In contrast, Guo et al. did not find significant differences between shear wave velocities of AMLs (2.49 ± 0.63 m/s) and RCCs (specifically clear cell carcinoma; 2.46 ± 0.45 m/s), suggesting that they have similar physical properties (Table 3, [113]).
Limitations of Renal Ultrasound Elastography
The kidney has many unique properties that limit use of USE:
- The retroperitoneal position of native kidneys impairs the application of external compression.
- The kidney's complex architecture and high tissue anisotropy can influence shear wave velocity. Anatomically, the renal cortex is not organized in linear structures since glomeruli are spherical and proximal/distal tubes have convoluted shape. The medulla consists of the loops of Henle, the vasa recta and the collecting ducts, which have a parallel orientation spanning from the renal capsule to the papilla. When the ARFI pulses are sent parallel to these anatomic structures, shear waves propagate perpendicular to them, creating various tubular and vascular interfaces, decreasing the shear wave velocity, thus, lowering elasticity values. Conversely, when the ARFI pulse is sent perpendicular to these structures, shear waves propagate parallel to them, without any interfaces, increasing their velocities and resulting in higher elasticity values [114]. As shown by Ries et al in a MR imaging-diffusion experiment, anisotropy is 40% in the medulla and 22% in the cortex [115], since the cortex anatomy is not organized in linear structures. Another study used in vivo SWI and also demonstrated higher anisotropy in the medulla than in the inner and outer cortex: 31.8%, 29.7% and 10.5% respectively [116]. This suggests SWS measurements are more reliable in the cortex than the medulla.
- The kidney has an outer fibrous covering, similar to the liver's Glisson's capsule, making any stiffness measurements sensitive to blood and urinary pressure [99]. The effects of blood flow on kidney stiffness was demonstrated by an in vivo study where ligation of the renal artery produced a decrease in renal elasticity, conversely, the ligation of the renal vein increased renal elasticity [116]. In this same study, urinary pressure was found to have a strong effect on elasticity measurements in the kidneys.
In summary, USE in both allograft and native kidneys has shown encouraging results in the detection of fibrosis, potentially providing a low-cost, non-invasive imaging alternative to renal biopsy. However, USE has not been reliable in differentiating between stages of CKD [101, 105] or grading fibrosis in transplanted kidneys [117]. Also, the reported negative correlation between shear wave velocity and the progression of CKD is poorly understood. Further work is needed with larger numbers of patients to evaluate renal fibrosis staging and to understand the relationship between the progression of fibrosis and kidney shear wave velocity. Also, only a few studies have used USE to characterize focal renal masses (primarily AML vs RCC) with controversial results so far using existing technology.
Prostate
According to the American Cancer Society, prostate cancer is the second most common cancer in men after skin cancer and the second leading cause of cancer death after lung cancer. About 180,890 new cases of prostate cancer are expected to be diagnosed in 2016 in the USA [118]. Prostate cancer is suspected with elevated or rising levels of prostate specific antigen (PSA) or an abnormal digital rectal examination (DRE). When an abnormality is detected, a 12-core sextant biopsy of the prostate guided with transrectal ultrasonography (TRUS) is often the next diagnostic test to rule out prostate cancer [119]. The core biopsy is conducted in a spatially systematic way to obtain representative sampling of the entire prostate gland, since TRUS cannot usually localize the lesions. TRUS by itself is unreliable in distinguishing normal prostate gland from cancerous tissue [120], with sensitivity and specificity ranging from 40 to 50% [119]. The untargeted biopsy has limitations such as procedure-related complications (bleeding and infection), false negative results [121], and a high rate of detecting indolent cancers, which is of uncertain clinical benefit [120, 122].
Prostate cancer is usually stiffer than normal prostate tissue, as established by DRE. Thus, USE may help detect stiffer areas in the prostate, creating a color map of stiffness that facilitates the visualization of abnormal areas. Targeted biopsy facilitated by USE may potentially reduce the number of necessary biopsy samples, and thereby the cost and morbidity compared to multiple blind biopsies. Besides targeted biopsy, other possible indications for TRUS elastography may be the characterization of an abnormal area detected previously by any imaging technique (B-mode US, color Doppler US, prostate multi-parametric MRI) and detection of a lesion not seen with any previous imaging technique [123].
Prostate Strain Imaging
Strain imaging of the prostate is based on manually induced slight compressions and decompressions of the prostate tissue via the transrectal transducer. Analysis of resultant tissue deformation is used to generate an elastogram. In order to improve homogeneity of the deformation, a water-filled balloon may be placed between the rectal wall and the probe [124]. As previously discussed, strain imaging is a qualitative method, so tissue stiffness is estimated by the differences in strain between adjacent regions [123].
The diagnostic accuracy of strain imaging in the prostate has shown improved accuracy over TRUS in detecting prostate cancer (Table 3). Zhang et al performed a meta-analysis including SE data from 7 studies (508 patients) compared to histopathology following radical prostatectomy, showing a pooled sensitivity of 72% and specificity of 76% for prostate cancer detection (Table 3, [125]). In another study by Brock et al in 229 patients with biopsy-proven prostate cancer using grey-scale ultrasonography and SE, the sensitivity and specificity of SE in detecting prostate cancer was 51% and 72% respectively, compared to 18% and 90% respectively for conventional grey-scale ultrasonography. Hypoechoic lesions were classified as suspicious and mean tumor volume was 2.8 cm3 [126]).
Additional studies explored the accuracy of USE-guidance for TRUS-directed biopsy of prostate cancer [123]. Teng et al. reported a pooled sensitivity and specificity of 62% and 79% respectively in a meta-analysis of 6 studies with 527 patients in detecting prostate cancer using histology as gold standard (Table 3, [127]). In another similar meta-analysis of 16 studies, the reported sensitivity and specificity ranged between 71-82% and 60-95% respectively, thus, TRUS elastography appeared to perform better than unguided systematic biopsy (Table 3, [128]). In a more recent meta-analysis including 5 well-designed studies with 1840 patients, when targeted biopsy by TRUS elastography was combined with systematic biopsy, the overall detection rate of prostate cancer showed an absolute increase of 7-15% [129]. In another study, Salomon et al included 1024 men who consecutively underwent SE targeted biopsies in addition to systematic TRUS biopsies in a primary or rebiopsy setting. The detection rates for the combination, systematic and targeted biopsies were 46.2%, 39.1% and 29% respectively. The relative detection rate was increased by 18.3% when SE was performed in addition to systemic biopsy. This author suggested that SE targeted biopsies could be used to complement systematic biopsies [130].
Despite these promising results, there are some studies showing mixed results for the general benefit of SE targeted biopsy for the diagnosis of prostate cancer. Schiffmann et al, for example, studied 4,074 sextant biopsy samples (samples obtained from 6 areas within the prostate) in 679 men who underwent SE targeted TRUS biopsy and systematic biopsy. The overall sensitivity, specificity, PPV, and NPV were 19%, 90%, 25%, and 87% respectively, when SE targeted biopsy was performed The low sensitivity (19%) showed that TRUS elastography could not accurately detect sextants which harbored prostate cancer; thus, they did not recommend variation from the well-established systematic biopsy patterns or a reduction of the number of biopsy cores based on SE examination [131].
Prostate Shear Wave Imaging
Several studies have shown good results in differentiating benign tissue from malignant lesions by SWI (Table 3). Correas et al. assessed 184 men who underwent 2D-SWE before US guided 12 core sextant biopsies. A 35-kPa 2D-SWE cut-off value for differentiating benign from malignant prostate lesions yield sensitivity, specificity, PPV, NPV and AUROC of 96%, 85%, 48%, 99% and 95%, respectively (Table 3, [119]). In a study performed by Barr et al. with smaller number of patients (n=53), a cut-off value of 37 kPa to distinguish between benign and malignant lesions resulted in a sensitivity of 96.2%, a specificity of 96.2%, a PPV of 69.4%, and a NPV of 99.6% (Table 3, [132]). Boehm et al. applied a cut-off of 50 kPa which resulted in 80.9% and 69.1% sensitivity and specificity, respectively. The corresponding positive and negative predictive values were 67.1% and 82.2%, respectively (Table 3, [133]). For a cut-off value of 43.9 kPa, Woo et al. found that prostate cancer could be predicted with sensitivity, specificity, PPV and NPV of 43.0%, 80.8%, 15.3% and 94.6% respectively (Table 3, [134]). Although sensitivities and specificities varied among studies, all of them showed a high negative predictive value, indicating that SWI could help reduce the number of biopsies.
Limitations of Prostate Ultrasound Elastography
Strain imaging and SWI have some common limitations. They are both transrectal techniques which carry an intrinsic risk of inadvertently applying excess compression because of the often end-fire arrangement of the transducer [19] and falsely increase tissue stiffness measurements. Benign conditions such as prostatitis, benign prostate hyperplasia and prostate calcifications can also increase stiffness and may results in false positive results [132, 135].
Strain imaging depends on the operator, who manually compresses the prostate using the transducer probe to perform the exam. It is difficult to maintain uniform compression over the entire prostate gland, and slippage of the compression plane may occur, but these problems could be reduced by training and use of balloon interposition [124]. Additionally due to the requirement of manual compression, it is more difficult for strain imaging to detect prostate cancers that have sparse architecture or are located in areas distant from the posterior prostate (e.g. transitional zone, anterior part of an enlarged prostate) [132, 135].
Limitations of shear wave imaging include: small ROI size which cannot cover the entire prostate gland at once, requiring the right and left lobes be imaged separately; slow frame rate of one image per second; delays to achieve image stabilization for each plane acquisition; signal attenuation in enlarged prostates which make the evaluation of the anterior transitional zone difficult or impossible [136]. Also, in general correlating elastograms with histology is challenging since the biopsy specimen is a long tract, not a single round structure as represented as stiff areas on the elastogram.
In summary, USE of the prostate is considered a complementary method to detect prostate cancer and to guide biopsy. In particular, TRUS targeted biopsy using elastography appears promising in the literature. Most studies show good results, with an increase in the detection rate of prostate cancer. However, some studies showed mixed results. Prospective multicenter studies are needed to confirm the value of TRUS targeted biopsy using elastography. Although the exclusive use of TRUS targeted biopsy is not currently validated, its complementary use with systematic biopsies could be considered to increase biopsy yields. Also, preliminary studies using SWE showed its high negative predictive value, with the potential to reduce the need for biopsies in normal appearing areas on SWE. The development of 3D/4D elastography is already underway and volumetric evaluation of tissue stiffness in the prostate may further improve its accuracy. Full volume imaging could also facilitate registration and fusion of data from various imaging modalities, thus enabling multi-parametric tissue characterization above and beyond conventional single mode imaging [136]. Future studies are also needed to assess whether USE allows differentiating aggressive from non-aggressive prostate cancer in patients on active surveillance of the prostate.
Lymph Nodes
Differentiating abnormal lymph nodes in benign conditions such as infection or inflammation from malignant conditions such as metastatic disease or primary malignances such as lymphoma is clinically important.
Noninvasive characterization of lymph nodes is challenging. In CT and MR imaging, determination of lymph node malignancy is predominantly based on size criteria. However, up to 30% of lymph nodes less than 5 mm have been shown to have malignant infiltration in lung, esophageal, gastric, pancreatic, and rectal cancers [137]. B-mode US evaluates shape, density, and distinction of borders in addition to size, but sensitivity and specificity only exceeds 80% when all 4 features are present [138]. Doppler ultrasound demonstrates hilar predominant vascularization with normal and reactive lymph nodes, which can be lost or become more peripheral or mixed with metastatic disease. However, these Doppler findings can be difficult to assess with small lymph nodes and have not increased sensitivity [137]. Contrast enhanced ultrasound has shown centripetal inhomogeneous enhancement with perfusion defects in malignant lymph nodes in distinction to the centrifugal homogeneous enhancement of benign lymph nodes, but results have been inconsistent. Also, both malignant lymphoma and benign reactive lymph nodes can have homogenous contrast enhancement [137].
Fine needle aspiration (FNA) is the gold standard for diagnosis of lymph node malignancy. This can be done with superficial lymph nodes through conventional ultrasound guidance, or in conjunction with endoscopic ultrasound (EUS) to sample lymph nodes of the gastrointestinal tract or adjacent organs. Although FNA is safe and well accepted, limitations include insufficient sampling, bleeding, infection, and track seeding [139]. In particular with EUS-FNA, sampling is relatively contraindicated if the primary tumor blocks access to the suspicious lymph node, as traversal of the primary tumor by the sampling needle may lead to track seeding [139, 140]. In both FNA of superficial lymph nodes and EUS-FNA of deep lymph nodes, false negative results can occur when metastatic infiltration is focal and the benign portion of the lymph node is unknowingly sampled. For example, the median diameter of celiac lymph node metastatic infiltration was only 4 mm when the EUS-FNA was negative [141].
Ultrasound elastography has recently been evaluated to assess lymph node stiffness as a potential additional imaging feature that may help in differentiating benign from malignant lymph nodes. Metastatic lymph nodes have been shown to have increased stiffness compared to the adjacent soft tissue or benign lymph nodes [142, 143], while most reactive processes do not change the stiffness of lymph nodes and may be barely distinguishable from the adjacent soft tissue [137, 143]. These properties could aid selection of lymph nodes for biopsy (Figure 10) and may provide needle guidance on the sampling regions if for example a volumetric stiffness map could be generated.
B-mode image (left) of a cervical lymph node shows a hypoechoic rounded lymph node. Elastogram (right) demonstrated that the lymph node is stiffer compared to surrounding tissue (homogeneous blue color elasticity signal on SE imaging with a Philips iU22 system), suggesting an abnormal lymph node that warrants biopsy. Subsequent biopsy resulted in the diagnosis of tuberculous lymphadenitis.
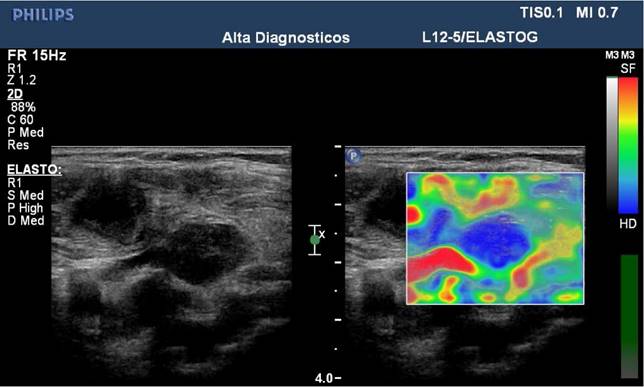
Lymph node strain imaging
Ultrasound elastography strain imaging of lymph nodes is quantified by using the strain ratio (strain of normal reference tissue / strain of investigated lymph node) or elasticity score, similar to that used in breast or thyroid ultrasound strain imaging. With lymph nodes, the surrounding subcutaneous fat or the sternocleidomastoid muscle have been used as the reference tissue [142, 143]. Elasticity scores are assessed by the pattern of the color elastogram, with multiple scoring systems in use ranging from assignment of 4 to 8 total pattern scores [143].
A number of studies have assessed ultrasound elastography strain imaging of lymph nodes. A recent meta-analysis of 9 studies including strain imaging of 835 lymph nodes (cervical, axillary, groin; malignant lymph node rate 42-62.4% from numerous primary malignancies) with histopathology and/or imaging as the reference standard, showed promising results in distinguishing malignant from benign lymph nodes, with sensitivities and specificities of 88% and 81% for strain ratio and 74% and 90% for elasticity score, respectively (Table 3, [144]). However, a separate study assessing 89 biopsy-proven cervical lymph nodes (37 benign: reactive, histiocytic necrotizing lymphadenitis, tuberculosis; 52 malignant: various primary sites) with strain imaging showed high sensitivity but low specificity for differentiating benign from malignant lymph nodes, with sensitivities and specificities being 98.1% and 64.9% for strain ratio and 88.4% and 35.1% for elasticity score, respectively (Table 3, [145]). In contrast, Alam et al. assessed 85 enlarged cervical lymph nodes to differentiate reactive (n=32) and metastatic nodes (n=53) from various primary malignancies, using histopathology, imaging, or clinical response as the reference standard, and found that using an elasticity score yielded a high specificity of 100% with a sensitivity of 83% (Table 3, [146]).
Studies evaluating EUS strain imaging of lymph nodes adjacent to the digestive tract have shown mixed results. For example, one study assessed 53 lymph nodes in the setting of upper gastrointestinal tract cancer and found that EUS strain imaging was superior to EUS B-mode US in distinguishing malignancy, with a sensitivity of 83% and specificity of 96% (Table 3, [138]). However, another recent study found that EUS elastography was not better than standard EUS to distinguish malignancy [147].
Lymph node shear wave imaging
A small but growing number of studies have evaluated SWI for lymph node characterization (Table 3). For example, in one study assessing 55 cervical lymph nodes (24 benign: reactive, tuberculosis; 31 malignant: varied primary malignancies) with 2D-SWE versus FNA cytology as the reference standard found specificity was as high as 100% but sensitivity was only 41.9% for predicting malignancy (Table 3, [148]). A more recent study assessed 100 histologically proven cervical lymph nodes (43 benign: reactive, Kikuchi disease, tuberculosis; 57 malignant: numerous primary malignancies) with pSWE and found a relatively higher sensitivity of 78.9% but a lower specificity of 74.4% for the discrimination of benign and malignant lymph nodes (Table 3, [149]).
Limitations of lymph node ultrasound elastography
- Available studies showed mixed results and have small sample sizes along with a significant selection bias with a high proportion of malignant cases due to the clinical need for histologic confirmation [142, 149].
- There is a lack of standardization of strain imaging techniques. For example, the reference tissue (usually surrounding subcutaneous fat or muscle) for computation of the strain ratio, selection of image area of analysis (box size, shape, distance from transducer), and color scale of elastograms are not standardized [143].
- Some malignancies do not increase lymph node stiffness; specifically, lymphoma may produce soft lymph nodes that can predominantly have similar elasticity to surrounding tissue. [143].
In summary, preliminary data on lymph node USE show mixed results but overall indicate that this technique may be useful for risk stratification of malignancy in both superficial lymph nodes and in deep lymph nodes adjacent to the gastrointestinal tract via EUS. Specifically, elastography may be used in combination with B-mode US to increase diagnostic accuracy [138, 142]. Additional information provided by EUS-USE may be particularly helpful when the primary tumor is in the needle path to the lymph node, a relative contraindication for FNA [140]. So far, available elastography studies of lymph nodes are limited by small sample sizes and selection bias towards malignant lymph nodes, and further research with larger sample sizes are warranted [142].
Conclusion
Evaluation of diffuse liver disease is the best validated application of USE and has been widely adopted for non-invasive detection and staging of liver fibrosis as well as monitoring liver treatment response. Focal breast lesion USE has also been well studied and has been incorporated as an associated feature in the 2nd edition of the BI-RADS US lexicon. There is encouraging data that USE may also be used to assess malignancy of focal liver lesions, thyroid nodules, focal renal masses, and lymph nodes, grade renal fibrosis, and guide TRUS-directed prostate biopsies, but further research with unbiased large scale studies are still required. Also, technique standardization to allow comparison of values between studies and development of new solutions for current technical limitations and biologic/physiologic confounders need to be pursued. USE holds immense potential for various clinical applications, and continued development will lead to widespread clinical adoption in the upcoming years.
Abbreviations
US: ultrasound; USE: ultrasound elastography; SWI: shear wave imaging; 1D-TE: 1 dimensional transient elastography; pSWE: point shear wave elastography; 2D-SWE: 2 dimensional shear wave elastography; SE: strain elastography; ARFI: acoustic radiation force impulse; RF: radio frequency; ROI: region of interest; IQR: interquartile range; VTQ: Virtual TouchTM Quantification; VTI: Virtual TouchTM Imaging; ASQ: Acoustic Structure QuantificationTM; QIBA: Quantitative Imaging Biomarkers Alliance; CLD: chronic liver disease; PH: portal hypertension; HCC: hepatocellular carcinoma; HCV: hepatitis C virus; HBV: hepatitis B virus; LSM: liver stiffness measurement; VCTE: vibration-controlled transient elastography; AUROC: area under the receiver operating characteristic curve; SWS: shear wave speed; HVPG: hepatic venous pressure gradient; FLL: focal liver lesion; LR: likelihood ratio; SWV: shear wave velocity; NAFLD: non-alcoholic fatty liver disease; WFUMB: World Federation for Ultrasound in Medicine and Biology; BI-RADS: Breast Imaging Reporting and Data System; FOV: field of view; FNA: fine needle aspiration; CKD: chronic kidney disease; AML: angiomyolipomas; RCC: renal cell carcinoma; MR: magnetic resonance; CT: computed tomography; PSA: prostate specific antigen; DRE: digital rectal examination; TRUS: transrectal ultrasonography; PPV: positive predictive value; NPV: negative predictive value; EUS: endoscopic ultrasound; ES: elasticity score; SR: strain ratio; SI: strain index.
Competing Interests
The authors have declared that no competing interest exists.
References
1. Gennisson JL, Deffieux T, Fink M, Tanter M. Ultrasound elastography: principles and techniques. Diagnostic and interventional imaging. 2013;94:487-95
2. Shiina T, Nightingale KR, Palmeri ML, Hall TJ, Bamber JC, Barr RG. et al. WFUMB guidelines and recommendations for clinical use of ultrasound elastography: Part 1: basic principles and terminology. Ultrasound in medicine & biology. 2015;41:1126-47
3. Kamaya A, Machtaler S, Safari Sanjani S, Nikoozadeh A, Graham Sommer F, Pierre Khuri-Yakub BT. et al. New technologies in clinical ultrasound. Seminars in roentgenology. 2013;48:214-23
4. Bamber J, Cosgrove D, Dietrich CF, Fromageau J, Bojunga J, Calliada F. et al. EFSUMB guidelines and recommendations on the clinical use of ultrasound elastography. Part 1: Basic principles and technology. Ultraschall in der Medizin. 2013;34:169-84
5. Tang A, Cloutier G, Szeverenyi NM, Sirlin CB. Ultrasound Elastography and MR Elastography for Assessing Liver Fibrosis: Part 1, Principles and Techniques. American journal of roentgenology. 2015;205:22-32
6. Barr RG, Ferraioli G, Palmeri ML, Goodman ZD, Garcia-Tsao G, Rubin J. et al. Elastography Assessment of Liver Fibrosis: Society of Radiologists in Ultrasound Consensus Conference Statement. Radiology. 2015;276:845-61
7. Ophir J, Cespedes I, Ponnekanti H, Yazdi Y, Li X. Elastography: a quantitative method for imaging the elasticity of biological tissues. Ultrasonic imaging. 1991;13:111-34
8. Morikawa H, Fukuda K, Kobayashi S, Fujii H, Iwai S, Enomoto M. et al. Real-time tissue elastography as a tool for the noninvasive assessment of liver stiffness in patients with chronic hepatitis C. Journal of gastroenterology. 2011;46:350-8
9. Itoh A, Ueno E, Tohno E, Kamma H, Takahashi H, Shiina T. et al. Breast disease: clinical application of US elastography for diagnosis. Radiology. 2006;239:341-50
10. Bhatia KS, Lee YY, Yuen EH, Ahuja AT. Ultrasound elastography in the head and neck. Part I. Basic principles and practical aspects. Cancer imaging. 2013;13:253-9
11. Choi YJ, Lee JH, Baek JH. Ultrasound elastography for evaluation of cervical lymph nodes. Ultrasonography. 2015;34:157-64
12. Nightingale K. Acoustic Radiation Force Impulse (ARFI) Imaging: a Review. Current medical imaging reviews. 2011;7:328-39
13. Faruk T, Islam MK, Arefin S, Haq MZ. The Journey of Elastography: Background, Current Status, and Future Possibilities in Breast Cancer Diagnosis. Clinical breast cancer. 2015
14. Garra BS. Elastography: history, principles, and technique comparison. Abdominal imaging. 2015;40:680-97
15. Dhyani M, Anvari A, Samir AE. Ultrasound elastography: liver. Abdominal imaging. 2015;40:698-708
16. Castera L, Forns X, Alberti A. Non-invasive evaluation of liver fibrosis using transient elastography. Journal of hepatology. 2008;48:835-47
17. Friedrich-Rust M, Nierhoff J, Lupsor M, Sporea I, Fierbinteanu-Braticevici C, Strobel D. et al. Performance of Acoustic Radiation Force Impulse imaging for the staging of liver fibrosis: a pooled meta-analysis. Journal of viral hepatitis. 2012;19:e212-9
18. Ferraioli G, Filice C, Castera L, Choi BI, Sporea I, Wilson SR. et al. WFUMB Guidelines and Recommendations for Clinical Use of Ultrasound Elastography: Part 3: Liver. Ultrasound in medicine & biology. 2015;41:1161-79
19. Cosgrove D, Piscaglia F, Bamber J, Bojunga J, Correas JM, Gilja OH. et al. EFSUMB guidelines and recommendations on the clinical use of ultrasound elastography. Part 2: Clinical applications. Ultraschall in der Medizin. 2013;34:238-53
20. Ferraioli G, Tinelli C, Dal Bello B, Zicchetti M, Filice G, Filice C. et al. Accuracy of real-time shear wave elastography for assessing liver fibrosis in chronic hepatitis C: a pilot study. Hepatology. 2012;56:2125-33
21. Palmeri ML, Nightingale KR. What challenges must be overcome before ultrasound elasticity imaging is ready for the clinic? Imaging in medicine. 2011;3:433-44
22. Ting CE, Yeong CH, Ng KH, Abdulla BJJ, Ting HE. Accuracy of Tissue Elasticity Measurement using Shear Wave Ultrasound Elastography: A Comparative Phantom Study. World Congress on Medical Physics and Biomedical Engineering. Toronto, Canada: Springer International Publishing. 2015:252-5
23. Hall TJM. et al. RSNA/QIBA: Shear wave speed as a biomarker for liver fibrosis staging. Ultrasonics Symposium (IUS). 2013;2013:397-400
24. Tang A, Cloutier G, Szeverenyi NM, Sirlin CB. Ultrasound Elastography and MR Elastography for Assessing Liver Fibrosis: Part 2, Diagnostic Performance, Confounders, and Future Directions. American journal of roentgenology. 2015;205:33-40
25. Wang Y, Insana MF. Viscoelastic properties of rodent mammary tumors using ultrasonic shear-wave imaging. Ultrasonic imaging. 2013;35:126-45
26. Altahhan KN, Wang Y, Sobh N, Insana MF. Indentation Measurements to Validate Dynamic Elasticity Imaging Methods. Ultrasonic imaging. 2015
27. El Kaffas A, Bekah D, Rui M, Kumaradas JC, Kolios MC. Investigating longitudinal changes in the mechanical properties of MCF-7 cells exposed to paclitaxol using particle tracking microrheology. Physics in medicine and biology. 2013;58:923-36
28. Simon M, Guo J, Papazoglou S, Scholand-Engler H, Erdmann C, Melchert U. et al. Non-invasive characterization of intracranial tumors by magnetic resonance elastography. New Journal of Physics. 2013;15:1-14
29. Doblas S, Garteiser P, Haddad N, Daire J-L, Wagner M, Leitao H. et al. Magnetic resonance elastography measurements of viscosity: a novel biomarker for human hepatic tumor malignancy? Proc Intl Soc Mag Reson Med. 2011:389
30. Udompap P, Kim D, Kim WR. Current and Future Burden of Chronic Nonmalignant Liver Disease. Clinical gastroenterology and hepatology: the official clinical practice journal of the American Gastroenterological Association. 2015;13:2031-41
31. Pellicoro A, Ramachandran P, Iredale JP, Fallowfield JA. Liver fibrosis and repair: immune regulation of wound healing in a solid organ. Nature reviews Immunology. 2014;14:181-94
32. Czaja AJ. Hepatic inflammation and progressive liver fibrosis in chronic liver disease. World journal of gastroenterology. 2014;20:2515-32
33. Kose S, Ersan G, Tatar B, Adar P, Sengel BE. Evaluation of Percutaneous Liver Biopsy Complications in Patients with Chronic Viral Hepatitis. The Eurasian journal of medicine. 2015;47:161-4
34. Barr RG. Elastography in clinical practice. Radiologic clinics of North America. 2014;52:1145-62
35. Goodman ZD. Grading and staging systems for inflammation and fibrosis in chronic liver diseases. Journal of hepatology. 2007;47:598-607
36. Panel AIHG. Hepatitis C guidance: AASLD-IDSA recommendations for testing, managing, and treating adults infected with hepatitis C virus. Hepatology. 2015;62:932-54
37. European Association for the Study of the Liver, Asociacion Latinoamericana para el Estudio del Hígado. EASL-ALEH Clinical Practice Guidelines: Non-invasive tests for evaluation of liver disease severity and prognosis. Journal of hepatology. 2015;63:237-64
38. Samir AE, Dhyani M, Vij A, Bhan AK, Halpern EF, Mendez-Navarro J. et al. Shear-wave elastography for the estimation of liver fibrosis in chronic liver disease: determining accuracy and ideal site for measurement. Radiology. 2015;274:888-96
39. Toshima T, Shirabe K, Takeishi K, Motomura T, Mano Y, Uchiyama H. et al. New method for assessing liver fibrosis based on acoustic radiation force impulse: a special reference to the difference between right and left liver. Journal of gastroenterology. 2011;46:705-11
40. Afdhal NH, Bacon BR, Patel K, Lawitz EJ, Gordon SC, Nelson DR. et al. Accuracy of fibroscan, compared with histology, in analysis of liver fibrosis in patients with hepatitis B or C: a United States multicenter study. Clinical gastroenterology and hepatology. 2015;13:772-9 e1-3
41. Castera L, Vergniol J, Foucher J, Le Bail B, Chanteloup E, Haaser M. et al. Prospective comparison of transient elastography, Fibrotest, APRI, and liver biopsy for the assessment of fibrosis in chronic hepatitis C. Gastroenterology. 2005;128:343-50
42. Ziol M, Handra-Luca A, Kettaneh A, Christidis C, Mal F, Kazemi F. et al. Noninvasive assessment of liver fibrosis by measurement of stiffness in patients with chronic hepatitis C. Hepatology. 2005;41:48-54
43. Chon YE, Choi EH, Song KJ, Park JY, Kim do Y, Han KH. et al. Performance of transient elastography for the staging of liver fibrosis in patients with chronic hepatitis B: a meta-analysis. PloS one. 2012;7:e44930
44. Bota S, Sporea I, Sirli R, Popescu A, Danila M, Jurchis A. et al. Factors associated with the impossibility to obtain reliable liver stiffness measurements by means of Acoustic Radiation Force Impulse (ARFI) elastography-analysis of a cohort of 1,031 subjects. European journal of radiology. 2014;83:268-72
45. Cassinotto C, Lapuyade B, Mouries A, Hiriart JB, Vergniol J, Gaye D. et al. Non-invasive assessment of liver fibrosis with impulse elastography: comparison of Supersonic Shear Imaging with ARFI and FibroScan(R). Journal of hepatology. 2014;61:550-7
46. Gerber L, Kasper D, Fitting D, Knop V, Vermehren A, Sprinzl K. et al. Assessment of liver fibrosis with 2-D shear wave elastography in comparison to transient elastography and acoustic radiation force impulse imaging in patients with chronic liver disease. Ultrasound in medicine & biology. 2015;41:2350-9
47. Takuma Y, Nouso K, Morimoto Y, Tomokuni J, Sahara A, Takabatake H. et al. Portal Hypertension in Patients with Liver Cirrhosis: Diagnostic Accuracy of Spleen Stiffness. Radiology. 2015:150690
48. Cabrera L, Tandon P, Abraldes JG. An update on the management of acute esophageal variceal bleeding. Gastroenterologia y hepatologia. 2016
49. Castera L, Pinzani M, Bosch J. Non invasive evaluation of portal hypertension using transient elastography. Journal of hepatology. 2012;56:696-703
50. Zykus R, Jonaitis L, Petrenkiene V, Pranculis A, Kupcinskas L. Liver and spleen transient elastography predicts portal hypertension in patients with chronic liver disease: a prospective cohort study. BMC gastroenterology. 2015;15:183
51. Elkrief L, Rautou PE, Ronot M, Lambert S, Dioguardi Burgio M, Francoz C. et al. Prospective comparison of spleen and liver stiffness by using shear-wave and transient elastography for detection of portal hypertension in cirrhosis. Radiology. 2015;275:589-98
52. Takuma Y, Nouso K, Morimoto Y, Tomokuni J, Sahara A, Toshikuni N. et al. Measurement of spleen stiffness by acoustic radiation force impulse imaging identifies cirrhotic patients with esophageal varices. Gastroenterology. 2013;144:92-101 e2
53. Ma X, Zhan W, Zhang B, Wei B, Wu X, Zhou M. et al. Elastography for the differentiation of benign and malignant liver lesions: a meta-analysis. Tumour biology. 2014;35:4489-97
54. Goya C, Hamidi C, Yavuz A, Hattapoglu S, Uslukaya O, Cetincakmak MG. et al. The Role of Acoustic Radiation Force Impulse Elastography in the Differentiation of Infectious and Neoplastic Liver Lesions. Ultrasonic imaging. 2015
55. Guo LH, Wang SJ, Xu HX, Sun LP, Zhang YF, Xu JM. et al. Differentiation of benign and malignant focal liver lesions: value of virtual touch tissue quantification of acoustic radiation force impulse elastography. Medical oncology. 2015;32:68
56. Lu Q, Ling W, Lu C, Li J, Ma L, Quan J. et al. Hepatocellular carcinoma: stiffness value and ratio to discriminate malignant from benign focal liver lesions. Radiology. 2015;275:880-8
57. Heide R, Strobel D, Bernatik T, Goertz RS. Characterization of focal liver lesions (FLL) with acoustic radiation force impulse (ARFI) elastometry. Ultraschall in der Medizin. 2010;31:405-9
58. Frulio N, Laumonier H, Carteret T, Laurent C, Maire F, Balabaud C. et al. Evaluation of liver tumors using acoustic radiation force impulse elastography and correlation with histologic data. Journal of ultrasound in medicine. 2013;32:121-30
59. Petta S, Maida M, Macaluso FS, Di Marco V, Camma C, Cabibi D. et al. The severity of steatosis influences liver stiffness measurement in patients with nonalcoholic fatty liver disease. Hepatology. 2015;62:1101-10
60. Boursier J, de Ledinghen V, Sturm N, Amrani L, Bacq Y, Sandrini J. et al. Precise evaluation of liver histology by computerized morphometry shows that steatosis influences liver stiffness measured by transient elastography in chronic hepatitis C. Journal of gastroenterology. 2014;49:527-37
61. Wong VW, Vergniol J, Wong GL, Foucher J, Chan HL, Le Bail B. et al. Diagnosis of fibrosis and cirrhosis using liver stiffness measurement in nonalcoholic fatty liver disease. Hepatology. 2010;51:454-62
62. Castera L, Foucher J, Bernard PH, Carvalho F, Allaix D, Merrouche W. et al. Pitfalls of liver stiffness measurement: a 5-year prospective study of 13,369 examinations. Hepatology. 2010;51:828-35
63. Saarenmaa I, Salminen T, Geiger U, Heikkinen P, Hyvarinen S, Isola J. et al. The effect of age and density of the breast on the sensitivity of breast cancer diagnostic by mammography and ultasonography. Breast cancer research and treatment. 2001;67:117-23
64. Mohey N, Hassan TA. Value of mammography and combined grey scale ultrasound and ultrasound elastography in the differentiation of solid breast lesions. The Egyptian Journal of Radiology and Nuclear Medicine. 2014;45:253-61
65. Fischer T, Peisker U, Fiedor S, Slowinski T, Wedemeyer P, Diekmann F. et al. Significant differentiation of focal breast lesions: raw data-based calculation of strain ratio. Ultraschall in der Medizin. 2012;33:372-9
66. Ueno E, Umemoto T, Bando H, Tohno E, Waki K, Matsumura T. New Quantitative Method in Breast Elastography: Fat Lesion Ratio (FLR). Radiological Society of North America 2007 Scientific Assembly and Annual Meeting. Chicago, IL. 2007
67. Barr RG, Nakashima K, Amy D, Cosgrove D, Farrokh A, Schafer F. et al. WFUMB guidelines and recommendations for clinical use of ultrasound elastography: Part 2: breast. Ultrasound in medicine & biology. 2015;41:1148-60
68. Gong X, Xu Q, Xu Z, Xiong P, Yan W, Chen Y. Real-time elastography for the differentiation of benign and malignant breast lesions: a meta-analysis. Breast cancer research and treatment. 2011;130:11-8
69. Zhi H, Xiao XY, Ou B, Zhong WJ, Zhao ZZ, Zhao XB. et al. Could ultrasonic elastography help the diagnosis of small (</=2 cm) breast cancer with the usage of sonographic BI-RADS classification? European journal of radiology. 2012;81:3216-21
70. Barr RG. Real-time ultrasound elasticity of the breast: initial clinical results. Ultrasound quarterly. 2010;26:61-6
71. Ricci P, Maggini E, Mancuso E, Lodise P, Cantisani V, Catalano C. Clinical application of breast elastography: State of the art. European journal of radiology. 2014;83:429-37
72. Sadigh G, Carlos RC, Neal CH, Dwamena BA. Accuracy of quantitative ultrasound elastography for differentiation of malignant and benign breast abnormalities: a meta-analysis. Breast cancer research and treatment. 2012;134:923-31
73. Lee SH, Chang JM, Cho N, Koo HR, Yi A, Kim SJ. et al. Practice guideline for the performance of breast ultrasound elastography. Ultrasonography. 2014;33:3-10
74. Chen L, He J, Liu G, Shao K, Zhou M, Li B. et al. Diagnostic performances of shear-wave elastography for identification of malignant breast lesions: a meta-analysis. Japanese journal of radiology. 2014;32:592-9
75. Feldmann A, Langlois C, Dewailly M, Martinez EF, Boulanger L, Kerdraon O. et al. Shear Wave Elastography (SWE): An Analysis of Breast Lesion Characterization in 83 Breast Lesions. Ultrasound in medicine & biology. 2015;41:2594-604
76. Berg WA, Cosgrove DO, Dore CJ, Schafer FK, Svensson WE, Hooley RJ. et al. Shear-wave elastography improves the specificity of breast US: the BE1 multinational study of 939 masses. Radiology. 2012;262:435-49
77. Barr RG, Zhang Z. Shear-wave elastography of the breast: value of a quality measure and comparison with strain elastography. Radiology. 2015;275:45-53
78. Samir AE, Dhyani M, Anvari A, Prescott J, Halpern EF, Faquin WC. et al. Shear-Wave Elastography for the Preoperative Risk Stratification of Follicular-patterned Lesions of the Thyroid: Diagnostic Accuracy and Optimal Measurement Plane. Radiology. 2015;277:565-73
79. Yoon JH, Kim EK, Kwak JY, Moon HJ. Effectiveness and limitations of core needle biopsy in the diagnosis of thyroid nodules: review of current literature. Journal of pathology and translational medicine. 2015;49:230-5
80. Frates MC, Benson CB, Charboneau JW, Cibas ES, Clark OH, Coleman BG. et al. Management of thyroid nodules detected at US: Society of Radiologists in Ultrasound consensus conference statement. Radiology. 2005;237:794-800
81. Faquin WC, Wong LQ, Afrogheh AH, Ali SZ, Bishop JA, Bongiovanni M. et al. Impact of reclassifying noninvasive follicular variant of papillary thyroid carcinoma on the risk of malignancy in The Bethesda System for Reporting Thyroid Cytopathology. Cancer cytopathology. 2016;124:181-7
82. Moon WJ, Baek JH, Jung SL, Kim DW, Kim EK, Kim JY. et al. Ultrasonography and the ultrasound-based management of thyroid nodules: consensus statement and recommendations. Korean journal of radiology. 2011;12:1-14
83. Cibas ES, Ali SZ, Conference NCITFSotS. The Bethesda System For Reporting Thyroid Cytopathology. American journal of clinical pathology. 2009;132:658-65
84. Asteria C, Giovanardi A, Pizzocaro A, Cozzaglio L, Morabito A, Somalvico F. et al. US-elastography in the differential diagnosis of benign and malignant thyroid nodules. Thyroid. 2008;18:523-31
85. Dighe M, Bae U, Richardson ML, Dubinsky TJ, Minoshima S, Kim Y. Differential diagnosis of thyroid nodules with US elastography using carotid artery pulsation. Radiology. 2008;248:662-9
86. Rago T, Santini F, Scutari M, Pinchera A, Vitti P. Elastography: new developments in ultrasound for predicting malignancy in thyroid nodules. The Journal of clinical endocrinology and metabolism. 2007;92:2917-22
87. Lyshchik A, Higashi T, Asato R, Tanaka S, Ito J, Mai JJ. et al. Thyroid gland tumor diagnosis at US elastography. Radiology. 2005;237:202-11
88. Bojunga J, Herrmann E, Meyer G, Weber S, Zeuzem S, Friedrich-Rust M. Real-time elastography for the differentiation of benign and malignant thyroid nodules: a meta-analysis. Thyroid. 2010;20:1145-50
89. Moon HJ, Sung JM, Kim EK, Yoon JH, Youk JH, Kwak JY. Diagnostic performance of gray-scale US and elastography in solid thyroid nodules. Radiology. 2012;262:1002-13
90. Azizi G, Keller J, Lewis M, Puett D, Rivenbark K, Malchoff C. Performance of elastography for the evaluation of thyroid nodules: a prospective study. Thyroid. 2013;23:734-40
91. Trimboli P, Guglielmi R, Monti S, Misischi I, Graziano F, Nasrollah N. et al. Ultrasound sensitivity for thyroid malignancy is increased by real-time elastography: a prospective multicenter study. The Journal of clinical endocrinology and metabolism. 2012;97:4524-30
92. Zhan J, Jin JM, Diao XH, Chen Y. Acoustic radiation force impulse imaging (ARFI) for differentiation of benign and malignant thyroid nodules-A meta-analysis. European journal of radiology. 2015;84:2181-6
93. Lin P, Chen M, Liu B, Wang S, Li X. Diagnostic performance of shear wave elastography in the identification of malignant thyroid nodules: a meta-analysis. European radiology. 2014;24:2729-38
94. Liu BJ, Li DD, Xu HX, Guo LH, Zhang YF, Xu JM. et al. Quantitative Shear Wave Velocity Measurement on Acoustic Radiation Force Impulse Elastography for Differential Diagnosis between Benign and Malignant Thyroid Nodules: A Meta-analysis. Ultrasound in medicine & biology. 2015;41:3035-43
95. Dong FJ, Li M, Jiao Y, Xu JF, Xiong Y, Zhang L. et al. Acoustic Radiation Force Impulse imaging for detecting thyroid nodules: a systematic review and pooled meta-analysis. Medical ultrasonography. 2015;17:192-9
96. Cantisani V, Grazhdani H, Drakonaki E, D'Andrea V, Di Segni M, Kaleshi E. et al. Strain US Elastography for the Characterization of Thyroid Nodules: Advantages and Limitation. International journal of endocrinology. 2015;2015:908575
97. Cantisani V, Lodise P, Grazhdani H, Mancuso E, Maggini E, Di Rocco G. et al. Ultrasound elastography in the evaluation of thyroid pathology. Current status. European journal of radiology. 2014;83:420-8
98. Saran R, Li Y, Robinson B, Ayanian J, Balkrishnan R, Bragg-Gresham J. et al. US Renal Data System 2014 Annual Data Report: Epidemiology of Kidney Disease in the United States. American journal of kidney diseases. 2015;66:S1-305
99. Anvari A, Barr RG, Dhyani M, Samir AE. Clinical application of sonoelastography in thyroid, prostate, kidney, pancreas, and deep venous thrombosis. Abdominal imaging. 2015;40:709-22
100. Orlacchio A, Chegai F, Del Giudice C, Anselmo A, Iaria G, Palmieri G. et al. Kidney transplant: usefulness of real-time elastography (RTE) in the diagnosis of graft interstitial fibrosis. Ultrasound in medicine & biology. 2014;40:2564-72
101. Menzilcioglu MS, Duymus M, Citil S, Avcu S, Gungor G, Sahin T. et al. Strain wave elastography for evaluation of renal parenchyma in chronic kidney disease. The British journal of radiology. 2015;88:20140714
102. Samir AE, Allegretti AS, Zhu Q, Dhyani M, Anvari A, Sullivan DA. et al. Shear wave elastography in chronic kidney disease: a pilot experience in native kidneys. BMC nephrology. 2015;16:119
103. Hu Q, Wang XY, He HG, Wei HM, Kang LK, Qin GC. Acoustic radiation force impulse imaging for non-invasive assessment of renal histopathology in chronic kidney disease. PloS one. 2014;9:e115051
104. Bob F, Bota S, Sporea I, Sirli R, Popescu A, Schiller A. Relationship between the estimated glomerular filtration rate and kidney shear wave speed values assessed by acoustic radiation force impulse elastography: a pilot study. Journal of ultrasound in medicine. 2015;34:649-54
105. Guo LH, Xu HX, Fu HJ, Peng A, Zhang YF, Liu LN. Acoustic radiation force impulse imaging for noninvasive evaluation of renal parenchyma elasticity: preliminary findings. PloS one. 2013;8:e68925
106. Wang L, Xia P, Lv K, Han J, Dai Q, Li XM. et al. Assessment of renal tissue elasticity by acoustic radiation force impulse quantification with histopathological correlation: preliminary experience in chronic kidney disease. European radiology. 2014;24:1694-9
107. Asano K, Ogata A, Tanaka K, Ide Y, Sankoda A, Kawakita C. et al. Acoustic radiation force impulse elastography of the kidneys: is shear wave velocity affected by tissue fibrosis or renal blood flow? Journal of ultrasound in medicine. 2014;33:793-801
108. Sidhar K, McGahan JP, Early HM, Corwin M, Fananapazir G, Gerscovich EO. Renal Cell Carcinomas: Sonographic Appearance Depending on Size and Histologic Type. Journal of ultrasound in medicine. 2016;35:311-20
109. Charboneau JW, Hattery RR, Ernst EC 3rd, James EM, Williamson B Jr, Hartman GW. Spectrum of sonographic findings in 125 renal masses other than benign simple cyst. American journal of roentgenology. 1983;140:87-94
110. Tan S, Ozcan MF, Tezcan F, Balci S, Karaoglanoglu M, Huddam B. et al. Real-time elastography for distinguishing angiomyolipoma from renal cell carcinoma: preliminary observations. American journal of roentgenology. 2013;200:W369-75
111. Onur MR, Poyraz AK, Bozgeyik Z, Onur AR, Orhan I. Utility of semiquantitative strain elastography for differentiation between benign and malignant solid renal masses. Journal of ultrasound in medicine. 2015;34:639-47
112. Goya C, Daggulli M, Hamidi C, Yavuz A, Hattapoglu S, Cetincakmak MG. et al. The role of quantitative measurement by acoustic radiation force impulse imaging in differentiating benign renal lesions from malignant renal tumours. La Radiologia medica. 2015;120:296-303
113. Guo LH, Liu BJ, Xu HX, Liu C, Sun LP, Zhang YF. et al. Acoustic radiation force impulse elastography in differentiating renal solid masses: a preliminary experience. International journal of clinical and experimental pathology. 2014;7:7469-76
114. Grenier N, Gennisson JL, Cornelis F, Le Bras Y, Couzi L. Renal ultrasound elastography. Diagnostic and interventional imaging. 2013;94:545-50
115. Ries M, Jones RA, Basseau F, Moonen CT, Grenier N. Diffusion tensor MRI of the human kidney. Journal of magnetic resonance imaging. 2001;14:42-9
116. Gennisson JL, Grenier N, Combe C, Tanter M. Supersonic shear wave elastography of in vivo pig kidney: influence of blood pressure, urinary pressure and tissue anisotropy. Ultrasound in medicine & biology. 2012;38:1559-67
117. Syversveen T, Brabrand K, Midtvedt K, Strom EH, Hartmann A, Jakobsen JA. et al. Assessment of renal allograft fibrosis by acoustic radiation force impulse quantification-a pilot study. Transplant international. 2011;24:100-5
118. Siegel RL, Miller KD, Jemal A. Cancer statistics, 2016. CA: a cancer journal for clinicians. 2016;66:7-30
119. Correas JM, Tissier AM, Khairoune A, Vassiliu V, Mejean A, Helenon O. et al. Prostate cancer: diagnostic performance of real-time shear-wave elastography. Radiology. 2015;275:280-9
120. Kelloff GJ, Choyke P, Coffey DS, Prostate Cancer Imaging Working G. Challenges in clinical prostate cancer: role of imaging. American journal of roentgenology. 2009;192:1455-70
121. Wolf AM, Wender RC, Etzioni RB, Thompson IM, D'Amico AV, Volk RJ. et al. American Cancer Society guideline for the early detection of prostate cancer: update 2010. CA: a cancer journal for clinicians. 2010;60:70-98
122. Woo S, Kim SY, Lee MS, Cho JY, Kim SH. Shear wave elastography assessment in the prostate: an intraobserver reproducibility study. Clinical imaging. 2015;39:484-7
123. Correas JM, Drakonakis E, Isidori AM, Helenon O, Pozza C, Cantisani V. et al. Update on ultrasound elastography: miscellanea. Prostate, testicle, musculo-skeletal. European journal of radiology. 2013;82:1904-12
124. Tsutsumi M, Miyagawa T, Matsumura T, Endo T, Kandori S, Shimokama T. et al. Real-time balloon inflation elastography for prostate cancer detection and initial evaluation of clinicopathologic analysis. American journal of roentgenology. 2010;194:W471-6
125. Zhang B, Ma X, Zhan W, Zhu F, Li M, Huang J. et al. Real-time elastography in the diagnosis of patients suspected of having prostate cancer: a meta-analysis. Ultrasound in medicine & biology. 2014;40:1400-7
126. Brock M, von Bodman C, Sommerer F, Loppenberg B, Klein T, Deix T. et al. Comparison of real-time elastography with grey-scale ultrasonography for detection of organ-confined prostate cancer and extra capsular extension: a prospective analysis using whole mount sections after radical prostatectomy. BJU international. 2011;108:E217-22
127. Teng J, Chen M, Gao Y, Yao Y, Chen L, Xu D. Transrectal sonoelastography in the detection of prostate cancers: a meta-analysis. BJU international. 2012;110:E614-20
128. Aboumarzouk OM, Ogston S, Huang Z, Evans A, Melzer A, Stolzenberg JU. et al. Diagnostic accuracy of transrectal elastosonography (TRES) imaging for the diagnosis of prostate cancer: a systematic review and meta-analysis. BJU international. 2012;110:1414-23 discussion 23
129. van Hove A, Savoie PH, Maurin C, Brunelle S, Gravis G, Salem N. et al. Comparison of image-guided targeted biopsies versus systematic randomized biopsies in the detection of prostate cancer: a systematic literature review of well-designed studies. World journal of urology. 2014;32:847-58
130. Salomon G, Drews N, Autier P, Beckmann A, Heinzer H, Hansen J. et al. Incremental detection rate of prostate cancer by real-time elastography targeted biopsies in combination with a conventional 10-core biopsy in 1024 consecutive patients. BJU international. 2014;113:548-53
131. Schiffmann J, Grindei M, Tian Z, Yassin DJ, Steinwender T, Leyh-Bannurah SR. et al. Limitations in Elastography based prostate biopsy. The Journal of urology. 2016
132. Barr RG, Memo R, Schaub CR. Shear wave ultrasound elastography of the prostate: initial results. Ultrasound quarterly. 2012;28:13-20
133. Boehm K, Salomon G, Beyer B, Schiffmann J, Simonis K, Graefen M. et al. Shear wave elastography for localization of prostate cancer lesions and assessment of elasticity thresholds: implications for targeted biopsies and active surveillance protocols. The Journal of urology. 2015;193:794-800
134. Woo S, Kim SY, Cho JY, Kim SH. Shear wave elastography for detection of prostate cancer: a preliminary study. Korean journal of radiology. 2014;15:346-55
135. Junker D, De Zordo T, Quentin M, Ladurner M, Bektic J, Horniger W. et al. Real-time elastography of the prostate. BioMed research international. 2014;2014:180804
136. Correas JM, Tissier AM, Khairoune A, Khoury G, Eiss D, Helenon O. Ultrasound elastography of the prostate: state of the art. Diagnostic and interventional imaging. 2013;94:551-60
137. Cui XW, Jenssen C, Saftoiu A, Ignee A, Dietrich CF. New ultrasound techniques for lymph node evaluation. World journal of gastroenterology. 2013;19:4850-60
138. Paterson S, Duthie F, Stanley AJ. Endoscopic ultrasound-guided elastography in the nodal staging of oesophageal cancer. World journal of gastroenterology. 2012;18:889-95
139. Xu W, Shi J, Zeng X, Li X, Xie WF, Guo J. et al. EUS elastography for the differentiation of benign and malignant lymph nodes: a meta-analysis. Gastrointestinal endoscopy. 2011;74:1001-9 quiz 115 e1-4
140. Popescu A, Saftoiu A. Can elastography replace fine needle aspiration? Endoscopic ultrasound. 2014;3:109-17
141. Jenssen C, Dietrich CF. Endoscopic ultrasound-guided fine-needle aspiration biopsy and trucut biopsy in gastroenterology - An overview. Best practice & research Clinical gastroenterology. 2009;23:743-59
142. Bhatia KS, Lee YY, Yuen EH, Ahuja AT. Ultrasound elastography in the head and neck. Part II. Accuracy for malignancy. Cancer imaging. 2013;13:260-76
143. Dudea SM, Botar-Jid C, Dumitriu D, Vasilescu D, Manole S, Lenghel ML. Differentiating benign from malignant superficial lymph nodes with sonoelastography. Medical ultrasonography. 2013;15:132-9
144. Ying L, Hou Y, Zheng HM, Lin X, Xie ZL, Hu YP. Real-time elastography for the differentiation of benign and malignant superficial lymph nodes: a meta-analysis. European journal of radiology. 2012;81:2576-84
145. Teng DK, Wang H, Lin YQ, Sui GQ, Guo F, Sun LN. Value of ultrasound elastography in assessment of enlarged cervical lymph nodes. Asian Pacific journal of cancer prevention. 2012;13:2081-5
146. Alam F, Naito K, Horiguchi J, Fukuda H, Tachikake T, Ito K. Accuracy of sonographic elastography in the differential diagnosis of enlarged cervical lymph nodes: comparison with conventional B-mode sonography. American journal of roentgenology. 2008;191:604-10
147. Larsen MH, Fristrup C, Hansen TP, Hovendal CP, Mortensen MB. Endoscopic ultrasound, endoscopic sonoelastography, and strain ratio evaluation of lymph nodes with histology as gold standard. Endoscopy. 2012;44:759-66
148. Bhatia KS, Cho CC, Tong CS, Yuen EH, Ahuja AT. Shear wave elasticity imaging of cervical lymph nodes. Ultrasound in medicine & biology. 2012;38:195-201
149. Cheng KL, Choi YJ, Shim WH, Lee JH, Baek JH. Virtual Touch Tissue Imaging Quantification Shear Wave Elastography: Prospective Assessment of Cervical Lymph Nodes. Ultrasound in medicine & biology. 2016;42:378-86
Author contact
![]() Corresponding author: Jürgen K. Willmann, M.D. Department of Radiology, Molecular Imaging Program at Stanford, School of Medicine, Stanford University, 300 Pasteur Drive, Room H1307, Stanford, CA 94305-5621. P: 650-723-5424; Fax: 650-723-1909; Email: willmannedu.
Corresponding author: Jürgen K. Willmann, M.D. Department of Radiology, Molecular Imaging Program at Stanford, School of Medicine, Stanford University, 300 Pasteur Drive, Room H1307, Stanford, CA 94305-5621. P: 650-723-5424; Fax: 650-723-1909; Email: willmannedu.