Impact Factor
- Issue 14; 2026
- Issue 13; 2026
- Issue 12; 2026
- Issue 11; 2026
- Issue 10; 2026
- Volume 16; 2026
- Advance Articles
- Past Issues
- Cover Images
- Cover Suggestion
- Index & Coverage
- Special Issues
Introduction
Material and Methods
Results
Discussion
Abbreviations
Supplementary Material
Acknowledgements
References
International Journal of Biological Sciences
International Journal of Medical Sciences
 Global reach, higher impact

Theranostics 2017; 7(6):1407-1421. doi:10.7150/thno.18262 This issue Cite
Research Paper
Cancer-derived Circulating MicroRNAs Promote Tumor Angiogenesis by Entering Dendritic Cells to Degrade Highly Complementary MicroRNAs
Jiaqi Wang1*, Huamao Ye1*, Dandan Zhang1*, Kai Cheng1*, Yijun Hu1, Xiya Yu1, Lei Lu1, Jingjing Hu1, Changjing Zuo1, Baohua Qian1, Yongwei Yu1, Shupeng Liu1, Geng Liu2, Chuanbin Mao3, 4 ![]() , Shanrong Liu1
, Shanrong Liu1 ![]()
1. Changhai Hospital, Second Military Medical University, Shanghai 200433, China;
2. MOE Key Laboratory of Model Animal for Disease Study, Model Animal Research Center of Nanjing University, Nanjing 210061 China;
3. Department of Chemistry and Biochemistry, Stephenson Life Sciences Research Center, University of Oklahoma, 101 Stephenson Parkway, Norman, Oklahoma 73019-5300, USA;
4. School of Materials Science and Engineering, Zhejiang University, Hangzhou, Zhejiang 310027, China.
* These authors contributed equally to this work.
Received 2016-11-9; Accepted 2017-2-1; Published 2017-3-24
Abstract

Understanding the interaction between cancer cells and immunocytes will inspire new cancer therapy strategies. However, how cancer-derived circulating miRNAs modulate such interaction remains unclear. Here we discovered that circulating miR-410-5p, secreted by prostate cancer cells, entered dendritic cells (DCs), with the aid of argonaute-2 protein. The cancer cell antigens stimulated the DCs to produce miR-410-3p, a highly complementary counterpart of miR-410-5p derived from pre-miR-410. The DC-internalized miR-410-5p degraded the miR-410-3p by base pairing and thus inhibited its function in suppressing tumor angiogenesis, promoting tumor growth. Furthermore, blockade of the miR-410-5p upregulated the miR-410-3p to inhibit tumor growth. Our work suggests a new miRNA-mediated role of immunocytes in cancer progression and a new strategy of cancer therapy through suppressing circulating miRNAs.
Keywords: circulating microRNA, cancer angiogenesis, dendritic cells, prostate cancer.
Introduction
During cancer development, cancer cells gradually inhibit the host immune response, preventing immune cells from attacking them [1, 2]. This fact indicates that understanding the interaction between cancer cells and immune cells is a key to the development of cancer therapy in addition to the traditional immune reaction. It is known that cancer cells release miRNAs into the peripheral blood of cancer patients [3-5]. The miRNAs have crucial roles in cancer initiation [6], development [7], metastasis [8], colonization [9], and immune escape [10]. They are also involved in regulatory networks consisting of immune cells such as dendritic cells (DCs), T helper cells, and natural killer (NK) cells [11-13]. It has been observed that the types of miRNAs are subjected to change in immune cells within the tumor microenvironment [14, 15]. What's more, both mRNAs and miRNAs have been reported to be transferred between different cells via exosomes [16, 17]. However, so far, little is known about the role of aberrant circulating miRNAs, in particular, those abundant in cancer patients, in modulating the communication between cancer cells and immune cells.
To fill these gaps, we made a first attempt to study the mechanism by which two interrelated circulating miRNAs, miR-410-5p and miR-410-3p, modulate the communication between prostate cancer cells and DCs. miR-410-5p was chosen in this study because our recent work showed that it is a biomarker for prostate cancer [18]. Specifically, here we found that pre-miR-410 could be processed into miR-410-5p and miR-410-3p in cancer cells and DCs, respectively. Cancer-derived miR-410-5p was found to be transported with argonaute-2 (AGO2) protein in peripheral blood and finally enter DCs, triggering the formation of a duplex between miR-410-5p and miR-410-3p through base pairing. The duplex formation thus degraded miR-410-3p, which otherwise suppresses tumor angiogenesis to inhibit tumor growth. In vivo experiments further confirmed that suppression of circulating miR-410-5p would rescue miR-410-3p expression in DCs, resulting in suppression of tumor angiogenesis and the subsequent inhibition of tumor growth.
Material and Methods
The study was approved by the Institutional Ethics Committee of the Shanghai Changhai Hospital. Written informed consent was obtained from all patients included in the study. Patients did not receive financial compensation. All methods were performed in accordance with the relevant guidelines and local regulations. All methods of animals in experiments had observed the Interdisciplinary Principles and Guidelines for the Use of Animals in Research, Testing, and Education by the New York Academy of Sciences, Ad Hoc Animal Research Committee.
Blood samples
Human peripheral blood samples were collected at Changhai Hospital, Affiliated Hospital - Shanghai Second Military Medical University. Informed consent was obtained prior to the collection of human samples. Samples were collected into coagulant tubes and then incubated for 30 min at 4°C, serum was then extracted after centrifugation. Quantitative real-time PCR (qRT-PCR) assays were performed using 200 µL of serum to assess miRNA levels, using the manufacturer's protocol. The TRIzol reagent (Life Technologies, Grand Island, New York, USA) was used for RNA insolation and the microscript system (QIAGEN, Duesseldorf, Germany) was used for RNA reverse transcription and qRT-PCR. The remaining serum samples were stored at -80°C for further studies.
Mice
Six-week old male C57BL/6J mice (bred in the Experimental Animal Center, Second Military Medical University), and Pb-Cre+ and PtenL/L transgenic mice (transferred from the Experimental Animal Center, Nanjing University) were maintained in a pathogen-free animal facility for at least 1 week prior to use. The experiments were performed in accordance with the IACUC guidelines of Shanghai Second Military Medical University.
Cultures of cell lines and primary cells
The DU145, RM-1, and RWPE-1 cell lines were purchased from the Resource Center, Shanghai Institute of Biological Sciences, Chinese Academy of Sciences. DU145 and RWPE-1 cells were maintained in DMEM (GIBCO, Grand Island, NY, USA) and supplemented with 10% fetal calf serum (FCS). RM-1 cells were maintained in RPMI 1640 (GIBCO) and supplemented with 10% fetal bovine serum (FBS). All cells were cultured at 37°C in a 5% CO2 environment.
Activation of dendritic cells
Human myeloid DCs were isolated from peripheral blood. After Ficoll-Hypaque (PAA, GE, United Kingdom) separation, lymphocytes were sorted using CD14 magnetic beads (Miltenyi Biotec, Bergisch Gladbach, Germany). CD14 cells were cultured in RPMI 1640 containing 10% FBS, 50 ng/mL GM-CSF (R&D, Minnesota, USA), and 10 ng/mL IL-4 (R&D Systems, Minneapolis, MN, USA) overnight. The following day, non-adherent cells were removed by gentle pipetting and adherent cells were cultured in the same medium for two additional days. DCs were activated using lipopolysaccharides (LPS) (Sigma-Aldrich, St. Louis, MO, USA) for 24h.
Murine DCs were isolated from tumor-draining lymph nodes. After removal of red blood cells through lysis, DCs were cultured overnight in RPMI 1640 containing 10% FBS, 1000 U/mL GM-CSF (R&D Systems), and 1000 U/mL IL-4 (R&D Systems). The following day, non-adherent cells were removed by gentle pipetting and adherent cells were cultured in the same medium for two additional days. The cells were sorted using CD11c magnetic beads (Miltenyi Biotec). CD11c+cells were then activated with LPS (Sigma-Aldrich) for 24 h.
Co-culture under non-contact conditions
DU145 and RM1 cells were cultured in 0.4 µm Millicell Standing Cell Culture chambers (Millipore, Billerica, MA, USA) placed in 24-well plates (Sigma-Aldrich) in DMEM (GIBCO) and supplemented with 10% FBS. The following day, non-adherent cells were removed by gentle pipetting. Under non-contact conditions, adherent cells in the top of the culture chamber were co-cultured for 24 h with activated DCs in 24-well plates using RPMI 1640 (GIBCO) supplemented with 10% FBS. The non-contact culture system only allowed the culture medium to flow between the top of the culture chamber and the 24-well plate. Both the cells and the culture medium were collected at the indicated time point of 24h.
Construction of the pcDNA3.1-AGO2-FLAG plasmid
The DU145 cDNA library was obtained from the cDNA Library Construction Kit (TAKARA, Otsu, Shiga, Japan). The coding sequence of the AGO2 gene was amplified by PCR. AGO2 was then cloned into the pcDNA3.1(+) plasmid (Invitrogen, New York, NY, USA) as pcDNA3.1-AGO2 using the HindIII and XbaI restriction enzymes (Thermo Fisher Scientific, Waltham, MA, USA) on both ends. The flag sequence was then synthesized and inserted into pcDNA3.1-AGO2 using the Xbal and Smal restriction sites (Promega, Madison, WI, USA) to generate pcDNA3.1-AGO2-Flag.
miRNA mimics, miRNA inhibitors, and control oligonucleotides
MiRNA mimics, miRNA inhibitors, and control oligonucleotides were purchased from (Gene Pharma, Suzhou, China). miRNA mimics were the artificial RNA with the same sequence of miRNA. The miRNA inhibitors were the artificial RNA with the complementary base sequence of target RNA. Control oligonucleotides were the artificial RNA of 20nt with a non-sense sequence. The sequences of miRNA that were used were obtained from the miRBase[19-23] (http://microrna.sanger.ac.uk/sequences/). The software Primer 3 was used for primer design (http://frodo.wi.mit.edu/). All oligonucleotides and primers used in this study are listed in Tables S1 and S2.
MiRNA microarray analysis
Total RNA was extracted from DCs and purified using the miRNeasy Mini Kit (Cat# 217004, QIAGEN, GmBH, Germany) according to the manufacturer's protocol. RNA integrity was evaluated using an Agilent Bioanalyzer 2100 (Agilent Technologies, Santa Clara, CA, USA). To obtain biotin-labeled miRNA, the total quantity of RNA was labeled and purified using the FlashTag™ Biotin HSR RNA Labeling Kit (P/N 901911, Affymetrix, Santa Clara, CA, USA) according to the manufacturer's instructions. Array hybridization and washing were performed using the GeneChip® Hybridization, Wash, and Stain Kit (P/N900720, Affymetrix) and the GeneChip Eukaryotic Hybridization Control Kit (P/N 900454, Affymetrix) in a Hybridization Oven 645 (P/N 00-0331 (220V), Affymetrix) and Fluidics Station 450 (P/N 00-0079, Affymetrix) according to the manufacturer's instructions. Arrays were scanned using a GeneChip® Scanner 7G (Affymetrix) and the Command Console Software 3.2 (Affymetrix) with the default settings. Raw data was normalized using the RMA and DABG algorithms (Expression Console, Affymetrix).
RNA isolation and qRT-PCR
Total RNA was isolated from cultured cells and tissues using the TRIzol reagent (Life Technologies, Grand Island, NY, USA). Total RNA was isolated from the culture medium (CM) of cultured cells and from serum using the TRIzol LS (Life Technologies) reagent according to the manufacturer's protocol. Reverse transcription of miRNA was performed by using the Reverse Transcript Kit (QIAGEN, Duesseldorf, Germany). For gene expression analysis, qRT-PCR was performed using the miScript SYBR Green qRT-PCR kit (QIAGEN). β-actin (ACTB) and U6 were used as an endogenous control for cultured cells and tissue samples. Fold changes were calculated using the 2ΔΔCt method. The compilation of data was transformed using base 2 logarithmic transformation. After the transformation, the data closely followed normal distribution. For CM and serum samples, a standard curve was made for the endogenous control and quantification. All reactions were performed in triplicate. All of the oligonucleotides and primers used in the experiments are listed in Tables S1 and S2.
Transfection
Lipofectamine 2000 (Invitrogen) was used to transfect all miRNA mimics, inhibitors, siRNAs, and negative control oligonucleotides into cells according to the manufacturer's protocols. Silencing of the target molecules was confirmed by qRT-PCR after transfection at the indicated time points.
Dual-enzyme hydrolysis experiments
Purified total RNA from CM was processed with RNaseA1 (NEB, Ipswich, MA, USA) for 30 min at 37°C. Reverse transcription and qRT-PCR were performed on the processed RNA using the miScript qRT-PCR kit (QIAGEN) according to the manufacturer's instructions. RNaseA1 specifically degrades unprotected single-stranded RNA (e.g., U6) while mature miRNA with a carrier protein was preserved.
Hematoxylin and eosin staining
Prostate tissues were fixed in formalin, embedded in paraffin, sectioned (5μm thickness), and stained with hematoxylin and eosin. Sections were then evaluated by board-certified pathologists.
Immunofluorescence
Tissue sections (tumor, bilateral axillary lymph node, spleen, liver, kidney, and heart) were prepared for immunofluorescence as described above. Primary antibodies (CD11c, CD31, AGO2, and Flag (DDDDK)) (Abcam, Cambridge, United Kingdom) were diluted according to the manufacturer's instructions. The sections were incubated with antibodies at 4°C overnight. The following day, the sections were washed three times with TBS-T (5 min each) and then incubated in TBS-T for 1 h at room temperature. The sections were then washed three times with TBS-T (5 min each) and stained with an anti-goat secondary antibody (Promega) for 30 min prior to imaging. The antibodies are listed in Table S3.
Western blotting
Cultured cells and tissues were dissolved by the M-PER Mammalian Protein Extraction Reagent (Pierce, Rockford, IL, USA) and homogenized, and the total proteins in the lysates were quantified using a BCA Protein Assay Kit (Pierce, Rockford, IL, USA). SDS Loading buffer containing 250 mM Tris-HCL (pH=6.8), 10% SDS, 0.5% Bromophenol blue, 50% Glycerol and 5% beta-mercaptoethanol was then added and the samples were boiled. Following boiling, the samples were stored at -80°C. Protein samples were separated by SDS-PAGE and then transferred to polyvinylidene difluoride membranes in a buffer containing 25mM Tris (pH 8.5), 192 mM glycine and 15% methanol, for use in western blotting. Membranes were blocked with 5% non-fat dry milk in PBS containing 0.05% Tween-20, and then probed with antibodies against ACTB, AGO2, VEGFα, and FLAG (DDDDK) according to the manufacturer's instructions. Finally, the blots were developed using an ECL reagent (Thermo Fisher Scientific) and exposed using the FC2 Image Station (Alpha, Bellingham, WA, USA). All antibodies are listed in Table S3.
Immunoprecipitation
Chromatin immunoprecipitation (ChIP), RNA immunoprecipitation (RIP), and protein immunoprecipitation (IP) were performed using the Chromatin ChIP and RIP kits (Millipore, Billerica, MA, USA) following the manufacturer's protocols, respectively. Briefly, 106 DU145 cells, RM-1 cells, RWPE-1 cells, or DCs along with CM were collected by centrifugation and the cells lysed in a lysis buffer containing 1% SDS, 10 mM EDTA, 50 mM Tris, pH 8.1. The cell suspensions were then sonicated on ice (Thermo Fisher Scientific). The sonicated products were first hybridized with Protein A to remove the background and then incubated with an RNase inhibitor (Promega), protease inhibitor (Thermo Fisher Scientific) and protein A at 4°C. The lysates were then incubated with AGO2, CD63, FLAG (DDDDK), FAM (5-carboxyfluorescein), or a Cy3 antibody (Abcam) overnight according to the manufacturer's protocols. RNA was amplified by RT-PCR and evaluated by gel electrophoresis as previously described [24]. The immunoprecipitated proteins were then analyzed by western blotting. All antibodies used in these experiments are listed in Table S3.
Fluorescence resonance energy transfer
Fluorescein selection
We selected FAM (excitation at 488 nm and emission at 516 nm) as a donor in fluorescence resonance energy transfer (FRET) to an acceptor (Cy3, excitation at 508-532 nm and emission at 568 nm). At 488nm, FAM reached an excitement level while Cy3 did not. When FAM and Cy3 were close enough in distance, the light emitted by FAM could be used to excite Cy3 and thus energy was transferred from FAM (donor) to the nearby Cy3 (acceptor), causing Cy3 to emit fluorescence at 568 nm.
FRET analysis of miRNA duplexes
MiR-mock, miR-410-3p, miR-410-5p, miR-590-5p, anti-miR-590-5p, anti-miR-410-5p, mmu-miR-1896-3p, and miR-335-5p were purchased from Gene Pharma (Suzhou, China). Sequence information for the miRNAs was obtained from the miRBase [19-23](http://microrna.sanger.ac.uk/sequences/). MiR-mock, miR-590-5p, and miR-410-5p were labeled with FAM at 5' end. Mmu-miR-1896-3p, miR-335-5p, anti-miR-590-5p, anti-miR-410-5p, and miR-410-3p were labeled with Cy3 at 3' end. MiR-mockFAM + miR-410-3pCy3, miR-410-5pFAM + miR-410-3pCy3, and miR-410-5pFAM + mmu-miR-1896-3p, and miR-335-5pCy3 were co-transfected into RWPE-1 cells. MiR-410-5pFAM + anti-miR-410-5pCy3, and miR-590-5pFAM + anti-miR-590-5pCy3 were co-transfected into RWPE-1 cells, as a positive control. The samples were analyzed at the indicated time points using the Amnis Image Stream mk II with the excitation wavelength set to 488 nm (FAM excitation) and emission set to 516 nm for FAM emission, and 568 nm for Cy3 emission. When the oligonucleotides bound to the complementary sequences in cells, a FRET signal was observed (downregulation of the FAM emission intensity and the detection of Cy3 fluorescence). All oligonucleotides are listed in Table S1.
Fluorescence resonance energy transfer analysis of the degradation of miRNA duplexes
MiR-mock, miR-410-3p, miR-410-5p, miR-590-5p, anti-miR-590-5p, anti-miR-410-5p, mmu-miR-1896-3p, and miR-335-5p were purchased from Gene Pharma (Suzhou, China). Mmu-miR-1896-3p, miR-335-5p, miR-410-3p, miR-590-5p, and miR-410-5p were 5'-labeled with FAM and 3'-labeled with Cy3 (referred to as mmu-miR-1896-3p Fluor, miR-335-5pFluor, miR-410-3pFluor, miR-590-5pFlour, and miR-410-5pFlour respectively. MiR-mock + miR-410-3pFluor, miR-410-5p + miR-410-3pFluor, miR-410-5p + mmu-miR-1896-3p, and miR-410-5p + miR-335-5pFluor were co-transfected into RWPE-1 cells. MiR-410-5p Fluor + anti-miR-410-5p, and miR-590-5p Fluor + anti-miR-590-5p were co-transfected into RWPE-1 cells as a positive control. The samples were also analyzed on the Amnis Image Stream mkII with the excitation wavelength set to 488 nm (FAM excitation) at the indicated time points; the emission wavelength was set to 516 nm (FAM emission) and 568 nm (Cy3 emission). When the labeled miRNA was degraded after binding to another oligonucleotide, Cy3 fluorescence was suppressed and the FRET signal vanished (downregulation of Cy3 emission intensity and upregulation of FAM fluorescence intensity). All oligonucleotides are listed in Table S1.
Flow cytometric analysis
Cells were collected in ice-cold PBS and incubated with the following anti-mouse antibodies (monoclonal antibodies, mAbs): CD11c (Allophycocyanin, APC), CD80 (Fluorescein, FITC), CD86 (PE), and AGO2 (APC). All of the antibodies were purchased from Miltenyi Biotec. After antibody staining, the cells were re-suspended in PBS containing 1% paraformaldehyde and 1% FBS, and then stored at 4°C prior to flow cytometric analysis (ImageStrream mkII, Merck-Millipore, Seattle, WA, USA). Isotype-matched control mAbs (PE, FITC) were used as negative controls for all analyses. All data were quantified using the IDEAS™ Software (Millipore). All antibodies are listed in Table S3.
In vivo experiments
Treatment of tumor-bearing C57BL/6J mice
To generate RM-1 tumor-bearing mice, 6-week-old male C57BL/6J mice were inoculated subcutaneously with 5 x 10⁶ RM-1 cells on the back. Palpable tumors (approximately 5 mm in diameter) typically formed at the injection site after 4-5 days. The mice were then intratumorally injected with the pLKO.1 plasmid (500 ng/µL, 100 µL) encoding either miR-410-3p or miR-mock, three times a week, for 4 weeks. The tumor sizes were measured with calipers and recorded every other day. Following treatment, mice were selected randomly from each group and sacrificed. Serum was collected in order to analyze the miR-410-5p levels, and the tumors were removed from each mouse. We performed qRT-PCR and western blotting to evaluate VEGFα levels. The remaining mice were treated and the tumors measured every other day until day 50.
Treatment of tumor-bearing nude mice
To generate DU145 tumor-bearing mice, 6-week old male nude mice were inoculated subcutaneously with 1 x 10⁷ DU145 cells on the back. Tumors were allowed to grow for 14 days (approximately 5 mm in diameter). We then injected the mice intratumorally with a pLKO.1 plasmid (500 ng/µL, 100 µL) that encoded either anti-miR-410-5p or anti-mock, once every other day, for 30 days. The sizes of the tumors were measured with calipers every day until day 50. After treatment for 30 days, mice were selected randomly from each group and sacrificed. Serum was collected in order to analyze miR-410-5p levels, and the tumors were removed from each of these mice. Immunofluorescence was performed to investigate CD31 levels. The microvascular density (MVD) was calculated by CD31-labeling vessel endothelial cells. We performed qRT-PCR and western blotting to evaluate VEGFα expression.
Treatment of Pb-Cre+ and PtenL/L transgenic mice
Generation of PtenL/L transgenic mice and Pb-Cre+ transgenic mice hybrids models as well as PCR screening for the genotypes of the Pten negative & PbCre positive of mice were performed as described previously [25] . Briefly, fifty male Pb-Cre+ and PtenL/L transgenic mice (a transgenic mouse model for prostate cancer), were genotyped by PCR 1 month after birth; they were then raised in a specific-pathogen-free environment for 7 months. We then randomly selected 10 mice to sacrifice for analysis. Serum was collected for analysis of miR-410-5p. We removed the prostate from each mouse for pathological analysis to identify the number of mice with prostate cancer.
Twenty-eight mice were randomly selected from the remaining forty mice and divided equally into two groups (n = 14). Both groups were injected with either the pLKO.1 plasmid (500 ng/µL, 100 µL) encoding anti-miR-410-5p or anti-mock. The mice were injected three times per week for 4 weeks. The mice were then sacrificed to determine the number of mice with prostate cancer. The prostate of each treated mouse was removed and weighed prior to performing immunohistochemical miR-410-5p analyses.
Statistical analysis
The data regarding serum miRNAs were analyzed statistically and presented as the mean ± standard deviation (SD). All Ct values were transformed into Content values using the 2-ΔΔCt method. All transformed data was examined by a Shapiro-Wilk procedure to confirm whether the data followed normal distribution (Table S4)[26, 27]. When the p value exceeded the threshold of 0.05, a logarithmic data transformation base 2 was performed and another Shapiro-Wilk examination was done (Figure S2B). Independent t-tests were performed to analyze the differences between the experimental and control groups. If the p-value was less than 0.05, a one-way ANOVA with Bonferroni test was used to compare the means of three or more groups. The Shapiro-Wilk analysis was used to compare normal distribution between the two groups. When comparing 3 groups of data, we used ANOVA combined multiple comparison to analyze results. When the P-value of ANOVA was less than 0.05, additional Bonferroni t-tests were performed to compare the means between any two groups. The SPSS22.0 (IBM, Armonk, NY, USA) software was used for the statistical analyses.
Results
Cancer-derived circulating miR-410-5p in peripheral blood is transported into dendritic cells in association with AGO2
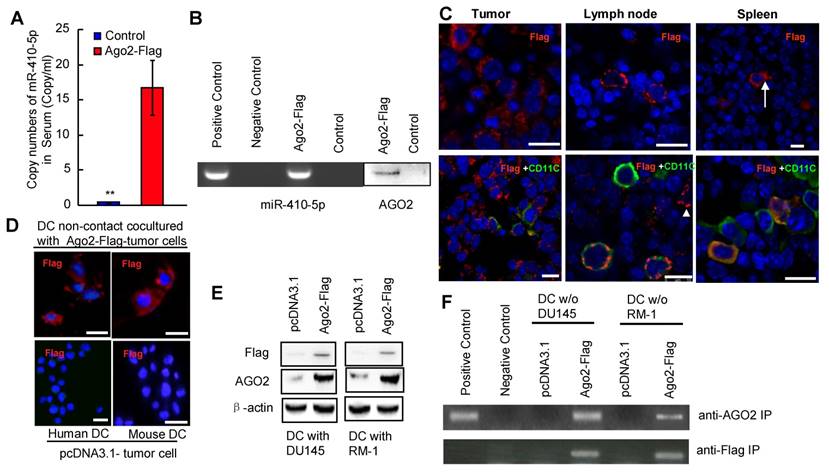
We investigated the level of miR-410-5p in the blood samples and cancer cell culture by qRT-PCR as well as the co-existence of miR-410-5p and Ago2 in those samples by immunoprecipitation (IP). We found that the level of miR-410-5p was relatively high in the peripheral blood of cancer patients and correlated with that of AGO2 found in circulation (Figure S1), indicating that miR-410-5p and AGO2 were associated together. In order to determine the target cells to which these miRNAs travel, a vector encoding the AGO2-FLAG fusion protein was constructed and transfected into prostate cancer cell lines (RM-1 and DU145 cells). The transfection resulted in the successful stable overexpression of the AGO2-FLAG fusion protein in both cell lines, which was confirmed by immunofluorescence staining and western blotting (Figure S2A and S2B). IP with the anti-FLAG antibody revealed that both miR-410-5p and AGO2 were immunoprecipitated together from both the cytoplasm and CM (Figure S2C), indicating that miR-410-5p and the AGO2/FLAG fusion protein were co-expressed and transported together. Therefore, in the following in vitro and in vivo studies, FLAG was used as a tracer to track the fusion protein, which retained the capacity to be associated with miR-410-5p. We injected C57BL/6J mice subcutaneously with RM-1 cells that stably expressed miR-410-5p and the AGO2/FLAG fusion protein (as described in the Materials and Methods). When the tumors reached approximately 5 mm in diameter, miR-410-5p was observed at a significant level in the peripheral blood of tumor-bearing mice (Ago2-Flag), but not in control mice (Con) (p<0.05, Figure 1A). These results suggest that cancer cells produced miR-410-5p and secrete it into peripheral blood. The results of an IP with an anti-FLAG antibody revealed that both miR-410-5p and AGO2 were present in the IP complexes taken from peripheral blood samples (Figure 1B), indicating that both cancer-derived miR-410-5p and AGO2 were indeed associated. Furthermore, the results indicated that the AGO2-FLAG fusion protein only existed in cancerous tissue (Tumor), the spleen (Spleen), and bilateral axillary lymph node tissue (Lymph node) (Figure 1C, upper panel), but not in the liver, kidney, and heart (data not shown). In AGO-FLAG-positive tissues, we found some cells that not only stably expressed AGO2-FLAG fusion protein, which was associated with miR-410-5p, but also were similar to DCs in size and morphology (Figure 1C, upper panel, arrow). To further confirm those cells were indeed DCs, we employed double staining to verify the co-localization of AGO2-FLAG and CD11c (a marker of DCs) in those cells by immunofluorescence (Figure 1C, lower panel and Figure S3). These in vivo results clearly suggested that AGO2, associated with miR-410-5p, was transported to DCs, although we could not exclude the possibility that AGO2 and miR-410-5p could enter other immune cells (Figure 1C, lower panel, white triangle and Figure S3, white triangle). To further confirm this discovery, we co-cultured DCs and cancer cells (expressing AGO2-FLAG fusion protein) under non-contact culture conditions (described in the Full Materials and Methods), and found that the AGO2-FLAG fusion protein secreted by the cancer cells was truly transported into DCs according to immunofluorescence (Figure 1D). These results were further confirmed by western blotting (Figure 1E) and IP with antibodies against FLAG and AGO2 (Figure 1F). Taken together, these data strongly suggested that circulating miR-410-5p was transported into DCs in association with AGO2.
Dendritic cells are the recipients of circulating miR-410-5p produced by cancer cells. A. Levels of miR-410-5p in serum from RM-1 tumor-bearing mice that were subcutaneously injected with pcDNA3.1-Ago2-Flag (Ago2-Flag) compared to control mice without cancer (Con). The data are presented as the mean ± standard deviation (SD) of three independent experiments, ** P < 0.01. B. Levels of miR-410-5p (left, RT-PCR assay) and AGO2 (right, western blot) after immunoprecipitation (IP) with anti-Flag antibody in serum from RM-1 tumor-bearing mice that were subcutaneously injected with pcDNA3.1-Ago2-Flag (Ago2-Flag) compared to control mice without cancer (Con). Positive control: RM-1 cell lysates. Negative control: Protein A. C. Representative immunofluorescence (IF) results with anti-Flag (upper panel) and dual staining of both Flag and CD11c (lower panel) for the tumors, lymph nodes, and spleen from RM-1 tumor-bearing mice. The images were acquired by Leica confocal laser scanning microscope (Leica TCS MP). Blue fluorescence indicates cell nuclei stained with DAPI. The arrow highlights one DC with cellular processes indicative of maturation. The arrowhead indicates one immune cell that is Flag positive but CD11c negative. Scale bars represent 10 μm. D. Representative IF results with an anti-Flag antibody for DCs in non-contact co-cultures with either RM-1 or DU145 cells transfected with pcDNA3.1-Ago2-Flag (upper) or empty vector pcDNA3.1 (lower). Blue fluorescence indicates cell nuclei stained with DAPI. Scale bars represent 10 μm. E. Levels of Ago2-Flag protein complexes in DCs in non-contact co-cultures with DU145 and RM-1 cells transfected with pcDNA3.1-Ago2-Flag (Ago2-Flag) or empty vector pcDNA3.1 (pcDNA3.1). β-actin was used as a loading control. F. Levels of miR-410-5p in protein complexes after IP with an anti-AGO2 and an anti-Flag in DCs in non-contact co-cultures with DU145 and RM-1 cells transfected with pcDNA3.1-Ago2-Flag (Ago2-Flag) or DCs alone. Positive control: Cell lysates from primary DCs cultured alone. Negative control: Protein A.
Cancer-derived miR-410-5p directly interacts with miR-410-3p in dendritic cells
To analyze the function of miR-410-5p in DCs, the DCs were either co-cultured with RM-1 cells (termed RM-1 [C]) under non-contact conditions or cultured without RM-1 cells but supplemented with debris from RM-1 cells (termed RM-1 [D]). In the latter case, we utilized cancer cell debris as an antigen to stimulate DCs in the absence of cancer cells in order to find out how DCs responded to the cancer cell debris without interference from the effect of living cancer cells in inhibiting DCs. As expected, when co-cultured with living cancer cells, the majority of the DCs displayed fewer dendritic processes and lower expression of maturation markers (CD80 and CD86). However, when stimulated with RM-1 cell debris, the DCs displayed more dendritic processes and higher expression of both CD80 and CD86, indicating that the cancer cell debris activated DCs and promoted their maturation while the living cancer cells inhibited the maturation of DCs (Figure S4A).
The expression profiles of both miRNA and mRNA from DCs under two different conditions were then evaluated using the Affymetrix miRNA 4.0 chip (high-throughput and high specificity) [28]. The heat map of miRNAs was shown in a map that distinguished the two types of DCs (Figure S4B). Specifically, high levels of four miRNAs (mmu-miR-1896-3p, miR-335-5p, mmu-miR-6958-5p, and miR-410-3p) were observed in DCs cultured with debris from RM-1 cells (D). However, the levels of these four miRNAs were very low in DCs co-cultured with RM-1 cells (C) along with an increase in the level of miR-410-5p (Figure S4B). These results suggest that DCs express miR-410-3p under the stimulus of cancer cell debris and cancer-derived miR-410-5p can be transported to DCs, which was further confirmed by qRT-PCR (Figure 2A).
miR-410-5p directly interacts with miR-410-3p in vivo. A. Levels of miR-410-5p and miR-410-3p in DCs stimulated by RM-1 cells (upper panel) or DU145 cells (lower panel). D: tumor cell debris, C: non-contact co-culture. The data are presented as the mean ± SD of three independent experiments, ** P < 0.01. B. Duplexes consisting of miR-mock/miR-410-3p, miR-410-5p/miR-410-3p, miR-410-5p/mmu-miR-1896-3p. C. Representative results for the in vivo cellular localization of FAM (Excitation [Ex]: 488 nm, Emission [EM]: 516 nm), and Cy3 (Ex: 508-532 nm, Em: 568 nm) in DCs observed by real-time imaging flow cytometry (Amnis image stream mkII) after co-transfection of the cells with labeled miRNAs for 6 h. Scale bars represent 10 µm. D. Time-dependent analysis using real-time imaging flow cytometry of the mean fluorescence intensity (MFI) of both FAM and FRET (FAM◊ Cy3) in RWPE-1 cells co-transfected with labeled miRNAs. Values of MFI are indicated. The data are presented as the mean ± SD of three independent experiments. E. The interaction between miR-410-5p and miR-410-3p. miR-410-5pFAM and miR-410-3pCy3 in transfected RWPE-1 cells were immunoprecipitated using an anti-FAM/Cy3 antibody and then analyzed by qRT-PCR. Positive control: RWPE-1 cell lysates. Negative control: Protein A.
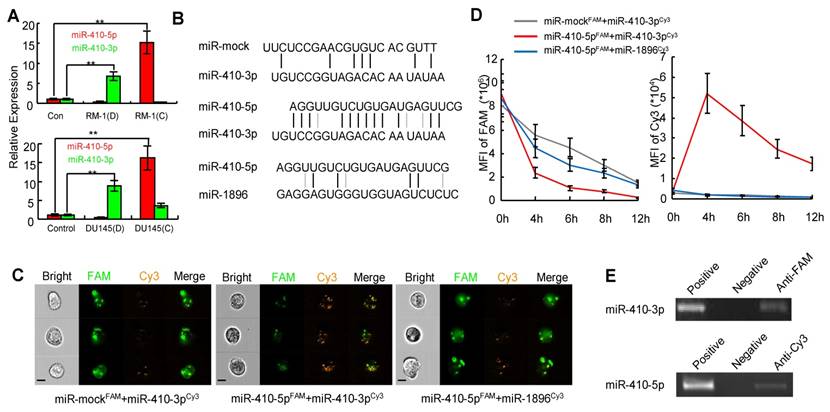
Inspired from our recent finding that VEGFα was downregulated by miR-410-3p (i.e. miR-410) in retinal cells during the neonatal period [29], we further confirmed that miR-410-3p also suppressed VEGFα expression during angiogenesis in prostate cancer (Figure S5). This result suggests that miR-410-3p was derived from DCs stimulated with tumor cells to suppress cancer progression by inhibiting angiogenesis The sequences of miR-410-5p and miR-410-3p, both of which are derived from pre-miR-410, are highly complementary across 12 base pairs, while mmu-miR-1896-3p and miR-335-5p only have 4 and 6 base pairs that are complementary to miR-410-5p, respectively (Figure 2B, Figure S6A). Therefore, to investigate whether the high complementarity between miR-410-5p and miR-410-3p drives the binding interaction of miR-410-5p with miR-410-3p after miR-410-5p is transported to DCs, we chose mmu-miR-1896-3p and miR-335-5p, though also expressed in DCs, as non-complementary control miRNAs in the subsequent study. In addition, we used two other complementary miRNA pairs (miR-410-5p/anti-miR-410-5p and miR-590-5p/anti-miR-590-5p) as positive controls in these experiments (Figure S6) because the two counterparts in each pair have been previously verified to be capable of binding each other [30].
We hypothesized that circulating miR-410-5p, once transported into DCs, might antagonize miR-410-3p in DCs, resulting in a protective effect against cancer angiogenesis. To prove our hypothesis, we analyzed the direct interaction between miR-410-5p and miR-410-3p in vitro using a microplate reader. We labeled miR-410-5p and miR-mock with FAM (green, as a donor fluorophore), while mmu-miR-1896-3p, miR-335-5p (as a non-specific control), and miR-410-3p were labeled with cy3 (orange, as an acceptor fluorophore) (Figure S7A). As expected, fluorescence resonance energy transfer (FRET) was significantly higher between miR-410-5p and miR-410-3p, but significantly lower between other pairs (miR-mock/miR-410-3p and miR-410-5p/mmu-miR-1896-3p, miR-410-5p/miR-335-5p, as shown in Figure S7B). These miRNAs pairs were then co-transfected into RWPE-1 cells, a human non-cancerous prostate epithelial cell line that lacked endogenous miR-410-5p, miR-410-3p, mmu-miR-1896-3p, and miR-335-5p. The results of real-time imaging flow cytometry demonstrated an inverse correlation in the fluorescence intensity between the FAM in miR-410-5p and the Cy3 in miR-410-3p at the foci where they co-localized, confirming the occurrence of FRET arising from the close proximity between these two miRNAs due to their binding interaction. This is further verified in DCs by the fact that such inverse correlation was not observed in other control miRNA pairs (miR-mock/miR-410-3p, miR-410-5p/mmu-miR-1896-3p. or miR-410-5p/miR-335-5p) (Figure 2C, Figure S6C left panel). Moreover, the transfer of fluorescence from FAM to Cy3 could still be continuously observed within 4-12 h (Figure 2D, right panel), suggesting that miR-410-5p and miR-410-3p were stably bound together. To further confirm that such binding interaction occurred in vivo, FAM-labeled miR-410-5p was immunoprecipitated from the cells by means of an anti-FAM antibody. We found that the immunoprecipitated complex contained a significant amount of miR-410-3p (Figure 2E upper panel). A significant amount of miR-410-5p was also observed in complexes immunoprecipitated with an anti-Cy3 antibody for labeled miR-410-3p (Figure 2E, lower panel). These results suggested that mature miR-410-5p/miR-410-3p could form a stable duplex in DCs via sequence complementarity.
miR-410-5p degrades miR-410-3p through a miRNA-miRNA interaction
We next investigated whether miR-410-5p negatively regulated miR-410-3p once it entered the DCs. Primary DCs were transfected with either anti-miR-410-5p or anti-mock, and then co-cultured with prostate cancer cells, DU145 or RM-1 cells. In anti-mock-transfected DCs, high miR-410-5p level, in contrast to the very low miR-410-3p level, was observed, while significantly increased miR-410-3p level as well as significantly reduced miR-410-5p level were observed in anti-miR-410-5-transfected DCs (Figure 3A), indicating that miR-410-5p could downregulate miR-410-3p. Next, miR-410-3p, mmu-miR-1896-3p, and miR-335-5p were double-labeled with 3'-FAM and 5'-Cy3 to generate miR-410-3pFluor, mmu-miR-1896-3pFluor, and miR-335-5pFluor, respectively (Figure S7C). We then transfected DCs with each of these miRNAs along with either miR-410-5p or miR-mock. Co-localization of strong FAM signals and significantly weak Cy3 signals were observed in DCs co-transfected with miR-410-3pFluor and miR-410-5p, indicating the absence of a FRET response between 3'-FAM and 5'-Cy3 on the same miR-410-3p (Figure 3B). These results suggest that miR-410-5p/miR-410-3p duplex formation resulted in miR-410-3p degradation, which in turn spatially separated the FAM and Cy3 (originally located at each opposing end of the miR-410-3p), making the FRET response between them impossible. However, FRET response, namely, an increase in the Cy3 fluorescence intensity accompanying a decrease in FAM fluorescence intensity, occurred in DCs co-transfected with other three control miRNA pairs (miR-410-3pFluor and miR-mock, mmu-miR-1896-3pFluor and miR-410-5p, as well as miR-335-5pFluor and miR-410-5p) (Figure 3B, Figure S8A, left panel; S8B), suggesting that miR-410-3pFluor, mmu-miR-1896-3pFluor and miR-335-5pFluor were not degraded by the co-existing miRNAs in these control experiments, spatially favoring the FRET response between 3'-FAM and 5'-Cy3 associated with the same miRNA molecules. In another control experiment involving two positive control miRNA pairs (miR-410-5pFluor/anti-miR-410-5p and miR-590-5pFluor/anti-miR-590-5p) (Figure S8A, middle and right panel), FRET response was also inhibited because the binding of the complementary pairs degraded the double-labeled miRNAs, breaking the proximity of 3'-FAM and 5'-Cy3 belonging to the same miRNA molecules. It should be noted that these two pairs were selected as a positive control because the binding of one miRNA with its counterpart in each pair was proved to degrade the counterpart [31].
miR-410-5p promotes miR-410-3p degradation in vivo. A. Levels of both miR-410-5p and miR-410-3p in DCs transfected with either anti-mock or anti-miR-410-5p, which were co-cultured with DU145 cells (left panel) or RM-1 cells (right panel), respectively. The data are presented as the mean ± SD of three independent experiments, ** P < 0.01. B. Representative results of the in vivo cellular localization of FAM (Ex: 488 nm, Em: 516 nm), and Cy3 (Ex: 508-532 nm, Em: 568 nm) in DCs analyzed by real-time imaging flow cytometry (Amnis image stream mkII) 6 h after co-transfection with labeled miRNAs. The values of the MFI are shown. Scale bars represent 10 μm. C. miR-410-3pFluor in transfected DU145 and RWPE-1 cells analyzed by real-time imaging flow cytometry (Amnis image stream mkII) (right panel), and miR-410-3p levels evaluated by qRT-PCR at different time points after transfection (left panel). The data are presented as the mean ± SD of three independent experiments, ** P < 0.01. Scale bars represent 10 μm. D. AGO2 was found in the immunoprecipitated complexes with anti-Cy3 derived from DU145 cells but not from RWPE-1 cells that were transfected with miR-410-3pFluor (upper panel). Dual staining in DU145 cells confirmed the results of real-time imaging flow cytometry (Amnis image stream mkII) (lower panel). Scale bars represent 10 μm.
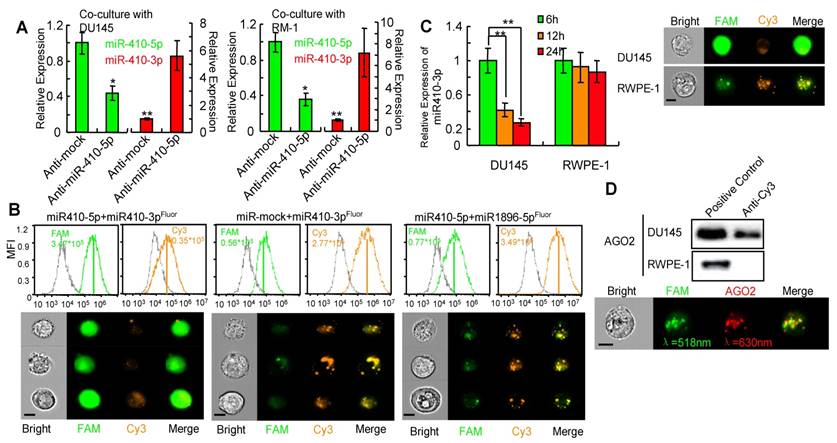
Furthermore, we transfected the double-labeled miR-410-3p into DU145 cells bearing endogenous miR-410-5p. We did not observe FRET response between 3'-FAM and 5'-Cy3 of the double-labeled miR-410-3p. In contrast, significant FRET response was observed in RWPE-1 cells without endogenous miR-410-5p when the double-labeled miR-410-3p was transfected into the RWPE-1 cells (Figure 3C). These data further confirmed in vivo that the miR-410-3pflour was degraded by the endogenous miR-410-5p due to duplex formation. To further confirm that the degradation of double-labeled miR-410-3p by miR-410-5p is through a RNA-induced silencing complex (RISC) mechanism[31] involving miRNA/AGO2 complex, we carried out an IP assay using anti-Cy3 antibody and found that AGO2 was present in the immunoprecipitated complexes (Figure 3D, upper panel). This result suggested that Ago2 was indeed associated with the duplex of miR-410-3p and miR-410-5p, which was further confirmed by quantitative imaging flow cytometry (Figure 3D, lower panel) where FAM fluorescence from FAM-labeled miR-410-3p and APC fluorescence from APC-labeled AGO2 were detected from the same complex. Collectively, the results indicated that miR-410-3p was degraded in DCs following the entry of miR-410-5p into DCs and the subsequent duplex formation via sequence complementarity.
Blockade of miR-410-5p results in upregulation of circulating miR-410-3p and inhibits tumor growth
To analyze the interaction between miR-410-5p and miR-410-3p during carcinogenesis in vivo, we injected pLKO-anti-mock (anti-mock) and pLKO-anti-miR-410-5p (anti-miR-410-5p) into DU145 tumor-bearing nude mice (described in the Materials and Methods). After 30 days, in anti-mock group, we observed a high level of miR-410-5p in serum while miR-410-3p was almost undetectable (Figure 4A, left panel). However, in anti-miR-410-5p-treated mice, the miR-410-5p level decreased along with an increase in the miR-410-3p level. Consistent with these results, VEGFα (a target of miR-410-3p) levels were high in anti-mock-treated mice but low in anti-miR-410-5p-treated mice (Figure 4A, right panel). We next analyzed CD31+ vascular endothelial cells using MVD assays to evaluate angiogenesis. The results of these experiments indicated that there were significantly more CD31+ cells in the tumors of anti-mock-treated mice compared to those of anti-miR-410-5p-treated mice (Figure 4B, upper panel). Statistically, the MVD was approximately 70% for tumors analyzed from the anti-mock-treated mice, which was much higher than that of the tumors analyzed from the anti-miR-410-5p-treated mice (P < 0.01) (Figure 4B, lower panel). Therefore, the blockade of miR-410-5p effectively increased miR-410-3p levels, inhibiting angiogenesis in vivo. We then further assessed whether blockade of miR-410-5p could affect tumor growth. Anti-mock-treated DU145 tumor-bearing mice exhibited progressive tumor growth and died after approximately 40 days. In contrast, anti-miR-410-5p-treated mice exhibited a delay in tumor growth and hence a significantly prolonged life span (Figure 4C, left and middle panel). Remarkably, the tumors disappeared completely in some of the anti-miR-410-5p-treated mice (3/15) (Figure 4C right panel). These results suggest that delivering an anti-miR-410-5p can effectively suppress miR-410-5p, which rescued the miR-410-3p in DCs to inhibit tumor angiogenesis and the subsequent tumor growth.
Blocking miR-410-5p up-regulates miR-410-3p in peripheral blood and reduces tumor growth in vivo. A. Left panel: Levels of miR-410-5p and miR-410-3p in serum from DU145-tumor-bearing nude mice treated with either pLKO-anti-mock (Anti-mock) or pLKO-anti-miR-410-5p (Anti-miR-410-5p). Right panel: VEGFα protein levels in DU145-tumor-bearing nude mice treated with anti-mock or anti-miR-410-5p. The mean ± SD of five independent experiments, *P< 0.05, ** P < 0.01. B. Significant decreases in vascularization are shown (upper panel). Levels of vascular endothelial cells evaluated by the MVD (lower panel) in immunofluorescence experiments with anti-CD31. DAPI (blue) represents the nucleus and CD31 (red) represents blood vessels. Scale bars represent 20 μm. The data are presented as the mean ± SD of three independent experiments, ** P < 0.01. C. Representative results for DU145 tumors after treated with anti-mock or anti-miR-410-5p (left panel) and photographed by a camera (Olympus EM5). Tumor size was measured twice every week and plotted for each individual DU145-tumor-bearing nude mouse (middle panel). Each curve represents the tumor size for a single mouse (five mice in each group). The curve ends at the time when the mouse was sacrificed. The survival rate for each treatment group (right panel). D. Results from a pathological examination of prostate tissue from a 7-month-old male knockout mouse (left panel). Six mice were found to have prostate cancer (PCa) and 4 had benign prostatic hyperplasia (BPH). The levels of miR-410-5p in the serum of mice with PCa or BPH (right panel) were assessed using qRT-PCR. ** P<0.01. Scale bars represent 50μm. E. Left panel: Levels of both miR-410-5p and miR-410-3p in the sera of PtenL/L and PB-Cre+ mice following treatment with anti-mock or anti-miR-410-5p (left panel). * P < 0.05, ** P < 0.01. Right panel: Mean prostate weight in each treated member of the group (right panel). n = 14, ** P < 0.01.
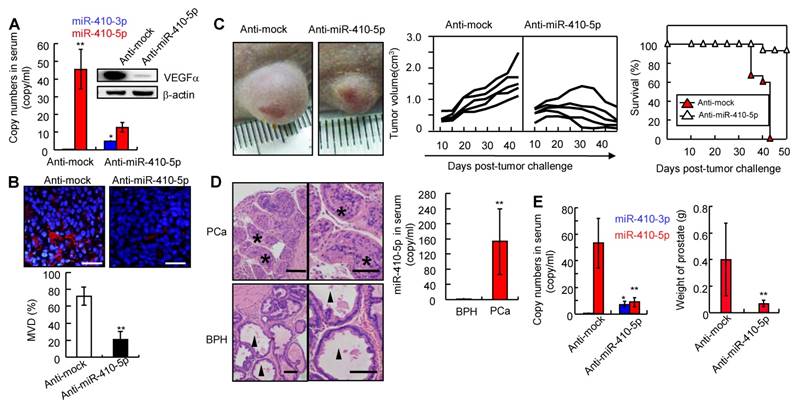
Prostate cancer can arise in PtenL/L and PB-Cre+ mice (described in the Materials and Methods, Figure S9A). Mice with prostate cancer (PCa, n = 6) or benign prostatic hyperplasia (BPH, n = 4) were used to investigate the miR-410-5p/miR-410-3p expression (Figure 4D left panel). The level of miR-410-5p was significantly higher in mice with prostate cancer (PCa) than that in mice with BPH (Figure 4D, right panel), while miR-410-3p was not detected in either prostate cancer or benign prostatic hyperplasia mice (data not shown). However, in the anti-miR-410-5p-treated mice, miR-410-5p was effectively inhibited compared to the controls, while miR-410-3p was upregulated (Figure 4E, left panel). It was also found that angiogenesis was markedly reduced (Figure S9B), with smaller burden on both the prostate (Pt) and seminal vesicle (Sv) observed when compared to anti-mock-treated mice (Figure 4E, right panel and Figure S9C). Remarkably, 7.1% (1/14) of anti-miR-410-5p-treated mice developed PCa without any invasion compared to 78.6% (11/14) of anti-mock-treated mice with prostate cancer, particularly for 72.7% (8/11) that had prostate cancer with Sv invasion. Thus, blockade of miR-410-5p in circulation significantly inhibited angiogenesis and reduced tumor growth in vivo through upregulation of miR-410-3p.
Discussion
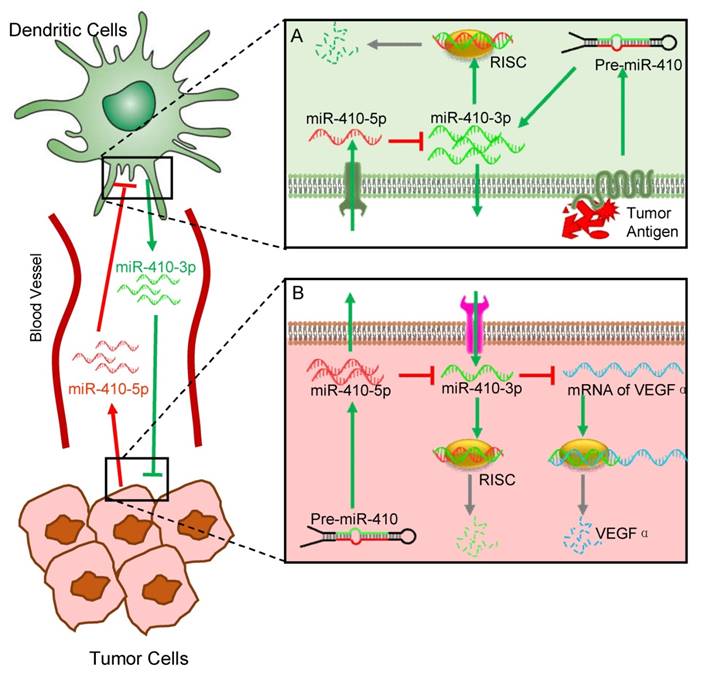
In the present study, we have discovered a novel interaction between DCs and cancer cells, which is modulated by aberrant miRNAs abundant in the peripheral blood of cancer patients. Interactions between different cells are involved in cancer initiation and progression. Understanding the mechanisms controlling cell-cell interactions during cancer progression is important for the development of new therapeutics. Among different types of cells involved in cancer progression, the interaction between cancer cells and immune cells is one of the keys to such understanding. Here, our findings suggest a new role of DCs in interacting with cancer cells, which is regulated by circulating miRNAs that can serve as the cancer biomarkers, in addition to their traditional roles as immune cells (Figure 5). Specifically, cancer cells stimulate DCs to produce miR-410-3p, which, if not degraded, can target VEGFα to inhibit angiogenesis and thus suppress tumor growth. However, cancer cells also express miR-410-5p and secrete it into the peripheral blood. The circulating miR-410-5p is then transported into DCs by means of association with AGO2 protein. Once inside DCs, the miR-410-5p then forms a duplex with miR-410-3p through complementary pairing across 12 bases. The duplex formation results in the degradation of miR-410-3p and thus suppresses its capability in inhibiting tumor angiogenesis, favoring tumor angiogenesis and the subsequent tumor growth.
Schematic illustration of the miRNA-mediated interactions between cancer cells and dendritic cells (DCs). The overall interactions are mediated by tumor-derived circulating miR-410-5p and DC-derived miR-410-3p, both of which share the same precursor (pre-miR-410). Under the stimulus of cancer cell antigens, DCs produce miR-410-3p, which functions to target VEGF for suppressing tumor angiogenesis (A). However, cancer cells express miR-410-5p and secrete it into the peripheral blood. The circulating miR-410-5p is then transported into DCs by means of association with AGO2 protein. Once inside DCs, the miR-410-5p then forms a duplex with miR-410-3p through complementary pairing across 12 bases. The duplex formation results in the degradation of miR-410-3p, which promotes the tumor angiogenesis and thus favors the tumor progression (B).
Adoptive VEGFα therapy in anti-tumor angiogenesis was nowadays considered as a promising method for clinical cancer treatment. However, clinical trials indicated that the efficacy of this strategy was limited [32, 33]. The above new mechanism of miRNA-modulated interactions between DCs and cancer cells will lay foundation for developing new strategies of cancer therapy based on suppressing tumor angiogenesis. For instances, one immediate strategy is to use anti-miR-410-5p that can target miR-410-5p to disable its function of degrading miR-410-3p. Another alternative strategy is to inhibit the cancer cells to produce miR-410-5p while promoting DCs to produce miR-410-3p in order to inhibit tumor growth by suppressing tumor angiogenesis. These strategies are promising, as demonstrated by our animal study (Figs. 3-4). In this sense, our work might open up a new avenue in understanding the mechanisms of interactions between immune cells and cancer cells as well as searching for new therapeutics for cancer therapy.
Our findings indicate that crosstalk between two different types of cells can be achieved by two miRNAs derived from the same precursor (Figure 5). A miRNA precursor could be processed into two sequence-related single-stranded miRNAs: a mature guide miRNA and a passenger strand in the cytoplasm [34, 35]. The fate of two miRNAs derived from a single miRNA precursor in the same cells has been reported [36-38]. miRNAs derived from either the -3p or -5p of the same precursor are frequently found in different cells and tissues including cancer cells and tumor tissues [37, 39]. miRNAs were initially thought to solely repress mRNA translation or destabilize mRNA transcripts, leading to decreased expression of the target protein. However, it is not known whether or not two miRNAs (miR-5p/miR-3p) produced from the same precursor but were originally present in different cells or tissues could interact to influence physiological and pathological activities. Our work shows that two such miRNAs, when originally present in cancer cells and immune cells, respectively, could eventually meet in one cell; such meeting induces the formation of duplex between these two miRNAs, resulting in the degradation of one miRNA responsible for suppressing tumor angiogenesis, to favor cancer progression. Although we describe the above mechanism using these two miRNAs between cancer cells and immune cells (dendritic cells), it should be emphasized that it is likely that other pairs of miRNAs, derived from an identical precursor, may be involved in the interaction between different cells and tissues in the similar manner..
Circulating miRNAs associated with various cancers have been detected in the peripheral blood of patients with a broad range of cancer [40-43]. Mutual interactions between two highly complementary miRNAs, such as miR-410-3p and miR-410-5p in prostate cancer, may generally exist in other cancers (Figure S1A). In addition to our findings in DCs, circulating miR-410-5p might also enter other immunocytes in lymph nodes (Figure 1C, lower panel, white triangle and Figure S3, white triangle), suggesting that other immunocytes such as NK cells and B cells may also mediate the anti-cancer response through another mechanism rather than through the traditional immune response. To understand such a mechanism requires a further study.
In summary, by a series of in vitro and in vivo studies, we discovered that miR-410-5p, the miRNA secreted from cancer cells and abundant in the peripheral blood of cancer patients, can be transported into DCs, one of the important immune cells, by association with AGO. Cancer cells are found to stimulate DCs to promote miR-410-3p, another miRNA that is derived from the same precursor (pre-miR-410) but functions to target VEGF to suppress tumor angiogenesis. Once in DCs, the miR-410-5p degrades the miR-410-3p through base pairing to form a duplex between the two miRNAs. The degradation of miR-410-3p promotes the tumor angiogenesis and thus favors the tumor progression. Our work suggests a new mechanism of the interaction between immune cells and cancer cells, mediated by two miRNAs originally processed from the same precursor in two different cells. It also suggests that developing therapeutics, which can promote miR-410-3p or inhibit miR-410-5p, will be promising strategies in cancer therapy.
Abbreviations
RNA: Ribonucleic Acid
miRNA: micro-RNA
DCs: Dendritic Cell
NK cells: natural killer cells
mRNA: message RNA
AGO2: Argonaute-2
qRT-PCR: Quantitative real-time PCR
DU145: Human prostate cancer cell line
RWPE-1: Human prostate epithelial cell line
RM-1: Mouse prostate cancer cell line
DMEM: Dulbecco minimum essential medium
FCS: fetal calf serum
RPMI1640: Roswell Park Memorial Institute 1640 medium
FBS: fetal bovine serum
CO2: carbon dioxide
BMDCs: bone marrow dendritic cells
CD14: cluster of differentiation 14
GM-CSF: Granulocyte macrophage colony stimulating factor
IL-4: interleukin 4
LPS: lipopolysaccharides
CD11c: cluster of differentiation 11 component 3
CM: culture medium
RNaseA1: Ribonuclease A1
U6: U6 small nuclear RNA
Flag: FLAG octapeptide
TBS-T: Tris-buffered saline with Tween 20
SDS: Sodium dodecyl sulfate
ACTB: Beta-actin
VEGFα: Vascular endothelial growth factor alpha
ECL: electrochemiluminescence
ChIP: Chromatin immunoprecipitation
RIP: RNA immunoprecipitation
IP: protein immunoprecipitation
FAM: carbo-fluorescein
Cy3: Cyanine 3
FRET: fluorescence resonance energy transfer
mAbs: monoclonal antibodies
APC: Allophycocyanin
FITC: Fluorescein
MVD: microvascular density
Pten: Phosphatase and tensin homolog
SD: standard deviation
Ct value: The cycle crossing threshold
ANOVA: analysis of variance
CD80: Cluster of differentiation 80
CD86: Cluster of differentiation 86
RISC: RNA-induced silencing complex
Pt: prostate
Sv: seminal vesicle
PCa: Prostate cancer
Supplementary Material
Supplementary figures and tables.
Acknowledgements
This work was supported by the National Natural Science Foundation (No: 81372763), the China National Funds for Distinguished Young Scientists (No: 81425019), a specially-appointed Professor of Shanghai (No: GZ2015009), National Natural Science Foundation (Nos: 81172448 and 51673168), and the National Basic Research Program of China (2012CB518300). CBM would also like to thank the financial support from National Institutes of Health (CA200504, CA195607 and EB021339), Department of Defense Office of Congressionally Directed Medical Research Programs (W81XWH-15-1-0180), and Oklahoma Center for the Advancement of Science and Technology (HR14-160).
Author Contributions
JQ.W performed the experiments and analyzed and interpreted the data. HM.Y and provided the patient samples and clinical data and analyzed and interpreted the data. DD.Z performed the cellular experiments and K.C performed animal experiments. YJ.H and YX.Y analyzed and interpreted the data and wrote the manuscript. The JQ.W, HM.Y, DD.Z., K.C., YJ.H and XY.Y are co-first authors and contributed equally to this work. CJ.Z, YW.Y, and SP.L conceived of and designed the study, and interpreted the data. L.L, K.C, and JJ.H performed the experiments. FB.W, BH.Q, and G.L provided the clinical samples and clinical data. SR.L and CB.M conceived of and designed the study, supervised the project, and revised the manuscript. JQ.W, HM.Y, DD.Z, YJ.H, K.C, and XY.Y contributed equally to this work.
Competing Interests
The authors have declared that no competing interest exists.
References
1. Dunn GP, Bruce AT, Ikeda H, Old LJ, Schreiber RD. Cancer immunoediting: from immunosurveillance to tumor escape. Nature Immun. 2002;3:991-998
2. Patel PL, Suram A, Mirani N, Bischof O, Herbig U. Derepression of hTERT gene expression promotes escape from oncogene-induced cellular senescence. Proc Natl Acad Sci USA. 2016;113:E5024-E5033
3. Li BX, Yu Q, Shi ZL, Li P, Fu S. Circulating microRNAs in esophageal squamous cell carcinoma: association with locoregional staging and survival. Int J Clin Exp Med. 2015;8:7241-7250
4. Kanaan Z, Rai SN, Eichenberger MR, Roberts H, Keskey B, Pan J. et al. Plasma miR-21: a potential diagnostic marker of colorectal cancer. Annals Surg. 2012;256:544-551
5. Keller A, Leidinger P, Bauer A, Elsharawy A, Haas J, Backes C. et al. Toward the blood-borne miRNome of human diseases. Nat Methods. 2011;8:841-843
6. He L, Thomson JM, Hemann MT, Hernando-Monge E, Mu D, Goodson S. et al. A microRNA polycistron as a potential human oncogene. Nature. 2005;435:828-833
7. D'Souza-Schorey C, Clancy JW. Tumor-derived microvesicles: shedding light on novel microenvironment modulators and prospective cancer biomarkers. Genes Dev. 2012;26:1287-1299
8. Yu Z, Willmarth NE, Zhou J, Katiyar S, Wang M, Liu Y. et al. microRNA 17/20 inhibits cellular invasion and tumor metastasis in breast cancer by heterotypic signaling. Proc Natl Acad Sci USA. 2010;107:8231-8236
9. Korpal M, Ell BJ, Buffa FM, Ibrahim T, Blanco MA, Celia-Terrassa T. et al. Direct targeting of Sec23a by miR-200s influences cancer cell secretome and promotes metastatic colonization. Nat Med. 2011;17:1101-8
10. Yang P, Li QJ, Feng Y, Zhang Y, Markowitz GJ, Ning S. et al. TGF-beta-miR-34a-CCL22 signaling-induced Treg cell recruitment promotes venous metastases of HBV-positive hepatocellular carcinoma. Cancer Cell. 2012;22:291-303
11. Karrich JJ, Jachimowski LC, Libouban M, Iyer A, Brandwijk K, Taanman-Kueter EW. et al. MicroRNA-146a regulates survival and maturation of human plasmacytoid dendritic cells. Blood. 2013;122:3001-3009
12. Baumjohann D, Ansel KM. MicroRNA-mediated regulation of T helper cell differentiation and plasticity. Nat Rev Immun. 2013;13:666-678
13. Zawislak CL, Beaulieu AM, Loeb GB, Karo J, Canner D, Bezman NA. et al. Stage-specific regulation of natural killer cell homeostasis and response against viral infection by microRNA-155. Proc Natl Acad Sci USA. 2013;110:6967-6972
14. Zonari E, Pucci F, Saini M, Mazzieri R, Politi LS, Gentner B. et al. A role for miR-155 in enabling tumor-infiltrating innate immune cells to mount effective antitumor responses in mice. Blood. 2013;122:243-252
15. Schmitt MJ, Margue C, Behrmann I, Kreis S. MiRNA-29: a microRNA family with tumor-suppressing and immune-modulating properties. Current molecular medicine. 2013;13:572-585
16. Hannafon BN, Carpenter KJ, Berry WL, Janknecht R, Dooley WC, Ding WQ. Exosome-mediated microRNA signaling from breast cancer cells is altered by the anti-angiogenesis agent docosahexaenoic acid (DHA). Mol Cancer. 2015;14:133
17. Valadi H, Ekstrom K, Bossios A, Sjostrand M, Lee JJ, Lotvall JO. Exosome-mediated transfer of mRNAs and microRNAs is a novel mechanism of genetic exchange between cells. Nat Cell biol. 2007;9:654-659
18. Wang J, Ye H, Zhang D, Hu Y, Yu X, Wang L. et al. MicroRNA-410-5p as a potential serum biomarker for the diagnosis of prostate cancer. Cancer Cell Int. 2016;16:12
19. Griffiths-Jones S, Grocock RJ, van Dongen S, Bateman A, Enright AJ. miRBase: microRNA sequences, targets and gene nomenclature. Nucl Acids Res. 2006;34:D140-D144
20. Griffiths-Jones S, Saini HK, van Dongen S, Enright AJ. miRBase: tools for microRNA genomics. Nucl Acids Res. 2008;36:D154-D158
21. Kozomara A, Griffiths-Jones S. miRBase: integrating microRNA annotation and deep-sequencing data. Nucl Acids Res. 2011;39:D152-D157
22. Kozomara A, Griffiths-Jones S. miRBase: annotating high confidence microRNAs using deep sequencing data. Nucl Acids Res. 2014;42:D68-D73
23. Griffiths-Jones S. The microRNA Registry. Nucl Acids Res. 2004;32:D109-D111
24. Ganguly A, Rock MJ, Prockop DJ. Conformation-sensitive gel electrophoresis for rapid detection of single-base differences in double-stranded PCR products and DNA fragments: evidence for solvent-induced bends in DNA heteroduplexes. Proc Natl Acad Sci USA. 1993;90:10325-10329
25. Freeman D, Lesche R, Kertesz N, Wang S, Li G, Gao J. et al. Genetic background controls tumor development in PTEN-deficient mice. Cancer Res. 2006;66:6492-6496
26. Blanchard P, Guillot S, Antunez K, Koglberger H, Kryger P, de Miranda JR. et al. Development and validation of a real-time two-step RT-qPCR TaqMan((R)) assay for quantitation of Sacbrood virus (SBV) and its application to a field survey of symptomatic honey bee colonies. J Virol Methods. 2014;197:7-13
27. McDermott AM, Kerin MJ, Miller N. Identification and validation of miRNAs as endogenous controls for RQ-PCR in blood specimens for breast cancer studies. PloS One. 2013;8:e83718
28. Albert TJ, Molla MN, Muzny DM, Nazareth L, Wheeler D, Song X. et al. Direct selection of human genomic loci by microarray hybridization. Nat Methods. 2007;4:903-905
29. Chen N, Wang J, Hu Y, Cui B, Li W, Xu G. et al. MicroRNA-410 reduces the expression of vascular endothelial growth factor and inhibits oxygen-induced retinal neovascularization. PloS One. 2014;9:e95665
30. Yang X, Wu X. miRNA expression profile of vulvar squamous cell carcinoma and identification of the oncogenic role of miR-590-5p. Oncol Rep. 2016;35:398-408
31. Chandradoss SD, Schirle NT, Szczepaniak M, MacRae IJ, Joo C. A Dynamic Search Process Underlies MicroRNA Targeting. Cell. 2015;162:96-107
32. Hong S, Tan M, Wang S, Luo S, Chen Y, Zhang L. Efficacy and safety of angiogenesis inhibitors in advanced non-small cell lung cancer: a systematic review and meta-analysis. J Cancer Res Clin Oncol. 2015;141:909-921
33. Llovet JM. Focal gains of VEGFA: candidate predictors of sorafenib response in hepatocellular carcinoma. Cancer Cell. 2014;25:560-562
34. Okamura K, Chung WJ, Lai EC. The long and short of inverted repeat genes in animals: microRNAs, mirtrons and hairpin RNAs. Cell Cycle. 2008;7:2840-2845
35. Kai ZS, Pasquinelli AE. MicroRNA assassins: factors that regulate the disappearance of miRNAs. Nat Struct Mol Biol. 2010;17:5-10
36. Rhodes LV, Martin EC, Segar HC, Miller DF, Buechlein A, Rusch DB. et al. Dual regulation by microRNA-200b-3p and microRNA-200b-5p in the inhibition of epithelial-to-mesenchymal transition in triple-negative breast cancer. Oncotarget. 2015;6:16638-16652
37. Mitra R, Lin CC, Eischen CM, Bandyopadhyay S, Zhao Z. Concordant dysregulation of miR-5p and miR-3p arms of the same precursor microRNA may be a mechanism in inducing cell proliferation and tumorigenesis: a lung cancer study. RNA. 2015;21:1055-1065
38. Choo KB, Soon YL, Nguyen PN, Hiew MS, Huang CJ. MicroRNA-5p and -3p co-expression and cross-targeting in colon cancer cells. J Biomed Sci. 2014;21:95
39. Josson S, Gururajan M, Hu P, Shao C, Chu GY, Zhau HE. et al. miR-409-3p/-5p promotes tumorigenesis, epithelial-to-mesenchymal transition, and bone metastasis of human prostate cancer. Clinical Cancer Res. 2014;20:4636-4646
40. Cuk K, Zucknick M, Heil J, Madhavan D, Schott S, Turchinovich A. et al. Circulating microRNAs in plasma as early detection markers for breast cancer. Int J Cancer. 2012;132:1602-1612
41. Mitchell PS, Parkin RK, Kroh EM, Fritz BR, Wyman SK, Pogosova-Agadjanyan EL. et al. Circulating microRNAs as stable blood-based markers for cancer detection. Proc Natl Acad Sci USA. 2008;105:10513-10518
42. Bertoli G, Cava C, Castiglioni I. MicroRNAs: New Biomarkers for Diagnosis, Prognosis, Therapy Prediction and Therapeutic Tools for Breast Cancer. Theranostics. 2015;5:1122-43
43. Yoruker EE, Aydogan F, Gezer U, Saip P, Dalay N. Analysis of circulating microRNAs during adjuvant chemotherapy in patients with luminal A breast cancer. Mol Clin Oncol. 2015;3:954-958
Author contact
![]() Corresponding authors: Professor Shanrong Liu, Department of Laboratory and Diagnosis, Changhai Hospital, Second Military Medical University, 168 Changhai Road, Shanghai 200433, China; Tel: 86-21-31162091; Fax: 86-21-31162091; E-mail: liushanrongcom Or Professor Chuanbin Mao, Department of Chemistry and Biochemistry, Stephenson Life Sciences Research Center, University of Oklahoma, 101 Stephenson Parkway, Norman, Oklahoma 73019-5300, U.S.A.; E-mail: cbmaoedu
Corresponding authors: Professor Shanrong Liu, Department of Laboratory and Diagnosis, Changhai Hospital, Second Military Medical University, 168 Changhai Road, Shanghai 200433, China; Tel: 86-21-31162091; Fax: 86-21-31162091; E-mail: liushanrongcom Or Professor Chuanbin Mao, Department of Chemistry and Biochemistry, Stephenson Life Sciences Research Center, University of Oklahoma, 101 Stephenson Parkway, Norman, Oklahoma 73019-5300, U.S.A.; E-mail: cbmaoedu