Impact Factor
- Issue 14; 2026
- Issue 13; 2026
- Issue 12; 2026
- Issue 11; 2026
- Issue 10; 2026
- Volume 16; 2026
- Advance Articles
- Past Issues
- Cover Images
- Cover Suggestion
- Index & Coverage
- Special Issues
Introduction
Materials and Methods
Results
Discussion
Conclusion
Abbreviations
Acknowledgements
References
International Journal of Biological Sciences
International Journal of Medical Sciences
 Global reach, higher impact

Theranostics 2017; 7(6):1499-1510. doi:10.7150/thno.17263 This issue Cite
Research Paper
Noninvasive Assessment of Elimination and Retention using CT-FMT and Kinetic Whole-body Modeling
Wa'el Al Rawashdeh1*, Simin Zuo1*, Andrea Melle2, Lia Appold1, Susanne Koletnik1, Yoanna Tsvetkova1, Nataliia Beztsinna3, Andrij Pich2, Twan Lammers1, 3, Fabian Kiessling1, Felix Gremse1 ![]()
1. Institute for Experimental Molecular Imaging, RWTH Aachen University Clinic, Pauwelsstr. 30, 52074 Aachen, Germany;
2. DWI - Leibniz Institute for Interactive Materials, RWTH Aachen University, Forckenbeckstr. 50, 52074 Aachen, Germany;
3. Department of Pharmaceutics, Utrecht University, Universiteitslaan 99, Utrecht, The Netherlands.
* These authors contributed equally to this study
Received 2016-8-19; Accepted 2017-1-16; Published 2017-4-5
Abstract

Fluorescence-mediated tomography (FMT) is a quantitative three-dimensional imaging technique for preclinical research applications. The combination with micro-computed tomography (µCT) enables improved reconstruction and analysis. The aim of this study is to assess the potential of µCT-FMT and kinetic modeling to determine elimination and retention of typical model drugs and drug delivery systems.
We selected four fluorescent probes with different but well-known biodistribution and elimination routes: Indocyanine green (ICG), hydroxyapatite-binding OsteoSense (OS), biodegradable nanogels (NG) and microbubbles (MB). µCT-FMT scans were performed in twenty BALB/c nude mice (5 per group) at 0.25, 2, 4, 8, 24, 48 and 72 h after intravenous injection. Longitudinal organ curves were determined using interactive organ segmentation software and a pharmacokinetic whole-body model was implemented and applied to compute physiological parameters describing elimination and retention.
ICG demonstrated high initial hepatic uptake which decreased rapidly while intestinal accumulation appeared for around 8 hours which is in line with the known direct uptake by hepatocytes followed by hepatobiliary elimination. Complete clearance from the body was observed at 48 h. NG showed similar but slower hepatobiliary elimination because these nanoparticles require degradation before elimination can take place. OS was strongly located in the bones in addition to high signal in the bladder at 0.25 h indicating fast renal excretion. MB showed longest retention in liver and spleen and low signal in the kidneys likely caused by renal elimination or retention of fragments. Furthermore, probe retention was found in liver (MB, NG and OS), spleen (MB) and kidneys (MB and NG) at 72 h which was confirmed by ex vivo data. The kinetic model enabled robust extraction of physiological parameters from the organ curves.
In summary, µCT-FMT and kinetic modeling enable differentiation of hepatobiliary and renal elimination routes and allow for the noninvasive assessment of retention sites in relevant organs including liver, kidney, bone and spleen.
Keywords: Fluorescence-mediated tomography, kinetic modeling, micro-computed tomography, elimination routes, retention sites, OsteoSense, microbubbles, nanogels, indocyanine green.
Introduction
Accurate evaluation of organ biodistribution and elimination routes is required to identify toxicity and pharmacokinetics of novel drugs and drug delivery systems [1, 2]. Besides chemical analysis of excised organs and feces, gamma counting can be used to quantitatively assess the biodistribution of radionuclide-labeled drugs [3]. In this approach, animals are sacrificed at different time points, which may result in large numbers of required animals. Alternatively, the biodistribution can be determined using longitudinal three-dimensional imaging using nuclear imaging modalities such as positron emitting tomography (PET) or single-photon emission computed tomography (SPECT) [3]. These modalities are highly sensitive, and allow longitudinal imaging, reducing the number of animals. Furthermore, they generate data from the same animal thus, strengthening statistical analysis [4]. Nevertheless, they suffer from few limitations such as complex probe synthesis, handling of radioactive materials and animals, requirement of complex infrastructure, and high financial cost [3].
Fluorescence-mediated tomography (FMT) may provide an alternative since it allows quantitative three-dimensional assessment of near-infrared fluorescence in whole mouse bodies [5, 6]. The fluorescence may originate from injected probes or other sources such as reporter genes [7-10]. FMT requires simpler laboratory setting and has high throughput and moderate financial cost [7, 11]. In previous work, we have demonstrated that the combination of FMT with an anatomical modality, micro-computed tomography (µCT), enables user-independent analysis and improved fluorescence reconstruction [4, 6, 12].
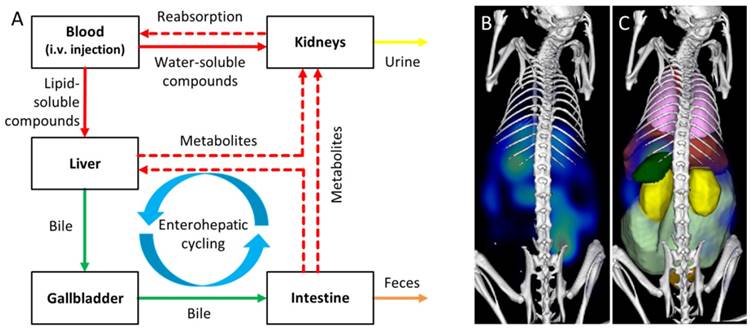
Elimination and retention of drugs are affected by numerous aspects, such as the size, shape, charge, surface modifications, solubility, and affinity to plasma proteins or specific receptors. While small (<6 nm) probes are typically renally eliminated, the clinically approved dye indocyanine green (ICG) is an interesting and counter-intuitive example of a small molecule which evades renal elimination by binding to plasma proteins and is quickly eliminated from the blood by the organic anion-transporting polypeptide expressed on hepatocytes [13, 14]. Large molecules or particles are often eliminated from the blood via liver and spleen where they are degraded and redistributed into the circulation before they undergo renal or hepatobiliary elimination (Fig. 1). Hence, elimination and retention are often difficult to predict and experimental determination is advised during preclinical drug development.
Assessment of elimination routes using µCT-FMT. A) After intravenous injection, drugs are carried through the body by the systemic circulation. Small (<6 nm) probes are mainly eliminated through the kidneys while large molecules are mostly processed by the liver where they may be degraded and transported into the intestine via the bile ducts. Metabolites (dashed arrows) can be reabsorbed into the systemic circulation and undergo renal elimination or hepatic uptake again in a phenomenon called “enterohepatic cycling”. Non-degradable compounds may remain in the liver for long periods of time. The route and speed of elimination are affected by aspects such as lipid-solubility, particle shape and affinity to plasma proteins. We investigate whether longitudinal µCT-FMT imaging (B), in combination with organ segmentation (C), enables non-invasive assessment of elimination routes and retention sites of fluorescent probes. Segmented organs are color-coded (bladder: orange, heart: red, intestine: light green, kidneys: yellow, liver: dark red, lungs: pink, spleen: green).
While longitudinal imaging provides illustrative organ curves, these may be difficult to interpret and compare between probes. It may seem obvious to apply a pharmacokinetic model to derive physiological parameters. Typical two- or three-compartment models are not suitable for the whole-body situation, however, because too many participating organs are involved [15]. While more complex models have been described, their usage to estimate parameters raises problems regarding ambiguity and numerical stability, particularly because the image quality is a limiting factor for kinetic modeling [16]. Nevertheless, a reasonably simplified whole-body model may be applicable and beneficial for analysis of longitudinal CT-FMT data.
The aim of this study is to evaluate the ability of µCT-FMT and kinetic whole-body modeling to assess and differentiate elimination routes and retention sites of intravenously injected fluorescent probes, which are important steps during development of novel drugs and drug delivery systems. Accordingly, we have selected four probes with different and well-known elimination routes for this study: indocyanine green (ICG), quickly degradable nanogels (NG), hydroxyapatite-binding OsteoSense (OS) and slowly degradable microbubbles (MB).
Materials and Methods
Probes
Two small probes were used, one with hepatobiliary and one with renal elimination, as well as two larger biodegradable particles, i.e. nanogels and microbubbles.
Indocyanine green (ICG) is a cyanine dye used in medical diagnostics, particularly in retinal angiography and intraoperative surgery [17-19]. Maxima of absorption and emission spectra are 780 nm and 830 nm, respectively. It is a small dye with a molecular weight of 774.96 g/mol and has a short blood half-life of 150-180 seconds. ICG binds avidly to serum proteins avoiding renal filtration and is actively taken up by hepatocytes in a similar process as bilirubin [13]. Hence it is eliminated quickly and almost exclusively through the hepatobiliary route, unlike the expected renal elimination of such small molecules [17, 20]. Post i.v. administration ICG is found in the liver and a few hours later it can be seen in the intestine and colon [17, 18].
The nanogels (NG) used in this study are poly(N-vinylcaprolactam) (PVCL)-based thermo-sensitive and biodegradable hydrogels and were produced as described in [21, 22]. They are cross-linked polymer particles with a hydrodynamic diameter of 117 nm ± 5 nm and are covalently labeled with Cy7 dye. Absorption and emission maxima are at 750 nm and 773 nm, respectively. NG accumulate in the liver, are degraded and eliminated via the hepatobiliary route [23].
OsteoSense 750 EX (OS) (PerkinElmer, Waltham, MA, USA) is a commercially available preclinical fluorescent probe targeting hydroxyapatite. It is used to image bones and areas of micro-calcifications and bone remodeling [24, 25]. It is a small molecule with a molecular weight of 1101.1 g/mol and is rapidly eliminated from the blood through the kidneys [2]. Absorption and emission maxima are at 749 nm and 770 nm, respectively.
Microbubbles (MB) used in this study are hard-shell bubbles filled with air [26, 27]. They are spheres with a diameter of 2-3 µm and the shell consists of poly-butyl-cyanoacrylate (PBCA), a material known for its biodegradability [28]. The fluorescent dye (HITC-Iodide, absorption max. 740 nm, emission max. 780 nm) was embedded into the MB shell [27]. PBCA-based MB have a short blood-half-life and accumulate in the lungs, liver and spleen within minutes as determined using radio-labeling [29]. While the retention in the lungs is temporary (a few minutes), MB remain in the liver and spleen for several days due to their slow degradation [28-30]. Degradation products are soluble in water and can be eliminated through kidney filtration [28].
In vivo µCT-FMT imaging
The Governmental Review Committee on Animal Care approved all animal experiments. A total number of twenty BALB c nu/nu mice (five mice per group) were included (Charles River Laboratory, Sulzfeld, Germany). Mice were anesthetized using isoflurane. Fluorescent probes were injected into the tail vain suspended in 100 µl solution and containing 2 nmol dye. During µCT (Tomoscope Duo, CT Imaging GmbH, Erlangen, Germany) and FMT (FMT 2500, PerkinElmer, Waltham, MA, USA) scanning, the anesthetized mice were held in a dual-modality animal cassette [6,31]. The FMT channel with 745 nm excitation laser and 770-800 nm emission filter was used for all probes, even though the 800 nm channel would achieve higher sensitivity for ICG. This was done to maintain a fixed imaging protocol, since FMT channels differ considerably in terms of scattering, absorption, quantum efficiency and background signal [4], and because ICG has broad absorption and fluorescence spectra. Whole-body FMT scans were performed with default sensitivity settings using approximately 80 equidistant excitation points, covering the body from the neck to the tailbone, with 3 mm distance in between the points [4]. After the first FMT scan, the imaging cassette, tightly holding the mouse, was flipped upside down and a second “down” scan was acquired providing additional data for fluorescence reconstruction [4]. The mice were repeatedly anaesthetized, positioned in the mouse bed, and scanned at 0.25, 2, 4, 8, 24, 48 and 72 h post injection. The duration of the scanning protocol per time point was approximately 13 minutes; 3 minutes in the µCT and 10 minutes in the FMT. After the last measurement at 72 h, mice were sacrificed to excise their organs and fluorescence reflectance images were taken by the FMT in the 2D imaging mode.
Image reconstruction
Quantitative three-dimensional FMT data and volumetric µCT data were fused using automated detection of markers and fluorescence reconstructions were performed using an accurate shape derived from the µCT data [31], heterogeneous absorption and scattering maps [4], and GPU-accelerated numerical operations [32,33].
Image analysis
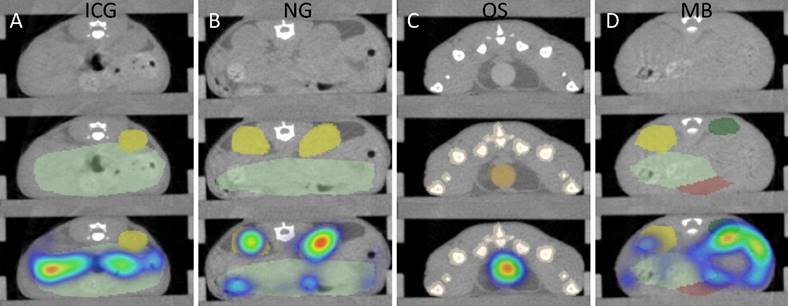
To assign the fluorescence to organs, 3D segmentations were performed based on the µCT data (Fig. 2). While lungs and bones could be segmented using region growing, other organs were segmented by iteratively drawing scribbles to delineate the organ boundaries [31,34]. Spleen segmentation appeared to be highly challenging due to the low soft tissue contrast of the native µCT data. Hence, only approximately a third of the spleen could be segmented (Fig. 2).
CT-based segmentation. Top row: CT slice. Middle row: CT and segmentation. Bottom row: CT, segmentation and FMT data. A) For ICG, fluorescence appears in the intestine (mild green) after 2 h due to hepatobiliary elimination. B) For NG, some retention of fragments appears in the kidneys (yellow) at 48 h. C) For OS, strong signal appears in the urinary bladder (orange) at 15 minutes post injection. Some spillover occurs around the bladder. D) MB show accumulation in the spleen (green) 24 h after injection. Only a part of the spleen could be segmented due to the low soft-tissue contrast, resulting in an underestimation of the amount in the spleen.
To facilitate direct comparison of the probes, the percentage of injected dose per organ was calculated. To obtain a calibration factor for each probe, the entire amount of probe within a mouse was determined at the first time point after injection (at 0.25 h) using the automated segmentation of the mouse body [31]. Then, the average of the five mice per group was calculated and the inverse was used as scale factor for the reconstructed three-dimensional fluorescence distribution, which sets the %ID for the first time point to 100 %ID. Mice which had urinated during the first scan, which can be observed on the mouse bed or in the reconstructed images [31], should be excluded from the calculation of the scale factor, however this did not occur during this study. To reduce the influence of autofluorescence, organ-specific background values were subtracted which were determined using µCT-FMT scans without fluorescent contrast agents.
Multi-channel phantom experiments
To assess the potential of multi-channel imaging, we performed phantom experiments in three available FMT channels (excitation wavelength: 670 nm, 745 nm, and 790 nm). A diffuse phantom containing a cylindrical inclusion (100 µl), available from the FMT manufacturer, was used as previously described [4,31]. The phantom was filled with diluted reference dyes in known concentrations (VM670XL at 0.40 µM, VM750 at 0.41 µM, VM790 at 0.78 µM). These dilutions are available from the FMT manufacturer as calibration kit for the FMT. Phantoms with reference dyes were scanned in all three channels to assess the degree of cross-talk between channels.
Kinetic modeling
A pharmacokinetic whole-body model was developed to describe the exchange between compartments representing blood and other tissue regions involved in elimination and retention (Fig. 3). The model contains the two main elimination routes through the liver and the kidneys. Furthermore it contains compartments for retention in bones, lung, and spleen. A second compartment was added for liver and kidney to also model retention. For the liver, a physiological interpretation is that one compartment resembles cells participating in elimination such as hepatocytes while the second compartment represents cells such as Kupffer-cells and resident macrophages which cause long term retention of many particles.
Simplified kinetic whole-body model. The model describes the exchange between compartments representing blood and other tissue types. The model captures elimination through liver and kidneys as well as retention in liver, kidneys, bone, lungs, and spleen. Dotted arrows represent fixed parameters which do not depend on the probe in our model. The 8 unknown parameters (full arrows) are determined using gradient-based minimization of the difference between predicted and measured organ curves.
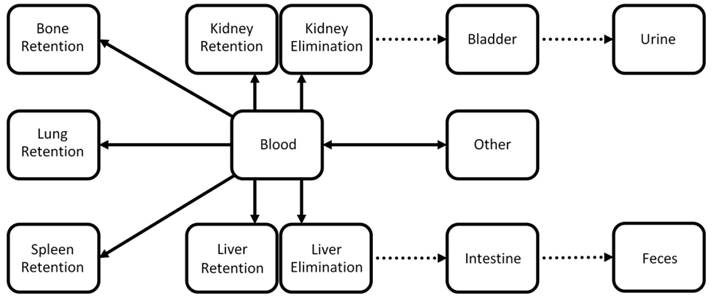
The exchange between compartments was described using mass-balancing differential equations, i.e. the total amount remains 100 %ID throughout the time course. The parameters describe the exchange rate between connected compartments (arrows in Fig. 3). It was assumed that the exchange rate between two connected compartments is proportional to the parameter value and the current amount in the source compartment. Hence, the total rate for one compartment is the sum of all incoming rates minus the sum of all outgoing rates. For example, the rate for the “Liver Elimination” compartment is defined as follows:

Parameters representing transport of bile and urine were set as constants because they are unlikely to depend on the probe. Hence, 8 free parameters remained (full arrows in Fig. 3). These parameters were estimated using model-based iterative reconstruction using the organ curves which were determined by the FMT reconstructions and the organ segmentations. The squared difference between modeled and measured organ curves was minimized, making use of the nonlinear conjugate gradient method in combination with algorithmic differentiation to compute the gradient of the cost term [33]. Due to problems with optically dark regions, such as the heart, and the limited resolution, the blood compartment was not considered as a known compartment, i.e. an “arterial input function” was not available. The initial state was set to contain 100 %ID in the blood resembling an i.v. injection.
The kinetic model applied the fourth-order Runge-Kutta method on the differential equations to compute hypothetical organ curves based on the current parameter set. To increase the accuracy of the Runge-Kutta method, 256 equidistant virtual time points were inserted between the original coarse time points. Since compartments are not measurable directly as consequence of the intensity diffusion, a linear mixing was applied describing the blood contribution and organ-specific constants were derived from previous estimates of the relative blood volume and typical organ volumes [4]. The mixing also adds the contribution of the two compartments for liver (and for kidneys) because the image-derived organ values resemble the sum of both compartments.
To assess the stability of the parameter estimation, simulations were performed, i.e. random parameters were generated and organ curves computed. Then the parameters were estimated using multiple random initializations. Furthermore, relative noise (uniform distribution with mean of 10%) was added to the virtual organ curves and the relative errors of the estimated parameters were computed. Finally, the kinetic model was applied for each mouse to reconstruct the 8 parameters for two FMT reconstruction types, i.e. the original FMT reconstruction as well as the improved reconstruction described in [4, 31]. This enabled comparison between FMT reconstructions, between parameters, and between probes.
Statistics
To compare the accumulation between organs for each probe, one-way ANOVA with repeated measures was used. To test for differences between probes for fixed organs, one-way ANOVA without repeated measures was performed. The Tukey post-test was used to determine pair-wise significances and to correct for multiple comparisons. The analysis was performed using Graphpad Prism 6 (GraphPad Software, San Diego, California, USA). We have created a pair-wise significance matrix (PSM) to facilitate representation of the significance tests. Each box in the PSM represents the comparison of two groups, e.g. liver vs. intestine. Significant differences between pairs of groups are shown in green and insignificant differences in red. For probe accumulation in organs the first row of the PSM represents the first organ (bladder) in comparison to the other organs individually, the second row represents the second organ (heart) and so on (Fig. 4). The organs are listed in alphabetical order: bladder, bone, heart, intestine, kidneys, liver, lung and spleen.
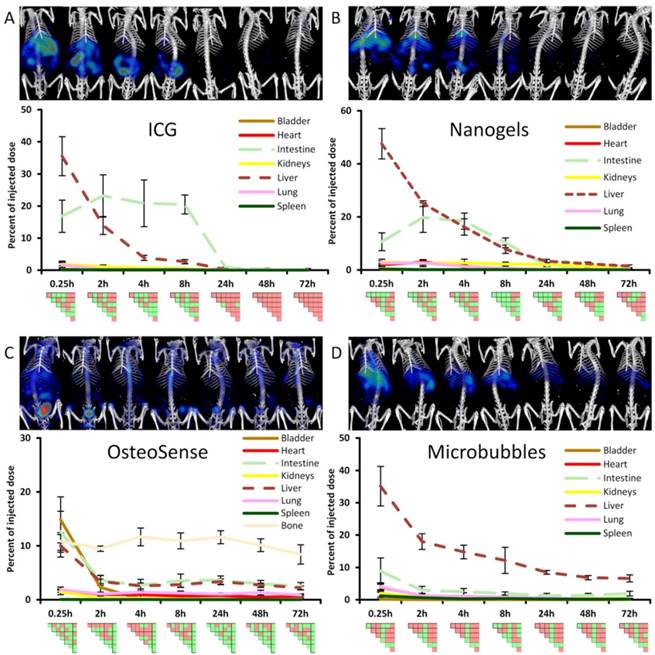
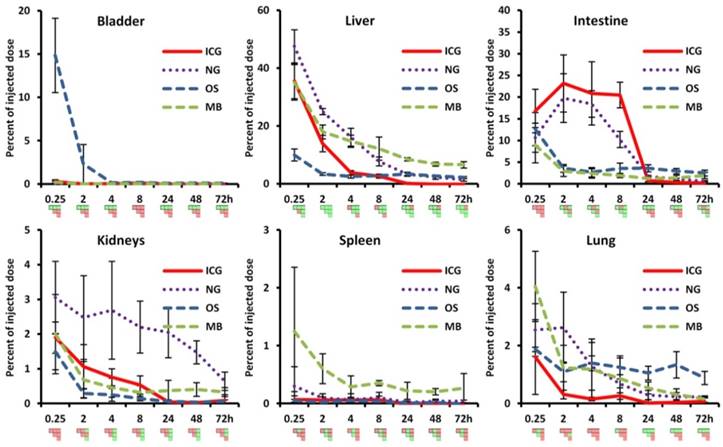
Longitudinal biodistribution determined by µCT-FMT. For each probe, whole-body µCT-FMT scans were acquired at seven time points (0.25, 2, 4, 8, 24, 48 and 72 h) after i.v. injection. Organ segmentation was used to generate organ curves. Pair-wise significances between organs are shown as matrix below the organ curves (green: p≤0.05, red: p>0.05). ICG and NG show high hepatic accumulation at 0.25 h which decreases over time with concurrent increase in the intestine, indicating hepatobiliary elimination (A, B). ICG is completely cleared after 48 h. Significant differences occur mostly for liver and intestine which appear as green L-shaped patterns, e.g. at 8 h for ICG. OS shows high accumulation in the bladder at 0.25 h, indicating renal elimination (C). Accumulation in bone remained constant throughout the study duration and starting at the 2 h time point it was significantly higher than accumulation in all other organs (rightmost column in the PSM). MB show strong hepatic accumulation at 0.25 h that decreases slowly over time (D). Significances occur mostly for the liver which is apparent by the green L-shaped pattern in the PSM.
Results
Indocyanine green
ICG showed high initial hepatic uptake that decreased rapidly within two hours (by 21.6 %ID), accompanied by an increase in intestinal accumulation (by 6.4 %ID) (Fig. 4) indicating hepatobiliary elimination. This is expected since ICG is rapidly taken up by hepatocytes and transported into the bile ducts. Interestingly, the hepatobiliary elimination route is nicely depicted in the PSM by two green L-shaped patterns, one for the liver and one for the intestine, e.g. at 8 h in Fig. 4. Only very low signal (below 0.5 %ID) was found in the urinary bladder (Fig. 5), which is reasonable because ICG evades renal elimination by binding to plasma proteins such as albumin and is almost exclusively eliminated through the bile. ICG showed almost complete elimination after 24 h, and after 48 h no significant differences between organs were found anymore. The complete clearance observed in the in vivo data was in line with the ex vivo organ measurements at 72 h (Fig. 6).
Comparison of organ curves. Each graph shows the accumulation curves of the four probes for one selected organ. Bladder: High signal in the urinary bladder, indicating renal elimination, appears only for OS. Liver: Initial hepatic accumulation is found to be high for ICG, NG and MB. ICG shows fastest reduction and it is the only probe with complete clearance while NG, MB and OS show retention in the liver at 72 h. Intestine: Intestinal accumulation of ICG and NG increases at 2 h, indicating hepatobiliary elimination. OS and MB show intestinal retention at 72 h (false positive). Kidneys: Signal in kidneys is relatively low for all probes, with retention for NG and MB at 72 h. Spleen: Only MB show accumulation and retention in the spleen throughout the study. Lungs: MB show highest accumulation in the lungs at 0.25 h and retention is found for NG and OS (false positive) at 72 h. Pair-wise significances between probes are shown as matrix below the x-axis (green: p≤0.05, red: p>0.05).
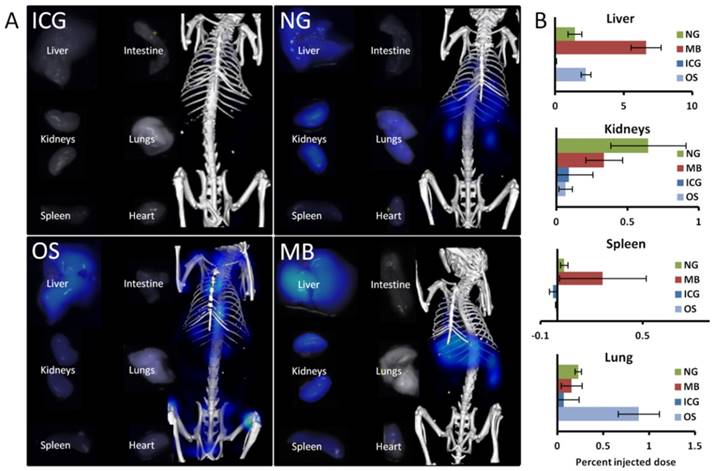
Comparison of ex vivo organ biodistribution with in vivo results. A) Shown are organs excised at 72 h and imaged using the reflection mode of the FMT as well as representative µCT-FMT images (at 72 h). Only ICG is completely cleared. NG show retention in liver, kidneys and lungs. OS has retention in liver and bones (not shown). MB show retention in liver, kidneys and spleen. B) The accumulation was quantified based on the µCT-FMT data for selected organs at 72 h. Retention is correctly found in the liver (NG, OS and MB), in the kidneys (NG and MB) and the spleen (MB), however in the lung false positive retention is found for OS due to spill-over from strong signal in the bones. Small negative values may occur due to the subtraction of background values.
Nanogels
NG showed the highest liver uptake at 0.25 h (48 %ID) which rapidly declined in combination with an increase in intestinal signal, indicating hepatobiliary elimination. The decline in the liver was slower than for ICG, with measurable remaining signal at 72 h. This can be explained since NG are gradually degraded before transported by the hepatocytes into the bile ducts. Some retention was found in the kidneys at late time points (0.65 %ID at 72 h), most likely because degraded fragments were trapped. Only low amounts (below 0.3 %ID) were found in the urinary bladder, however, indicating that renal elimination is negligible compared to the hepatobiliary elimination. In addition to the retention in liver and kidneys, some signal (0.2 %ID) was found in the lungs at 72 h, most likely due to the uptake by lung macrophages, and these retention sites were in agreement with the ex vivo data (Fig. 6).
OsteoSense
OS showed a high bladder signal at 0.25 h (15 %ID), that rapidly decreased within two hours, demonstrating fast renal elimination (Figs. 4, 5). A strong and long-lasting accumulation in bones was found, since OS binds to hydroxyapatite. Interestingly, hepatic retention (2.2 %ID) was observed at 72 h which also appeared in the ex vivo data (Fig. 6). The in vivo data showed false positive retention sites in lungs and intestine due to the strong signal in the bones which spilled over into adjacent organs as a consequence of the low resolution of the FMT.
Microbubbles
MB had the highest early uptake in the lungs (4.1 %ID) among the four probes (Fig. 5), which rapidly decreased at later time points. This is in agreement with previous findings using gamma-counting on excised organs [29]. Furthermore, low bladder signal was found (0.19 %ID at 0.25 h), indicating negligible renal elimination. MB had high hepatic accumulation (35 %ID at 0.25 h), since intact MB as well as fragments are taken up by the mononuclear phagocyte system, particularly by macrophages [29]. The hepatic accumulation is nicely depicted in the PSM by a green L-shape which indicates significant differences to other organs (Fig. 4). At 72 h MB had the highest retention in the liver (6.6 %ID) and spleen (0.27 %ID) among the four investigated probes, which is reasonable due to the anticipated slow degradation and the large size [28]. Similar to the previously described accumulation of nanogels in the kidneys at late time points, a low amount of MB (0.33 %ID) was found in the kidneys 72 h post injection. According to the µCT-FMT measurements, an amount of 1.9 %ID is in the intestine at 72 h, which is a false positive measurement since it could not be found in the ex vivo scans. However, the ex vivo scans confirmed the retention of MB, or fragments, in liver, spleen and kidneys at 72 h (Fig. 6).
Multi-channel experiments
Phantom experiments showed that the 670 nm channel had no measureable cross-talk into the other two channels. The 745 nm channel showed low cross-talk (3.5 %) into the 670 nm channel and high cross-talk (54.0 %) into the 790 nm channel. The 790 nm channel had low cross-talk (1.4 % and 3.6 %) into the 670 nm and 745 nm channels, respectively.
Kinetic Modeling
Simulations showed that the parameter estimation worked robustly and all random initializations resulted in the same solution, suggesting that the estimation problem for our model is well-posed with only a single minimum. When adding 10% relative noise to the organ curves, this resulted in kinetic parameters with reduced relative noise of 7.5 ± 2.8 %. Such an error reduction is reasonable because all 56 measurements (7 time points and 8 organs) were compressed into only 8 physiological parameters.
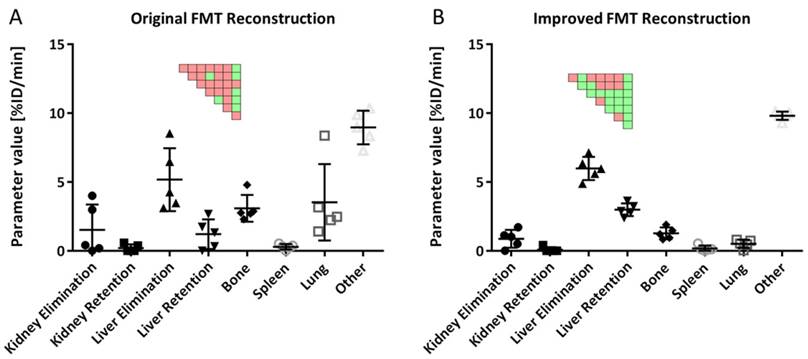
Usage of the improved FMT reconstruction resulted in kinetic parameters with reduced variability, compared to the original FMT reconstruction, e.g. the standard deviation was reduced by a factor of 3.2 ± 2.3 for the MB data (Fig. 7). Hence, only the improved FMT reconstruction was used for the rest of the analysis.
Kinetic parameters using original and improved FMT reconstructions. A) Usage of the original FMT reconstruction results in high variances for estimated parameters. B) The improved FMT reconstruction results in lower variances and more significant differences between parameters. Results are shown for 5 mice (MB group). Significant differences between parameters are shown as pairwise significance matrices (green: p≤0.05, red: p>0.05, Tukey post-test).
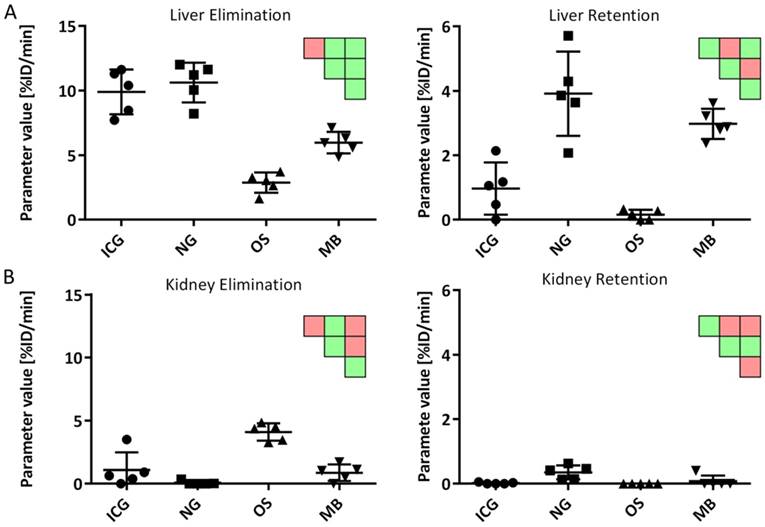
The estimated parameters resemble the expected behavior for the four probes: ICG and NG had the highest liver elimination while NG and MB had highest liver retention (Fig. 8). Kidney elimination was highest for OS while kidney retention was highest for NG and MB (Fig. 8). Furthermore, the bone retention was highest for OS, but the model could not detect significant differences for spleen and lung retention.
Comparison of kinetic parameters between probes. A) Liver elimination was highest for ICG and NG while liver retention was highest for NG and MB. B) Kidney elimination was highest for OS while NG showed highest retention. Significant differences are shown as pairwise significance matrices (green: p≤0.05, red: p>0.05, Tukey post-test).
Discussion
Elimination and retention of drugs and drug delivery systems are complex processes which depend on many aspects including molecular weight, size, shape, charge, solubility and affinity to plasma proteins, and are even more difficult to predict for degradable or fragmenting compounds. Hence, experimental assessment of elimination and retention is required during preclinical drug development. To assess the value of optical imaging in this regard, we acquired longitudinal µCT-FMT scans of four representative fluorescent probes and analyzed the data using organ segmentation. The resulting organ curves resembled the behavior that was expected from literature and enabled identification of hepatobiliary and renal elimination as well as retention sites.
To validate the retention sites, organs were excised and imaged with the reflectance imaging functionality of the FMT device after the last in vivo measurement at 72 h. We did not attempt to quantify the fluorescence in the organs based on the 2D images because these measurements are surface-weighted and affected by the size and shape of the organs and because organs vary in terms of optical absorption and scattering which affects the planar fluorescence images. Nevertheless, this enabled a qualitative comparison with the last in vivo measurement, showing good agreement with respect to retention in the liver (for MB, NG and OS), the kidneys (for MB and NG), the lungs (NG), and the spleen (MB).
The ability of the method to detect even very small values, e.g. 0.27 %ID of MB in the spleen and 0.65 %ID of NG in the kidneys shows that µCT-FMT allows highly sensitive detection of retention in relevant organs.
The in vivo data suggested some false positive retention sites, however, e.g. in the intestine for MB and OS and in the lungs for OS. These are caused by the limited FMT resolution which results in spill-over into adjacent organs, e.g. from bones to lungs for OS and from liver to intestine for MB. Hence, attention is required during interpretation of the µCT-FMT data. If the signal can originate from spill-over from adjacent organs with high accumulation, the retention site should be double-checked by ex vivo organ analysis. Furthermore, some organs such as the spleen are difficult to segment due to low soft tissue contrast, which may result in quantification errors due to over- or under-segmentation. This can be improved for liver and spleen using µCT contrast agents with long-term accumulation which avoids repeated injections during longitudinal studies [35].
Nevertheless, we believe that µCT-FMT holds strong potential to assess the elimination route, to ascertain complete clearance or to find possible retention sites non-invasively. Furthermore, we believe that the limitations can be overcome by improving the resolution, particularly by acquiring more raw data, i.e. using more laser injection points. This would come at the expense of measurement duration, but a faster FMT device could be built with multiple and more sensitive cameras, or by performing advantageous illumination patterns such as lines [36]. Faster scanning would also enable better assessment of rapid processes such as the renal elimination of OS or accumulation of MB in the lung. Furthermore, the reconstruction quality can be improved by incorporating prior knowledge into the fluorescence reconstruction, in the form of temporal or spatial constraints [37, 38]. We decided to use a general-purpose reconstruction however, to avoid complicating the interpretation and to increase reproducibility and comparability to previous studies [4, 31, 39-41]. We also observed problems with reconstructing fluorescence in the heart due to the high optical absorption caused by the high relative blood volume [4]. This could be resolved using more sensitive detectors or by performing high-dynamic range imaging.
Multi-channel imaging is another interesting feature of FMT, which may be limited by cross-talk between channels, however. Hence, we investigated this issue using phantom scans in three available FMT channels. While cross-talk between 745 nm and 790 nm channels was prohibitively high, sufficiently low cross-talk was found between the 670 nm and the higher channels. Unfortunately, the 670 nm channel shows considerably higher absorption and autofluorescence than the other channels, complicating fluorescence reconstruction and analysis in deeply-seated and optically dark organs such as heart and liver [4]. Hence, the usage of multi-channel imaging for biodistribution assessment may require further investigation regarding the optimal combination of excitation wavelengths, optical filters, and fluorochromes.
Furthermore, we believe that replacing µCT with magnetic resonance imaging (MRI) would provide better soft tissue contrast, enabling more detailed organ segmentation besides avoiding the radiation dose, which may become an issue in longitudinal animal studies. Moreover, we currently use an interactive segmentation method to define the organ segmentation based on the µCT data. In this study we have used twenty mice and performed more than 1000 organ segmentations, which required several weeks of work. This effort could be cut down using automated organ segmentation algorithms [42, 43], which would also reduce the user-dependent variability.
The segmentation-based analysis resulted in illustrative organ curves which are difficult to interpret and compare. Consequently, we developed a pharmacokinetic whole-body model to derive fewer but more robust and physiological parameters. Simulations showed an error reduction, i.e. the kinetic parameters had less relative noise than the organ values. Application of the model to the in vivo measurements resulted in parameters resembling the expected elimination and retention of the four probes. Our kinetic whole-body model is a simplification of the complex processes in the body, e.g. it does not capture enterohepatic circulation, lymphatic flow, and behavior of metabolites. Furthermore, it treats blood as a well-mixed compartment which is reasonable at late time points but inaccurate shortly after injection [44]. A compromise between complexity and realism is necessary to enable robust parameter estimation and more complicated models may be applicable once faster and more accurate FMT devices are available. Particularly the assessment of fast processes such as kidney filtration and uptake by hepatocytes is limited by the speed of the device. Hence, our kinetic model indirectly assesses renal and hepatic elimination through other involved organs such as the urinary bladder and intestine, respectively. Nevertheless, this aspect should be considered during planning of imaging studies, particularly with respect to selection of the imaging time points, and during interpretation of the estimated kinetic parameters.
Conclusion
µCT-FMT enables non-invasive assessment of the longitudinal biodistribution of fluorescently labeled probes which is corrected for depth and optical tissue properties, overcoming the limitations of fluorescence reflectance imaging. CT-FMT can differentiate between renal and hepatobiliary elimination and detect retention sites such as liver, kidney, spleen, bone and lungs. Kinetic whole-body modeling enables advanced image analysis by deriving fewer but more robust and physiological parameters.
Abbreviations
FDA: US food and drug administration, FMT: fluorescence-mediated tomography, µCT: micro-computed tomography, PET: positron emission tomography, SPECT: Single-photon emission computed tomography, MRI: magnetic resonance imaging, i.v.: intravenous, ICG: indocyanine green, OS: OsteoSense 750 EX, MB: microbubbles, NG: nanogels, Cy7: cyanine 7 dye, HITC: 1,1′,3,3,3′,3′-hexamethylindotricarbocyanine iodide, MW: molecular weight, PSM: Pair-wise significance matrix, HD: hydrodynamic diameter, kV: kilovolt, mA: milliampere, FRI: fluorescence reflectance imaging.
Acknowledgements
This research was supported by the German Higher Education Ministry (BMBF) (Biophotonics/ 13N13355), the European Union (FP7), the German federal state North Rhine-Westphalia (NRW) (ForSaTum), and the Excellence Initiative of the German federal and state governments in the framework of the I³TM Seed Fund Program.
Competing Interests
The authors have declared that no competing interest exists.
References
1. Choi CHJ, Zuckerman JE, Webster P. et al. Targeting kidney mesangium by nanoparticles of defined size. Proc Natl Acad Sci U S A. 2011;108(16):6656-61
2. Longmire M, Choyke PL, Kobayashi H. Clearance properties of nano-sized particles and molecules as imaging agents: considerations and caveats. Nanomedicine Lond. 2008;3(5):703-17
3. Vasquez KO, Casavant C, Peterson JD. Quantitative Whole Body Biodistribution of Fluorescent-Labeled Agents by Non-Invasive Tomographic Imaging. PLoS ONE. 2011:6 (6)
4. Gremse F, Theek B, Kunjachan S. et al. Absorption Reconstruction Improves Biodistribution Assessment of Fluorescent Nanoprobes Using Hybrid Fluorescence-mediated Tomography. Theranostics. 2014;4(10):960-71
5. Ale A, Ermolayev V, Herzog E. et al. FMT-XCT: in vivo animal studies with hybrid fluorescence molecular tomography-X-ray computed tomography. Nat Methods. 2012;9(6):615-20
6. Kunjachan S, Gremse F, Theek B. et al. Noninvasive optical imaging of nanomedicine biodistribution. ACS Nano. 2013;7(1):252-62
7. Weissleder R, Pittet MJ. Imaging in the era of molecular oncology. Nature. 2008;452(7187):580-9
8. Ntziachristos V. Fluorescence molecular imaging. Annu Rev Biomed Eng. 2006;8:1-33
9. Al Rawashdeh W, Arns S, Gremse F. et al. Optical tomography of MMP activity allows a sensitive noninvasive characterization of the invasiveness and angiogenesis of SCC xenografts. Neoplasia N Y N. 2014;16(3):235-246 246.e1
10. Doleschel D, Rix A, Arns S. et al. Erythropoietin improves the accumulation and therapeutic effects of carboplatin by enhancing tumor vascularization and perfusion. Theranostics. 2015;5(8):905-18
11. Nahrendorf M, Waterman P, Thurber G. et al. Hybrid in vivo FMT-CT imaging of protease activity in atherosclerosis with customized nanosensors. Arterioscler Thromb Vasc Biol. 2009;29(10):1444-51
12. Rosenhain S, Al Rawashdeh W 'el, Kiessling F. et al. Sensitivity and accuracy of hybrid fluorescence-mediated tomography in deep tissue regions. J Biophotonics. 2016
13. Ito K, Suzuki H, Horie T. et al. Apical/basolateral surface expression of drug transporters and its role in vectorial drug transport. Pharm Res. 2005;22(10):1559-77
14. Ho C-M, Dhawan A, Hughes RD. et al. Use of indocyanine green for functional assessment of human hepatocytes for transplantation. Asian J Surg. 2012;35(1):9-15
15. Hoff J van den. Kinetic Modelling. In: (ed.) Kiessling F, Pichler B. Small Anim Imaging. Springer Berlin Heidelberg. 2011:387-403
16. Kuepfer L, Lippert J, Eissing T. Multiscale Mechanistic Modeling in Pharmaceutical Research and Development. In: (ed.) Goryanin II, Goryachev AB. Adv Syst Biol. Springer New York. 2012:543-61
17. Alander JT, Kaartinen I, Laakso A. et al. A review of indocyanine green fluorescent imaging in surgery. Int J Biomed Imaging. 2012;2012:940585
18. Stanescu-Segall D, Jackson TL. Vital staining with indocyanine green: a review of the clinical and experimental studies relating to safety. Eye Lond. 2009;23(3):504-18
19. Marshall MV, Rasmussen JC, Tan I-C. et al. Near-Infrared Fluorescence Imaging in Humans with Indocyanine Green: A Review and Update. Open Surg Oncol J. 2010;2(2):12-25
20. Skretting A. “Intensity diffusion” is a better description than “partial volume effect”. Eur J Nucl Med Mol Imaging. 2009;36(3):536-7
21. Pich A, Lu Y, Boyko V. et al. Thermo-sensitive poly(N-vinylcaprolactam-co-acetoacetoxyethyl methacrylate) microgels: 2. Incorporation of polypyrrole. Polymer. 2003;44(25):7651-9
22. Pich A, Zhang F, Shen L. et al. Biocompatible hybrid nanogels. Small. 2008;4(12):2171-5
23. Look M, Stern E, Wang QA. et al. Nanogel-based delivery of mycophenolic acid ameliorates systemic lupus erythematosus in mice. J Clin Invest. 2013
24. Zaheer A, Lenkinski RE, Mahmood A. et al. In vivo near-infrared fluorescence imaging of osteoblastic activity. Nat Biotechnol. 2001;19(12):1148-54
25. Figueiredo JL, Passerotti CC, Sponholtz T. et al. A novel method of imaging calcium urolithiasis using fluorescence. J Urol. 2008;179(4):1610-4
26. Fokong S, Siepmann M, Liu Z. et al. Advanced characterization and refinement of poly N-butyl cyanoacrylate microbubbles for ultrasound imaging. Ultrasound Med Biol. 2011;37(10):1622-34
27. Fokong S, Theek B, Wu Z. et al. Image-guided, targeted and triggered drug delivery to tumors using polymer-based microbubbles. J Control Release. 2012;163(1):75-81
28. Vauthier C, Dubernet C, Fattal E. et al. Poly(alkylcyanoacrylates) as biodegradable materials for biomedical applications. Adv Drug Deliv Rev. 2003;55(4):519-48
29. Palmowski M, Morgenstern B, Hauff P. et al. Pharmacodynamics of streptavidin-coated cyanoacrylate microbubbles designed for molecular ultrasound imaging. Invest Radiol. 2008;43(3):162-9
30. Ergen C, Heymann F, Al Rawashdeh W 'el. et al. Targeting distinct myeloid cell populations in vivo using polymers, liposomes and microbubbles. Biomaterials. 2017;114:106-20
31. Gremse F, Doleschel D, Zafarnia S. et al. Hybrid µCT-FMT imaging and image analysis. J Vis Exp. 2015 (100)
32. Gremse F, Höfter A, Schwen L. et al. GPU-Accelerated Sparse Matrix-Matrix Multiplication by Iterative Row Merging. SIAM J Sci Comput. 2015;37(1):C54-71
33. Gremse F, Höfter A, Razik L. et al. GPU-accelerated adjoint algorithmic differentiation. Comput Phys Commun. 2016;200:300-11
34. Gremse F, Stärk M, Ehling J. et al. Imalytics Preclinical: Interactive Analysis of Biomedical Volume Data. Theranostics. 2016;6(3):328-41
35. Mannheim JG, Schlichthaerle T, Kuebler L. et al. Comparison of small animal CT contrast agents. Contrast Media Mol Imaging. 2016;11(4):272-84
36. Dutta J, Ahn S, Joshi AA. et al. Illumination pattern optimization for fluorescence tomography: theory and simulation studies. Phys Med Biol. 2010;55(10):2961-82
37. He W, Zhang G, Pu H. et al. Modified forward model for eliminating the time-varying impact in fluorescence molecular tomography. J Biomed Opt. 2014;19(5):056012
38. Zhang G, Cao X, Zhang B. et al. MAP estimation with structural priors for fluorescence molecular tomography. Phys Med Biol. 2013;58(2):351-72
39. Kunjachan S, Pola R, Gremse F. et al. Passive versus active tumor targeting using RGD- and NGR-modified polymeric nanomedicines. Nano Lett. 2014;14(2):972-81
40. Theek B, Gremse F, Kunjachan S. et al. Characterizing EPR-mediated passive drug targeting using contrast-enhanced functional ultrasound imaging. J Control Release. 2014;182:83-9
41. Shi Y, Kunjachan S, Wu Z. et al. Fluorophore labeling of core-crosslinked polymeric micelles for multimodal in vivo and ex vivo optical imaging. Nanomed. 2015;10(7):1111-25
42. Baiker M, Milles J, Dijkstra J. et al. Atlas-based whole-body segmentation of mice from low-contrast Micro-CT data. Med Image Anal. 2010;14(6):723-37
43. Wang H, Stout DB, Chatziioannou AF. A deformable atlas of the laboratory mouse. Mol Imaging Biol. 2015;17(1):18-28
44. Schwen LO, Krauss M, Niederalt C. et al. Spatio-temporal simulation of first pass drug perfusion in the liver. PLoS Comput Biol. 2014;10(3):e1003499
Author contact
![]() Corresponding author: Felix Gremse, fgremsede
Corresponding author: Felix Gremse, fgremsede