Impact Factor
 Global reach, higher impact
Theranostics 2017; 7(11):2837-2848. doi:10.7150/thno.18968 This issue Cite
Research Paper
Non-Invasive Monitoring of CNS MHC-I Molecules in Ischemic Stroke Mice
Jing Xia1, Ying Zhang1, Huanhuan Zhao1, Jie Wang1, Xueren Gao2, Jinpeng Chen1, Bo Fu1, Yuqing Shen1, Fengqin Miao1, Jianqiong Zhang1, 2 ![]() , Gaojun Teng2
, Gaojun Teng2
1. Key Laboratory of Developmental Genes and Human Disease, Ministry of Education; Medical School, Southeast University, Nanjing, China
2. Jiangsu Key Laboratory of Molecular and Functional Imaging, Department of Radiology, Zhongda Hospital, Medical School, Southeast University, Nanjing, China
Received 2016-12-29; Accepted 2017-5-1; Published 2017-7-8
Abstract

Ischemic stroke is one of the leading causes of morbidity and mortality worldwide. The expression of major histocompatibility complex class I (MHC-I) molecules in the central nervous system, which are silenced under normal physiological conditions, have been reported to be induced by injury stimulation. The purpose of this study was to determine whether MHC-I molecules could serve as molecular targets for the acute phase of ischemic stroke and to assess whether a high-affinity peptide specific for MHC-I molecules could be applied in the near-infrared imaging of cerebral ischemic mice. Quantitative real-time PCR and Western blotting were used to detect the expression of MHC-I molecules in two mouse models of cerebral ischemic stroke and an in vitro model of ischemia. The NetMHC 4.0 server was used to screen a high-affinity peptide specific for mouse MHC-I molecules. The Rosetta program was used to identify the specificity and affinity of the screened peptide (histocompatibility-2 binding peptide, H2BP). The results demonstrated that MHC-I molecules could serve as molecular targets for the acute phase of ischemic stroke. Cy5.5-H2BP molecular probes could be applied in the near-infrared imaging of cerebral ischemic mice. Research on the expression of MHC-I molecules in the acute phase after ischemia and MHC-I-targeted imaging may not only be helpful for understanding the mechanism of ischemic and hypoxic brain injury and repair but also has potential application value in the imaging of ischemic stroke.
Keywords: Ischemic stroke, MHC-I molecules, H2BP peptide, molecular imaging.
Introduction
The major histocompatibility complex (MHC) is a group of tightly linked genes on vertebrate-specific chromosomes whose coding products are known as the major histocompatibility antigens, which are closely related to cell recognition and the immune response. The mouse MHC, called histocompatibility-2 (H-2), is located on the 17th chromosome. The MHC-I genes of the C57BL/6 mouse strain include the classic H2-K and H2-D. The MHC-I molecules are expressed in almost all nucleated cells, consisting of a heavy chain (α chain) with a high number of polymorphisms, a light chain with no polymorphisms (β2 microglobulin), and a short peptide that binds to the antigen-binding groove formed by the heavy chain α1 and α2 domains [1].
The central nervous system (CNS) of adult vertebrates was previously considered an immune-privileged site that could not express MHC-I molecules. However, recent studies have shown that CNS infection and injury stimulation can induce the expression of MHC-I molecules [2-4]. In addition, the findings of Cebrian et al. showed that MHC-I molecules are up-regulated at the cell surface and bound exogenous high-affinity peptides in response to neuronal stimulation (e.g., the action of interferon (IFN)-γ) [1]. The interaction between MHC-I molecules and peptides can be adequately simulated and predicted using bioinformatics software [5-6].
With the development of bioinformatics and immunological studies on the mechanism of MHC-epitope interactions, some bioinformatics tools, including NetMHC 4.0 Server, EPIPOX and TepiTool, had been designed to screen epitopes [7-10]. Among them, NetMHC 4.0 provides an immunogenicity calculation program that can be used to predict the interaction between epitope peptides and MHC-I and MHC-II molecules. In addition, some software provides simulation services for several protein interactions (docking). This software can model three-dimensional structures of the known ligand and receptor molecules, predicting the conformation of the ligand-receptor complex by placing the ligand at the possible binding sites of the receptor molecule. Molecular docking can predict the conformation of ligand-receptor complexes, but the scoring function is the key to identify the merits of these candidate conformation sets (decoy). Among convenient scoring platforms, Rosetta's forecasting service is currently one of the most recognized evaluations [11-12].
Near-infrared (NIR) fluorescent dyes have a wavelength of 650-900 nm, which do not overlap with the autofluorescence spectrum of the body and can effectively reduce background interference. In addition, NIR fluorescent dyes have good tissue penetration and high resolution. Therefore, they have been widely used in live imaging, including non-invasive real-time monitoring of animal models of cerebral ischemic stroke [13-16].
In the current study, we first detected the expression of MHC-I molecules in the CNS of acute ischemic stroke mice and then created a high-affinity peptide (H2BP) specific for mouse MHC-I molecules. Finally, we investigated whether the Cy5.5 conjugated probe (Cy5.5-H2BP) could serve as target tracer for NIR optical monitoring of cerebral ischemic stroke.
Methods
Ethics statement
All experimental protocols were approved by the Institutional Animal Use and Care Committee (IACUC) of Southeast University. All surgical procedures were performed in accordance with the National Guidelines for the Care and Use of Laboratory Animals.
Animal models
Anesthesia was induced by intraperitoneal (i.p.) injection of pentobarbital sodium (60 mg/kg; Sigma-Aldrich, USA) during surgery. The body temperature of the animals was monitored continuously and was maintained at 37±0.5°C using a heating pad [17].
Middle cerebral artery occlusion (MCAO) stroke model
More than 50 C57BL/6 mice were used for the MCAO model, which is an ischemia-reperfusion model. The total duration of each operation was up to 45 min. Mice were administered 0.4% pentobarbital sodium (40 mg/kg, i.p.) and fixed in the supine position. The common carotid artery (CCA), external carotid artery (ECA) and internal carotid artery (ICA) were dissected from the inner edge of the sternocleidomastoid muscle, and the fascia was separated along the midline of the neck. The surgical procedure for our experiment was as follows: first, the CCA was ligated at the proximal end. Second, the distal end of the ECA was ligated. Third, the ICA was temporarily clipped with a micro-artery clip. Then, we cut a small 2-mm hole from the ECA bifurcation, inserted the tip of a coated monofilament into the ICA, gently pushed the monofilament using surgical tweezers, calculated the distance from the bifurcation of the vessel, and tightened the telecentric end of the thin line when the insertion depth was approximately 1 cm from ECA. This time period was defined as the ischemic time. One hour after the induction of ischemia, the thin monofilament at the distal end of the ECA was untwisted, its coated-tip was gently removed, and the distal end of the ECA was immediately tightly fastened to prevent bleeding. Then, the ligature was released from the proximal end of the CCA, and blood flow was returned to the brain. The sham-operated mice were treated with the same method, but the monofilament was inserted into the ICA to half the insertion depth described above. After 1 h, the monofilament was removed from the sham-operated mice. Lidocaine gel was placed onto the surgical wound after the operation. The mice were allowed to awaken and then were returned to their home cages. Heating pads were used to maintain the body temperature of the animals to a constant 24°C. The mice were monitored for any abnormal health effects.
Photothrombotic stroke model
A total of 80 male C57BL/6 mice (6 weeks old) were maintained on a 12 h/12 h light-dark cycle with food and water freely available during the experimental period. Anesthesia was induced with 2% isoflurane (KeYuan, Shandong, China) and was maintained with 1% isoflurane using a gas anesthesia mask. Rose bengal (100 mg/kg, i.p., Sigma-Aldrich, USA) was injected 5 min prior to illumination. For illumination, a 4-mm-diameter fiber of a cold light source (Zeiss, Germany) was centered 2 mm to the right of the bregma after hair removal [14]. The brains were illuminated for 15 min, and the mice were then allowed to recover from the anesthesia. Two ischemic mouse models were verified via T2-weighted imaging 24 h post-surgery.
Magnetic resonance imaging (MRI)
MRI was performed using a 7.0 Tesla small animal MR scanner (Bruker PharmaScan, Germany). The body temperature and respiration of the mice were monitored during the MRI scanning. Fast spin echo sequences (repetition time/echo time, 2000 ms/50 ms) were used for the T2-weighted imaging. Twelve axial slices with a slice thickness of 1 mm, matrix of 256×256, and field of view of 2×2 cm were positioned over the brain.
Neuron cultures and oxygen glucose deprivation (OGD)
Cultures were derived from postnatal day 0 to postnatal day 1 mouse cortex [18]. Primary cortex neurons were grown on six-well plates or on coverslips (coated with 100 μg/mL poly-D-lysine) in 24-well plates for 7 days in Neurobasal-A medium (Gibco-BRL) supplemented with B27 (Invitrogen, San Diego, CA, USA), GlutaMAX (Invitrogen), and D-glucose (Sigma-Aldrich). Half of the volume of the media was changed after 3 days in vitro (div). For neural OGD, 7 div cultures were used. After discarding the original culture medium, the OGD group was washed twice with glucose-free DMEM (Sigma-Aldrich), 500 μL of fresh glucose-free DMEM medium was added to the cultures, and the cultures were maintained at 37°C, 95% nitrogen, 5% CO2 for 2 h. The control group was cultured in DMEM medium and incubated at 37°C, 5% CO2 and 20% O2 for 2 h. After anaerobic incubation for 2 h, the glucose-free DMEM medium was replaced with fresh neuronal culture medium, and incubated at 37°C, 5% CO2 and 20% O2 for 0-48 h.
Quantitative real-time PCR (RT-qPCR)
Total RNA was extracted from mouse cerebral and primary cultured neurons using TRIzol reagent according to the manufacturer's instructions (Invitrogen). RNA was treated with DNase I and reverse transcribed using oligo (dT) primers and M-MLV (Promega, Madison, WI, USA) according to the manufacturer's protocol. Gene expression was assessed using RT-qPCR (Applied Biosystems, San Diego, CA, USA). The RT-qPCR primers were as follows: H-2Kb, forward-5'-GCTGGTGAAGCAGAGAGACTCAG-3', reverse-5'-GGTGACTTTATCTTCAGGTCTGCT-3'; H-2Db, forward-5'-AGTGGTGCTGCAGAGCATTACAA-3', reverse-5'-GGTGACTTCACCTTTAGATCTGGG-3'; and βIII-tubulin (Tuj1), forward-5'-CGAGACCTACTGCATCGACA-3', reverse-5'-CATTGAGCTGACCAGGGAAT-3'.
Western blotting
The protein concentrations of each sample were calculated using the BCA method. The proteins were separated by SDS-PAGE and transferred to polyvinylidene fluoride membranes (Millipore, Boston, Massachusetts, USA). After blocking with 5% skim milk (BD Bioscience, San Diego, USA), the samples were incubated with the primary mouse anti-rat MHC-I (OX18, which recognizes the rat and mouse MHC-I heavy chain, 1:1000, Abcam, USA), rabbit anti-mouse Tuj1 (neuron specific class III beta tubulin, 1:3000 Covance, USA), or mouse anti-human actin (1:5000, Pierce, USA) antibodies at 4°C overnight, followed by incubation with a horseradish peroxidase-conjugated secondary antibody (1:10000, Pierce, USA). The protein expression in each sample was analyzed using ImageJ software (NIH, Bethesda, MD, USA).
Immunofluorescence staining
Primary antibodies, including the rat anti-mouse H-2Kb and H-2Db (ER-Hr52, 1:150, Abcam, USA), mouse anti-rat MHC-I (OX-18, 1:150, Abcam, USA), mouse anti-mouse MAP2 (1:500, Bioword, USA), rabbit anti-mouse NeuN (1:1000, Abcam, USA) and rabbit anti-mouse Tuj1 (1:1000, Pierce, USA) antibodies, were used in the immunofluorescence experiments.
Brains were fixed in 4% paraformaldehyde in 0.01 M PBS overnight, cryoprotected in 30% sucrose at 4°C and then embedded in OCT embedding media. Coronal brain sections (20-μm-thick) were rinsed in 0.01 M PBS for 5 min and permeabilized with PBS with 0.1% Triton X-100 (PBT) for 30 min. Non-specific antibody binding sites were blocked with 10% normal serum in PBT for 2 h at room temperature (RT). The sections were then incubated in a humid chamber overnight at 4°C with primary antibodies. After washing 3 times with PBT, the sections were incubated with a secondary antibody for 3 h in a humid chamber at RT. After a final washing with PBS, the slides or coverslips were mounted using mounting medium (Prolong Gold Anti-fade Reagent; Invitrogen, Grand Island, NY, USA). Substituting the primary antibodies with isotype control antibodies served as the negative controls. The staining of the spleen sections served as the positive controls. The nuclei were counterstained with DAPI (Sigma-Aldrich, St. Louis, MO, USA), and the slices were scanned using laser-scanning confocal microscopy.
For the protein labeling of the OGD neurons, coverslips were fixed with 4% paraformaldehyde (w/v) in 0.01 M PBS with 4% sucrose (w/v) for 20 min. The cells were washed with PBS for 5 min, permeabilized with 0.25% Triton X-100 (w/v) for 5 min and then washed again 3 times with PBS. Neurons were blocked for 30 min with 10% bovine serum albumin (BSA, w/v) in PBS and incubated with primary antibodies overnight at 4°C. After washing 3 times with PBS and 3% BSA, the coverslips were incubated with secondary antibodies for 1 h. Following secondary binding, the cells were rinsed with PBS and mounted on slides using Prolong Gold Anti-fade Reagent (Invitrogen). The slides and coverslips were observed under a laser scanning confocal microscope (Olympus Fluoview FV1000, Tokyo, Japan).
For the FITC-probe imaging of the mouse neuron OGD model, FITC-H2BP or FITC-H2CP (40 μM) was added to the culture medium at the time of reoxygenation, and the coverslips were further cultured for 24 h. The coverslips were treated and observed as described above.
FITC-peptide loaded on spleen cell MHC-I molecules and flow cytometry
Spleen cells from C57BL/6 WT mice or C57BL/6 H2-Kb-/-Db-/- mice were suspended in 3% BSA-PBS. FITC-H2BP or FITC-H2CP peptides were diluted by 1% BSA-PBS, and then incubated with the spleen cells at 37°C for 1-3 h. After centrifugation at 1200 rpm for 5 min, the supernatant was discarded. The cells were washed 3 times with 1% BSA-PBS, and then, 0.6 mL of PBS was added to each tube to resuspend the cells. The cells in each group were analyzed using a FACS caliber cytometer and CellQuest software (BD Biosciences).
Near-infrared fluorescence (NIRF) imaging
In vivo and ex vivo NIRF imaging was performed using a Maestro In-Vivo Imaging System (CRi, Woburn, MA, USA). The H2BP-Cy5.5 probe or H2CP-Cy5.5 (control) probe (10 nM, 200 μL in PBS, pH 7.4) was injected via the tail vein and detected with two filter sets (Cy5.5: excitation=675 nm; emission=695 nm long pass). After in vivo NIRF imaging, mouse organs, including the brain, heart, spleen, liver, kidney and lung, were surgically dissected for ex vivo NIRF imaging. The quantification of the NIRF signal intensity was achieved from ex vivo tissues.
Statistical analyses
All in vitro experiments were repeated at least three times. The numerical data are expressed as the mean±standard error of the mean (SEM). All statistical analyses were performed with one-way ANOVA or Student's t-test using the SPSS17 software. P<0.05 was considered statistically significant.
Results
The expression of MHC-I molecules during the acute phase after ischemia
To examine whether MHC-I molecules increase after stroke, adult C57BL/6 mice subjected to the transient MCAO (tMCAO) model, the photothrombosis in vivo ischemic model and the neuron OGD in vitro ischemic model.
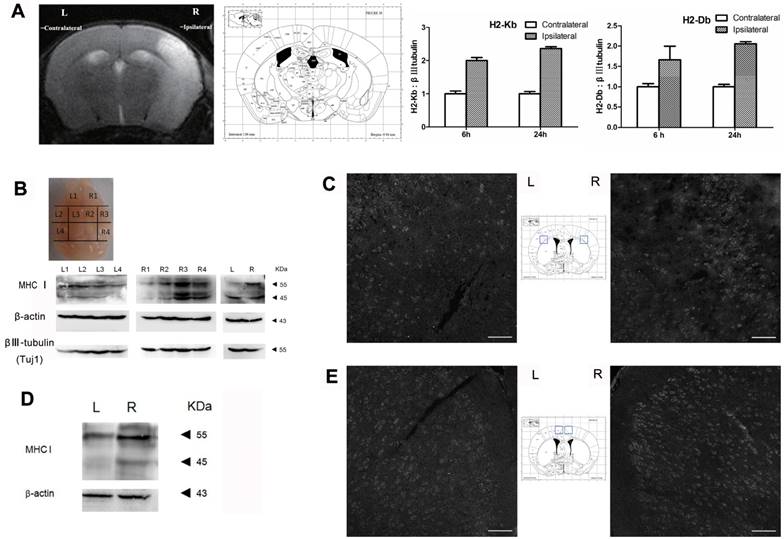
The results of the qRT-PCR analysis showed that the expression level of H2-Kb mRNA was markedly increased in the injured hemisphere (ipsilateral) compared with expression in the contralateral hemisphere at 6 h and 24 h after MCAO (Figure 1A; the organizational chart of the mouse brain atlas is from [19]). In addition, the expression pattern of H2-Db mRNA was similar to that of H2-Kb (6 h: 1.6-fold increase, P<0.05; 24 h: 2.1-fold increase, P<0.05). Western blotting was used to analyze the expression of cerebral MHC-I molecules (H2-Kb and Db) at 6 h and 24 h after reperfusion. The results showed that the MHC-I molecules were differentially expressed in the different sections of the brain (Figure 1B). The R3 region exhibited the highest expression level of MHC-I molecules. Furthermore, the expression level of MHC-I molecules in the ischemic hemisphere (right side) was significantly higher than that in the contralateral hemisphere (left side). The immunostaining results also showed that the expression level of MHC-I molecules in the ischemic hemisphere was significantly higher than that in the contralateral hemisphere 6 h and 24 h after reperfusion.
MHC-I expression increases after MCAO. (A) Mouse MCAO model 24 h after ischemia-reperfusion. MRI-T2 imaging showing the changes in H2-Db and H2-Kb mRNA expression in the MCAO model 6 h and 24 h after ischemia-reperfusion. (B, C) Expression of the MHC-I protein in the mouse MCAO stroke model 6 h after ischemia-reperfusion (scale bar, 100 μm). (D, E) Expression of the MHC-I protein in the mouse MCAO stroke model 24 h after ischemia-reperfusion (scale bar, 100 μm).
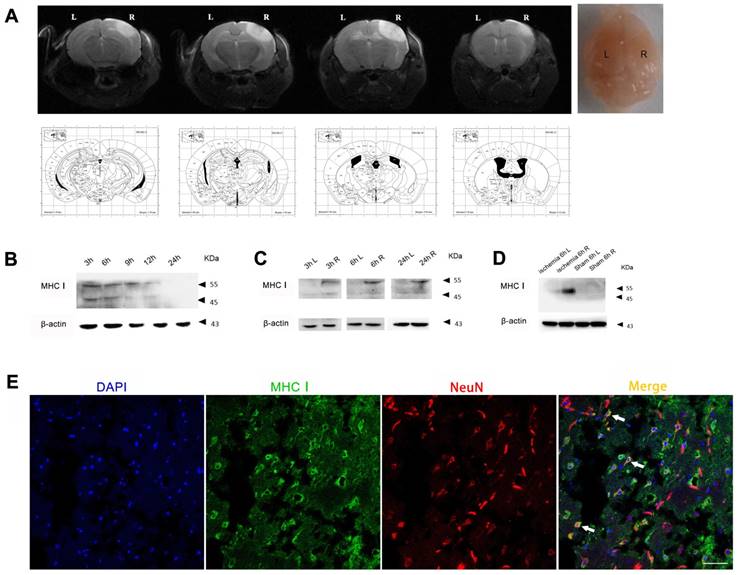
In the photothrombotic cerebral ischemic mouse model, the expression level of MHC-I molecules in the injured cerebral cortex peaked 3 h after ischemia and then slowly decreased from 3 h to 24 h (Figure 2B). In addition, the expression level of MHC-I molecules in the ischemic hemisphere was significantly higher than that in the contralateral hemisphere 3 h, 6 h and 24 h after ischemia. Further analysis showed that the difference in the expression of the 55 kDa MHC-I molecule between the ischemic hemisphere and the contralateral hemisphere was more significant than that of the 45 kDa MHC-I molecule, which was consistent with the results of the MCAO model (Figure 2D). The results of the immunostaining demonstrated that the majority of the cells expressing MHC-I molecules were NeuN-positive neurons (Figure 2E), which is consistent with the results of previous studies [20].
MHC-I expression increases after photothrombotic stroke. (A) Mouse ischemia 24 h after photothrombotic stroke. MRI-T2 imaging. (B) Expression of the MHC-I protein in the cerebral ischemic cortex from 3-24 h after ischemia in the photothrombotic model. (C) The changes in MHCⅠprotein expression between the left and right cerebral cortex were measured at different time points. (D) The changes in MHC-I protein expression in the cerebral cortex of the photothrombotic experimental group and the sham-operated group 6 h after ischemia. (E) Brain tissue immunofluorescence staining showing MHC-I expression in NeuN-positive neurons 24 h after photothrombotic ischemia (scale bar, 50 μm).
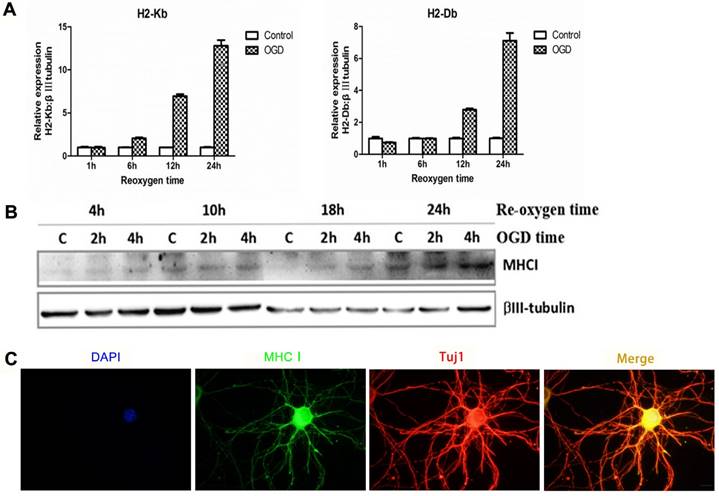
In the cultured neuron OGD in vitro ischemic model, the mRNA (Figure 3A) and protein expression of MHC-I molecules (Figure 3B) was significantly increased within 24 h after ischemic injury. In addition, the results of the immunostaining also showed neuronal expression of MHC-I molecules (Figure 3C).
Expression pattern of MHC-I molecules in the OGD primary cortical neuronal culture model in mice. (A) The mRNA expression trends for H2-Db and H2-Kb in the OGD culture model 1-24 h after hypoxia and reoxygenation. (B) The expression of MHC-I molecules after 2 h or 4 h of OGD, followed by reoxygenation for 4-24 h.(C) The results of immunofluorescence staining showing that the staining signals of the MHC-I molecules co-localized with the β-tubulin (Tuj1)-positive neurons 24 h after reoxygenation (scale bar, 10 μm).
Bioinformatic screening of mouse H2-Kb/H2-Db target peptides
The IEDB database (www.iedb.org) was used to select the candidate epitope peptides that could bind to both H-2Kb and H-2Db. The primary screening indicated that the gp33 epitope peptide "KAVYNFATM" from the viral envelope glycoprotein lymphocytic choriomeningitis mammarenavirus (LCMV) was a candidate. Subsequently, the gp33 (V3L) epitope peptide (KALYNFATM), which not only had higher affinity for the H-2Kb and H-2Db molecules than the wild-type gp33 epitope but also could escape the host's immune system, was selected to avoid immune side effects during the in vivo imaging of the ischemic stroke mice. The gp33 (V3L) epitope peptide, called the H2BP peptide, was used as a candidate probe to target MHC-I molecules. In this study, we also designed a control peptide “KYALTMFAN”, which was named H2CP. According to the artificial neural network (ANN) algorithm, the affinity level of the control peptide with H-2Kb and H-2Db was very low. Next, the H2BP and H2CP peptides were analyzed using the ProtParam tool in the ExPASy platform. H2BP and H2CP were share the same molecular weight 1058.2, the same theoretical isoelectric point (PI) 8.59 and the identical molecular formula C49H75N11O13S1.
To test whether H2BP-MHC-I and LY49A, a mouse CNS potential ligand, could avoid immunological side effects, we first performed a ligand-receptor binding computer simulation with Cluspro 2.0 (http://cluspro.bu.edu/home.php) in the rigid molecular docking mode (the structural data of the H2BP-MHC-I complex PDB ID: 1S7S, gp33-MHC-I complex PDB ID: 1S7Q, LY49A PDB ID: 1QO3; Figure 4A).
The results of the rigid, flexible docking and scoring assessment of the H2BP-MHC-I complex or gp33-MHC-I complex to Ly49A using bioinformatics methods. (A) Cluspro 2.0 platform was used to generate the H2BP-MHC-I complex/gp33-MHC-I complex and Ly49A docking diagrams. (B) The total energy landscapes of the H2BP-MHC-I complex/gp33-MHC-I complex and Ly49A full atomic models, as generated using Rosetta.
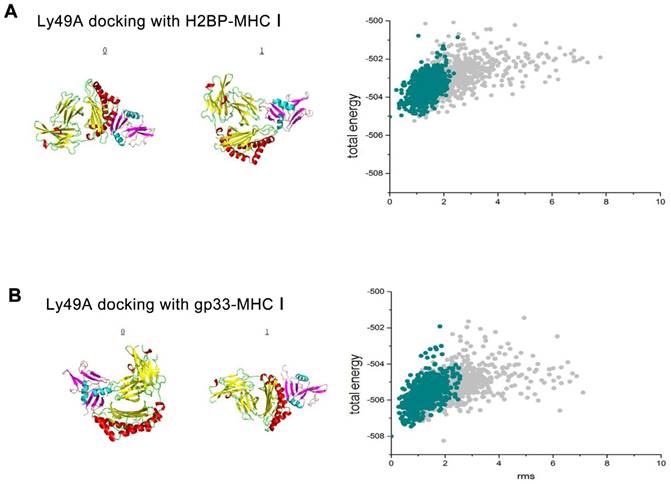
After obtaining the data of the computer simulation of the molecular interaction (H2BP-MHC-I and LY49A, gp33-MHCI and LY49A), we simulated the flexible docking of these complexes with the docking 2 mode in the Rosetta platform (http://rosie.rosettacommons.org/). The results showed that the energy of the H2BP-MHC-I-LY49A complex was lower than that of the gp33-MHC-I-LY49A complex (Figure 4B). Thus, we could easily determine that when docked against LY49A, the affinity of H2BP-MHC-I was lower than that of gp33-MHC-I. LY49A is one of the major receptors of the MHC-peptide complex. Under the condition of ischemia, the MHC-I-peptide complex combined with LY49A can activate LY49A downstream inflammatory pathways and cause immune side effects [20]. Therefore, the H2BP-MHC-I complex is likely to avoid the LY49A pathway-mediated side effects.
Identification of FITC-H2BP binding specificity for mouse cell surface MHC-I molecules using FACS
According to Cebrian et al., rodent neurons that were once regarded as MHC-I deficient, are able to express immunologically functional MHC-I proteins under certain conditions [1], suggesting that MHC-I molecules could present specific antigenic peptides in their peptide-binding groove for T-cell receptors. Since MHC-I molecules with “empty” grooves are unstable on the cell surface, these molecules needed to load candidate peptides, including peptides with unfitting anchor residues or unfavorable N termini [21]. Because different peptides have different affinities and dissociation rates for MHC-I molecules on the cell surface, high-affinity peptides may compete with low-affinity or middle-affinity peptides to occupy the peptide-binding groove [21-22]. The strategy employed in our study was to trace neuronal MHC-I under ischemia using a fluorescent mouse MHC-I groove-binding peptide.
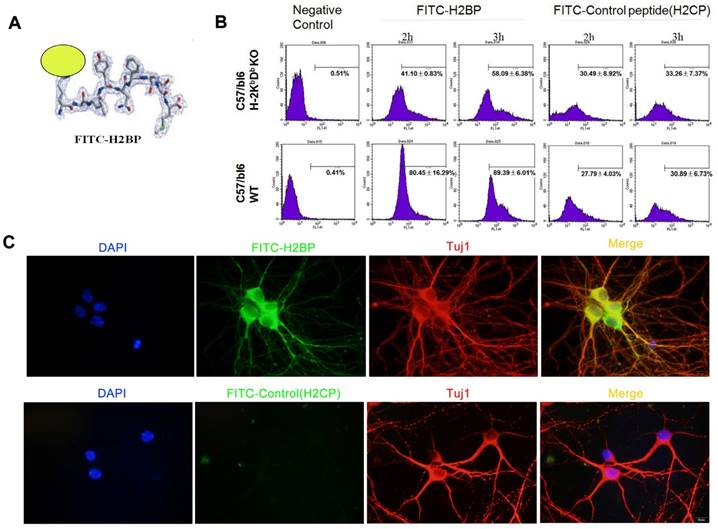
We obtained the candidate peptide H2BP (KALYNFATM) using the above bioinformatics methods. Considering the interaction features between the MHC-I antigen-presenting groove and the peptide, we designed the FITC dye to conjugate to the side chain of the first amino acid residue lysine (K) (Figure 5A). FACS study of H-2Kb-/-Db-/- and C57BL/6 wild-type mice spleen cells was applied to demonstrate the specificity of FITC-H2BP (K (FITC) ALYNFATM). The FITC-conjugated control peptide H2CP (K (FITC) YALTMFAN) served as the control probe. When the cells were incubated with the same concentration of FITC-H2BP or FITC-H2CP under the exact same conditions, the cell and probe combinations showed distinct positive percentages (Figure 5B). After the cells were incubated for 2 h with 40 μM FITC-H2BP, the positive percentages of wild-type cells and H-2Kb-/-Db-/- cells were 80.45±16.29% and 41.10±0.83%, respectively (P<0.05). After the cells were incubated for 3 h with 40 μM FITC-H2BP, the positive percentages of wild-type cells and H-2Kb-/-Db-/- cells were 89.39±6.01% and 58.09±6.38%, respectively (P<0.05). However, the FITC-H2CP probe displayed no significant differences between the wild-type cells and H-2Kb-/-Db-/- cells (2 h incubation: wild-type cells 27.79±4.03%, H-2Kb-/-Db-/- cells 30.49±8.92%, not significant; 3 h incubation: wild-type cells 30.89±6.73%, H-2Kb-/-Db-/- cells 33.26±7.37%, not significant).
In vitro assay showing the structure and binding of FITC-H2BP with MHC-I on the cell surface in mice. (A) Structure of the FITC-H2BP molecular probes. (B) Binding percentages of FITC-H2BP to C57BL/6 WT and C57BL/6 H-2Kb-/-Db-/- mouse spleen cells, as detected by flow cytometry. (C) Cellular immunofluorescence showing the imaging effect of the FITC-H2BP peptide and the C57BL/6 wild-type mouse cortical neuron OGD model (scale bar, 10 μm).
Identification of FITC-H2BP binding specificity for mouse neuronal MHC-I molecules using OGD fluorescence imaging
The experiments utilizing the in vitro ischemic OGD model demonstrated that FITC-H2BP could specifically bind the surface of ischemic neuronal cells, whereas the FITC-conjugated scrambled control peptide (H2CP) showed almost no detectable signal (Figure 5C).
In vivo fluorescence imaging (Figure 6A, upper) 24 h after ischemia in the MCAO mouse model showed no differences between the right and left hemispheres in the stroke mice injected with the FITC-H2CP probe (control probe), whereas strong fluorescence was observed in the ipsilateral side of the MCAO mice injected with the FITC-H2BP probe (Figure 6A, lower).
Fluorescence optical in vivo imaging of FITC-H2BP in the photothrombotic stroke mouse model. (A) The imaging results 24 h after ischemia. (B) Histogram of the tissue section. (C) Fluorescence signal detection in the brain tissue sections (scale bar, 100 μm).
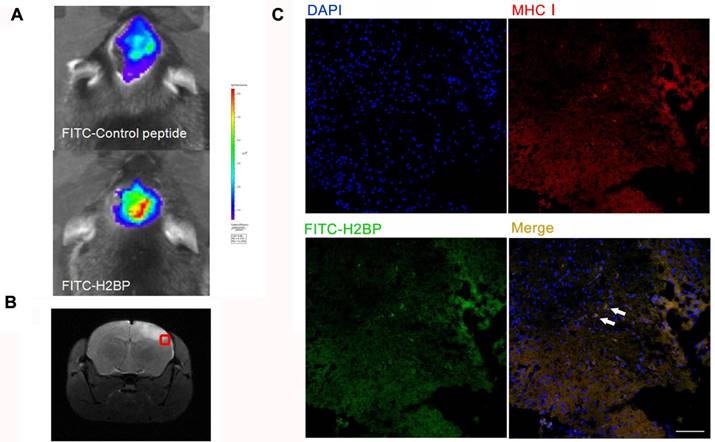
The results of the fluorescence microscopy and immunohistochemistry showed that a large proportion of two signals, the FITC-H2BP signals and anti-MHC-I signals, were co-localized (Figure 6C).
In vivo imaging and ex vivo bio-distribution of the Cy5.5-H2BP probe
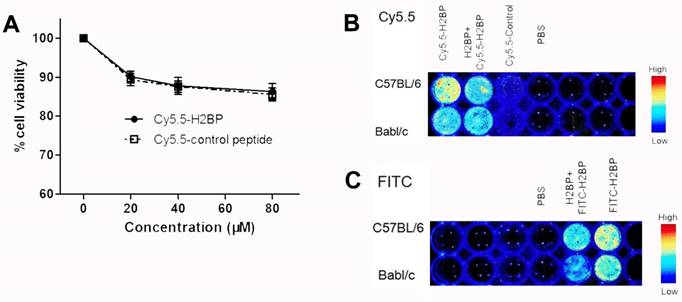
To minimize the background noise of the MHC-I molecules targeted during the in vivo imaging in the ischemic mice, we replaced FITC with the NIR fluorescent dye Cy5.5. Finally, high-performance NIR imaging probes, including Cy5.5-H2BP (K(Cy5.5)ALYNFATM) and the control probe Cy5.5-H2CP(K(Cy5.5)YALTMFAN), were constructed for in vivo imaging. The results of the CCK-8 assay showed that after neuronal cultures were treated with different dilutions of the probes for 24 h, the Cy5.5-H2BP probe had low cytotoxicity to neurons (Figure 7A). In addition, ex vivo imaging assays demonstrated that the Cy5.5-H2BP (Figure 7B) and FITC-H2BP probes (Figure 7C) had similar specificities in mouse spleen cells. Serial in vivo NIRF images were acquired in the brains of the photothrombosis model mice from 1 h to 24 h following tail vein injection of the probe (Figure 8A). Significant NIRF signal enhancement was observed beginning at 4 h, and peak signal intensity was approximately 8 h post-injection (Figure 8B). At 24 h after probe administration, enhanced signal intensity was observed in the ischemic brain on both the in vivo and ex vivo NIRF images. The target background ratio (TBR) was significantly enhanced with the Cy5.5-H2BP probe compared with that with the Cy5.5-H2CP probe (n=6 per group, Figure 8C). The quantitative TBR values derived from the NIRF images were significantly higher in the brain than in other organs (Figure 8D). Moreover, the ex vivo NIRF images showed high signal intensity in the kidney at 24 h after injection of the probe (Figure 8D), indicating that the probe might be excreted mainly via the kidney.
Effect of the Cy5.5-H2BP probe on neuronal survival and in vitro spleen cell imaging. (A) The influence of the Cy5.5-H2BP NIRF imaging molecular probe on the survival of primary cultured cortical neurons. (B) Cy5.5-H2BP and (C) FITC-H2BP NIRF spleen cell imaging.
NIRF imaging of the Cy5.5-H2BP probe in the photothrombotic stroke mice. (A) In vivo Cy5.5-H2BP imaging results in mice 1-24 h after cerebral ischemia. (B) The statistical results for the TBR signal at each time point was calculated for the Cy5.5-H2BP and Cy5.5-H2CP (control) probes from the NIRF images of the ischemic/contralateral hemispheres following in vivo imaging in mice. (C) T2-MR in vivo and in vitro imaging results and TBR numerical statistics for the brain tissue of mice injected with the Cy5.5-H2BP and Cy5.5-H2CP (control) probes 24 h after cerebral ischemia.(D) Intensity of the NIRF signals in the brain, heart, liver, spleen, lung and kidney. The data are represented as the mean±SEM, n=6, *P<0.05, **P<0.01, ***P<0.001. (E) Detection of the Cy5.5-H2BP probe and Cy5.5-H2CP probe in the ischemic brain sections. (Upper) MRI-T2 imaging of the probes injected into the mice 24 h after photothrombotic stroke. (Lower) Confocal scanning analysis of brain tissues sections from mice injected with the Cy5.5-H2BP probe and Cy5.5-H2CP probe (scale bar, 50 μm). C, P and I represent the ischemic core, peri-ischemic zone and intact zone, respectively.
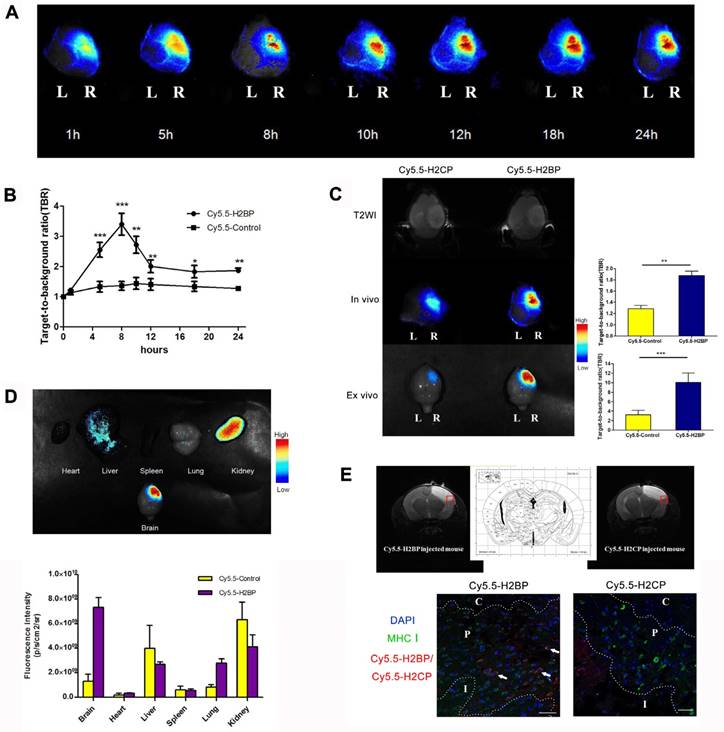
Immunofluorescence imaging confirmed that MHC-I molecules were expressed in the ischemic brain 24 h after the onset of ischemia (Figure 2E). Furthermore, immunofluorescence imaging of the brain sections showed that some of the MHC-I signals overlapped with the Cy5.5 fluorescence signals in the mice injected with the H2BP probe (Figure 8E). These results indicated that the Cy5.5-H2BP probe was closely associated with MHC-I expression during the acute phase of ischemic stroke, which allowed for MHC-I neuronal expression to be visualized dynamically.
Discussion
In the acute phase of ischemic brain injury, the spatiotemporal expression of MHC-I molecules and whether MHC-I molecules can function as molecular targets in cerebral ischemia has not been reported to date. Investigating these two points is of great significance not only to further understand the role of MHC-I molecules in ischemic hypoxic brain injury and repair but also for the molecular imaging of ischemic stroke.
We detected the expression of MHC-I molecules in the first 24 h after ischemia in both the MCAO and photothrombotic mouse models. The results showed that the expression levels of MHC-I molecules peaked 3 h after ischemia. In addition, the expression levels of MHC-I molecules were significantly increased throughout the brain. The expression levels of MHC-I molecules in the ischemic hemisphere were higher than that in the contralateral hemisphere, suggesting that MHC-I molecules can function as neuronal stress signals in response to CNS damage. Cellular immunofluorescence staining of the neuron OGD model showed that MHC-I molecules were co-localized with β-tubulin-labeled neurons. This finding is in agreement with the report by Adelson et al. showing that the cell types expressing MHC-I molecules in the mouse MCAO model were neurons [20], and is also consistent with previous studies in our laboratory demonstrating that MHC-I molecules are expressed in developing CNS cell types [3-4]. In the present study, we found that the expression levels of MHC-I molecules decreased gradually from 3 h to 24 h after cerebral ischemia, but they did not decrease to levels less than those in the normal brain. The Adelson team reported that the mRNA levels of MHC-I molecules were higher than those in the contralateral hemisphere 24 h and 7 d after cerebral ischemia [20], which is consistent with the protein levels observed at 24 h in our study. In summary, we found that MHC class I molecules reached peak expression levels in the ischemic stroke mice within 3 h (photothrombotic model) or 6 h (MCAO model), suggesting that MHC class I molecules could serve as potential targets for ischemic acute phase imaging. These targets may provide the potential to visualize, localize and characterize the tissue surrounding the ischemic core.
We found that the temporal expression of MHC-I molecules differed between the neuron OGD model and in vivo cerebral ischemia model, which might be explained as follows: (1) In the mouse cortex, only 10% of cells are neurons [23], whereas more than 95% of the cells are neurons in in vitro neuronal cultures [24]. Therefore, the mechanism of ischemic injury in the two models might be different. (2) Primary cultured neurons can constitutively express MHC-I molecules, which is different from neurons in the CNS. Although hypoxia stimulation can up-regulate the expression of MHC-I molecules in both in vivo and in vitro models, the regulatory mechanism of MHC-I up-regulation might be different in vivo and in vitro.
According to Dixon-Salazar et al., the mouse-derived monoclonal antibody OX-18 can detect two specific bands (45 kDa and 55 kDa) in brain tissue-derived MHC-I molecules using Western blotting [25]. We further analyzed the expression of the above two specific molecules in two animal models of cerebral ischemic stroke. The results showed that the expression of the 55 kDa MHC-I molecule in the injured hemisphere was significantly enhanced compared with that in the contralateral hemisphere, whereas the expression of the 45 kDa MHC-I molecule was not significantly different between the injured and contralateral hemispheres. Furthermore, the above expression pattern of MHC-I molecules was also observed 3 h, 6 h and 24 h after ischemia, which suggested that the 55 kDa MHC-I molecule may play an important role in cerebral ischemic injury.
Dixon-Salazar et al. found that the insulin receptor beta subunit could initiate downstream signaling by interacting only with the 55 kDa MHC-I molecule, which limits the development of the CNS synaptic density [25]. However, whether the 55 kDa protein only can bind the receptor and activate its downstream pathway in cerebral ischemia models needs to be further explored.
Using NIRF imaging in the ischemic stroke mice, we found that the trend of the TBR changes in the Cy5.5-H2BP probe group was not completely consistent with the temporally expression of the MHC-I protein in the ischemic brain tissue, which might be explained as follows: (1) The Cy5.5-H2BP probe was injected into the mouse blood circulation through the caudal vein, which may not reach the target region of cerebral ischemia due to the destruction of the blood supply of the brain tissue and the slow diffusion of the probe. (2) The Cy5.5-H2BP probe is an N-terminal side-chain modified polypeptide. The bioinformatic results showed that the in vivo half-life of the Cy5.5-H2BP probe was only several hours. It is possible that after 8 h, the free Cy5.5-H2BP probe was extensively degraded by in vivo proteolytic enzymes and metabolized via the liver or kidney. In a follow-up study, we will use the H2BP probe to monitor the ischemic mice 24 h after the onset of cerebral ischemia. A feasible experimental strategy may be as follows: (1) The Cy5.5-H2BP probe might need to be injected again within 12 hours before imaging. (2) To improve the stability of the Cy5.5-H2BP probe, the structure of the molecule might need to be further modified. For example, the lysine residue side chain in the H2BP peptide was coupled with PEG to prolong its in vivo half-life. (3) Because the limitations of in vivo fluorescent imaging of the brain with an intact skull are very difficult to overcome, this peptide may be used to construct MRI probes for the modification of isotopes or gadolinium (Gd) on the N-terminal lysine side of the H2BP probe in high-resolution in vivo imaging studies.
Conclusions
The present study demonstrated that MHC-I molecules were up-regulated in mouse neurons after ischemia and could serve as imaging target during the acute phase of cerebral ischemia. In addition, the peptide for the antigen-binding groove of MHC-I molecules could be applied in optical imaging studies. Our study will contribute to understanding the role of MHC-I molecules in cerebral ischemia injury and tissue repair, as well as stroke imaging.
Acknowledgements
This research was supported by the National Basic Research Program of China (973 program: 2013CB733801) and the Key Project of the National Natural Science Foundation of China (81230034).
Authorship contributions
J.X performed the experiments. J.W. completed the mRNA detection experiments. J.C, F.B, F.M and Y.S collaborated on the libraries. J.Z, H.Z, X.G and Y.Z wrote the paper. G.T and J.Z supervised the experiments.
Competing Interests
The authors have declared that no competing interest exists.
References
1. Cebrián C, Zucca FA, Mauri P, Steinbeck JA, Studer L, Scherzer CR. et al. MHC-I expression renders catecholaminergic neurons susceptible to T-cell-mediated degeneration. Nat Commun. 2014;5:3633
2. Lv D, Shen Y, Peng Y, Liu J, Miao F, Zhang J. Neuronal MHC Class I Expression Is Regulated by Activity Driven Calcium Signaling. PLoS One. 2015;10:e0135223
3. Lv D, Shi Q, Liu J, Zhang A, Miao F, He Y. et al. The similar expression pattern of MHC class I molecules in human and mouse cerebellar cortex. Neurochem Res. 2014;39:180-6
4. Liu J, Shen Y, Li M, Shi Q, Zhang A, Miao F. et al. The expression pattern of classical MHC class I molecules in the development of mouse central nervous system. Neurochem Res. 2013;38:290-9
5. Andreatta M, Nielsen M. Gapped sequence alignment using artificial neural networks: application to the MHC class I system. Bioinformatics. 2016;32:511-7
6. Nielsen M, Lundegaard C, Worning P, Lauemøller SL, Lamberth K, Buus S. et al. Reliable prediction of T-cell epitopes using neural networks with novel sequence representations. Protein Sci. 2003;12:1007-17
7. Paul S, Sidney J, Sette A, Peters B. TepiTool: A Pipeline for Computational Prediction of T Cell Epitope Candidates. Curr Protoc Immunol. 2016;114:18191-24
8. Jurtz VI, Villarroel J, Lund O, Voldby Larsen M, Nielsen M. MetaPhinder-Identifying Bacteriophage Sequences in Metagenomic Data Sets. PLoS One. 2016;11:e0163111
9. Ehret GB, Ferreira T, Chasman DI, Jackson AU, Schmidt EM, Johnson T. et al. The genetics of blood pressure regulation and its target organs from association studies in 342,415 individuals. Nat Genet. 2016;48:1171-84
10. Bentzen AK, Marquard AM, Lyngaa R, Saini SK, Ramskov S, Donia M. et al. Large-scale detection of antigen-specific T cells using peptide-MHC-I multimers labeled with DNA barcodes. Nat Biotechnol. 2016;34:1037-45
11. Wang X, Loram LC, Ramos K, de Jesus AJ, Thomas J, Cheng K. et al. Morphine activates neuroinflammation in a manner parallel to endotoxin. Proc Natl Acad Sci U S A. 2012;109:6325-30
12. Johnson DK, Karanicolas J. Ultra-High-Throughput Structure-Based Virtual Screening for Small-Molecule Inhibitors of Protein-Protein Interactions. J Chem Inf Model. 2016;56:399-411
13. Barber PA, Rushforth D, Agrawal S, Tuor UI. Infrared optical imaging of matrix metalloproteinases (MMPs) up regulation following ischemia reperfusion is ameliorated by hypothermia. BMC Neurosci. 2012;13:76
14. Bai YY, Gao X, Wang YC, Peng XG, Chang D, Zheng S. et al. Image-guided pro-angiogenic therapy in diabetic stroke mouse models using a multi-modal nanoprobe. Theranostics. 2014;4:787-97
15. Chang D, Wang YC, Bai YY, Lu CQ, Xu TT, Zhu L. et al. Role of P38 MAPK on MMP Activity in Photothrombotic Stroke Mice as Measured using an Ultrafast MMP Activatable Probe. Sci Rep. 2015;5:16951
16. Magalotti S, Gustafson TP, Cao Q, Abendschein DR, Pierce RA, Berezin MY. et al. Evaluation of inflammatory response to acute ischemia using near-infrared fluorescent reactive oxygen sensors. Mol Imaging Biol. 2013;15:423-30
17. Qian C, Li PC, Jiao Y, Yao HH, Chen YC, Yang J. et al. Precise Characterization of the Penumbra Revealed by MRI: A Modified Photothrombotic Stroke Model Study. PLoS One. 2016;11:e0153756
18. Kaech S, Banker G. Culturing hippocampal neurons. Nat Protoc. 2006;1:2406-15
19. Paxinos G, Franklin KBJ. The Mouse Brain in Stereotaxic Coordinates. 2rd ed. San Diego, CA, USA: Academic. 2001
20. Adelson JD, Barreto GE, Xu L, Kim T, Brott BK, Ouyang YB. et al. Neuroprotection from stroke in the absence of MHCI or PirB. Neuron. 2012;73:1100-7
21. Garstka MA, Fish A, Celie PH, Joosten RP, Janssen GM, Berlin I. et al. The first step of peptide selection in antigen presentation by MHC class I molecules. Proc Natl Acad Sci U S A. 2015;112:1505-10
22. De Silva AD, Boesteanu A, Song R, Nagy N, Harhaj E, Harding CV. et al. Thermolabile H-2Kb molecules expressed by transporter associated with antigen processing-deficient RMA-S cells are occupied by low-affinity peptides. J Immunol. 1999;163:4413-20
23. Kandel ER, Schwartz JH, Jessel TM. Principles of neural science, 4th ed. New York: McGraw-Hill. 2000:19-20
24. Beaudoin GM 3rd, Lee SH, Singh D, Yuan Y, Ng YG, Reichardt LF, Arikkath J. Culturing pyramidal neurons from the early postnatal mouse hippocampus and cortex. Nat Protoc. 2012Sep;7(9):1741-54
25. Dixon-Salazar TJ, Fourgeaud L, Tyler CM, Poole JR, Park JJ, Boulanger LM. MHC class I limits hippocampal synapse density by inhibiting neuronal insulin receptor signaling. J Neurosci. 2014;34:11844-56
Author contact
![]() Corresponding author: E-mail address: zhjqedu.cn
Corresponding author: E-mail address: zhjqedu.cn