Impact Factor
- Issue 13; 2026
- Issue 12; 2026
- Issue 11; 2026
- Issue 10; 2026
- Issue 9; 2026
- Volume 16; 2026
- Advance Articles
- Past Issues
- Cover Images
- Cover Suggestion
- Index & Coverage
- Special Issues
Introduction
Materials and Methods
Results
Discussion
Abbreviations
Supplementary Material
Acknowledgements
References
International Journal of Biological Sciences
International Journal of Medical Sciences
 Global reach, higher impact

Theranostics 2017; 7(16):3824-3841. doi:10.7150/thno.19890 This issue Cite
Research Paper
Metabolomic Profiling of Extracellular Vesicles and Alternative Normalization Methods Reveal Enriched Metabolites and Strategies to Study Prostate Cancer-Related Changes
Maija Puhka1 ![]() , Maarit Takatalo2, Maria-Elisa Nordberg1, Sami Valkonen2, 3, Jatin Nandania5, Maria Aatonen2, Marjo Yliperttula4, Saara Laitinen3, Vidya Velagapudi5, Tuomas Mirtti1, 6, Olli Kallioniemi1, 7, Antti Rannikko1, 8, Pia R-M Siljander2*, Taija Maria af Hällström1, 9*
, Maarit Takatalo2, Maria-Elisa Nordberg1, Sami Valkonen2, 3, Jatin Nandania5, Maria Aatonen2, Marjo Yliperttula4, Saara Laitinen3, Vidya Velagapudi5, Tuomas Mirtti1, 6, Olli Kallioniemi1, 7, Antti Rannikko1, 8, Pia R-M Siljander2*, Taija Maria af Hällström1, 9*
1. Institute for Molecular Medicine Finland FIMM, University of Helsinki, Finland;
2. EV group, Division of Biochemistry and Biotechnology, Department of Biosciences and Division of Pharmaceutical Biosciences, Faculty of Pharmacy, University of Helsinki, Finland;
3. Finnish Red Cross Blood Service, Helsinki, Finland;
4. Division of Pharmaceutical Biosciences, Centre for Drug Research, Faculty of Pharmacy, University of Helsinki, Finland;
5. Metabolomics Unit, Institute for Molecular Medicine Finland FIMM, Helsinki, Finland;
6. Department of Pathology (HUSLAB), Helsinki University Hospital;
7. Science for Life Laboratory, Department of Oncology and Pathology, Karolinska Institutet, Solna, Sweden;
8. Department of Urology, Helsinki University Central Hospital, Helsinki, Finland;
9. Orion Corporation, Orion Pharma, Finland.
* equal contribution
Received 2017-3-2; Accepted 2017-7-6; Published 2017-8-23
Abstract

Body fluids are a rich source of extracellular vesicles (EVs), which carry cargo derived from the secreting cells. So far, biomarkers for pathological conditions have been mainly searched from their protein, (mi)RNA, DNA and lipid cargo. Here, we explored the small molecule metabolites from urinary and platelet EVs relative to their matched source samples. As a proof-of-concept study of intra-EV metabolites, we compared alternative normalization methods to profile urinary EVs from prostate cancer patients before and after prostatectomy and from healthy controls.
Methods: We employed targeted ultra-performance liquid chromatography-tandem mass spectrometry to profile over 100 metabolites in the isolated EVs, original urine samples and platelets. We determined the enrichment of the metabolites in the EVs and analyzed their subcellular origin, pathways and relevant enzymes or transporters through data base searches. EV- and urine-derived factors and ratios between metabolites were tested for normalization of the metabolomics data.
Results: Approximately 1 x 10¹⁰ EVs were sufficient for detection of metabolite profiles from EVs. The profiles of the urinary and platelet EVs overlapped with each other and with those of the source materials, but they also contained unique metabolites. The EVs enriched a selection of cytosolic metabolites including members from the nucleotide and spermidine pathways, which linked to a number of EV-resident enzymes or transporters. Analysis of the urinary EVs from the patients indicated that the levels of glucuronate, D-ribose 5-phosphate and isobutyryl-L-carnitine were 2-26-fold lower in all pre-prostatectomy samples compared to the healthy control and post-prostatectomy samples (p < 0.05). These changes were only detected from EVs by normalization to EV-derived factors or with metabolite ratios, and not from the original urine samples.
Conclusions: Our results suggest that metabolite analysis of EVs from different samples is feasible using a high-throughput platform and relatively small amount of sample material. With the knowledge about the specific enrichment of metabolites and normalization methods, EV metabolomics could be used to gain novel biomarker data not revealed by the analysis of the original EV source materials.
Keywords: extracellular vesicles, exosomes, metabolomics, urine, platelets, prostate cancer
Introduction
Extracellular vesicles (EVs) are known as a promising source of biomarkers. Many studies, particularly the ones addressing cancer, have focused on the RNA and protein cargo of EVs. Some EV-derived cancer biomarkers have already been transferred to clinical use [1, 2]. There are also new developments in the analysis of lipids [3], DNA [4, 5] and glycoproteomic profiles [6, 7]. Small molecule metabolites have attracted far less attention, although their analysis holds the potential to reveal dynamic changes in the metabolism downstream of genetic and proteomic regulation [8-11]. Since cancer cells tend to secrete more vesicles than normal cells [12, 13], exploration of the metabolite content of EVs in the body fluids could offer a sensitive and non-invasive method to detect dynamic cancer-related biomarkers.
Metabolism of cancer cells is altered in several ways due to active cell proliferation i.e. the need for building blocks and energy. Hallmarks of cancer metabolism include accelerated glycolysis and lactic acid production—the Warburg's effect—and upregulation of nucleotide synthesis, which are linked to the activation of transcription factors such as HIF1α and MYC [14]. Metabolite levels change accordingly, for example the Warburg's effect and the activity of several nicotinamide adenine dinucleotide (NAD+) consuming enzymes lead to a low NAD+/NADH balance in cancer cells [15]. Prostate cancer (Pca) exhibits some characteristic alterations, such as the tendency to accumulate choline [16, 17], which has laid the foundation for choline C-11 positron emission tomography (PET) scans to monitor Pca. Malignant transformation of prostate cells has also been reported to lead to a loss of the capability to accumulate zinc and citrate [18]. Lipid and amino acid metabolism are changed in the Pca tissues, which correlates with the overexpression of biosynthetic or catabolic enzymes such as alpha-methylacyl-CoA racemase (AMACR) involved in the beta-oxidation of fatty acids [19-21]. Interestingly, recent reports have revealed that the intra-exosomal metabolome also changes in cancer. Exosomes from cancer associated fibroblasts were shown to supply amino acids and increase glycolysis in cultured Pca cells [8]. In addition, EV metabolites from pancreatic cancer cell lines and plasma of endometrioid adenocarcinoma patients differed from the healthy control EVs [10]. Thus, EVs seem to play an important role in the metabolic control of prostate and other cancer cells.
Despite these advances, normalization of EV biomarker data is generally a big challenge [22]. Due to the lack of standardized normalization methods, researchers studying urinary or other EVs have used creatinine and urine flow rate, EV-derived factors such as particle number or EV-enriched protein markers for normalization [23-26]. However, without comparative studies utilizing several normalization methods to the same data set, it cannot be concluded, which of the methods best brings out the differences.
Since it is still largely unknown, what metabolites EVs contain, we profiled over hundred polar metabolites in the urinary EVs (uEVs) and EVs from another body fluid, i.e. platelet EVs (pEVs) from plasma, and in the matched original EV source materials, to characterize the enrichment, cellular pathways/locations and linked enzymes or transporters of the EV-metabolites. To evaluate the feasibility of the EV metabolomics for future biomarker discovery, we compared uEV samples from Pca patients before and after prostatectomy and from healthy controls utilizing several different normalization methods. Our results suggest that EVs enrich a selection of metabolites from the cytoplasm and that metabolomics of EVs could offer new kind of disease profiles not revealed by the conventional analysis of the original urine samples.
Materials and Methods
Ethical Approvals, Samples and Clinical Measurements
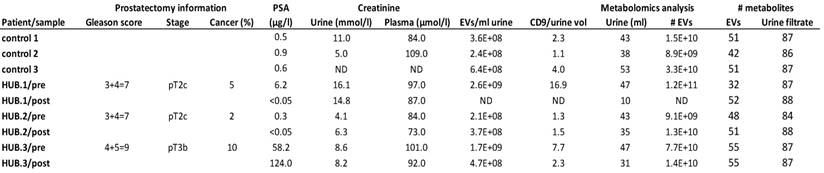
Prostate cancer patient samples were obtained from patients participating with informed consent in the Helsinki Urological Biobank (HUB) project (Dnro 263/13/03/02/2011; 379/13/03/02/2012 and Dnro § 212), where the pathological stage and Gleason score were confirmed from the prostatectomy samples after prostatectomy. Patient details are given in Table 1 and Table S1. Mid-stream spot urine samples were collected according to standard operation procedures of the HUB i.e. after collection, the urine samples were kept cold and centrifuged at 1800 g for 10 min at +4°C. The supernatants were frozen and stored in liquid nitrogen vapor phase. Control samples from healthy < 35 year-old men (Table 1 and S1) were processed similarly to the patient samples. Urine samples and matched plasma samples were collected 0-3 days before and 5-6 weeks after the prostatectomy. Creatinine values in the matched urine and plasma samples were measured in Helsinki-Uusimaa Central Hospital to ascertain that the donors did not have a kidney defect affecting the composition of urine and hence, the urinary EV pool. In each case, the creatinine levels indicated normal functioning of the kidneys. Prostate specific antigen (PSA) values were measured 1-6 months before and 5-6 weeks (Table 1 and S1) and > 2 years (Table S1) after the prostatectomy. PSA values from controls were measured > 3 years after urine collection for the metabolomics analysis (Table S1). For the isolation of platelet-derived EVs, platelet concentrates (containing some residual plasma from the platelet isolation) from the Finnish Red Cross Blood Service (Dnro 235/13/03/00/2011) were obtained from four healthy donors with their informed consent and pooled.
Clinical and pathological information from the prostate cancer patients and controls, and analysis of the isolated urinary EVs. The table shows the Gleason score, pathological stage and proportion of the tumor area in the prostatectomy tissue sections, prostate specific antigen (PSA) concentration in the serum and creatinine values in the matched urine and plasma samples derived from the prostate cancer patients of the Helsinki Urological Biobank project (HUB.1-3). The quantity of EVs isolated from urine was determined by nanoparticle tracking analysis and western blotting of CD9 and expressed relative to urine volume. The table further shows the volume of urine used for urinary EV isolation, the number of urinary EVs subjected to metabolomics analysis and the number of metabolites exceeding the quantification limit in each sample. Not determined (ND), post-prostatectomy (post), pre-prostatectomy (pre).
Isolation of EVs and Platelets
EVs were isolated using differential centrifugation from individual frozen cell-free urine samples prepared by HUB as previously described [27]. The urine samples (Table 1) with higher volumes were processed without dilution, whereas one low volume sample (10 ml), the post-prostatectomy sample of patient HUB.1, was processed with the KeepEX protocol [27] i.e. dilution with alkaline buffer (Tris-HCl, pH 8.6) in order to maximize the EV yield. The procedure after this was the same for all the samples: vortexing, centrifugation at 8000 g for 15 min, filtration (1.2 µm) and finally ultracentrifugation at 100 000 g for 90 min, with a repetition to wash the samples with 30 ml of PBS, all at +4°C. Supernatants were carefully removed by wiping the tube walls with cotton swabs to prevent the contamination of the EV pellet with any supernatant metabolites. Platelets were removed from 50 ml of the concentrate by four consecutive centrifugations at 1600 g for 20 min at RT without break, every time omitting the two ml overlaying the cell pellet to prevent transfer of platelets into the supernatant. The number of platelets after the last centrifugation was analyzed with Beckmann Coulter counter T-540 to be less than 2 x 10⁶/ml. The supernatant (40 ml) was diluted with PBS 1:2 and centrifuged 110 000 g for 1 h 15 min at +4ºC with type 50.2 Ti rotor (Beckman Coulter). The supernatant was removed and each pellet (from 10 ml of the platelet concentrate) was suspended to 16 ml PBS and re-centrifuged. Supernatant was carefully removed. All the EV samples were suspended in PBS and stored in protein LowBind tubes (Eppendorf) at -80°C. Platelets for metabolomics (10 x 106 platelets per sample from the same concentrate used for EV isolation) were pelleted at 1600 g for 20 min at RT, and washed with PBS followed by quick rinsing of the pellet with water. Pellets were immediately frozen with liquid nitrogen and stored at -80°C.
Western Blotting
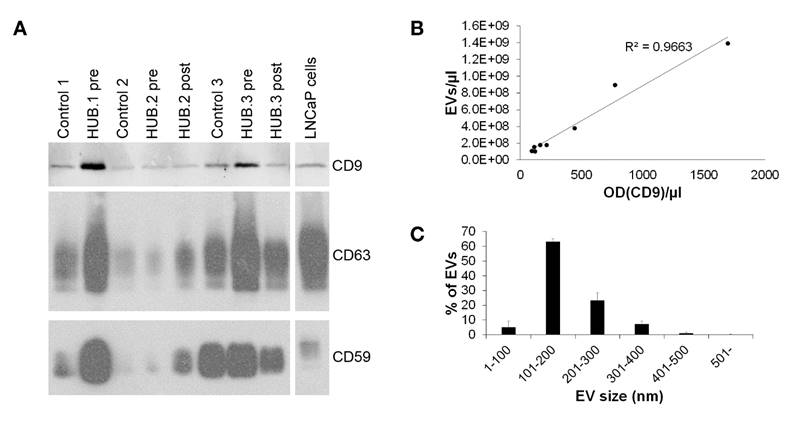
Western blotting was performed as described [27]. For detection, x-ray film (Ultra Cruz™ Autoradiography Film, Santa Cruz Biotechnology (SC), Dallas, TX, USA) or, alternatively, Odyssey infrared scanner (LI-COR® Biosciences Ltd., Cambridge, UK) were used. To quantify the EVs for the metabolomics study (Fig. 2A), EVs from equal volumes of urine were loaded to gels. The CD9 bands were quantified by Image J [28]. Proteins from samples depicting the purification process (Fig. 1G, 1800 g and 8000 g urine supernatant and filtrate samples), were extracted with ProteoSpin™ Urine Protein Concentration Micro Kit (Norgen Biotek Corp., Ontario, Canada). Protein concentrations were measured with BradfordUltra reagent (Expedeon) and 2 µg of protein loaded to gels from all purification process samples (Fig. 1G) and 20 µg of LNCaP cell lysate control. Platelet EVs and platelets from equal volumes of metabolomics samples were loaded to gels (Fig. S1).
Characterization of the urinary EV samples applied to metabolomics by western blotting and Nanoparticle tracking analysis. A. Western blotting of the urinary EV samples in the metabolomics study with EV-markers demonstrated significant variation in EV quantity from different donors. Two out of three samples from prostate cancer patients of Helsinki Urological Biobank project (HUB.1-3) obtained before prostatectomy (pre) contained more EVs than the samples from the same patients after prostatectomy (post) or from healthy controls. B. The urinary EV concentrations in these samples measured by nanoparticle tracking analysis and by quantification of CD9 band optical density (OD) from the western blot correlated well. C. Size distribution of the urinary EVs applied to metabolomics was obtained by nanoparticle tracking analysis showing that the EV sizes did not vary much between samples (N = 8).
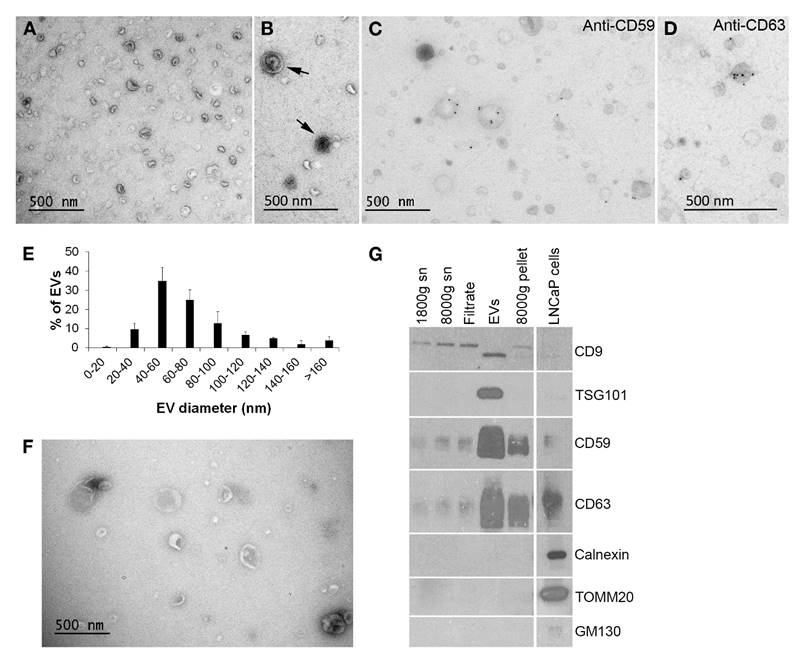
Validation of EV sample quality. A. Electron microscopy (EM) shows typical round morphology and size range of urinary EVs. B. Urinary EVs with multiple membrane layers (arrows) were seen occasionally. C.-D. Immuno-labelling of EV-markers CD59 and CD63 showed their presence on the urinary EVs by EM. E. The size distribution of the urinary EVs in the EM images indicated that most of the EVs were small, < 100 nm in diameter (N = 3, total of 425 EVs). F. Platelet EVs showed typical morphology and somewhat larger size than urinary EVs by EM. G. Western blotting of the samples from each step of the urinary EV isolation confirmed the enrichment of CD9, TSG101, CD59 and CD63 as well as the absence of cellular organelle proteins calnexin, TOMM20 and GM130 in the EVs. Equal quantities of protein were loaded from all urine-derived samples. Supernatant (sn).
Nanoparticle Tracking Analysis
Particle number and size distribution in the EV samples was analyzed with nanoparticle tracking analysis (NTA) instrument LM14C equipped with violet (405 nm, 70 mW) laser (Malvern Instruments Ltd., Malvern, UK) and sCMOS camera (Hamamatsu photonics K.K., Hamamatsu, Japan). Settings for uEV data acquisition by Nanosight software v2.3 (Malvern Instruments Ltd.) were: ambient temperature, camera level 12, autosettings off, polydispersity medium and reproducibility high with 40-100 particles per image. The used settings for pEVs were controlled temperature of 22.0ºC and camera level 14 using Nanosight software 3.0 (Malvern Instruments Ltd.). EV samples were diluted with filtered (0.2 µm) PBS and three videos of 90 seconds were recorded from samples, mixing the samples manually between measurements. Data were analyzed with NanoSight NTA 3.0 software using detection threshold 5 and gain 10.
Electron Microscopy
Electron microcopy (EM) samples were prepared as described [27]. Briefly, EVs were loaded on 200 mesh grids, fixed with 2% PFA, stained with 2% neutral uranyl acetate, embedded in methyl cellulose uranyl acetate mixture (1.8/0.4%) and viewed with Tecnai 12 (FEI Company, Eindhoven, The Netherland) at 80 kV. For immuno-EM, samples were blocked and antibodies diluted with 0.5% and 0.1% BSA, respectively, in 0.1 M NaPO4 buffer (pH 7.0). Samples were incubated with primary antibodies (CD63, CD59 as in Puhka et al. [27]) and 10 nm gold-conjugated anti-mouse secondary antibodies (BBI Solutions, Cardiff, UK) for 30-60 min at RT and washed extensively before staining and embedding. To quantify the size distribution of EVs, EV profiles were measured from randomly sampled images (maximum diameter, 100-400 profiles from each sample) of three independently processed uEV samples derived from different healthy donors and from a pEV sample derived from pooled platelets from four healthy donors.
Ultra-Performance Liquid Chromatography-Tandem Mass Spectrometry
EVs from 10-53 ml of urine and 5 ml of platelet concentrate (109-1011 particles), 100 µl urine filtrate (from 1.2 µm filtration step of EV isolation) and 1 x 10⁷ platelets were applied to analysis of 102 (uEVs and urine) or 111 (pEVs and platelets) polar metabolites (Table S2) using ultra performance liquid chromatography-tandem mass spectrometer (UPLC-MS-MS, ACQUITY UPLC® with Xevo TQ-S - tandem quadrupole mass spectrometer, Waters) as previously described [29]. Detailed methods are also found under Supplementary methods. A peak response giving signal to noise (S/N) ratio of < 3 was considered below the limit of detection. For calculation of average concentrations, concentrations below this limit were assigned as zeros. Lower limit of quantification was defined as the lowest concentration on calibration curve corresponding to S/N of > 6.
Calculations, Database Searches and Data Analysis
EV volumes were calculated using the NTA data i.e., using the EV diameters for calculating the sphere volumes in each size class, which were multiplied by the particle numbers in each size class. Subsequently, the EV volumes of all size classes were summed to yield the total volume of the EVs applied to the metabolomics analysis. Metabolite concentrations inside the EVs were calculated by dividing the mole amount of metabolites with the total volumes of EVs in the metabolomics samples. The metabolite concentrations of platelets were calculated similarly using the average platelet volume of 8 fl (normal range 7.2-11.7 fl in Demirin et al., 2011 [30]) and 1 x 10⁷ platelets/sample. The contribution of uEV-derived metabolites to urine was calculated by dividing the mole amount of individual metabolites in the control uEV samples with the urine volume from which the EVs were isolated and comparing this concentration value to the concentration of the same metabolites measured from the urine filtrates. Loss of EVs during isolation was not taken into account in these calculations. Human Metabolome Database (HMDB) and EVpedia (accessed 12.8.2016) were searched for reported EV-resident enzymes and transporters linked to the common EV metabolites. For assigning the subcellular localizations of the common EV metabolites, HMDB and Small Molecule Pathway Database (SMPDB) were used. The statistics module and metabolite set enrichment analysis through over representation analysis in the Metaboanalyst 3.0 software were employed to analyze the metabolomics data. The MS-compound panel of 102 metabolites (Table S2) was used as a reference library and pathways with ≥ 2 metabolites present in all control samples of either EV type were included. For comparisons of population means, the input data was log-transformed, normalized to the EV-derived parameters or to concentrations of other metabolites from the same panel as indicated. When comparing two population means, differences between the groups were tested for statistical significance with non-parametric Wilcoxon rank test or student´s t-test with equal variance. For the comparisons of three population means, one-way ANOVA with Fischer's LSD as the post-hoc analysis was used.
Results
Isolation and Validation of EV Samples for Metabolomics Analysis
We isolated EVs with differential centrifugation from 10-53 ml of urine or 5 ml of platelet concentrate to include the EV populations with both exosomes and larger EVs (Fig. 1 and 2). Ultracentrifugation supernatants were carefully removed before and after the washing step to ascertain that the EV pellets would not contain any extra-vesicular urine or platelet concentrate supernatant-derived metabolites.
To validate the quality of the EV isolation for the metabolomics study, EV samples were subjected to EM and western blotting (Fig. 1). Most uEVs detected with the EM were spheroids with a single membrane, but also some multi-membrane-layer EVs were found (Fig. 1A-D). Staining intensity of the EV membranes and contents varied. No mitochondria were observed. Immuno-EM with CD59- and CD63-antibodies showed a specific membrane staining (Fig. 1C and D). The size distribution analysis by EM showed that 83% of uEVs were under 100 nm in diameter (Fig. 1E) and the average diameter was 72 ± 39 nm (N = 425). Platelet EVs were morphologically similar but larger than uEVs (Fig. 1F): 61% of pEVs were under 100 nm in diameter (Fig. S1A) and the average diameter was 136 ± 164 nm (N = 364). The proportion of > 200 nm EVs was 18% for pEVs vs. 1% for uEVs.
Western blotting showed that the uEV samples became enriched of typical uEV-markers CD9, CD63, CD59 and TSG101 compared to the samples from the earlier steps of the purification protocol (Fig. 1G). The same blots were also probed for cell organelle markers (calnexin, TOMM20 and GM130) demonstrating the absence of cellular debris from the uEVs. Similarly, western blotting of pEVs showed the presence of CD63 and TSG101 and minute amounts of CD9, as well as the absence of the mitochondrial marker TOMM20 (Fig. S1B).
We also used western blotting and NTA to validate the individual uEV samples applied to the metabolomics i.e. the samples from three healthy controls and three Pca patients (HUB.1-3) from whom samples were obtained before and after prostatectomy (Table 1). However, all of the post-prostatectomy sample of HUB.1, where only 10 ml of urine was available for EV isolation, was applied to metabolomics and not analyzed by NTA and western blotting in order to save the EV material and increase the probability of successful metabolomics. Western blotting of CD9, CD63 and CD59 gave similar staining pattern, with the most intensive staining observed in HUB.1 and HUB.3 pre-prostatectomy samples (Fig. 2A). The same samples also contained the highest EV concentrations by NTA (Table 1). Both the western blotting and NTA suggested highly varying concentrations of uEVs in the urine samples from different donors: the levels ranged one order of magnitude from 2.1 x 10⁸ to 2.6 x 10⁹ per ml of urine. Quantified values of CD9 from the western blotting correlated well with the NTA measurements yielding an R2 value of 0.966 (Fig. 2B). The size distributions of uEVs in the individual samples by NTA did not vary much (Fig. 2C). All samples contained over 85% (87-94%) of small, < 300 nm, EVs with a mean diameter of 182 ± 10 nm. NTA of the pEV samples applied to metabolomics analysis showed 1.7 x 10¹⁰ EVs per ml of platelet concentrate and a mean diameter of 152 ± 6 nm (Fig. S1C). In conclusion, the quality control showed that our EV preparations contained EVs of sufficient purity in quantities that could be measured by NTA or by CD9 optical density.
Approximately 1010 EVs are Sufficient for Targeted MS-Metabolomics Analysis
We began our studies without a prior knowledge of the EV quantity required for the metabolite analyses. Because the EVs are small and we had limited amounts of patient samples, we presumed that a high sensitivity technique was needed for EV metabolomics. We thus chose an UPLC-MS-MS metabolite platform targeting a panel of 102 metabolites from uEVs, and the same panel with nine additional metabolites (total 111) from pEVs (Table S2). These panels contained metabolites that could be measured with high sensitivity in reference to standards. Since the panels covered a range of biological compound classes, they served our purpose of exploring the metabolome of the EVs well. To determine the number of EVs required for metabolomics, we first analyzed serially diluted samples of pEVs. The majority of the analytes were above the detection limit when 1 x 10¹⁰ EVs were analyzed, but with 1 x 10⁹ EVs, most metabolites remained below the detection limit (data not shown). The magnitude of the detected metabolite concentrations was comparable between the different UPLC-MS-MS runs when normalization of metabolite quantities was based on the EV volume (see Materials and Methods).
Based on this pilot study, we used 1 x 10¹⁰ of the pooled pEVs for the metabolomics study. For uEVs, where the maximum amount of the available clinical sample material was always used, all samples contained approximately 1 x 10¹⁰ EVs (Table 1). Furthermore, the number of metabolites above the detection limit in the uEV samples did not depend on the amount of urine used for the EV isolation nor on the number of EVs obtained (Table 1). This suggested that all the uEV samples had sufficient number of EVs for metabolite analysis.
In the uEV samples, 40-82 (39-80%) out of 102 metabolites were above the detection limit and 32-55 (31-54%) were above the quantification limit (Table 1). There was no significant difference in the number of distinct metabolites detected between the study groups (healthy control, pre- or post-prostatectomy). In the pEV sample pool, 62 (56%) out of 111 metabolites were detected and 41 (37%) were above the quantification limit.
Main Metabolite Groups, Pathways and Concentrations in Urinary and Platelet EVs
To identify typical EV-enriched metabolites, we first compared the profiles of the healthy control uEVs with the pEVs. Including 102 metabolites analyzed in both EV types, we found altogether 55 metabolites that could be quantified in the control uEVs, pEVs or both (Fig. 3A). The control uEVs contained 41 and pEVs 35 metabolites above the quantification limit, out of which 21 were equally present in both EV types, thus giving an > 50% overlap of each metabolite profile with the other (Fig. 3). Poorly detected (not present in all samples of either EV type) or totally missing metabolites also showed an > 70% overlap between uEVs and pEVs (data not shown). Only 11 metabolites were specific to the uEVs and 5 to the pEVs (Fig. 3A).
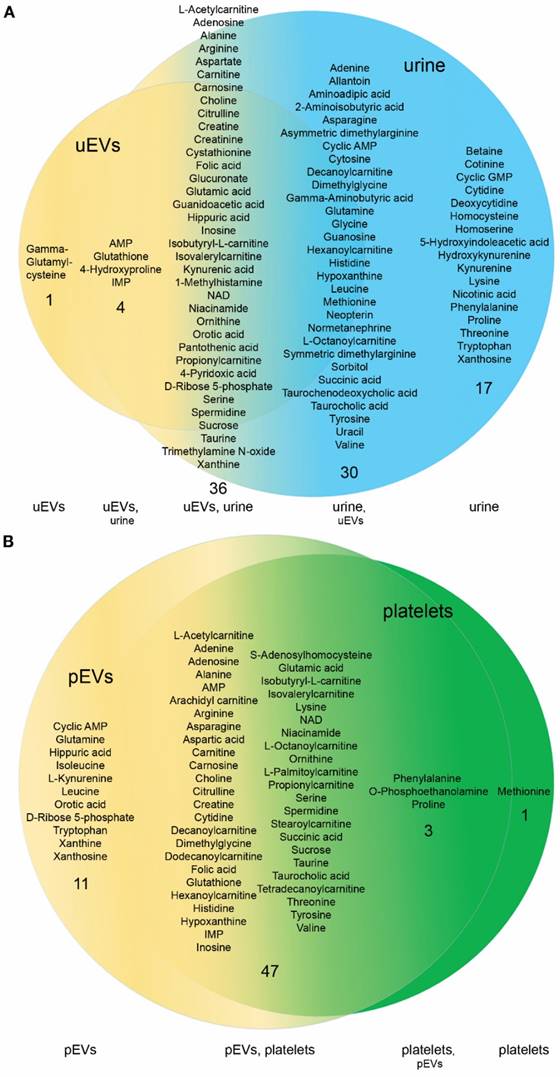
Comparison of the metabolite content and pathways between urinary EVs and platelet EVs. A. Venn-diagram of the metabolites above the quantification limit in urinary and platelet EVs showed an > 50% overlap between the two EV types (derived from healthy individuals). The two EV types contained both EV-type specific (11 and 5 in urinary and platelet EVs, respectively) and common metabolites (21), as well as metabolites that were above the quantification limit in all samples of one EV type, but below this limit in one or more samples of the other (9 in each). Both EV types contained metabolites belonging to five different categories (highlighted with a color code in the image). B. Metabolite set enrichment analysis depicted the metabolic pathways that showed hits in both EV types (number of hits shown) and the total number of metabolites included in the metabolite panel from these pathways. platelet EVs (pEVs), urinary EVs (uEVs). “Intracellular signaling via adenosine…” continues with “receptor A2A/B and adenosine”.
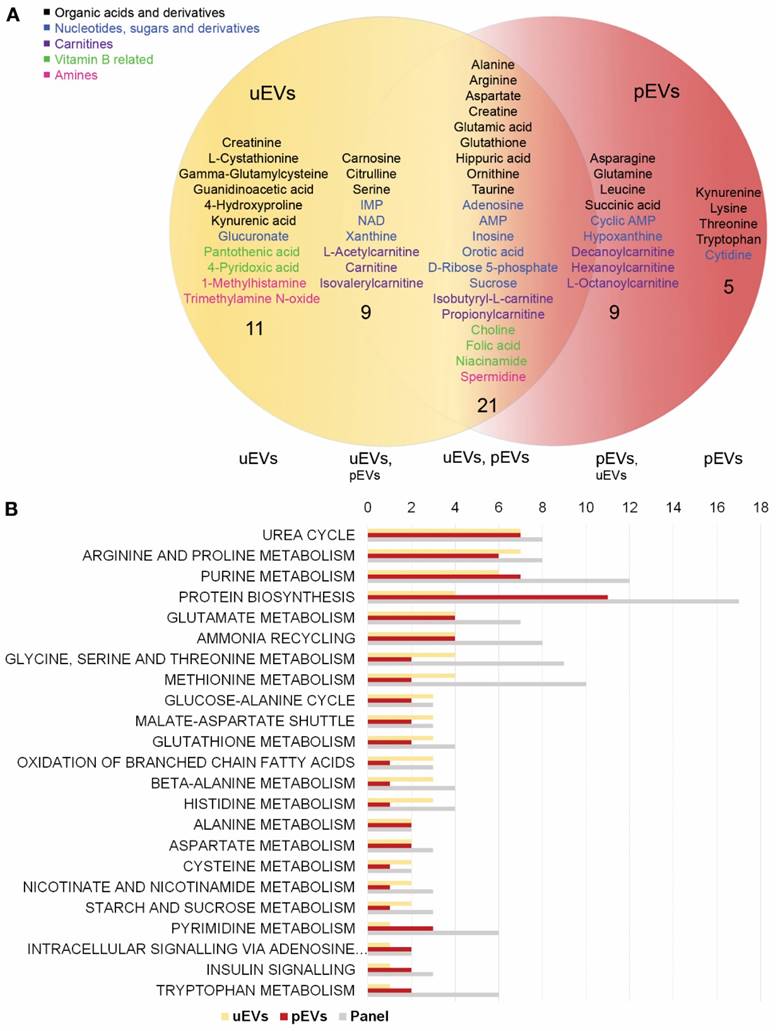
The commonly detected metabolites in the EV samples could be divided into five classes: 1) organic acids and their derivatives, 2) nucleotides, sugars and derivatives, 3) carnitines, 4) vitamin B/related metabolites and 5) amines (Fig. 3A). Organic acids, comprised particularly of amino acids, represented the largest individual group, but also purine metabolites in the nucleotide group, as well as fatty acyl carnitines in the carnitine group were common. To clarify, whether the EV metabolites in these groups were derived from particular metabolic pathways, we analyzed the lists of compounds quantified in all uEVs (healthy control samples) or pEVs separately with the metabolite set enrichment analysis in the Metaboanalyst using our MS-compound panel as a reference library [31]. When arranged according to the number of hits in the pathways, particularly urea cycle, arginine/proline and purine pathways, but also pathways for other amino acids and protein biosynthesis showed hits in both EV types (Fig. 3B). However, all members of these pathways present in the analysis panel were not in the quantifiable range in the EVs.
We next investigated which metabolites were most concentrated in the EVs. In order to get an approximation of the intra-EV concentration range, we calculated the concentrations of the metabolites in the EVs by dividing the mole amount of metabolites with the total EV volumes in the samples (Table S3). The total volume of EVs ranged between 60-830 nl within the uEV preparations and was 372 nl in the pEVs. These calculations indicated that the intra-EV concentrations of the metabolites varied from sub micromolar up to > 10 mM in both uEVs and pEVs (Table S3). EVs from both sources were rich in D-Ribose 5-phosphate, the most abundant metabolite in pEVs and 3rd most abundant in uEVs, and other metabolites involved in nucleotide metabolism in mostly > 10 µM to mM range. Amino acid ornithine, with the highest concentration of metabolites in the uEVs and 15th highest in pEVs, and several other members of the urea cycle were present in > 50 µM to mM concentrations in the EVs. Ornithine serves also as a precursor for the biosynthesis of spermidine, a multifunctional polyamine that stabilizes nucleic acids and membranes, present in > 10 µM quantities in both EV types. In conclusion, our data indicated that the metabolite profiles of EVs from different sources contained similarities, but also distinct differences. The EVs carried a subset of metabolites from several pathways, with high intra-EV concentrations of some specific metabolites.
Metabolite Profiles of EVs and Matched EV Source Materials Show Overlap and Differences
To confirm that we truly analyzed the metabolites within EVs and not in urine or platelets, we included the original matched urine samples (i.e. urine filtrate from the filtration step of the EV isolation), and platelet samples in the UPLC-MS-MS analysis. We found more metabolites in the urines than in the uEVs: 90-97 (88-95%) and 84-88 (82-86%) out of the 102 metabolites were above the detection and quantification limit in the urines, respectively (Table 1). Generally, the metabolite concentrations measured in this study (Table S4) agreed well with the concentrations reported in the HMDB for urine samples. Surprisingly, fewer metabolites reached the detection limit from platelets (51) than from pEVs (62).
In order to get an insight of how much the metabolite profiles of EV and their matched source materials differ, we focused on the metabolites above the detection limit in control samples. Out of the 83 metabolites above the detection limit in all three control urine samples, 36 (43%) were also detected in all control uEV samples (Fig. 4A). Only 6 metabolites were below the detection limit in the control urine samples including gamma-glutamylcysteine, a precursor of glutathione, which was found in all of the uEV samples. Since it was neither detected in pEVs or platelets, it was specific to uEVs. The uEVs, on the other hand, lacked 27 metabolites, 17 of which were present in the urines. Notably, among these, the average concentration of betaine in the urine was as high as 196 ± 86 µM. This ranks it the 13th highest in the list of common urine metabolites (Table S4).
Comparison of the metabolite content in the EVs and their source materials. A. Venn-diagram of the metabolites above the detection limit in all urinary EVs (uEVs) from controls and the matched original urine samples showed overlap, but also sample type specific metabolites. Urine contained more unique compounds (17) than uEVs (1) indicating efficient purification of these from the uEV samples. B. Although platelet EVs (pEVs) and platelets had a highly overlapping metabolite content, the pEVs contained more unique metabolites (11) than platelets (1).
Platelets and pEVs showed a high overlap of the metabolite profiles (Fig. 4B). Out of 51 metabolites detected in all platelet samples, 47 (92%) were also detected in all pEVs. Interestingly, on the contrary to uEVs vs. urines, the pEVs contained many (11) metabolites that were not detected in platelets, whereas platelets contained just one compound, L-methionine, which was not detected in pEVs. Notably, the intra-EV concentration of D-ribose 5-phosphate was as high as 68.8 mM, while it was not detected from platelets at all.
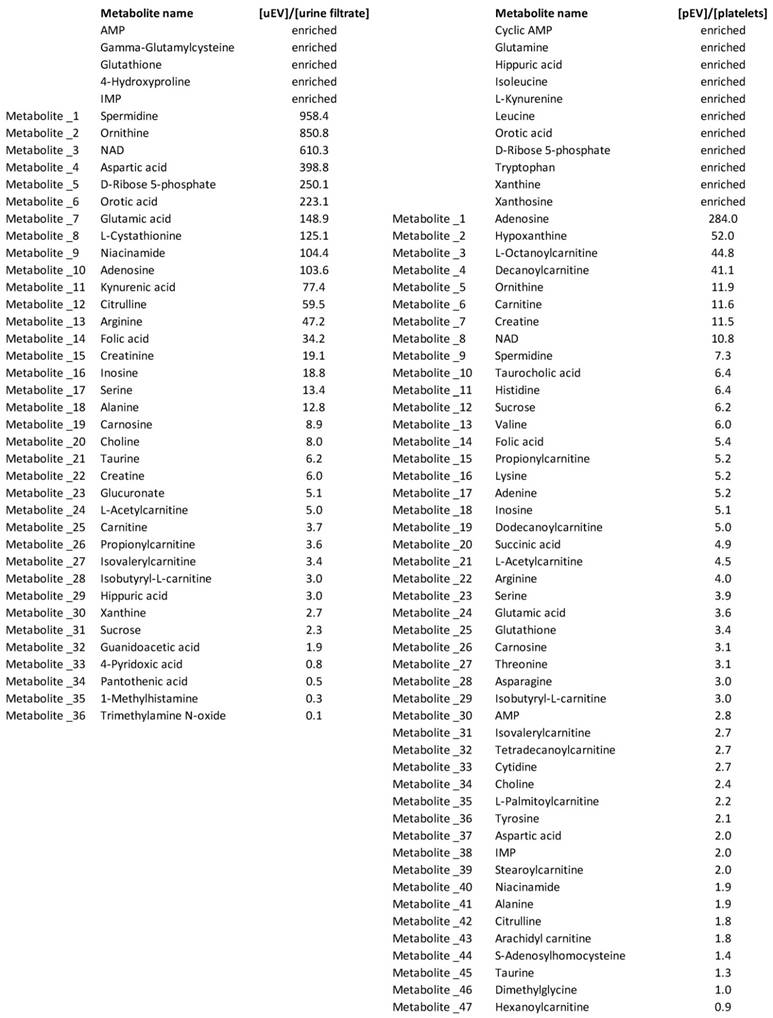
To further ascertain that we analyzed EV-derived metabolites, we calculated the enrichment of metabolites inside the control uEVs and pEVs vs. their source samples (Table 2). Those metabolites that were present in all the EV samples, but not in all the source material samples, were assigned as enriched (enrichment up to > 500 x for those remaining sample pairs, where calculations could be made). Together, the nucleotide pathway metabolites were highly enriched: in addition to IMP and AMP (enriched), NAD+ (> 600 x) and D-ribose 5-phosphate (> 250 x), orotic acid (> 200 x) as well as niacinamide and adenosine (> 100 x) were enriched in the uEVs over urine. Two spermidine pathway metabolites, ornithine and spermidine, were enriched over 800-fold in the uEVs relative to urine. Finally, gamma-glutamylcysteine, glutathione and glutamic acid (> 100 x) indicated an enrichment of the glutathione pathway metabolites in the uEVs over urine. In pEVs vs. platelets, the highest enrichment (> 3-250 x) was seen in nucleotide, amino acid, carnitine and spermidine pathway metabolites. For example, D-Ribose 5-phosphate and orotic acid were only detected in pEVs, and adenosine (> 250 x), hypoxanthine (> 50 x) and NAD+ (> 10 x) were clearly enriched in the pEVs over platelets. Six carnitines were enriched over 3-fold in pEVs, while from the amino acids ornithine, histidine and valine were among the most enriched.
Enrichment of metabolites in the EVs vs. the matched EV source materials. The intra-EV concentrations of metabolites above the detection limit in all the control samples were compared to the concentrations in the original matched urine samples or platelets. This showed that some specific metabolites were enriched into EVs in high concentrations. Metabolites that were found in all the EV samples, but not in one or more of the source material samples were assigned as enriched directly. Platelet EVs (pEVs), urinary EVs (uEVs).
Finally, we addressed the question, what was the contribution of uEV-derived metabolites to the total concentration of those metabolites observed in urine. For this, we calculated the molar amount of metabolites derived from the uEVs vs. urine individually. Apart from the metabolites that were not detected in one or more urine samples, the contribution of EVs to the urine metabolites was < 1% (data not shown). In conclusion, the metabolite profiles of the isolated EVs and the matched source materials were overlapping, but showed still clear qualitative and quantitative differences indicating that we successfully purified EVs and profiled their intra-EV metabolites.
EVs Contain a Selection of Cytoplasmic Metabolites, which Match with the Reported Metabolic Enzymes and Transport Proteins in EVs
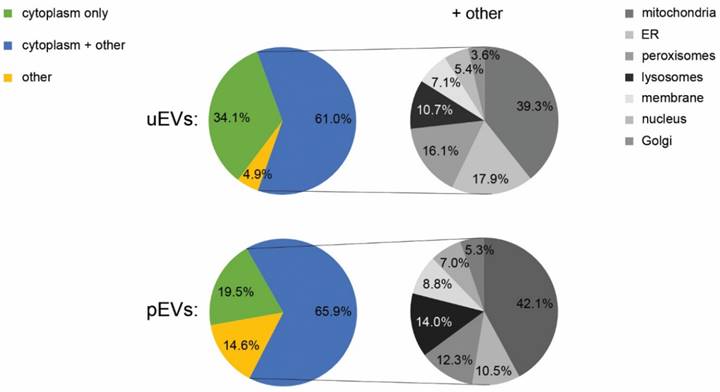
EVs are generated via budding of the plasma membrane or multi-vesicular bodies, which could potentially create a miniature copy of the cytosolic metabolite contents of the secreting cell. To clarify, whether this was indeed the case, we searched for the subcellular localization of the EV metabolites from the HMDB and the SMPDB. The analysis indicated that 95% and 85% of the metabolites in the quantifiable range had a cytoplasmic origin in the uEVs and pEVs, respectively (Fig. 5). However, over 60% of these metabolites could also be found in other subcellular localizations, especially in the mitochondria. Interestingly, cytosolic localization was also common for the metabolites totally missing from or poorly detected in the EVs suggesting that the metabolite content of EVs is not entirely similar to the cytoplasmic metabolome of cells.
Subcellular localization of the EV metabolites. Database searches using Human Metabolome Database and Small Molecule Pathway Database indicated that the subcellular localization of the metabolites found above quantification limit in the urinary and platelet EVs was mainly cytosolic. Many of the EV metabolites were assigned, in addition to cytosol, to other subcellular locations (the charts marked “+ other”) including mitochondria, ER, peroxisomes and lysosomes. Endoplasmic reticulum (ER), platelet EVs (pEVs), urinary EVs (uEVs).
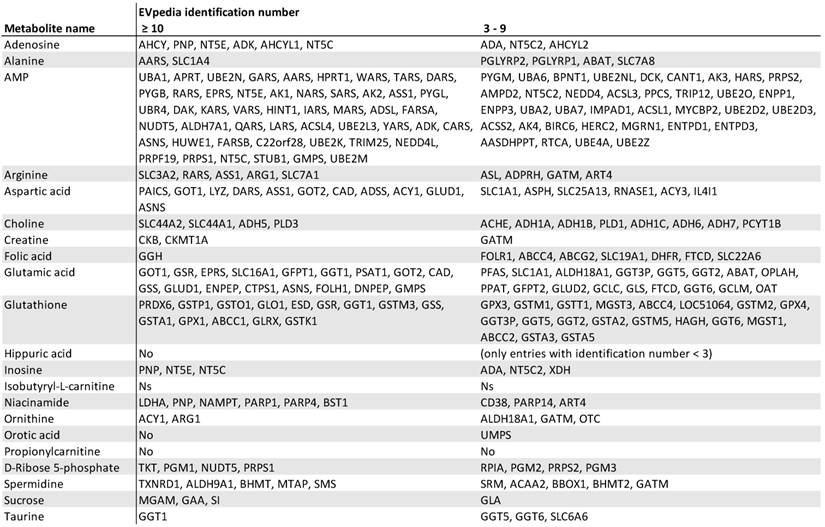
The presence of a selection of cytoplasmic metabolites led us to think that the EV metabolome could be modified by the metabolic enzymes in the EVs. We thus focused on the 21 common compounds found in all control uEV and pEV samples and searched for proteins linked to their metabolism or transport in the HMDB and EVpedia (Table 3). The list of enzymes and transporters identified in three or more EV-studies in EVpedia indicated that EVs contain an abundant selection of proteins linked to most of the 21 compounds. Particularly, many EV-proteins associated with AMP, glutamic acid, glutathione and aspartate metabolism. The result thus suggests that these metabolites are common in many EV types and could be transported or metabolized by the EV-resident proteins.
Database analysis of enzymes and transporters associated with the common metabolites in the urinary and platelet EVs. A large number of enzymes and transporters in the Human Metabolome Database that linked to the 21 common metabolites in the urinary and platelet EVs resided in EVs according to the EVpedia. The EVpedia identification number shows the number of studies confirming the presence of the proteins in the EVs. Proteins not found from EVpedia (No), proteins not specified in the Human Metabolome Database (Ns).
Changes in EV Metabolite Contents in Prostate Cancer — Impact of the Normalization Methods
The final question in our study was, whether the uEV-metabolites derived from typical biobank samples had the potential to reveal metabolite changes related to Pca. The patients enrolled in this initial study and their clinical characteristics are given in Tables 1 and S1. Patients HUB.1 and HUB.2 had a Gleason score (GS) 7 cancer with no apparent metastasis and patient HUB.3 had a GS 9 cancer that had spread to a lymph node. Both the tumor volume and the PSA concentration were highest in the GS 9 patient, whose PSA also remained high after prostatectomy. Here, we focused on the metabolites that were altered in all pre-prostatectomy cancer samples relative to the healthy controls and the post-prostatectomy samples, where the prostate-derived tumor-EV load in urine could be presumed to be zero or significantly reduced. To detect a difference in the metabolite levels between samples, we needed a data normalization method that would take into account the varying amounts of samples available in the study. Since no standardized normalization method for the metabolomics data from the EVs existed, we tested several different options: normalization to EV volume, EV number, CD9 optical density, other metabolites, urine volume or urine creatinine.
Normalization to EV volume, number and CD9 optical density, which are all measures of EV quantity, yielded similar results (Fig. 6A, normalization to CD9 shown, Fig. S2). We found four metabolites that had lower levels in the patient uEV samples before prostatectomy than in the control uEV samples and after prostatectomy (the EV or CD9 quantity of the post-prostatectomy sample of HUB.1 was not analyzed and this sample was therefore excluded here). These metabolites were adenosine, glucuronate, isobutyryl-L-carnitine, and D-ribose 5-phosphate. The levels of these metabolites in the pre-prostatectomy samples were 2.5-26.6-fold lower as compared to the combined group of post-prostatectomy and control samples (p < 0.05 for each comparison). Glucuronate showed the largest difference, with over 22-fold lower levels in pre-prostatectomy samples than in the other samples, with all three normalization methods. In addition to the four metabolites, the pre-prostatectomy uEV samples showed 2.3-22.8-fold lower levels of 1-methylhistamine, creatine, glutathione, propionylcarnitine, isovalerylcarnitine and NAD+ as compared to controls and post-prostatectomy samples when normalized to one or two EV-derived factors (all p < 0.05, data not shown).
Most significant changes in the urinary EV metabolites in prostate cancer. A. Metabolite concentrations in the individual urinary EV samples were normalized to the CD9 optical density (OD) determined by western blotting, an EV-derived parameter. The analysis indicated lower levels of four metabolites in the pre-prostatectomy samples (pre) in comparison to post-prostatectomy (post) and healthy control samples. Pre- and post-prostatectomy samples from the same patients (HUB. 1-3) are connected with lines. B. Ratios between two metabolites indicated lower levels of glucuronate, isobutyryl-L-carnitine and D-ribose 5-phosphate in the pre-prostatectomy samples as in A, but also changes in other metabolites. Statistical significance is indicated for the comparisons of pre-prostatectomy group to control and post-prostatectomy groups separately (small brackets) or to the combined control and post-prostatectomy group (large brackets). p < 0.05 (*), p < 0.01 (**).
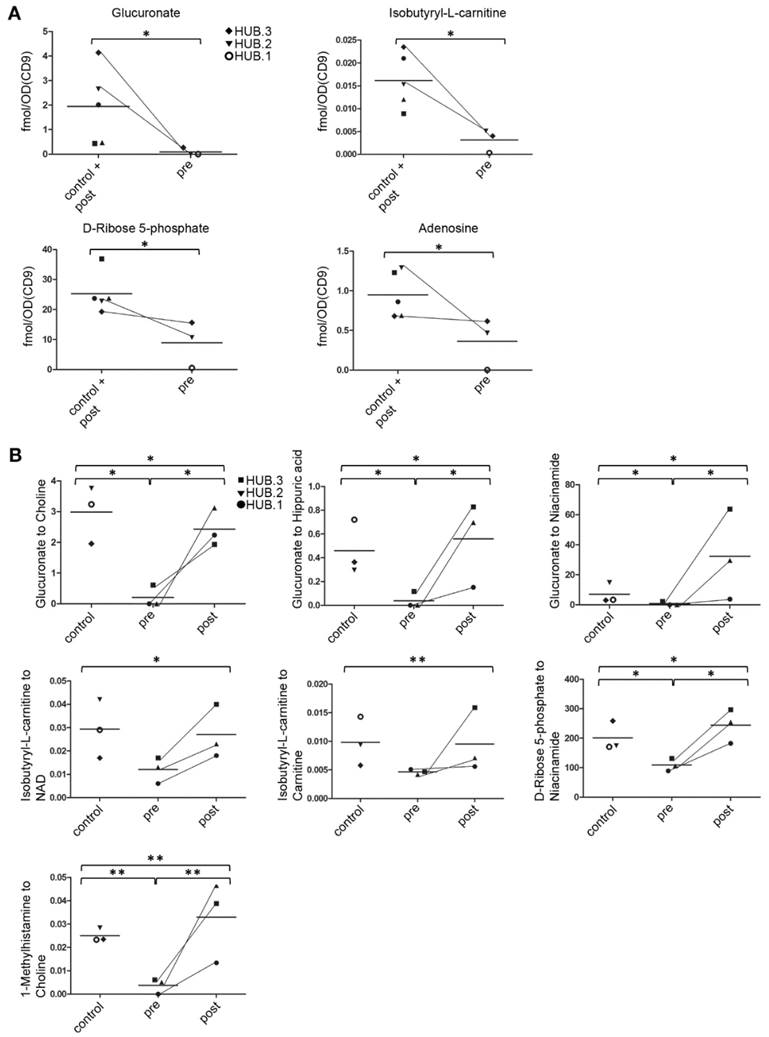
Normalization to other metabolites was based on the idea that the ratios of individual metabolites might change relative to each other in cancer vs. other groups reflecting the changed activity of metabolic pathways. Therefore, the metabolite concentrations were systematically normalized to each of the 28 metabolites that were detected in all of the uEV samples. Most significant alterations are depicted in Figure 6B. Three of the previously identified metabolites showing low levels in the pre-prostatectomy uEV samples were also low here. First, the ratios of glucuronate to choline, hippuric acid and niacinamide were up to 26-fold lower in the pre-prostatectomy samples than in the other groups separately or combined (all p < 0.05). Second, the ratio of isobutyryl-L-carnitine to NAD+ or carnitine in the pre-prostatectomy samples was > 2.0-fold lower than in the other groups combined (p < 0.05 and 0.01, respectively). Third, D-ribose 5-phosphate to niacinamide ratio was equally lowered in pre-prostatectomy samples > 2.0-fold compared to other groups separately or combined (all p < 0.05). In addition, we found a lowered ratio of 1-methylhistamine to choline (> 6.6 x) in the pre-prostatectomy samples compared to all the other groups (all p < 0.01). Normalization to choline revealed that the levels of several other metabolites were low in the pre-prostatectomy samples as well, with the ratios of guanidoacetic acid (> 7.8 x), taurine (> 3.5 x) and isovalerylcarnitine (> 3.7 x) to choline reaching statistical significance when compared to some of the other groups (all p < 0.05, data not shown).
In contrast to the EV-derived factor and ratio normalizations, normalization to urine volume or creatinine did not produce any systematic differences that would distinguish the pre-prostatectomy uEV samples from the other study groups (data not shown). Our data thus suggests that normalization to EV-derived parameters or analysis of metabolite ratios would have the best potential to reveal cancer-related alterations in the EV metabolite profiles.
Cancer-Related Changes in the Urine Metabolites Differ from the Changes in the Urinary EV Samples
In addition to the uEV metabolomics, we assessed Pca-related changes in the matching urine samples. Changes in the pre-prostatectomy urine samples were different from those detected from the uEVs. When normalized to the urine creatinine content (measured from unpurified urine), glycine, histidine, proline and aminoisobutyric acid were lower in the pre-prostatectomy samples as compared to the combined group of control and post-prostatectomy samples (2.5-3.2 x, p < 0.05). When we normalized the results to the creatinine levels that were measured in the urine samples as part of the metabolite panel, histidine, aminoisobutyric acid and valine appeared lower in the pre-prostatectomy samples (2.0-3.4 x, p < 0.05). In conclusion, cancer-related changes in the uEV metabolites were larger and different than the ones detected by conventional analysis of urine alone.
Discussion
Metabolomic analysis of EVs is a new field of research that holds potential to reveal the status of cellular metabolism in a non-invasive way. It could unravel biomarkers for various diseases on its own or complement current assays of proteins and nucleic acids within EVs. Our work on the metabolite profiles of urinary and platelet EVs offers several new insights into EV contents and technical aspects of profiling the EVs for future biomarker research.
Our data showed that the uEVs and pEVs had a common metabolic profile with amino acid, nucleotide, carnitine, vitamin B and amine metabolites. However, we also detected unique metabolites from each EV type, such as gamma-glutamyl-cysteine in the uEVs, which might be used to track the origin of the EVs. Most of the EV metabolites were derived from the cytosolic cellular pathways, fitting well with the current understanding of EV biogenesis, where portions of cytosol are engulfed within exosomes (via intraluminal vesicles) or microvesicles. Alternatively, metabolites might be specifically sorted into the EVs from cytosol or produced/altered within the EVs by enzymatic activity. In support of the latter, EVs are a rich source of metabolic enzymes [32, 33]. Also our analysis showed that the EVs did not contain all cytosolic metabolites or pathway members present in the analysis panel but rather a subset (Fig. 3B), which could be processed by numerous EV-residing enzymes/transporters (Table 3). Although our panel contained a good representation of metabolites from different metabolic pathways, it did not cover the whole metabolome and thus the analysis may have missed some pathways present in EVs. However, metabolic enzyme activity was further supported by the high local concentrations of some specific metabolites in the EVs over the cellular levels. For example, the comparison of the metabolite concentrations in the pEVs vs. platelets (Table 2) or the uEVs (Table S3) vs. cellular cytoplasmic concentrations reported in the HMDB [34] revealed an enormous (> 20 000-fold) enrichment of D-ribose 5-phosphate in both EV types over the cellular concentrations. As indicated by the enzyme comparison from databases (Table 3), for example transketolase (TKT) or D-ribose 5-phosphate isomerase (RPIA) from the pentose phosphate pathway are good candidates that could catalyze the production of D-ribose 5-phosphate within EVs. D-Ribose 5-phosphate is a central product of the cytosolic pentose phosphate pathway and a key precursor in the phosphoribosylpyrophosphate, NAD+ and nucleotide biosynthesis. Increasing its availability in cells leads to accelerated purine synthesis [35]. Incidentally, our data indicated the enrichment of other metabolites from the purine pathway in the EVs as well.
Another example of the EV-enriched metabolites were ornithine and spermidine. Their enrichment could be caused by the high activity of ornithine decarboxylase, the rate limiting enzyme of the polyamine synthesis pathway, and its regulators, in many secretory cell types [36]. Nevertheless, the question remains, whether EVs carry metabolites as a cargo in order to supply target cells with “off-the-shelf” metabolites as suggested by Zhao and others [8], or are some of them just passive products of intra-EV enzymatic activity. With the exception of some specific metabolites, our results suggest that the contribution of EV metabolites to the body fluid metabolome is generally low. Whether metabolites could be transferred to target cells more efficiently from EVs than from outside of EVs (in a soluble form), needs further study. Future explorations of the metabolomes of EVs vs. their source materials should help to identify other EV-enriched metabolites, the intra-cellular or communication pathways behind the enrichment and, finally, functions mediated by the EV-metabolites. Indeed, functions of the metabolites carried as EV cargo might be different than the functions of the same metabolites excreted in a soluble form. Nevertheless, the knowledge obtained here about metabolites enriched in the EVs over the source materials could already be used to direct future EV research or to redirect some of the metabolomics research on urine or platelets towards EVs.
Since more specific Pca biomarkers are needed to replace PSA and biopsies for non-invasive detection/monitoring of clinically significant Pca [37], another part of our study focused on developing methods for EV sample preparation and data normalization that are suitable for EV metabolomics and future biomarker discovery. In our experiments, as little as 9 x 10⁹ EVs or EVs from 10 ml of urine were enough to obtain a metabolite profile with the high-sensitivity targeted UPLC-MS-MS platform. In addition, our EV isolation protocol was able to remove several urine-derived soluble metabolites. For data normalization, we conducted an initial proof-of-concept study of Pca-derived changes in the uEV metabolite profiles. Normalization of the metabolomics data to the EV-derived parameters or by the ratio of metabolites led to the identification of metabolites with low levels in the pre-prostatectomy uEV samples. In contrast, traditional normalization parameters, creatinine and urine volume, did not reveal any systematic difference. Furthermore, the differences obtained with the uEV data were greater and different than the ones observed from the conventional analysis of the matched urine samples indicating the potential of EV-derived metabolomics for biomarker discovery. Future efforts could employ these techniques for EV biomarker discovery with a wider or more focused panel of metabolites and a higher number of patients.
The metabolic changes typical for Pca could explain the low levels of the metabolites in the pre-prostatectomy uEVs. First, glucuronate, with the largest difference between the pre- and post-prostatectomy or healthy control samples, contributes to the pentose phosphate pathway necessary for nucleic acid synthesis. Since cancer cells have a higher demand for nucleic acids than normal cells, the increased usage could lead to reduced concentration of glucuronate in the EVs. In support, D-ribose 5-phosphate and adenosine from the purine pathway, were also low in the pre-prostatectomy uEV samples. Alternatively, less free glucuronate may be present in the cancer samples due to its heavy incorporation into proteoglycans, such as hyaluronan, or to toxic/waste substances in the detox metabolism through glucuronidation. Remarkably, it has been shown that hyaluronan synthesis is increased in Pca, promoting spontaneous metastasis [38] and also coating cancer-derived EVs [39].
Second, the low levels of isobutyryl-L-carnitine in the pre-prostatectomy uEVs compared to post-prostatectomy and control uEVs suggests a balance shift towards beta-oxidation of fatty acids for energy production particularly, because the reduction was evident in relation to carnitine. Fatty-acids are combined with carnitines in order to enter mitochondria for beta-oxidation. More carnitine relative to isobutyryl-L-carnitine suggests that fatty acids are preferentially transported to mitochondria or used as building blocks for membrane biogenesis. Boost in beta-oxidation and lipid synthesis in Pca cells is supported by overexpression of several enzymes, such as AMACR, from these pathways [21].
Third, the ratio of many metabolites to choline was low in the pre-prostatectomy uEVs compared to other groups, which suggests increased choline levels. Choline has important roles in the development of Pca and is heavily incorporated into prostate tumors, which is exploited in choline-PET scans [17]. Increased choline has also been detected in metabolomics studies profiling Pca tissue relative to benign tissue [19, 40]. In agreement with our results, Giskeødegård and others [40] also reported reduced levels of several purine nucleotides, taurine and a non-significant reduction of isobutyryl-L-carnitine in the cancer tissue. However, contrary to our EV data, they found adenosine to be increased indicating that the correlation of the metabolomics results from EVs and tissues may not be entirely straightforward.
Some of our tested normalization factors such as CD9 optical density [41, 42] and choline concentration have been shown to increase in Pca. However, it is difficult to find a normalization factor that would not be affected by the changed metabolism in cancer or in other physiological conditions. From a different point of view, a ratio of decreasing and increasing parameters in cancer could be employed to detect changes in a more sensitive way than normalization to a stable parameter. Here, patient HUB.3, who had an aggressive cancer, had still high PSA in plasma after the prostatectomy, whereas our normalized uEV biomarker candidates returned towards the control level. This may be explained by the different amounts of primary tumor or metastatic site -derived material remaining in the blood and urine after prostatectomy. On the other hand, when normalized to uEV-parameters, the levels of D-ribose 5-phosphate and adenosine showed a relatively minor difference between the pre- and post-prostatectomy uEV samples of HUB.3 (Fig. 6A). Since these metabolites were generally present in high concentrations in the EVs and thus amenable to measurement from low sample amounts, one focus area of future Pca EV biomarker research could be the nucleic acid, particularly the purine pathway, metabolites.
In conclusion, to our knowledge this is the first study of small polar metabolites from urine and platelet-derived EVs, which provides insights into the amounts of required material, the enriched metabolites and their cellular origin as well as data normalization procedures. We also obtained a core profile of metabolites from EVs against which differing metabolites from various EV types can be compared. Finally, this study provided leads to the changes in the metabolite profiles of EVs associated with Pca. Our study can serve as a basis for further studies of EV metabolites in different body fluids or in a larger group of Pca patients. Together, our findings suggest that EV metabolomics could offer a new non-invasive and high-throughput tool to monitor Pca or other diseases.
Abbreviations
Acetonitrile: ACN; body-mass index: BMI; chromogranin A: CGA; electron microscopy: EM; extracellular vesicle: EV; formic acid: FA; gonadotropin releasing hormone: GnRh; Helsinki Urological Biobank: HUB; Human Metabolome Database: HMDB; nanoparticle tracking analysis: NTA; nicotinamide adenine dinucleotide: NAD; platelet extracellular vesicle: pEV; positron emission tomography: PET; prostate cancer: Pca; prostate specific antigen: PSA; prostate specific membrane antigen: PSMA; Small Molecule Pathway Database: SMPDB; ultra-performance liquid chromatography-tandem mass spectrometer: UPLC-MS-MS; urinary extracellular vesicle: uEV.
Supplementary Material
Supplementary figures and tables.
Acknowledgements
This research was supported by the Finnish Funding Agency for Technology and Innovation (TEKES) new generation biobanking grant 40294/11 (MP, TH), SalWe Research Program Personalized Diagnostics and Care (GET IT DONE, TEKES) grant 3986/31/2013 (MP, MT, SV, TH, MY, PS) and Academy of Finland program grant no. 287089 (PS, SV), The Medicinska Understödsföreningen Liv och Hälsa r.f. (PS) and Magnus Ehrnrooth Foundation (MT, PS). We thank Dr. Rienk Niewland and other ISEV members for valuable comments during ISEV poster session and Electron Microscopy Unit of the Institute of Biotechnology, University of Helsinki for providing laboratory facilities.
Competing Interests
The authors have declared that no competing interest exists.
References
1. McKiernan J, Donovan MJ, O'Neill V. et al. A Novel Urine Exosome Gene Expression Assay to Predict High-grade Prostate Cancer at Initial Biopsy. JAMA Oncol. 2016;2(7):882-889
2. Sheridan C. Exosome cancer diagnostic reaches market. Nat Biotechnol. 2016;34(4):359-360
3. Llorente A, Skotland T, Sylvanne T. et al. Molecular lipidomics of exosomes released by PC-3 prostate cancer cells. Biochim Biophys Acta. 2013;1831(7):1302-1309
4. Lazaro-Ibanez E, Sanz-Garcia A, Visakorpi T. et al. Different gDNA content in the subpopulations of prostate cancer extracellular vesicles: apoptotic bodies, microvesicles, and exosomes. Prostate. 2014;74(14):1379-1390
5. Thakur BK, Zhang H, Becker A. et al. Double-stranded DNA in exosomes: a novel biomarker in cancer detection. Cell Res. 2014;24(6):766-769
6. Saraswat M, Joenvaara S, Musante L. et al. N-linked (N-) glycoproteomics of urinary exosomes. Mol Cell Proteomics. 2015;14(2):263-276
7. Nyalwidhe JO, Betesh LR, Powers TW. et al. Increased bisecting N-acetylglucosamine and decreased branched chain glycans of N-linked glycoproteins in expressed prostatic secretions associated with prostate cancer progression. Proteomics Clin Appl. 2013;7(9-10):677-689
8. Zhao H, Yang L, Baddour J. et al. Tumor microenvironment derived exosomes pleiotropically modulate cancer cell metabolism. Elife. 2016;5:e10250
9. Palomo L, Casal E, Royo F. et al. Considerations for applying metabolomics to the analysis of extracellular vesicles. Front Immunol. 2014;5:651
10. Altadill T, Campoy I, Lanau L. et al. Enabling Metabolomics Based Biomarker Discovery Studies Using Molecular Phenotyping of Exosome-Like Vesicles. PLoS One. 2016;11(3):e0151339
11. Mayr M, Grainger D, Mayr U. et al. Proteomics, metabolomics, and immunomics on microparticles derived from human atherosclerotic plaques. Circ Cardiovasc Genet. 2009;2(4):379-388
12. Khan S, Jutzy JM, Valenzuela MM. et al. Plasma-derived exosomal survivin, a plausible biomarker for early detection of prostate cancer. PLoS One. 2012;7(10):e46737
13. Riches A, Campbell E, Borger E. et al. Regulation of exosome release from mammary epithelial and breast cancer cells - a new regulatory pathway. Eur J Cancer. 2014;50(5):1025-1034
14. Lane AN, Fan TW. Regulation of mammalian nucleotide metabolism and biosynthesis. Nucleic Acids Res. 2015;43(4):2466-2485
15. Chiarugi A, Dolle C, Felici R. et al. The NAD metabolome-a key determinant of cancer cell biology. Nat Rev Cancer. 2012;12(11):741-752
16. Trock BJ. Application of metabolomics to prostate cancer. Urol Oncol. 2011;29(5):572-581
17. Awwad HM, Geisel J, Obeid R. The role of choline in prostate cancer. Clin Biochem. 2012;45(18):1548-1553
18. Costello LC, Franklin RB. Concepts of citrate production and secretion by prostate. 1. Metabolic relationships. Prostate. 1991;18(1):25-46
19. McDunn JE, Li Z, Adam KP. et al. Metabolomic signatures of aggressive prostate cancer. Prostate. 2013;73(14):1547-1560
20. Thysell E, Surowiec I, Hornberg E. et al. Metabolomic characterization of human prostate cancer bone metastases reveals increased levels of cholesterol. PLoS One. 2010;5(12):e14175
21. Wu X, Daniels G, Lee P. et al. Lipid metabolism in prostate cancer. Am J Clin Exp Urol. 2014;2(2):111-120
22. Huebner AR, Somparn P, Benjachat T. et al. Exosomes in urine biomarker discovery. Adv Exp Med Biol. 2015;845:43-58
23. Zhou H, Yuen PS, Pisitkun T. et al. Collection, storage, preservation, and normalization of human urinary exosomes for biomarker discovery. Kidney Int. 2006;69(8):1471-1476
24. Oosthuyzen W, Sime NE, Ivy JR. et al. Quantification of human urinary exosomes by nanoparticle tracking analysis. J Physiol. 2013;591(23):5833-5842
25. Fernandez-Llama P, Khositseth S, Gonzales PA. et al. Tamm-Horsfall protein and urinary exosome isolation. Kidney Int. 2010;77(8):736-742
26. Bijnsdorp IV, Geldof AA, Lavaei M. et al. Exosomal ITGA3 interferes with non-cancerous prostate cell functions and is increased in urine exosomes of metastatic prostate cancer patients. J Extracell Vesicles. 2013;2:10.3402 /jev.v2i0.22097. eCollection 2013
27. Puhka M, Nordberg ME, Valkonen S. et al. KeepEX, a simple dilution protocol for improving extracellular vesicle yields from urine. Eur J Pharm Sci. 2017;98:30-39
28. Schindelin J, Arganda-Carreras I, Frise E. et al. Fiji: an open-source platform for biological-image analysis. Nat Methods. 2012;9(7):676-682
29. Roman-Garcia P, Quiros-Gonzalez I, Mottram L. et al. Vitamin B(1)(2)-dependent taurine synthesis regulates growth and bone mass. J Clin Invest. 2014;124(7):2988-3002
30. Demirin H, Ozhan H, Ucgun T. et al. Normal range of mean platelet volume in healthy subjects: Insight from a large epidemiologic study. Thromb Res. 2011;128(4):358-360
31. Xia J, Wishart DS. Web-based inference of biological patterns, functions and pathways from metabolomic data using MetaboAnalyst. Nat Protoc. 2011;6(6):743-760
32. Conde-Vancells J, Rodriguez-Suarez E, Embade N. et al. Characterization and comprehensive proteome profiling of exosomes secreted by hepatocytes. J Proteome Res. 2008;7(12):5157-5166
33. Bruschi M, Ravera S, Santucci L. et al. The human urinary exosome as a potential metabolic effector cargo. Expert Rev Proteomics. 2015;12(4):425-432
34. Nakayama Y, Kinoshita A, Tomita M. Dynamic simulation of red blood cell metabolism and its application to the analysis of a pathological condition. Theor Biol Med Model. 2005;2:18
35. Pilz RB, Willis RC, Boss GR. The influence of ribose 5-phosphate availability on purine synthesis of cultured human lymphoblasts and mitogen-stimulated lymphocytes. J Biol Chem. 1984;259(5):2927-2935
36. Rasila T, Lehtonen A, Kanerva K. et al. Expression of ODC Antizyme Inhibitor 2 (AZIN2) in Human Secretory Cells and Tissues. PLoS One. 2016;11(3):e0151175
37. Barbieri CE, Chinnaiyan AM, Lerner SP. et al. The Emergence of Precision Urologic Oncology: A Collaborative Review on Biomarker-driven Therapeutics. Eur Urol. 2017;71(2):237-246
38. Bharadwaj AG, Kovar JL, Loughman E. et al. Spontaneous metastasis of prostate cancer is promoted by excess hyaluronan synthesis and processing. Am J Pathol. 2009;174(3):1027-1036
39. Rilla K, Siiskonen H, Tammi M. et al. Hyaluronan-coated extracellular vesicles-a novel link between hyaluronan and cancer. Adv Cancer Res. 2014;123:121-148
40. Giskeodegard GF, Bertilsson H, Selnaes KM. et al. Spermine and citrate as metabolic biomarkers for assessing prostate cancer aggressiveness. PLoS One. 2013;8(4):e62375
41. Duijvesz D, Burnum-Johnson KE, Gritsenko MA. et al. Proteomic profiling of exosomes leads to the identification of novel biomarkers for prostate cancer. PLoS One. 2013;8(12):e82589
42. Duijvesz D, Versluis CY, van der Fels CA. et al. Immuno-based detection of extracellular vesicles in urine as diagnostic marker for prostate cancer. Int J Cancer. 2015;137(12):2869-2878
Author contact
![]() Corresponding author: Maija Puhka, PhD, Institute for Molecular Medicine Finland (FIMM), Tukholmankatu 8, P.O. Box 20, University of Helsinki, Finland p. +358 400826846 email: Maija.Puhkafi
Corresponding author: Maija Puhka, PhD, Institute for Molecular Medicine Finland (FIMM), Tukholmankatu 8, P.O. Box 20, University of Helsinki, Finland p. +358 400826846 email: Maija.Puhkafi