Impact Factor
- Issue 14; 2026
- Issue 13; 2026
- Issue 12; 2026
- Issue 11; 2026
- Issue 10; 2026
- Volume 16; 2026
- Advance Articles
- Past Issues
- Cover Images
- Cover Suggestion
- Index & Coverage
- Special Issues
Introduction
Materials and Methods
Results and Discussion
Conclusion
Abbreviations
Supplementary Material
Acknowledgements
References
International Journal of Biological Sciences
International Journal of Medical Sciences
 Global reach, higher impact

Theranostics 2017; 7(18):4480-4497. doi:10.7150/thno.21707 This issue Cite
Research Paper
Inorganic Kernel-Reconstituted Lipoprotein Biomimetic Nanovehicles Enable Efficient Targeting “Trojan Horse” Delivery of STAT3-Decoy Oligonucleotide for Overcoming TRAIL Resistance
Kai Shi1 ![]() , Jianxiu Xue1, Yan Fang1, Hongshu Bi2, Shan Gao1, Dongjuan Yang1, Anqi Lu1, Yuai Li1, Yao Chen1, Liyuan Ke3
, Jianxiu Xue1, Yan Fang1, Hongshu Bi2, Shan Gao1, Dongjuan Yang1, Anqi Lu1, Yuai Li1, Yao Chen1, Liyuan Ke3
1. Department of Pharmaceutics, School of Pharmacy, Shenyang Pharmaceutical University, Shenyang, Liaoning 117004, P. R. China;
2. Liaoning Yaolian Pharmaceutical Co., Ltd., Benxi, Liaoning 117004, P. R. China;
3. Liaoning Cancer Hospital & Institute, Shenyang, Liaoning 110042, P. R. China.
Received 2017-6-30; Accepted 2017-8-21; Published 2017-10-12
Abstract

Tumor necrosis factor-related apoptosis-inducing ligand (TRAIL) can selectively induce apoptosis in a variety of tumor cells, but not most normal cells. Nevertheless, its therapeutic potential is limited due to the frequent occurrence of resistance in tumor cells, especially hepatocellular carcinoma cell lines. Therefore, we investigated the reversal effect of STAT3-decoy oligonucleotides (ODNs) on TRAIL resistance. Methods. Considering that the drawback of poor cellular permeability and rapid degradation in vivo limited ODNs' further clinical applications, we developed a biomimetic calcium phosphate-reconstituted low density lipoprotein nanovehicle (CaP@LDL) that would serve as a “Trojan horse” to carry STAT3-decoy ODNs into tumor cells and then regulate TRAIL-induced apoptosis. Results. In comparison with native ODNs, the reconstituted CaP@LDL packaged ODNs showed significantly increased serum stability, cellular transfection, in vitro synergistic cytotoxicity and apoptosis in hepatoma cells, while there was no cytotoxicity to normal cells. The improved TRAIL sensitization is attributed to blocking of STAT3 signaling and consequent expression of the downstream target antiapoptotic gene. Following systemic administration, CaP@LDL displayed LDL-mimicking pharmacokinetic behavior such as attenuated blood clearance as well as enhanced accumulation in tumor and hepatorenal sites. With the synergistic combination of decoyODN/CaP@LDL, TRAIL dramatically inhibited hepatic tumor growth in a xenograft model and induced significant tumor apoptosis in vivo. Conclusion. These results suggested that CaP@LDL-mediated STAT3-decoy ODN delivery might be a promising new strategy for reversing TRAIL resistance in hepatocellular carcinoma therapy.
Keywords: calcium phosphate, low-density lipoprotein, STAT3, decoy oligonucleotide, TRAIL.
Introduction
As a member of the tumor necrosis factor (TNF) family, tumor necrosis factor-related apoptosis-inducing ligand (TRAIL) has recently received much attention due to its selective induction of apoptosis in a variety of tumor cells, but not most normal cells [1, 2]. This transmembrane protein triggers apoptosis through interacting with its respective receptors, such as death receptor 4/5 (DR4/5) [3]. The ligation of TRAIL leads to the formation of the death-inducing signaling complex (DISC) and subsequent binding and activation of caspase-8, which then activates caspase-3, which in turn leads to cleavage of the death substrates, finally resulting in apoptosis [4]. In contrast with TNF and Fas in the TNF superfamily, TRAIL only induces apoptosis of transformed and tumor cells, but has minor toxicity toward normal ones [5]. Nevertheless, their therapeutic potential is limited due to the frequent occurrence of resistance in tumor cells [6, 7]. Therefore, a novel strategy that is capable of efficiently overcoming TRAIL resistance without significant potential toxicological issues is highly in demand.
Signal transducer and activator of transcription 3 (STAT3) is one of the STAT family members and has attracted considerable attention because of its many important functions such as regulation of cell proliferation, differentiation and programmed cell death[8-10]. Unlike its rapid and transient activation during signal transduction in normal cells, STAT3 is continuously activated in most tumor cells [11, 12]. Being the junction point of multiple oncogenic tyrosine kinase signaling pathways such as EGFR, IL-6/JAK and Src, the activated STAT3 induces the high level of expression of these oncogenes through its downstream signaling [13, 14]. Recent studies suggested that constitutively-activated STAT3 is involved in acquired drug resistance and prevention of cell apoptosis through various ways, including by up-regulating cell survival proteins and down-regulating tumor suppressors [15, 16]. For these reasons, inhibitors that can effectively block STAT3 signaling with fewer potential toxicological issues are highly in demand.
Upon activation, STAT3 undergoes self-phosphorylation and subsequent dimerization in the cytoplasm [17]. The activated dimers are then transferred into the nucleus and induce the transcription of the target oncogene [18, 19]. Among the reported candidate inhibitors for blocking this process, which include small molecules [20, 21], peptidomimetic and nucleic acid [22, 23] inhibitors, STAT3-specific decoy oligonucleotides (STAT3-decoy ODNs) provide us a promising alternative due to their higher specificity and safety [24, 25]. Decoy ODNs are synthetic double stranded oligonucleotides that mimic the sequence of cis-acting elements on the promoter regions of the downstream target genes of the transcription factors [26, 27]. After transfection into tumor cells, they can bind to the transcription factors with high affinity and thus block the expression of their downstream target genes [28]. Therefore, decoy ODNs are attracting considerable attention due to their selective recognition of molecular targets and pathways and thus precise targeting of oncogenes. However, the drawbacks of poor cellular permeability and rapid degradation in vivo have limited their further clinical applications [29, 30].
Among the possible strategies to achieve these goals, low-density lipoprotein (LDL) provides us a promising alternative [31]. As one of the main endogenous components in human plasma, LDL exists as spherical particles with a diameter range of 18-25 nm [32]. It is structured by a hydrophobic kernel consisting of triglyceride and cholesteryl ester, which is enveloped by phospholipids, cholesterol and apolipoproteins [33]. Relative to normal cells, the LDL receptors are overexpressed in numerous malignancies (including acute myelogenous leukemia, adrenal adenoma, colon, glioblastoma and hepatomas) since they require LDL to transport large amounts of cholesterol for membrane synthesis [34, 35]. Therefore compared to other synthetic nanovesicles, LDL have advantages of good biocompatibility, no immunogenicity, and ability to escape recognition by the reticuloendothelial system (RES) and thus have a prolonged circulation half-life [36, 37]. However, in spite of their encouraging potential pharmaceutical applications, formulation of water-soluble therapeutic agents employing LDL still remains challenging. Since most therapeutic nucleic acids are hydrophilic, they are difficult to encapsulate into the hydrophobic core of LDL. Although strategies of hydrophobic covalent modification have been employed to overcome this limitations, these approaches have incurred either loss of biopotency or potential toxicological issues [38].
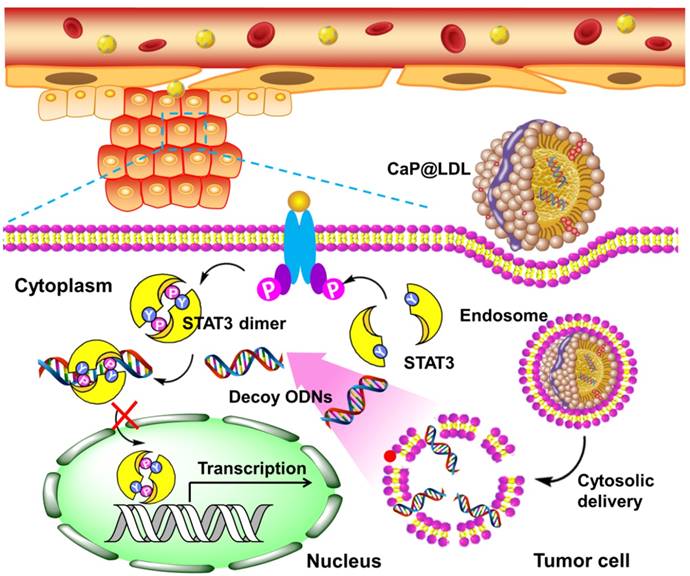
Here, we propose a novel inorganic kernel of calcium phosphate (CaP) as the core of reconstituted low-density lipoprotein nanovehicle, which would serve as a “Trojan horse” for targeted delivery of STAT3-decoy ODNs into tumor cells in order to reverse TRAIL resistance. As a kind of inorganic nanomaterial, CaP shows negligible cytotoxicity for gene delivery due to its inherent biocompatibility and biodegradability [39, 40]. In addition, upon endocytosis into cells, CaP undergoes dissolution in the acidic endosome and helps cargo release into the cytosol by endosome rupture [41, 42]. In this study, we reconstituted CaP-cored LDL nanovehicles (CaP@LDL) encapsulating STAT3-decoyODNs. Their growth inhibition effect on TRAIL-resistant human hepatocellular carcinoma cell line (HepG2), through blocking STAT3 signaling and consequent expression of downstream target antiapoptotic genes (Fig. 1), was evaluated both in vitro and in vivo. Their pharmacokinetics, biodistribution and safety data are also presented to demonstrate the reversal effect of CaP@LDL on TRAIL resistance.
Schematic representation of CaP@LDL-mediated STAT3-decoy ODN cytosolic delivery and blocking of the transcription and expression of TRAIL resistance related genes in tumor cells.
Materials and Methods
Materials
Cy3 labeled STAT3 decoy ODN (sense, 5'-CATTTCCCGTAAATC-3'; antisense, 3'-GTAAAGGGCATTTAG-5') and the mutant control decoy (sense, 5'-CATCTTGCCAATATC-3'; antisense, 3'-GTAGAACGGTTATAG-5') were synthesized by GenePharma Co., Ltd. (Shanghai, China), all of which were capped with phosphorothioate at both ends. Human TRAIL recombinant protein (TRAIL) was obtained from PeproTech (Rocky Hill, NJ). Primary antibodies used for western-blot analysis and immunostaining including anti-STAT3 Stat3 phosphorylated on Y705, anti-LDL receptor, anti-Bcl-2, anti-Bcl-xL, anti-Mcl-1, anti-survivin, anti-DR4, anti-DR5, anti-β-actin, Alexa Fluor 488-conjugated goat anti-rabbit IgG, phycoerythrin (PE) conjugated goat anti-rabbit IgG and horseradish peroxidase-conjugated goat anti-rabbit IgG were purchased from Abcam (Cambridge, MA). 1,2-dioleoyl-sn-glycero-3-phosphate (DOPA) and 1,2-dioleoyl-sn-glycero-3-phosphocholine (DOPC) were purchased from Avanti Polar Lipids, Inc. (Alabaster, AL). Other chemicals were obtained from Sigma-Aldrich (St. Louis, MO).
Cell culture and animals
Human hepatocellular carcinoma cell lines (HepG2 and PLC/PRF/5) and normal liver cell line (L-2) were obtained from the Cell Bank of the Chinese Academy of Sciences (Shanghai, China). The cells were maintained in Dulbecco's Modified Eagles Medium (DMEM), supplemented with 10% fetal bovine serum (FBS), 100 U/mL penicillin and 100 μg/mL streptomycin (Invitrogen, Carlsbad, CA). Female athymic nude mice 5-6 weeks of age were provided from Changsheng biotechnology (Shenyang, China). All animal handling procedures were approved by the Shenyang Pharmaceutical University's Institutional Animal Care and Use Committee.
Preparation of calcium phosphate reconstituted LDL
Firstly, the oil-soluble calcium phosphate cores (CaP) were synthesized via inverse microemulsion system as previously described [40]. Briefly, equal volumes (300 μL) of CaCl2 (2.5 M, containing ODNs) and Na2HPO4 (12.5 mM, containing 2 μmol DOPA) aqueous solution were separately dispersed in 20 mL of cyclohexane/IGEPAL® CO-520 (70:30, v/v) to form a well-dispersed reverse micro-emulsion. After stirring for 15 min separately, the two oil phases were immediately mixed together and stirred for another 30 min at room temperature. Subsequently, 40 mL of ethanol was added to break the emulsion and the CaP cores were then collected by centrifugation (10,000 × g, 20 min). The pellets were washed twice with ethanol and then re-dispersed in chloroform for further use.
For reconstitution of LDL, low-density lipoprotein was isolated from the plasma of healthy donors by sequential ultracentrifugation as described previously [43]. After dialysis against disodium 0.01% EDTA (pH 7.0), LDL (2 mg) was lyophilized in the presence of sucrose. Then the powder was subjected to heptane extraction three times at -10°C to remove the endogenous core lipids of LDL. Following aspiration of the last heptane supernatant fraction, CaP cores were added to the LDL-sucrose residue, together with DOPC and cholesterol at a molar ratio of 1:1. After incubation of the mixture for 1 h at -10°C, nitrogen was applied to remove the solvent. Then the residue was dispersed in 2 mL of tricine buffer (5 mM, pH 7.4) for hydration. The resultant CaP reconstituted LDL was subjected to extrusion through a 0.1 μm filter membrane three times and stored at 4°C. The amount of ODNs entrapped within the nanovehicles was determined by Quant-iT RiboGreen assay following lysis in Tris buffer with 2 mM EDTA and 0.05 % Triton X-100[44]. The drug entrapment efficiency was expressed as the percentage difference between the initial used and the entrapped amount of ODNs relative to the total amount used for the CaP@LDL preparation.
Characterization of nanovehicles
The surface morphology of nanovehicles was examined by transmission electron microscopy (TEM) with JEM-1200EX (Tokyo, Japan). Fourier transform infrared (FT-IR) spectra were recorded on a Bruker IFS55 spectrometer (Bruker, Switzerland) in the range of 4000~400 cm-1. Samples were prepared by mixing sample powder with KBr and scanned at 2 cm-1 resolution. The JEOL JEM-2100 field emission transmission electron microscopy equipped with X-MAX80 (Oxford Instruments, UK) was used for energy dispersive X-ray spectroscopy (EDS) measurements. Thermal gravimetric analysis (TGA) was performed on a TGA-51 thermal gravimetric analyzer (Shimadzu Corp., Kyoto, Japan) at a heating rate of 15°C·min-1 from 30°C to 800°C under nitrogen atmosphere. The hydrodynamic diameter, polydispersity and zeta potentials of the NPs were measured by dynamic light scattering (DLS) analysis using Zetasizer Nano ZS (Malvern Instruments, UK). Conformational changes of native and reconstituted LDL were evaluated by circular dichroism. The purity and integrity of native and reconstituted LDL was confirmed by the standard SDS-PAGE analysis [45].
Transfections and intracellular distribution
Cells were seeded in LabTek Chambered Coverglass at a density of 2.5×10⁵ cells/mL. At 50-60% confluence, cells were transfected with CaP@LDL containing Cy3-labeled STAT3-decoy ODNs or mutant control decoy. After 8 h incubation in Opti-MEM without FBS, the cells were placed in fresh serum-containing medium and incubated for another 24 h. Then the cells were washed three times with cold HBSS and then fixed with 4% paraformaldehyde. Cells were permeabilized using 0.1% Triton X-100 in blocking solution containing 1% bovine serum albumin in HBSS for 10 min. Then the cells were subjected to phosphorylated STAT3 staining by incubation with anti-STAT3 phosphorylated on Y705 (1:500) and Alexa Fluor 488-conjugated secondary antibody (1:1500), respectively. Additionally, the cells were incubated with Lysotracker Green (1 μg/mL) for endosome/lysosome staining. Following counterstaining with DAPI, cover slips were mounted on slides and examination was performed by confocal laser scanning microscopy (Olympus FV1000-IX81, Japan).
Flow cytometry assay of cellular uptake
Cells were seeded in 6-well culture plates at a density of 1×10⁶ cells/well. At 50-60% confluence, cells were transfected with CaP@LDL enveloping Cy3-labeled STAT3-decoy ODNs. After incubation at 37°C for 8 h, the cells were washed three times with cold DPBS and treated with 0.25% trypsin and 0.02% EDTA. The trypsinized cells were harvested by centrifugation and resuspended in DPBS. The intracellular fluorescence of Cy3 was analyzed by FACS using a BD FACSAria Flow Cytometer (Becton-Dickinson, Franklin Lakes, NJ).
Cytotoxicity assay
Cells were seeded onto 96-well plates at a density of 5×10³ cells/well overnight. Then the culture medium was replaced by fresh media with decoyODN/CaP@LDL. CaP@LDL loaded with mutant control decoy were used as control. After incubation for 24 h, the cells were exposed to TRAIL at various concentrations for another 24 h. Then the medium was removed and 100 μL of MTT solution (0.5 mg/mL in HBSS) was added for another 3 h of incubation at 37°C. Then the formed formazan was dissolved by adding 150 μL of DMSO and the absorbance of each well was measured at 490 nm with a microplate reader (Bio-Rad model 550, USA). The relative cell viability was expressed as the absorbance difference between the test samples and negative control.
Apoptosis analysis
The cells were seeded in 6-well culture plates at a density of 1×10⁶ cells/well. At 50-60% confluence, cells were transfected with STAT3-decoy ODNs (50 nM) contained in CaP@LDL for 24 h. The CaP@LDL loaded with mutant control decoy were used as control. Then the cells were exposed to TRAIL at 50 ng/mL for another 8 h. The washed and trypsinized cells were harvested and resuspended in 1× binding buffer at a concentration of 1×10⁶ cells/mL. For 1×10⁵ cells per sample, 5 μL of FITC annexin V and 5 μL of propidium iodide (PI) were added and samples were incubated at room temperature for 15 min in the dark. Flow cytometry was performed immediately and Annexin V-FITC/ PI fluorescence signals were collected with 530 nm and 610 nm band pass filters, respectively. The percentages of apoptotic cells were calculated.
Western blot analysis
Tumor cells were lysed using RIPA buffer (50 mM TrisCl, pH 7.2, 150 mM NaCl, 1% NP40, 0.1% SDS, 0.5% DOC, 1 mM PMSF, 25 mM MgCl2, and supplemented with a phosphatase inhibitor cocktail). The extracted total proteins were determined by the BCA assay (Beyotime Biotechnology, Shanghai, CN). Aliquots of protein samples were separated on SDS-polyacrylamide gel and transferred to PVDF membrane. After blocked with 5% milk, membranes were incubated with specific primary antibodies overnight at 4°C. Following incubation with horseradish peroxidase-labeled secondary antibodies, the membranes were exposed to the Pierce ECL Western Blotting Substrate (ThermoFisher Scientific, Rockford, IL) for chemiluminescence assay.
Quantitative real-time PCR analysis
Total RNA was extraction from the homogenized tumor tissue using Trizol reagent. Then 0.5 μg of total RNA was reverse transcribed using first-strand cDNA synthesis kit (Tiangen, Beijing, CN). Quantitative real-time PCR was performed with SYBR Green using an ABI 7500 instrument (Applied Biosystems, CA, USA). PCR reaction was performed according to the standard amplification procedure to amplify the target, using the cDNA as the template in a 30 μL reaction. The primers used in the PCR reactions are listed in Table S1. Relative changes in mRNA expression were calculated using ΔΔCt method [46]. Gene expression was normalized relative to β-actin expression.
Detection of TRAIL receptor expression
After treatment, the washed and trypsinized cells were harvested by centrifugation and resuspended in DPBS. Then the cells (1×10⁵) were stained with anti-DR4 or anti-DR5 (10 μg/mL) on ice for 30 min. After incubation, cells were washed twice, and reacted with PE conjugated goat anti-rabbit IgG on ice for another 30 min. After double washing with DPBS, the expression of DR4 and DR5 was analyzed by FACS using a BD FACSAria Flow Cytometer (Becton-Dickinson, Franklin Lakes, NJ).
Caspase 8 activity assay
Caspase 8 activity was measured using a colorimetric activity assay according to the manufacturer's instructions (Beyotime Biotechnology, Shanghai, CN). After treatment, the washed and trypsinized cells were harvested by centrifugation at 600 × g for 5 min. The medium was carefully discarded and washed out by DPBS. Then cell lysis was performed in lysis buffer at 4°C for 15 min, which was followed by centrifugation (10000 × g) and the supernatant was collected. Equal protein samples were incubated with the caspase 8 substrate (Ac-DEVD-pNA) for 120 min at 37°C, and activity was measured at 405 nm using a microplate reader.
Tissue distribution and pharmacokinetics in vivo
Mice bearing HepG2 xenografts (~0.2 cm3) were intravenously injected with CaP@LDL containing Cy3-labeled STAT3-decoy ODNs (2.5 mg/kg). 4 h after dosing, the mice were killed and tissues were collected and imaged by the IVIS Imaging System (Carestream Health, Inc., Rochester, NY). The fluorescence signals in diverse organs and tissues were quantified using Carestream's molecular imaging program. For pharmacokinetic studies, mice bearing HepG2 xenografts were intravenously injected with 3H-labeled STAT3-decoy ODNs contained in CaP@LDL at a dose of 2.5 mg/kg. At selected time points, mice were sacrificed and blood was collected through parallel sampling. The amount of 3H labeled ODNs in the blood was quantified using liquid scintillation counting.
Tumor growth inhibition study
The BALB/c nude mice were subcutaneously injected on the right flanks with 5×10⁶ HepG2 cells. When the tumors reached 60-80 mm3 in size, the HepG2 xenograft tumor-bearing mice were randomly divided into five groups (6 mice per group): TRAIL, TRAIL + decoy ODNs, TRAIL + decoy ODNs/CaP@LDL, TRAIL+ mutant ODNs/CaP@LDL, and PBS control. Mice were treated by intravenous administration of ODNs (2.5 mg/kg) followed 24 h later by intraperitoneal administration of TRAIL (100 μg/kg). All groups were treated once every other day for 21 days. Tumor size and mouse body weight were monitored thereafter. The tumor volume (V) was calculated according to the formula, V = a × b2 /2, where a is the longest dimension of the tumor and b is the perpendicular diameter.
TUNEL assay
Tumor cell apoptosis after treatment was determined by the TdT-mediated dUTP nick end labeling (TUNEL) assay, which was carried out using a DeadEnd Fluorometric TUNEL System (Promega, Madison, WI) according to the manufactures instructions. Cell nuclei that were fluorescently stained with FITC (green) were defined as TUNEL-positive nuclei, i.e., apoptotic. Following counterstaining with DAPI, cover slips were mounted on slides and examination was performed by fluorescence microscopy (Leica Corp., Wetzlar, Germany). The percentage of apoptotic cells was obtained by dividing the number of apoptotic cells by the total number of cells in each microscopic field.
Histopathological evaluation and hematology assay
At the end of the treatments, whole organs including liver, kidney and spleen of mice were collected and fixed for hematoxylin and eosin (H&E) staining to evaluate the organ-specific toxicity. Moreover, creatinine, blood urea nitrogen (BUN), serum aspartate aminotransferase (AST) and alanine aminotransferase (ALT) levels were quantified as indicators of renal and hepatic function. Moreover, white blood cells (WBC), lymphocytes (LYMF), granulocytes (GRAN) and monocytes (MONO) were counted for the detection of myelosuppression.
Statistics analysis
Statistical significance was assessed using a one-way analysis of variance (ANOVA) among three or more groups or Student's t-test between two groups. p-values <0.05 and <0.01 were considered to be statistically significant and highly significant, respectively.
Results and Discussion
Reconstitution and characterization of CaP@LDL
Co-precipitation of nucleotides with calcium phosphate (CaP) has been used for many years as an in vitro transfection agent due to its inherent biocompatibility, good biodegradability as well as simplicity of preparation. Recently, a lipid-coated calcium phosphate nanoparticle in which the nanosized CaP was coated by an asymmetric lipid bilayer, was developed by Huang et al. for in vivo therapeutic use [47]. In order to achieve cell targeting, pegylated phospholipids with a tethered ligand were also required to be integrated into the outer leaflet lipid. By contrast, the developed CaP@LDL employ LDL as the outer layer of the CaP cores, which is expected to mimic the in vivo behavior of LDL without additional cationic lipids and tethered ligand, including prolonged circulation time in blood through escaping recognition and engulfment as exogenous substance by the immune system and RES, and improvement of tumor enrichment and cellular uptake via LDL receptor-mediated targeting and endocytosis [48].
To incorporate nano-sized CaP into the lipid core of LDL, a novel reconstitution procedure was employed (Fig. 2A). This first involved partial delipidation of purified LDL by a relatively nonpolar solvent to remove the neutral core lipids including triglyceride and cholesteryl ester. Meanwhile, a reverse microemulsion method was used to produce a two-phase interface system, where synthesis of CaP was performed on the cyclohexane/water interface. As the phosphate, together with DOPA, was mixed with the calcium in cyclohexane by stirring at room temperature, interfacial spontaneous emulsification took place in the presence of the reverse micelles [49, 50]. As soon as calcium phosphate precipitation was initiated in the confined internal phase of the reverse microemulsion, the presence of DOPA allowed the formation of a lipid monolayer at the oil-water interface to stabilize the formed nanoprecipitates. As DOPA is known to strongly interact with calcium ions that are available on the core surface, it tightly attached to the CaP cores via its phosphate head group, while its hydrophobic oleoyl tail was repelled by water and thus faced the cyclohexane phase. Once the coated DOPA provided enough hydrophobic aliphatic chains to the surface of the CaP cores, solubilization in a non-poplar solvent such as chloroform occurred because of their enhanced hydrophobicity. The final CaP@LDL nanovehicles, illustrated in Fig. 2A, were generated by incubating CaP cores with LDL precursors together with neutral lipids, e.g., DOPC and cholesterol. During reconstruction, the added components reassembled into the supramolecular structure of LDL with DOPA-coated CaP as the hydrophobic core.
Preparation of CaP reconstituted LDL. (A) Outline of the preparation of CaP@LDL. (i) The precipitation reaction between reverse microemulsions; (ii) Removing cyclohexane and emulsifier by ethanol washing; (iii) Reconstitution of asymmetric lipid bilayer following delipidated LDL addition. (B) Typical TEM morphology of nanosized CaP cores with magnified image. (C) Typical TEM morphology of CaP@LDL with magnified image. (D) Hydrodynamic size profile of native LDL and CaP@LDL. (E) EDS spectrum of synthesized CaP cores. (F) FT-IR spectra of CaP cores and CaP@LDL. (G) TGA curves of CaP cores and CaP@LDL.
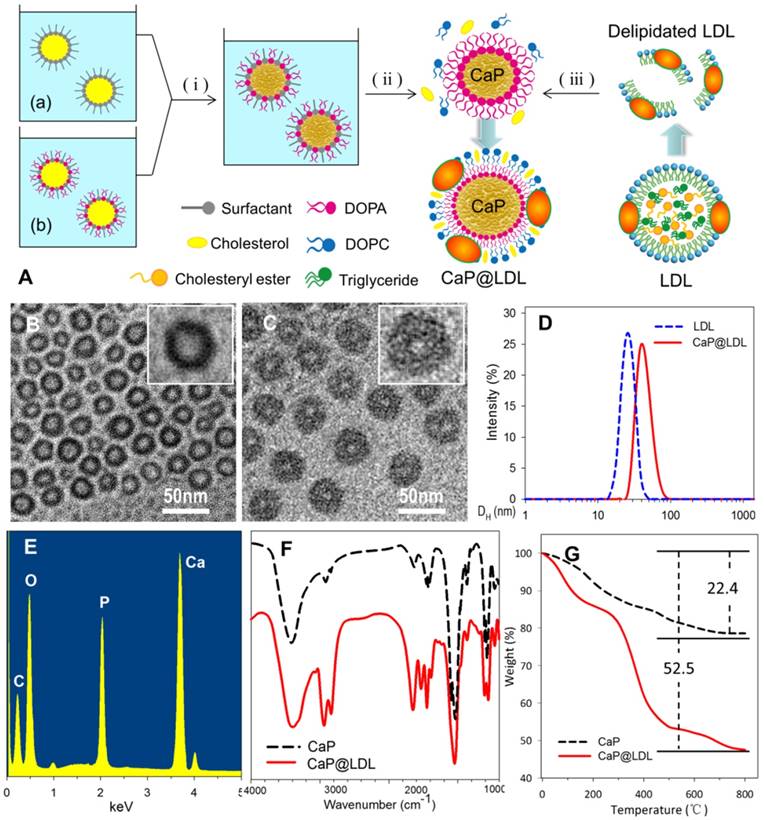
Fig. 2 (B-C) shows the TEM image of reconstituted CaP cores and CaP@LDL under the typical experimental conditions. As can be seen, the synthesized CaP cores were quasi spherical with diameters of 25-28 nm, which is similar to that of native LDL (Fig. 2D). The relatively light contrast at the center of the particles compared to that observed at the edge suggests the existence of hollow interiors. In the presence of LDL envelopment, an obvious corona was observed around the surface of the CaP core. The LDL-enveloped CaP are highly monodisperse with a hydrodynamic diameter in the range of 40-45 nm and a shell thickness of ~10 nm.
The chemical composition of the synthesized CaP cores was confirmed by EDS spectroscopy, which clearly indicates the presence of elements Ca, P and O in the product (Fig. 2E). Furthermore, LDL packaging of the final reconstituted nanovehicles was evident from the FTIR spectrum (Fig. 2F). As seen in the FTIR spectrum, two intensive IR absorption bands were observed at 600-560 cm-1 and 1100-1000 cm-1, which originated from the in-plane bending and asymmetrical stretching vibration of the PO43- group, respectively. Moreover, the intensive IR absorption bands at the range of 1650-1250 cm-1 belonged to the amide band of protein, indicating the existence of LDL in the CaP@LDL nanovehicles.
LDL packaging on the surface of CaP cores was further confirmed by means of thermogravimetric analysis. Fig. 2G shows the TGA plots of CaP cores and their LDL enveloped ones. In contrast with that of CaP, two distinct steps of weight loss were observed with respect to CaP@LDL. The first stage of weight loss was noticed between 30-140ºC, which is attributed to the loss of adsorbed water. The second stage occurs in the temperature range 210-500ºC, which is a result of the degradation of enveloped LDL. Overall, 47.5% of the residue remained in the CaP@LDL at the final test temperature. According to the difference in residues of CaP cores and CaP@LDL, we can reveal that LDL makes up ~38% of the composition of CaP@LDL, indicating their organic and inorganic composite nature.
Since the ligand affinity of LDL depends on the protein bioactivity, we further checked the change in protein secondary structure by circular dichroism (CD). The CD spectra exhibited an identical distribution of secondary structure between the native and reconstituted LDL (Fig. 3A), indicating that the conformation of LDL was conserved during the reconstitution process. Moreover, SDS-PAGE showed that there is no difference in protein molecular weight before and after LDL reconstitution (Fig. 3B). In addition, shell packaging with neutral phospholipid and LDL render the zeta potential of the nanovehicles to -4.2 mV ± 2.1 mV. In addition, more than 75% of ODNs payload was encapsulated into both reconstituted nanovehicles.
Characterization of CaP reconstituted LDL. (A) Circular dichroism spectra of native and reconstituted LDL. (B) SDS-PAGE of native and reconstituted LDL. (C) Representative images of agarose gel electrophoresis of native and CaP@LDL-enveloped ODNs for serum stability evaluation. (D) Quantitative analysis of band intensity in agarose gel electrophoresis. Data is shown as mean ± SD. (E) Influence of serum on CaP@LDL size-stability in 10% FBS and Tricine buffer. (F) In vitro release profiles of decoy ODNs from CaP@LDL in PBS with different pH values.
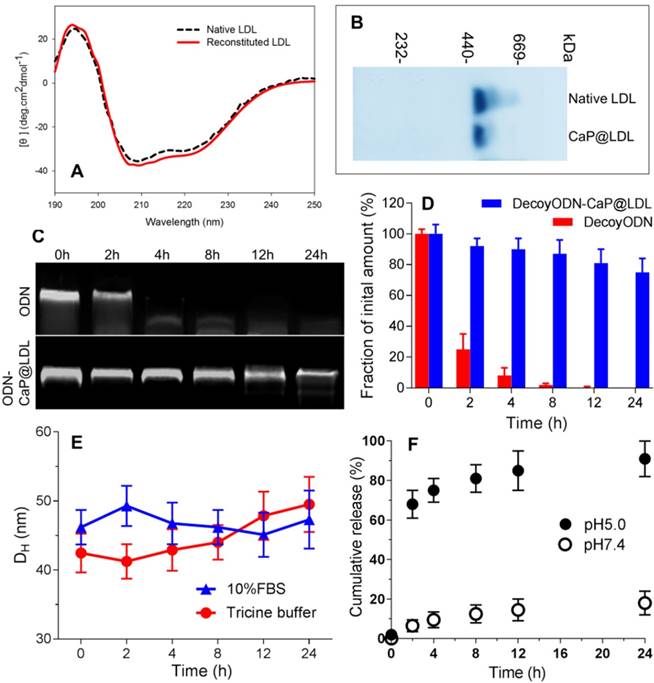
To investigate whether CaP@LDL would improve the resistance of ODN duplexes to nuclease in serum, we assessed the stability of naked and encapsulated ODNs by incubation with 10% fetal bovine serum at 37°C. As expected, the band of naked ODNs was faint at 2 h, and nearly disappeared after 4 h, indicating that naked ODNs were rapidly degraded by serum (Fig. 3C). In contrast, ODNs in CaP@LDL were well-protected in serum, and remained relatively intact even at 24 h (Fig. 3D). These results demonstrated that the reconstituted CaP provided a favorable protection of ODNs from serum degradation compared with naked ones. In addition, the influence of plasma protein on size-stability was also investigated by DLS over time. As shown in Fig. 3E, there was no significant change in the size distribution of CaP@LDL during incubation with both 10% FBS and Tricine buffer. The stability of CaP@LDL could be attributed to steric repulsion from the LDL coating on the surface of CaP cores. Through both volume restriction and interpenetration effects, these lipoprotein coronas sterically stabilized the colloidal particles and prevented them from mutual flocculation [51]. The results suggest that the external lipoprotein shell defines the behavior of CaP@LDL in serum. Reduced serum aggregation is important for further clinical application of these nanovesicles.
Furthermore, in vitro release profiles of decoy ODNs from the reconstituted nanovehicles were investigated in the dissolution media with different pH values. As shown in Fig. 3F, when incubated in neutral medium at pH 7.4, the nanovehicles showed negligible cumulative release amounts, with ≤20% of loaded ODNs released throughout the experiment. In contrast, a biphasic pattern characterized by an initial burst release and subsequent delayed release was observed in acidic medium with pH 5.0. More than 60% and 80% cumulative release of decoy ODNs was achieved at the first 2 h and 8 h, respectively. The significant difference in release profiles between pH 5.0 and pH 7.4 medium suggested that the cargo release from CaP@LDL seems to be pH dependent. It is well known that the metabolism of LDL is a typical receptor-mediated endocytosis process [52]. LDL receptors on cell membranes function to bind LDL and internalize them to intracellular sites, frequently to endosomes/ lysosomes. Next, degradation of LDL in endosomes/ lysosomes occurs, releasing its cholesterol cargo for use in the synthesis of membranes [53]. Therefore, LDL-based carriers should be constructed such that their cargoes can escape from the endosome environment. This issue has always haunted the further development of LDL-based target delivery systems [54]. Among the possible strategies to achieve this goal, nanosized CaP provides us a promising alternative due to its rapid dissociation in acidic environments. Our work has shown that naked ODNs mainly suffer from retention in endosomes/ early lysosomes, while stronger escape efficiency of ODNs from endosomes could be achieved by CaP@LDL envelopment, which is indicated by the significant separation of LysoTracker Green fluorescence (lysosomes) and Cy3 red fluorescence (STAT3-decoy ODNs) observed in the CaP@LDL group (Fig. S1). This result is in line with previous reports that CaP dissolution disassembles the nanovehicles inside the endosome, which generates the “proton sponge” effect to increase osmotic pressure, thus causing endosomal rupture [55].
Intracellular uptake and distribution
In view of the fact that poor intracellular transport is one of the major barriers to effective gene transfection, STAT3-decoy ODNs were labeled with Cy3 to track their intracellular localization by confocal microscopy. Human hepatocellular carcinoma cell lines (HepG2) were chosen because they were observed to maintain high levels of constitutively activated STAT3 (Fig. S2). Moreover, they express abnormally high levels of LDL receptors relative to normal cells (Fig. S3). As shown in Fig. 4A, phosphorylated STAT3 in untreated HepG2 cells was mainly located in the nucleus, which is consistent with previous reports that there exists constitutive shuttling of phosphorylate STAT3 from the cytoplasm to the nucleus [56]. After treatment with STAT3-decoy ODNs, most of phosphorylate STAT3 gathered in the cytoplasm. Meanwhile, there was significant overlap between phosphorylated STAT3 and STAT3-decoy ODNs, indicating that specific binding occurred between them. In contrast, stronger fluorescence signal of Cy3-labeled STAT3-decoy ODNs from CaP@LDL was observed in the cytoplasm, indicating that CaP@LDL enhanced cellular uptake of the ODNs, which inhibited phospho-STAT3 nuclear translocation by trapping activated STAT3 within the cytoplasm. Although there was also intense cellular uptake of mutant STAT3-decoyODNs in the cells from CaP@LDL, nuclear translocation of activated STAT3 was not prevented.
Cellular transfection of STAT3-decoy ODNs. (A) Subcellular localization of native and CaP@LDL enveloped DecoyODNs in HepG2 cells. Untreated cells were used as control. Moreover, mutant ODNs loaded in CaP@LDL were used as control for STAT3 targeting. Scale bar indicates 10 µm. (B) Quantifying intracellular uptake of Cy3-ODNs by flow cytometry analysis.
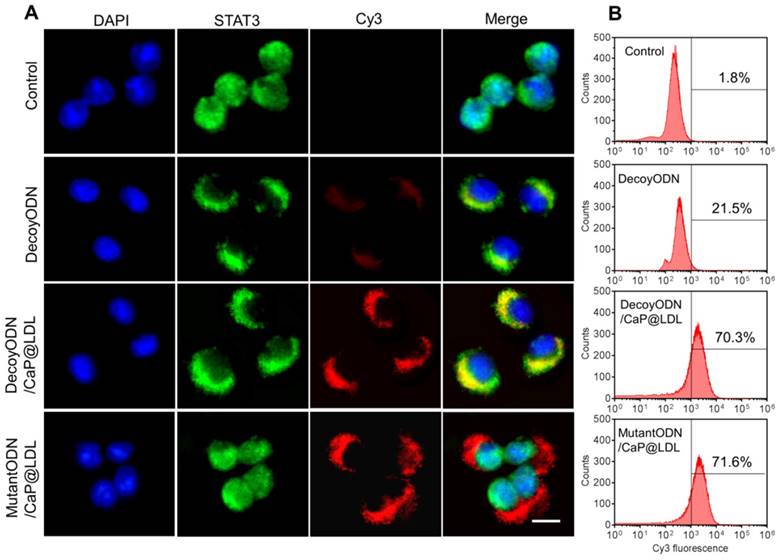
To quantify the cell internalization efficiency, cell populations were analyzed via flow cytometry after the given incubation time. As shown in Fig. 4B, there was a slight shift in the mean fluorescence intensity peak of free ODNs compared to the control cells, which correlated well with the inefficient cellular internalization of free ODNs observed in confocal microscopy. In contrast, CaP@LDL loaded with both decoy and mutant ODNs showed increasing shift in the mean fluorescence intensity peaks as compared to that of naked ODNs, indicating their improved cell internalization. There is a general consensus that free ODNs, which are a type of anionic and hydrophilic double-stranded small oligonucleotides, are not readily taken up by cells. Their strong hydrophilicity and negative charge prevents them from readily crossing cytomembranes [32]. Therefore, ODNs needs to be packaged in vesicles for cellular endocytosis. CaP@LDL aims to improve the cellular uptake rate by packaging CaP cores with reconstituted LDL that mediates endocytosis of the nanovehicles via LDL receptors on the target cells [33].
Cytotoxicity and induction of cell apoptosis in vitro
To verify the improved cytotoxic effects of STAT3-decoy ODNs on TRAIL, MTT assay was further carried out to examine their combined inhibitory effect on the proliferation of tumor cells. We first checked the cytotoxicity of STAT3-decoy ODNs on the tumor cells. As shown in Fig. 5A, the naked STAT3-decoy ODNs showed a weak inhibitory effect on tumor cells at the tested dose range. Although CaP@LDL increase the cytotoxicity of STAT3-decoy ODNs significantly when the dose reached 100 nM (p<0.05), their cytotoxicity was still limited. In contrast, CaP@LDL loaded with STAT3-mutant ODNs was found to have no significant cytotoxicity (p>0.05), despite the fact that CaP@LDL could efficiently enter the cells. In addition, it was found that all ODNs formulations showed negligible cytotoxicity on normal hepatocytes at the tested concentrations (Fig. S4).
In vitro proliferation and apoptosis inhibition of STAT3-decoy ODNs on TRAIL resistant tumor cells. (A) Cytotoxicity of STAT3-decoy ODNs in HepG2 cell line (n=6). (B) Cytotoxicity of TRAIL plus STAT3-decoy ODNs in HepG2 cell line (n=6). Data are expressed as mean ± S.D., *p < 0.05, **p < 0.01 vs. untreated control. (C) Apoptosis measurement by flow cytometry analysis of Annexin V-FITC and PI double-labeled HepG2 cells.
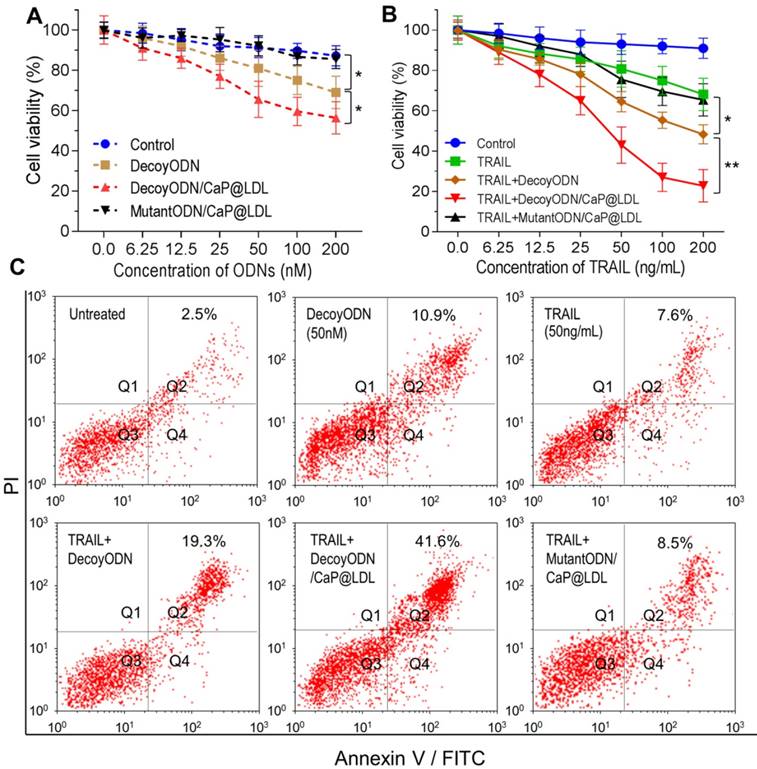
Next, we determined whether inhibition of STAT3 would increase TRAIL sensitivity in TRAIL-resistant hepatocellular carcinoma cells. As shown in Fig. 5B, TRAIL reduced cell viability of HepG2 with dose-dependence, however higher concentrations of TRAIL (IC50 > 200 ng/mL) were required to elicit significant cytotoxicity. In contrast, decoyODN/CaP@LDL (50 nM) significantly enhanced sensitivity to TRAIL in HepG2 cells (IC50 = 30.2±11.4 ng/mL). However, CaP@LDL loaded with STAT3-mutant ODNs at the same dose could not reverse the cells' resistance to TRAIL. Similar cytotoxicity was also observed in TRAIL-resistant PLC/PRF/5 hepatocellular carcinoma cells (Fig. S5).
Furthermore, cell apoptosis induced by TRAIL was determined by staining a cell population with FITC annexin V and PI (propidium iodide). As shown in Fig. 5C, exposure of TRAIL at 50 ng/mL or STAT3-decoy ODNs (50 nM) only resulted in 7.6% and 10.9% of cell population in the apoptotic area. Combination with naked or CaP@LDL-enveloped STAT3-decoy ODNs lead to significant apoptosis (19.3% and 41.6% of cells were apoptotic, respectively). In contrast, CaP@LDL loading with STAT3-mutant ODNs did not significantly enhance cell apoptosis in response to TRAIL.
Mechanism of reversing TRAIL resistance by STAT3-decoy ODNs
Although the exact molecular mechanisms by which STAT3 reverse TRAIL resistance have not been fully elucidated, blockage of STAT3-dependent pathway and subsequent inhibition of downstream related gene expression remain the key candidates for this mechanism [57]. In the present study, combination of STAT3-decoy ODNs and TRAIL apparently induced apoptosis in human hepatoma cells. To examine whether the reversal effect of STAT3-decoy ODNs in TRAIL resistant cells was in response to the expression of their downstream genes, both qRT-PCR and western blotting analyses were carried out to determine changes in STAT3-targeted genes at mRNA and protein levels. As illustrated in Fig. 6A, the decoyODN/CaP@LDL group showed obvious changes at the transcriptional level of Bcl-2, Bcl-xL, Mcl-1 and Survivin as compared to PBS control. The mRNA levels of these target genes were significantly decreased by 0.75, 0.69, 0.78 and 0.62 after treatment with decoyODN/CaP@LDL, which were significantly higher than that of naked ODNs (p<0.01). In contrast, reduced gene expression was not observed in the group treated with STAT3-mutant ODN-loaded CaP@LDL.
Mechanism of reversing TRAIL resistance by STAT3-decoy ODNs. (A) Quantitative Real-Time PCR analysis of relative mRNA expression of STAT3 target genes in hepatocellular carcinoma HepG2 cells. (B) Western blot analysis of protein expression levels of STAT3 target genes in hepatocellular carcinoma HepG2 cells. (C) Effect of treatment with STAT3-decoy ODNs and TRAIL on relative levels of caspase 8 in hepatocellular carcinoma HepG2 cells. (D) Flow cytometry analysis of cell surface expression of DR4 and DR5 after treatment with STAT3-decoy ODNs and TRAIL. Data are expressed as mean ± S.D., *p < 0.05, **p < 0.01 vs. untreated control; n=6.
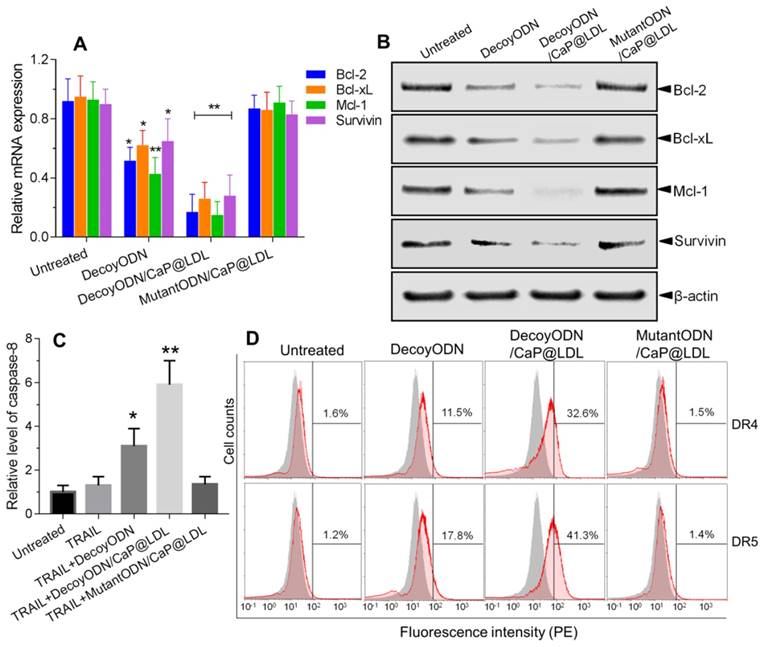
In view of the fact that the expressions of these anti-apoptotic genes are associated with TRAIL resistance, we further determined the protein expression levels of these target genes by western blot analysis. As seen in Fig. 6B, the naked STAT3-decoy ODNs showed a weak attenuation of the protein expression of Bcl-2, Bcl-xL, Mcl-1 and Survivin. In contrast, a very notable decrease in protein levels of these target genes was observed after treatment with decoyODN/CaP@LDL (p<0.01). Conversely, treatment with the mutant ODNs from the same vesicles did not show reductions in protein expression levels when compared to the PBS control. These results demonstrate that the improved sensitivity of hepatoma cells to TRAIL was largely attributed to blockade of the transcription and expression of STAT3 target oncogenes, which is mediated by STAT3-decoy ODNs' action. It is worth noting that the protein expression level of STAT3, whether or not it is phosphorylated, did not significantly change after treatment with naked or vesicle-enveloped STAT3-decoy ODNs (p>0.05) (Fig. S6). This observation suggested that the target of STAT3-decoy ODNs is not STAT3 itself or phosphorylated STAT3, but the downstream target genes of STAT3.
It is well known that TRAIL-mediated apoptosis depends on its binding to the corresponding death receptors on the cell surface. Therefore, we examined whether the combined treatment modulates cell surface expression of DR4 and DR5 by flow cytometry. As shown in Fig. 6C, the expression levels of DR4 and DR5 in HepG2 cells that were only treated with TRAIL were not significantly different from that of the control cells. In contrast, pretreatment with native or CaP@LDL-enveloped STAT3-decoy ODNs induced a significant increase in DR4 and DR5 expression levels as compared to the corresponding group treated with TRAIL alone (p<0.01). Our results show that STAT3 plays an important role in the resistance of TRAIL action. Recently, it has been reported that a STAT3-binding site is present in the promoter of DR4 and DR5 and that STAT3 is a possible negative regulator of their expression [58]. In line with this consideration, our work provides evidence that blocking of STAT3 signaling markedly increased the expression of death receptors.
We further measured caspase-8 activity in cell lysate as cleavage of a colorimetric substrate (DEVD-p-nitroaniline). It was found that caspase-8 activity was still lower in cells following TRAIL exposure alone (Fig. 6D). On the contrary, the activity of caspase-8 in the HepG2 cells that were pre-treated with native or CaP@LDL-enveloped STAT3-decoy ODNs increased considerably compared to the cells treated with TRAIL alone (p<0.01). This indicated that STAT3-decoy ODNs sensitize hepatoma cells towards TRAIL-induced apoptosis. Our data revealed that blocking of STAT3 signaling contributed the major mechanism for the sensitizing effect of STAT3-decoy ODNs on TRAIL in HepG2 cells. In these resistant hepatoma cells, death receptor-mediated apoptosis requires amplification of the death signal through activation of the intrinsic mitochondrial apoptosis pathway. Thus TRAIL-induced cell death is tightly regulated by the anti-apoptotic Bcl-2 family members, such as Bcl-2, Bcl-xl and Mcl-1[59]. Following activation of death receptor in the majority of tumor cells, the generated signal can be amplified through the mitochondrial pathway, which is initiated by the caspase-8-mediated cleavage of the BH3-only protein Bid [60]. The resulting active, truncated Bid (tBid) activates Bax, thereby inducing apoptosome and Smac/Diablo-mediated caspase activation. Thus, Bcl-2 family members play a critical role in modulating TRAIL-mediated cell death in tumor cells. It has been shown that overexpression of these anti-apoptotic proteins is one of the main factors that neutralizes TRAIL-related signaling and causes hepatoma cells to be resistant to TRAIL [61]. In this study, we have shown that STAT3-decoy ODNs overcame resistance to TRAIL through attenuating transcription and expression of these anti-apoptotic proteins.
In vivo pharmacokinetics and biodistribution
In order to verify the effect of LDL cloaking on CaP cores, we further investigated their pharmacokinetics and biodistribution in vivo. The plasma concentration of the naked STAT3-decoy ODNs versus time course is shown in Fig. 7A, which serves as reference for the kinetics of CaP@LDL-enveloped STAT3-decoy ODNs. After i.v. administration of 2.5 mg/kg STAT3-decoy ODNs, the intact ODNs could be detected in plasma only ≤4 h. The change in plasma concentration of naked STAT3-decoy ODNs followed a biexponential pattern with initial distribution half-life (t1/2α) of 0.43±0.12 h and a terminal half-life (t1/2β) of 3.52±1.45 h (Table 1). In contrast, 35-40% of given ODNs in CaP@LDL still remained in plasma 24 h after dosing. When compared with the pharmacokinetic behavior of naked ODNs, CaP@LDL attenuated their clearance from the circulation. The differences were most significant in the extended t1/2β (16.42±5.75 h) and MRT (mean residence time) (21.56±7.30 h) of decoyODN/CaP@LDL. For our reconstituted CaP@LDL, the nanovehicles mimicked the endogenous compound of LDL in many characteristics, including composition, surface properties and size. Moreover, they have been found to be non-immunogenic due to their endogenous nature [62]. Therefore, the reconstituted nanovehicles showed relatively long circulation time in blood through escaping recognition as exogenous substance by the immune system and engulfment by RES. Thus, CaP@LDL may provide a solution to the typical problems of most synthetic nanodevices including immunological reactions and rapid plasma clearance by the reticuloendothelial system.
Pharmacokinetic parameters for plasma 3H-ODNs levels in mice after intravenous administration of reconstituted nanovehicles.
| t1/2α (h) | t1/2β (h) | MRT (h) | AUCSS (%ID·h/mL) | Cl (mL/h/kg) | |
|---|---|---|---|---|---|
| naked ODNs | 0.43± 0.12 | 3.52± 1.45 | 1.46± 0.58 | 50.76± 13.92 | 1.96± 0.67 |
| ODN/CaP@LDL | 1.41± 0.28 | 16.42± 5.75 | 21.56± 7.30 | 1228± 413 | 0.09± 0.02 |
t1/2α: initial distribution half-life; t1/2β: terminal half-life; MRT: mean residence time; AUCSS: steady-state area under the plasma concentration curve; Cl: total clearance.
In vivo pharmacokinetics and biodistribution. (A) The plasma levels of native and CaP@LDL-enveloped 3H-ODNs after intravenous administration at 2.5 mg/kg. (B) Representative fluorescence images of Cy3-labeled ODNs in different tissues detected by the Xenogen IVIS imaging system. Scale bar indicates 1 cm. (C) Quantitative analysis of fluorescence signals in diverse organs and tissues. The data of mean fluorescence intensity (MFI) were normalized to corresponding tissues from saline-treated animals. Data are expressed as mean ± S.D., *p < 0.05, **p < 0.01 vs. STAT3-decoy ODN.
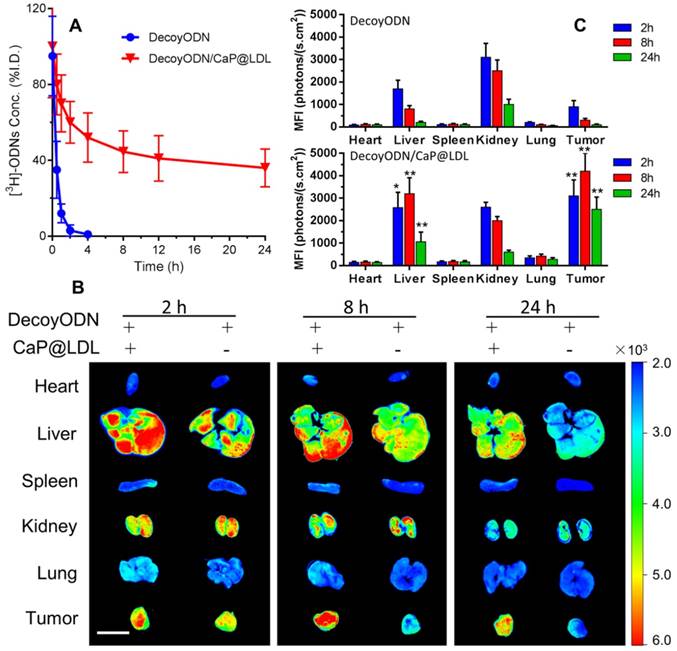
The tissue distributions of Cy3-labeled STAT3-decoy ODNs in the mice were visualized by a Xenogen IVIS imaging system after intravenous administration. It can be seen from Fig. 7B that most of the Cy3 signal was mainly concentrated in the liver and kidney tissues at 4 h after i.v. administration of naked ODNs. Then, the fluorescence intensity rapidly quenched and there was only background fluorescence detected in the tumor tissues at 24 h after dosing. In contrast, the strongest Cy3 signals at 4 h in the tumor tissues were observed from mice dosed with CaP@LDL-enveloped ODNs (Fig. 7C). The fluorescence signals could still be detected at 24 h after administration, indicating that the nanovehicles gradually accumulated in the tumor tissues. It should be noted that there were also strong fluorescence signals in liver tissue from the mice who were treated with CaP@LDL-enveloped ODNs. Due to their relatively high expression in hepatocytes, LDL receptors mediate the endocytosis of cholesterol-rich LDL and remove about 70% of them from the circulation [63].
Tumor growth inhibition
We first evaluated the antitumor activity of STAT3-decoy ODNs in BALB/c nude mice bearing HepG2 xenografts. Mice were treated by intravenous administration of 2.5 mg/kg ODNs every other day. As shown in Fig. 8A, intravenous administration of native STAT3-decoy ODNs showed very poor tumor growth retardation and no significant differences were observed with PBS control (p>0.05). Next we investigated whether decoyODN/CaP@LDL could reverse the resistance to TRAIL and then inhibit tumor growth. Mice were treated by intravenous administration of ODNs (2.5 mg/kg) followed by intraperitoneal administration of TRAIL (100 μg/kg) 24 h later. All groups were treated once every other day for 21 days. As shown in Fig. 8B, treatment with TRAIL alone could not significantly inhibit tumor growth and no significant differences were observed from PBS control (p>0.05). When combined with STAT3-decoy ODNs, TRAIL showed a non-negligible retarding effect on the HepG2 tumor growth as compared to PBS control (p<0.05), although the inhibitory effect on tumor growth is still limited. In contrast, decoyODN/CaP@LDL significantly inhibited tumor growth throughout the treatment period. However, TRAIL plus STAT3-mutant ODNs treatment showed very poor tumor growth retardation and there was no significant difference from TRAIL alone (p>0.05). Moreover, we observed no reduction in the body weight of mice during the examination period (Fig. 8E), indicating that both TRAIL and STAT3-decoy ODNs are biocompatible and the established dosing regimen can be applied for long term cancer treatment.
Reversal effect of STAT3-decoy ODNs on TRAIL in HepG2 hepatocarcinoma xenograft. (A) Inhibition of tumor growth by systemic administration of various ODN formulations (2.5 mg/kg). (B) Inhibition of tumor growth by intraperitoneal administration of TRAIL (100 μg/kg) plus intravenous administration of ODNs (2.5 mg/kg). (C) TUNEL assay of apoptosis in tumor tissue induced by TRAIL and ODNs. Scale bar indicates 100 µm. (D) Quantifying TUNEL analysis of apoptosis in tumor. (E) Weight changes in HepG2 xenografted nude mice after treatment with TRAIL and ODNs. Data are expressed as mean ± S.D., *p < 0.05, **p < 0.01 vs. control; n=5.
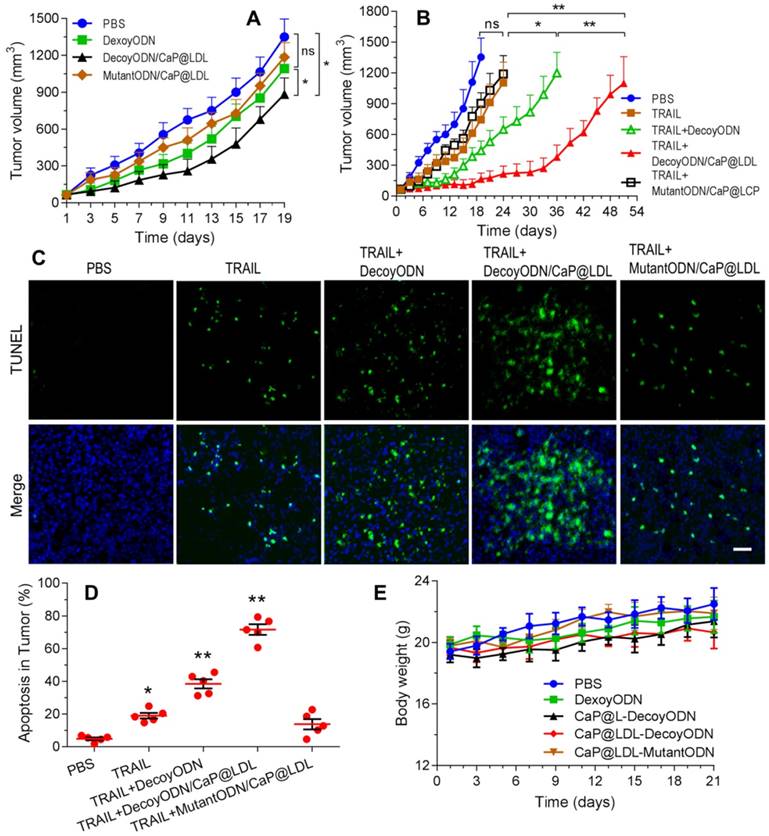
Furthermore, cell apoptosis in the tumors at 21 days of treatment were compared by the terminal deoxynucleotidyl transferase-mediated dUTP nick end-labeling (TUNEL) assay. As shown in Fig. 8C, extensive cell apoptosis (green fluorescent dots) was observed in the TRAIL plus STAT3-decoy ODNs loaded in CaP@LDL group (Fig. 8D), whose apoptosis rate (71.6%) was higher than that of the TRAIL (18.2%) and TRAIL plus naked STAT3-decoy ODNs (35.6%) groups. However, combination with STAT3-mutant ODN loaded in CaP@LDL did not improve apoptosis induction of TRAIL (p>0.05), which is consistent to the tumor growth inhibition test.
It is also noteworthy that the tumor xenografts regained their ability to grow after termination of treatment, although the combination of TRAIL with decoyODN/CaP@LDL induced a nearly complete tumor regression. This observation was consistent with previous studies [64], indicating a complex cellular heterogeneity and plasticity in the development and outcome of resistance to TRAIL, which may be attributed to a shift in pathway signaling and survival of cancer stem cells (CSC) within the tumors. It has been reported that STAT3 plays an important role in maintaining pluripotency and self-renewing processes in embryonic stem cells [65]. Thus, giving the developed nanovehicles CSC targeting ability would render them more efficacious for cancer treatment, which is of value for further investigation.
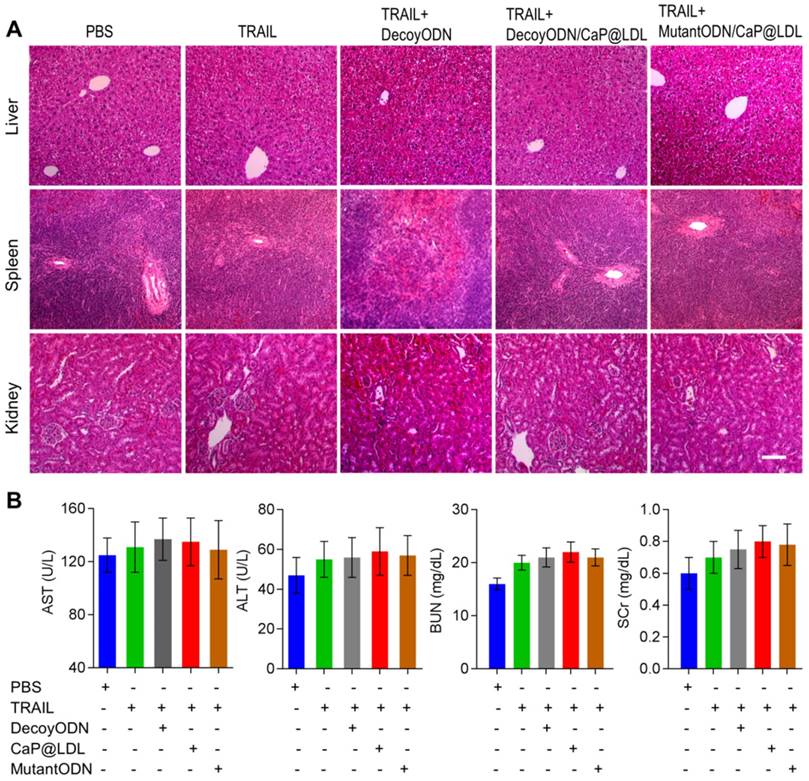
In vivo toxicity evaluation
At the end of treatment, histopathology of major organs was performed to evaluate the in vivo toxicity induced by the combination therapy, especially hepatic and renal function after frequent dosing. As shown in Fig. 9A, there were no noticeable histological changes across tissue samples for all of the four treatment groups. In view of fact that hepatorenal toxicities are the most common side effects during targeted treatment of liver cancer, typical biochemical indexes were determined as indicators of the integrity of the liver and kidney, including serum aspartate aminotransferase (AST), alanine aminotransferase (ALT), blood urea nitrogen (BUN) and serum creatinine (SCr). It is clear from our toxicity evaluations that the effective TRAIL and ODNs amounts used were not extensive enough to cause significant liver and kidney damage (Fig. 9B). Similarly, no significant liver and kidney toxicity were elicited by administration of TRAIL plus STAT3-decoy ODNs (p>0.05). Moreover, hematological analysis was also performed and no myelosuppression was found in the treatment groups (Fig. S7). Further studies to determine long-term safety are required to be completed to prove its utility as a safe tumor inhibitor.
In vivo safety evaluation of TRAIL plus STAT3-decoy ODNs on hepatorenal toxicity and myelosuppression. (A) H&E staining sections of major organs collected from various groups at the endpoint of treatments. Scale bar indicates 200 µm. (B) Serum biochemical value analysis. Data are expressed as mean ± S.D., n=5.
Conclusion
In this study, we successfully developed a biomimetic CaP@LDL for targeted delivery of STAT3-decoy ODNs and reversal of TRAIL resistance in hepatocellular carcinoma therapy. The well-constructed CaP@LDL showed excellent serum stability, highly efficient transfection, and cytosolic STAT3 targeting. More importantly, we have provided evidence that CaP@LDL nanovehicles possess LDL-mimicking pharmacokinetic behavior when systemically administered, which enabled them to efficiently deliver STAT3 decoy-ODNs to regulate TRAIL resistance in vitro and in vivo through blocking STAT3 signaling and consequent expression of downstream target antiapoptotic genes. Our findings highlight that CaP@LDL has the potential for clinical applications in reversing TRAIL resistance in hepatocellular carcinoma therapy.
Abbreviations
TNF: tumor necrosis factor; TRAIL: tumor necrosis factor-related apoptosis-inducing ligand; DR: death receptor; DISC: death-inducing signaling complex; STAT3: signal transducer and activator of transcription 3; ODNs: oligonucleotides; LDL: low-density lipoprotein; RES: reticuloendothelial system; DOPA: 1,2-dioleoyl-sn-glycero-3-phosphate; DOPC: 1,2-dioleoyl-sn-glycero-3-phosphocholine; FBS: fetal bovine serum; DMEM: Dulbecco's Modified Eagles Medium; DPBS: Dulbecco phosphate-buffered saline; TEM: transmission electron microscopy; FT-IR: Fourier transform infrared; EDS: energy dispersive X-ray spectroscopy; TGA: thermal gravimetric analysis; DLS: dynamic light scattering; MTT: 3-(4,5-dimethylthiazol-2-yl)-2,5-diphenyltetrazolium bromide; PVDF: polyvinylidene fluoride; PCR: polymerase chain reaction; TUNEL: TdT-mediated dUTP nick end labeling; H&E: hematoxylin and eosin; BUN: blood urea nitrogen; AST: aspartate aminotransferase; ALT: alanine aminotransferase; SCr: serum creatinine; WBC: white blood cells; LYMF: lymphocytes; GRAN: granulocytes; MONO: monocytes; MRT: mean residence time; AUC: area under the plasma concentration curve; Cl: total clearance.
Supplementary Material
Supplementary figures and tables.
Acknowledgements
The authors wish to thank the National Natural Science Foundation of China (No. 31671020) for financial support.
Competing Interests
The authors have declared that no competing interest exists.
References
1. Johnstone RW, Frew AJ, Smyth MJ. The TRAIL apoptotic pathway in cancer onset, progression and therapy. Nat Rev Cancer. 2008;8:782-98
2. von Karstedt S, Montinaro A, Walczak H. Exploring the TRAILs less travelled: TRAIL in cancer biology and therapy. Nat Rev Cancer. 2017;17:352-66
3. Amarante-Mendes GP, Griffith TS. Therapeutic applications of TRAIL receptor agonists in cancer and beyond. Pharmacol Ther. 2015;155:117-31
4. Hellwig CT, Rehm M. TRAIL signaling and synergy mechanisms used in TRAIL-based combination therapies. Mol Cancer Ther. 2012;11:3-13
5. Seki N, Hayakawa Y, Brooks AD, Wine J, Wiltrout RH, Yagita H. et al. Tumor necrosis factor-related apoptosis-inducing ligand-mediated apoptosis is an important endogenous mechanism for resistance to liver metastases in murine renal cancer. Cancer Res. 2003;63:207-13
6. Stuckey DW, Shah K. TRAIL on trial: preclinical advances in cancer therapy. Trends Mol Med. 2013;19:685-94
7. Dimberg LY, Anderson CK, Camidge R, Behbakht K, Thorburn A, Ford HL. On the TRAIL to successful cancer therapy? Predicting and counteracting resistance against TRAIL-based therapeutics. Oncogene. 2013;32:1341-50
8. Furtek SL, Backos DS, Matheson CJ, Reigan P. Strategies and Approaches of Targeting STAT3 for Cancer Treatment. ACS Chem Biol. 2016;11:308-18
9. Yu H, Lee H, Herrmann A, Buettner R, Jove R. Revisiting STAT3 signalling in cancer: new and unexpected biological functions. Nat Rev Cancer. 2014;14:736-46
10. Bruserud O, Nepstad I, Hauge M, Hatfield KJ, Reikvam H. STAT3 as a possible therapeutic target in human malignancies: lessons from acute myeloid leukemia. Expert Rev Hematol. 2015;8:29-41
11. Banerjee K, Resat H. Constitutive activation of STAT3 in breast cancer cells: A review. Int J Cancer. 2016;138:2570-8
12. Gritsina G, Xiao F, O'Brien SW, Gabbasov R, Maglaty MA, Xu RH. et al. Targeted Blockade of JAK/STAT3 Signaling Inhibits Ovarian Carcinoma Growth. Mol Cancer Ther. 2015;14:1035-47
13. Yu H, Kortylewski M, Pardoll D. Crosstalk between cancer and immune cells: role of STAT3 in the tumour microenvironment. Nat Rev Immunol. 2007;7:41-51
14. Liu X, Wang J, Wang H, Yin G, Liu Y, Lei X. et al. REG3A accelerates pancreatic cancer cell growth under IL-6-associated inflammatory condition: Involvement of a REG3A-JAK2/STAT3 positive feedback loop. Cancer Lett. 2015;362:45-60
15. Chai EZ, Shanmugam MK, Arfuso F, Dharmarajan A, Wang C, Kumar AP. et al. Targeting transcription factor STAT3 for cancer prevention and therapy. Pharmacol Ther. 2016;162:86-97
16. Zhou J, Qu Z, Yan S, Sun F, Whitsett JA, Shapiro SD. et al. Differential roles of STAT3 in the initiation and growth of lung cancer. Oncogene. 2015;34:3804-14
17. Aggarwal BB, Kunnumakkara AB, Harikumar KB, Gupta SR, Tharakan ST, Koca C. et al. Signal transducer and activator of transcription-3, inflammation, and cancer: how intimate is the relationship? Ann N Y Acad Sci. 2009;1171:59-76
18. Groner B, Lucks P, Borghouts C. The function of Stat3 in tumor cells and their microenvironment. Semin Cell Dev Biol. 2008;19:341-50
19. Buettner R, Mora LB, Jove R. Activated STAT signaling in human tumors provides novel molecular targets for therapeutic intervention. Clin Cancer Res. 2002;8:945-54
20. Debnath B, Xu S, Neamati N. Small molecule inhibitors of signal transducer and activator of transcription 3 (Stat3) protein. J Med Chem. 2012;55:6645-68
21. Zhang X, Sun Y, Pireddu R, Yang H, Urlam MK, Lawrence HR. et al. A novel inhibitor of STAT3 homodimerization selectively suppresses STAT3 activity and malignant transformation. Cancer Res. 2013;73:1922-33
22. Mandal PK, Liao WS, McMurray JS. Synthesis of phosphatase-stable, cell-permeable peptidomimetic prodrugs that target the SH2 domain of Stat3. Org Lett. 2009;11:3394-7
23. Souissi I, Ladam P, Cognet JA, Le Coquil S, Varin-Blank N, Baran-Marszak F. et al. A STAT3-inhibitory hairpin decoy oligodeoxynucleotide discriminates between STAT1 and STAT3 and induces death in a human colon carcinoma cell line. Mol Cancer. 2012;11:12
24. Sen M, Thomas SM, Kim S, Yeh JI, Ferris RL, Johnson JT. et al. First-in-human trial of a STAT3 decoy oligonucleotide in head and neck tumors: implications for cancer therapy. Cancer Discov. 2012;2:694-705
25. Souissi I, Najjar I, Ah-Koon L, Schischmanoff PO, Lesage D, Le Coquil S. et al. A STAT3-decoy oligonucleotide induces cell death in a human colorectal carcinoma cell line by blocking nuclear transfer of STAT3 and STAT3-bound NF-kappaB. BMC Cell Biol. 2011;12:14
26. Crinelli R, Bianchi M, Gentilini L, Magnani M. Design and characterization of decoy oligonucleotides containing locked nucleic acids. Nucleic Acids Res. 2002;30:2435-43
27. Crinelli R, Bianchi M, Gentilini L, Palma L, Sorensen MD, Bryld T. et al. Transcription factor decoy oligonucleotides modified with locked nucleic acids: an in vitro study to reconcile biostability with binding affinity. Nucleic Acids Res. 2004;32:1874-85
28. Sun X, Zhang J, Wang L, Tian Z. Growth inhibition of human hepatocellular carcinoma cells by blocking STAT3 activation with decoy-ODN. Cancer Lett. 2008;262:201-13
29. Zhang X, Zhang J, Wang L, Wei H, Tian Z. Therapeutic effects of STAT3 decoy oligodeoxynucleotide on human lung cancer in xenograft mice. BMC Cancer. 2007;7:149
30. Yue P, Turkson J. Targeting STAT3 in cancer: how successful are we? Expert Opin Investig Drugs. 2009;18:45-56
31. Su HT, Li X, Liang DS, Qi XR. Synthetic low-density lipoprotein (sLDL) selectively delivers paclitaxel to tumor with low systemic toxicity. Oncotarget. 2016;7:51535-52
32. Ng KK, Lovell JF, Zheng G. Lipoprotein-inspired nanoparticles for cancer theranostics. Acc Chem Res. 2011;44:1105-13
33. Hevonoja T, Pentikainen MO, Hyvonen MT, Kovanen PT, Ala-Korpela M. Structure of low density lipoprotein (LDL) particles: basis for understanding molecular changes in modified LDL. Biochim Biophys Acta. 2000;1488:189-210
34. Schneider WJ, Nimpf J. LDL receptor relatives at the crossroad of endocytosis and signaling. Cell Mol Life Sci. 2003;60:892-903
35. Montel V, Gaultier A, Lester RD, Campana WM, Gonias SL. The low-density lipoprotein receptor-related protein regulates cancer cell survival and metastasis development. Cancer Res. 2007;67:9817-24
36. Lee JY, Kim JH, Bae KH, Oh MH, Kim Y, Kim JS. et al. Low-density lipoprotein-mimicking nanoparticles for tumor-targeted theranostic applications. Small. 2015;11:222-31
37. Tadros MI, Al-Mahallawi AM. Long-circulating lipoprotein-mimic nanoparticles for smart intravenous delivery of a practically-insoluble antineoplastic drug: Development, preliminary safety evaluations and preclinical pharmacokinetic studies. Int J Pharm. 2015;493:439-50
38. McMahon KM, Thaxton CS. High-density lipoproteins for the systemic delivery of short interfering RNA. Expert Opin Drug Deliv. 2014;11:231-47
39. Ridi F, Meazzini I, Castroflorio B, Bonini M, Berti D, Baglioni P. Functional calcium phosphate composites in nanomedicine. Adv Colloid Interface Sci. 2016
40. Li J, Yang Y, Huang L. Calcium phosphate nanoparticles with an asymmetric lipid bilayer coating for siRNA delivery to the tumor. J Control Release. 2012;158:108-14
41. Haynes MT, Huang L. Lipid-coated calcium phosphate nanoparticles for nonviral gene therapy. Adv Genet. 2014;88:205-29
42. Ma D. Enhancing endosomal escape for nanoparticle mediated siRNA delivery. Nanoscale. 2014;6:6415-25
43. Mulik RS, Bing C, Ladouceur-Wodzak M, Munaweera I, Chopra R, Corbin IR. Localized delivery of low-density lipoprotein docosahexaenoic acid nanoparticles to the rat brain using focused ultrasound. Biomaterials. 2016;83:257-68
44. Shi K, Zhao Y, Miao L, Satterlee A, Haynes M, Luo C. et al. Dual Functional LipoMET Mediates Envelope-type Nanoparticles to Combinational Oncogene Silencing and Tumor Growth Inhibition. Mol Ther. 2017
45. Allijn IE, Leong W, Tang J, Gianella A, Mieszawska AJ, Fay F. et al. Gold nanocrystal labeling allows low-density lipoprotein imaging from the subcellular to macroscopic level. ACS Nano. 2013;7:9761-70
46. Schmittgen TD, Livak KJ. Analyzing real-time PCR data by the comparative C(T) method. Nat Protoc. 2008;3:1101-8
47. Li J, Chen YC, Tseng YC, Mozumdar S, Huang L. Biodegradable calcium phosphate nanoparticle with lipid coating for systemic siRNA delivery. J Control Release. 2010;142:416-21
48. Rensen PC, de Vrueh RL, Kuiper J, Bijsterbosch MK, Biessen EA, van Berkel TJ. Recombinant lipoproteins: lipoprotein-like lipid particles for drug targeting. Adv Drug Deliv Rev. 2001;47:251-76
49. Khadzhiev SN, Kadiev KM, Yampolskaya GP, Kadieva M. Trends in the synthesis of metal oxide nanoparticles through reverse microemulsions in hydrocarbon media. Adv Colloid Interface Sci. 2013;197-198:132-45
50. Bumajdad A, Eastoe J, Zaki MI, Heenan RK, Pasupulety L. Generation of metal oxide nanoparticles in optimised microemulsions. J Colloid Interface Sci. 2007;312:68-75
51. Moore TL, Rodriguez-Lorenzo L, Hirsch V, Balog S, Urban D, Jud C. et al. Nanoparticle colloidal stability in cell culture media and impact on cellular interactions. Chem Soc Rev. 2015;44:6287-305
52. Hymel D, Peterson BR. Synthetic cell surface receptors for delivery of therapeutics and probes. Adv Drug Deliv Rev. 2012;64:797-810
53. Thuenauer R, Muller SK, Romer W. Pathways of protein and lipid receptor-mediated transcytosis in drug delivery. Expert Opin Drug Deliv. 2017;14:341-51
54. Thaxton CS, Rink JS, Naha PC, Cormode DP. Lipoproteins and lipoprotein mimetics for imaging and drug delivery. Adv Drug Deliv Rev. 2016;106:116-31
55. Mi P, Kokuryo D, Cabral H, Kumagai M, Nomoto T, Aoki I. et al. Hydrothermally synthesized PEGylated calcium phosphate nanoparticles incorporating Gd-DTPA for contrast enhanced MRI diagnosis of solid tumors. J Control Release. 2014;174:63-71
56. Herrmann A, Vogt M, Monnigmann M, Clahsen T, Sommer U, Haan S. et al. Nucleocytoplasmic shuttling of persistently activated STAT3. J Cell Sci. 2007;120:3249-61
57. Yuan J, Zhang F, Niu R. Multiple regulation pathways and pivotal biological functions of STAT3 in cancer. Sci Rep. 2015;5:17663
58. Ivanov VN, Zhou H, Partridge MA, Hei TK. Inhibition of ataxia telangiectasia mutated kinase activity enhances TRAIL-mediated apoptosis in human melanoma cells. Cancer Res. 2009;69:3510-9
59. Czabotar PE, Lessene G, Strasser A, Adams JM. Control of apoptosis by the BCL-2 protein family: implications for physiology and therapy. Nat Rev Mol Cell Biol. 2014;15:49-63
60. Zhang L, Fang B. Mechanisms of resistance to TRAIL-induced apoptosis in cancer. Cancer Gene Ther. 2005;12:228-37
61. Fulda S, Meyer E, Debatin KM. Inhibition of TRAIL-induced apoptosis by Bcl-2 overexpression. Oncogene. 2002;21:2283-94
62. Rudling MJ, Angelin B, Peterson CO, Collins VP. Low density lipoprotein receptor activity in human intracranial tumors and its relation to the cholesterol requirement. Cancer Res. 1990;50:483-7
63. Zheng G, Chen J, Li H, Glickson JD. Rerouting lipoprotein nanoparticles to selected alternate receptors for the targeted delivery of cancer diagnostic and therapeutic agents. Proc Natl Acad Sci U S A. 2005;102:17757-62
64. Szegezdi E, O'Reilly A, Davy Y, Vawda R, Taylor DL, Murphy M. et al. Stem cells are resistant to TRAIL receptor-mediated apoptosis. J Cell Mol Med. 2009;13:4409-14
65. Han Z, Wang X, Ma L, Chen L, Xiao M, Huang L. et al. Inhibition of STAT3 signaling targets both tumor-initiating and differentiated cell populations in prostate cancer. Oncotarget. 2014;5:8416-28
Author contact
![]() Corresponding author: Dr. Kai Shi, Department of Pharmaceutics, School of Pharmaceutical Science, Shenyang Pharmaceutical University, Shenyang 117004, China. Tel: +86-24-43520557. Email address: shikaiedu.cn.
Corresponding author: Dr. Kai Shi, Department of Pharmaceutics, School of Pharmaceutical Science, Shenyang Pharmaceutical University, Shenyang 117004, China. Tel: +86-24-43520557. Email address: shikaiedu.cn.