Impact Factor
- Issue 14; 2026
- Issue 13; 2026
- Issue 12; 2026
- Issue 11; 2026
- Issue 10; 2026
- Volume 16; 2026
- Advance Articles
- Past Issues
- Cover Images
- Cover Suggestion
- Index & Coverage
- Special Issues
Introduction
Material and Methods
Results
Discussion
Abbreviations
Acknowledgements
Supplementary Material
References
International Journal of Biological Sciences
International Journal of Medical Sciences
 Global reach, higher impact

Theranostics 2018; 8(5):1256-1269. doi:10.7150/thno.22048 This issue Cite
Research Paper
A low microRNA-630 expression confers resistance to tyrosine kinase inhibitors in EGFR-mutated lung adenocarcinomas via miR-630/YAP1/ERK feedback loop
De-Wei Wu1#, Yao-Chen Wang2#, Lee Wang3, Chih Yi Chen4, Huei Lee1 ![]()
1. Graduate Institute of Cancer Biology and Drug Discovery, Taipei Medical University, Taipei, Taiwan
2. School of Medicine, Chung Shan Medical University, Taichung, Taiwan. Division of Pulmonary Medicine, Department of Internal Medicine, Chung Shan Medical University Hospital, Taichung, Taiwan
3. School of Public Health, Chung Shan Medical University, Taichung, Taiwan
4. Department of Surgery, Chung Shan Medical Hospital, Taichung, Taiwan
#D.-W. Wu and Y.-C. Wang contributed equally to this work.
Received 2017-7-24; Accepted 2017-11-28; Published 2018-2-2
Abstract

Purpose: MicroRNA-630 plays dual roles in apoptosis and drug resistance in human cancers. However, the role of miR-630 in resistance to tyrosine kinase inhibitors (TKIs) in lung adenocarcinoma remains to be elucidated.
Methods: Manipulation of miR-630 and its targeted gene YAP1 and/or combination of inhibitor treatments was performed to explore whether low miR-630 could confer TKI resistance due to de-targeting YAP1, and this could decrease proapoptotic protein Bad expression through the miR-630/YAP1/ERK feedback loop. A retrospective study was conducted to examine whether the expression of miR-630 and YAP1 could be associated with TKI therapeutic response in patients with lung adenocarcinoma.
Results: Low miR-630 expression may confer TKI resistance via increased SP1 binding to the miR-630 promoter due to ERK activation by YAP1 de-targeting. Persistent activation of ERK signaling via the miR-630/YAP1/ERK feedback loop may be responsible for TKI resistance in EGFR-mutated cells. Moreover, a decrease in Bad expression by its phosphorylation at Serine 75 through ERK activation conferred low miR-630-mediated TKI resistance by modulating the apoptotic pathway. Xenographic tumors induced by miR-630-knockdown PC9 and PC9GR cells in nude mice were nearly suppressed by the combination of gefitinib with the YAP1 inhibitor verteporfin or an MEK/ERK inhibitor AZD6244. Patients with low miR-630 and high YAP1 expressing tumors had a higher prevalence of unfavorable responses to TKI therapy and poorer outcomes when compared with their counterparts.
Conclusion: MiR-630 may be a potential biomarker for the prediction of TKI therapeutic response and outcome in patients with lung adenocarcinoma.
Keywords: MiR-630, YAP1, TKI resistance, and lung adenocarcinoma
Introduction
MicroRNA-630 (miR-630) has dual roles in human tumorigenesis. For example, miR-630 inhibits tumor growth and metastasis in esophageal squamous cell carcinoma (1), hepatocellular carcinoma (2), and breast cancer (3), whereas it plays an oncogenic role in renal cell carcinoma (4), colorectal cancer (5), and gastric cancer (6). Additionally, a high expression of miR-630 is associated with favorable prognosis in hepatocellular carcinoma (2), but is correlated with poor prognosis in renal cell carcinoma (7,8), colorectal cancer (5), and gastric cancer (6). However, the role of miR-630 expression in lung tumorigenesis remains to be elucidated.
Drug resistance plays a key role in tumor recurrence and poor outcome. Upregulation of miR-630 by cisplatin treatment arrested A549 lung cancer cells in the G0-G1 phase of the cell cycle due to increased levels of the cell cycle inhibitor p27, and consequently reduced cisplatin-triggered A549 cell death (9). Similarly, miR-630 inhibits proliferation in A549 cells by targeting CDC7 kinase, but it maintains the apoptotic balance by targeting multiple modulators, such as PARP3, DDIT4, EP300, and EP300-downstream p53 (10). By contrast, upregulation of miR-630 by cisplatin, through phosphorylation of △Np63α, promotes apoptosis in head and neck squamous cell carcinoma cells by targeting BCL2, BCL2L2, and YAP1 (11). An increase in miR-630 expression induces adamantly retinoid-related molecular-triggering apoptosis in pancreatic cancer cells by targeting IGF-IR (12). Therefore, miR-630 may also play dual roles in apoptosis and drug resistance in different human cancers.
Tyrosine kinase inhibitors (TKIs), such as gefitinib and erlotinib, are frequently used to treat patients with epidermal growth factor receptor (EGFR)-mutated lung adenocarcinoma. A favorable clinical benefit occurs more frequently in EGFR-mutated lung adenocarcinoma than in EGFR-wild-type lung adenocarcinoma patients (13). Unfortunately, the development of resistance to TKIs is an almost universal occurrence in patients who undergo 10 to 14 months of TKI treatment (14-16). The discovery of the molecular mechanism of TKI resistance in lung adenocarcinoma is therefore essential for the selection of reliable clinical approaches for improving patient outcomes. This is the first report to show that a low miR-630 level may confer an unfavorable response to TKI therapy and poor outcome in patients with lung adenocarcinoma. Mechanistic studies indicated that a feedback loop of miR-630-YAP1-ERK might be responsible for the observed TKI resistance in EGFR-mutated lung adenocarcinoma cells. This resistance is triggered by a decrease in Bad expression due to its phosphorylation in response to ERK signaling.
Material and Methods
Chemicals and antibodies
Gefitinib, Verteporfin and AZD6244 were obtained from Selleckchem (Houston, TX). All other chemicals were acquired from Sigma Chemical (St. Louis, MO), unless otherwise indicated. Anti-phospho-AKT (p-AKT), Anti-AKT, anti-total ERK, and anti-phospho-ERK (p-ERK) antibodies were obtained from Cell Signaling (Danvers, MA). Anti-YAP1 was obtained from Genetex (Irvine CA). All other antibodies were purchased from Santa Cruz Biotechnology (Dallas, TX).
Human study subjects
The human study included 46 patients who underwent resection at China Medical University Hospital in Taichung, Taiwan, between October 2005 and December 2010. The tumor type and stage were determined according to the World Health Organization (WHO) classification system. The median follow-up time was 1591 days (ranging from 151 to 3300 days) and the end of the follow-up period was December 2014. All patients' tumors had EGFR mutation. The detailed status of mutations are shown in Table S1. The IRB protocol DMR101-IRB1-265 was approved by China Medical University Hospital.
Cell lines
PC9, PC9GR and CL97 cells were kindly provided by Dr. James C.-H. Yang and Dr. P.-C. Yang (National Taiwan University Hospital, Taiwan). The other lung cancer cells were obtained from the American Type Culture Collection (ATCC) and cultured as described.
In vivo animal model experiments
The tumor cells were injected subcutaneously into the backs of 4-5-week-old female Balb/c nude mice. The xenograft size was measured every three days and the tumor volume was determined as (length x width2)/2. When tumors grew to 50 mm3, mice were randomized to the following groups: vehicle (DMSO), gefitinib (5 mg/kg), Verteporfin (5 mg/kg), AZD6244 (5 mg/kg), and a combination of two of each of the drugs. Drugs were administered by intraperitoneal injection every three days. These animals were maintained in individual ventilated cages according to the guidelines established in "Guide For The Care and Use of Laboratory Animals" prepared by the Committee on Care and Use of Laboratory Animals of the Institute of Laboratory Animal Resources Commission on Life Sciences, National Research Council, U.S.A. (1985). Use of animals has been approved by the Institutional Animal Care and Use Committee of Taipei Medical University, Taipei, Taiwan (LAC-2017-0025).
Plasmid constructs and transfection
The miR-630 mimic plasmid and miR-630 inhibitor plasmid was purchased from GeneCopoeia (German-town, MD). The Flag-YAP1 (#18881), Myc-Slug (#31698), Flag-Bcl-2 (#18003) and Flag-AXL (#20428) overexpression plasmid was purchased from Addgene (Cambridge, MA). The Bad overexpression plasmid was purchased from Genscript (Piscatway, NJ). YAP1 (TRCN0000107266), Bcl-2 (TRCN0000040071), Slug (TRCN0000015389), AXL (TRCN0000000575) and SP1 shRNA (TRCN0000274153) were purchased from National RNAi Core Facility, Academia Sinica, Taiwan. The mutant Bad (S75A) overexpression plasmid was constructed by the QuickChange site-directed mutagenesis system (Stratagene, La Jolla, CA). These plasmids were transiently transfected into lung cancer cells (1 × 10⁶) using the Turbofect reagent (Formentas, Glen Burnie, MD). After 48 h, cells were harvested to assay in subsequent experiments.
MiR-630 mimic and inhibitor transfection
Cells were grown to confluence in 6-well plates. The miR-630 mimic (40 nM) (Ambion, Foster city, CA), miR-630 inhibitor (80 nM) (Ambion) and negative control (Ambion) cells were transfected using Lipofectamine 3000 transfection reagent (Invitrogen, Foster city, CA) according to the manufacturer's protocol. Transfection efficiency was evaluated by real-time PCR.
MTT cytotoxicity assay
Before treatment, the cells in the exponential growth phase were pretreated with overexpression and knockdown plasmids for 24 h. The in vitro cytotoxic effects of these treatments were determined by MTT assay (at 570 nm) and the cell viability was expressed as a percentage of the control (untreated) cells (% of control).
Annexin V/PI staining
The cells were collected by trypsinization and centrifugation at 1000 × g for 5 min. Following resuspension in binding buffer (10 mM HEPES-NaOH, 140 mM NaCl, 2.5 mM CaCl2) at a final cell density of 1-2 × 10⁶ cells/mL, 100 μL of a single-cell suspension (1-2 × 10⁵ cells) was incubated with 5 μL annexin V-FITC and 5 μL PI for 15 min at room temperature in the dark. After addition of 400 μL of binding buffer, the samples were analyzed with a BD FACS Calibur flow cytometer (BD Biosciences, San Jose, CA) within 1 h. For each sample, 10,000 events were counted.
Real-time quantitative RT-PCR analysis
DNase I-treated total RNA (10 ng) was subjected to microRNA polymerase chain reaction (PCR) analysis with the TaqMan® miRNA Reverse Transcription (RT) Kit (Life technologies, Foster city, CA), miRNA Assays (Life technologies, Foster city, CA), and a Real-Time Thermocycler 7500 (Life technologies, Foster city, CA). RNU6B was used as the small RNA reference housekeeping gene. The following primer sequences were used for amplifyication of the YAP1 gene: the forward primer, 5'- GCTCTTCAACGCCGTCA-3', and the reverse primer, 5'- AGTACTGGCCTGTCGGGAGT-3'. Bcl-2 gene: the forward primer, 5'- CTGTGGATGACTGAGTACC -3' and the reverse primer, 5'- CAGCCAGGAGAAATCAAAC -3'. Slug gene: the forward primer, 5'-GCCTCCAAAAAGCCAAACTACA-3' and the reverse primer, 5'-AGGATCTCTGGTTGTGGTATGACA-3'. IGF1R gene: the forward primer, 5'- ACGGCAGCCAGAGCATGTAC -3' and the reverse primer, 5'- TGCATCCTTGGAGCATCTGA -3'. Bad gene: the forward primer, 5'- GAGCATCGTTCAGCAGCA-3', and the reverse primer, 5'- CATCCCTTCATCTTCCTCAGT-3'. The miR-630 and YAP1 mRNA levels in lung tumors that were higher than the median value were defined as “high”, while levels lower than the median value were defined as “low”.
Chromatin immunoprecipitation (ChIP) assay
ChIP analysis was performed as described in a previous report with the following modifications (17): Immunoprecipitated DNA were re-suspended in 100 µL ddH2O and diluted 1:100 before PCR analysis. PCR amplification of immunoprecipitated DNA was carried out with diluted aliquots, using the primers consisting of the oligonucleotides that encompass the promoter region of miR-630. The forward primer, 5'-GCGGCAGACACCACCAC-3' and the reverse primer, 5'-GGCCGCTGCTATCGCTACTGAG -3' PCR products were separated on 2% agarose gels and analyzed using ethidium bromide staining. All ChIP assays were performed at least twice with similar results.
Western blotting
Western blotting was performed as described in a previous report (18). Human apoptosis antibody array was purchased from Abcam (ab134001; Cambridge, MA). Equal amounts of protein were separated on sodium dodecyl sulfate-polyacrylamide gel electrophoresis (SDS-PAGE) gels and then transferred from the gel onto a polyvinylidene difluoride membrane (PerkinElmer, Norwalk, CT). After blocking, the membranes were reacted with antibody at 4°C overnight, followed by incubation with horseradish peroxidase-conjugated secondary antibody for 1 h. The blots were observed using an enhanced chemiluminescence kit (PerkinElmer).
Statistical analysis
Statistical analysis was performed using the SPSS statistical software (Version 18.0; Chicago, IL.). The association between tumor response and miR-630 and YAP1 mRNA expressions were analyzed by the chi-square test. Survival plots were generated using the Kaplan-Meier method, and differences between patient groups were determined by the log-rank test. Cox regression analysis was performed to determine OS and RFS. The analysis was stratified for all known variables (age, gender, smoking status and tumor stage) and miR-630 and YAP1 mRNA expression. For cell and animal model experiments, P value was calculated by the Student's t-test.
Results
MiR-630 expression levels are associated with gefitinib resistance in EGFR-mutated lung adenocarcinoma cells
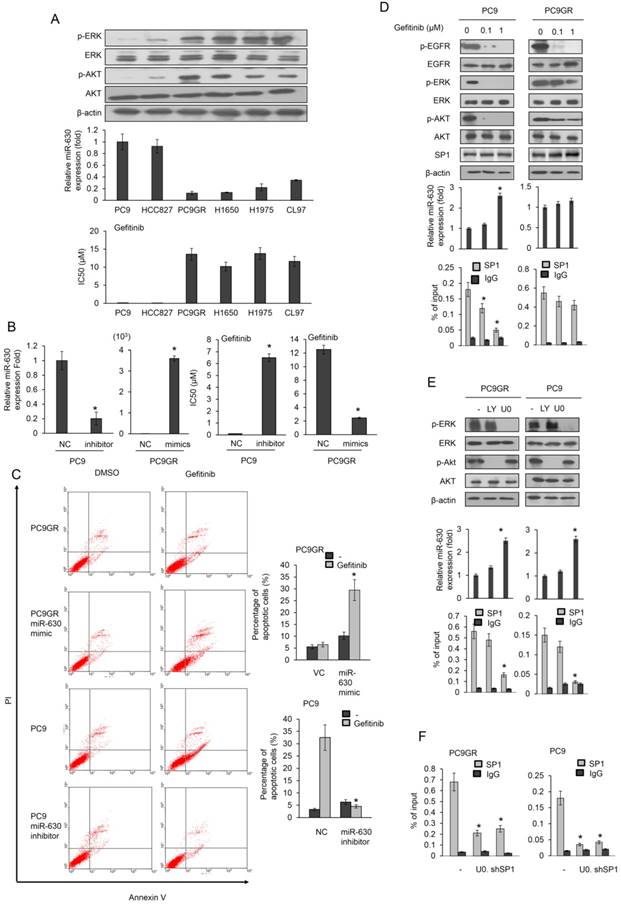
Six EGFR-mutated lung adenocarcinoma cell lines were used to examine the possible association between miR-630 expression levels and gefitinib resistance. Real-time polymerase chain reaction (PCR) analysis revealed significantly higher miR-630 levels in the gefitinib-sensitive PC9 and HCC827 cells than in gefitinib-resistant PC9GR, H1650, H1975, and CL97 cells (Figure 1A upper panel). The inhibitory concentration of gefitinib yielding 50% cell viability (IC50) was calculated from linear dose-response curves using the MTT assay. The IC50 value for gefitinib was markedly lower in PC9 and HCC827 cells than in PC9GR, H1650, H1975, and CL97 cells (Figure 1A). The expression of p-ERK and p-AKT was further negatively associated with miR-630 expression levels and TKI resistance (Figure 1A). These results suggest a possible association between miR-630 and gefitinib resistance in EGFR-mutated lung adenocarcinoma cells.
MiR-630 expression levels are associated with gefitinib resistance and upregulation of miR-630 expression by gefitinib may occur by decreased SP1 binding to the miR-630 promoter due to ERK inactivation in PC9 cells, but not in PC9GR cells. (A) Six lung adenocarcinoma cells were treated with four concentrations of gefitinib. After 24 h, the dose-response curves, determined by the MTT assay, were used to calculate the IC50 values of these cells. MiR-630 expression of these cells was evaluated by real-time PCR. The expression of p-AKT, total AKT, p-ERK, total ERK and β-actin was evaluated by western blotting. (B) MiR-630 inhibitors were transfected into PC9 cells. MiR-630 mimic was transfected into low miR-630 expressing PC9GR cells. After 24 h, the cells were treated with four concentrations of gefitinib to calculate the IC50 values. NC: nonspecific shRNA control. VC: Vector control. P value was calculated by the Student's t-test. The significant differences in experimental groups were compared to NC (*P < 0.05). (C) PC9 and PC9GR cells were transfected with miR-630 inhibitors and mimic for 24 h. These cells were treated with 0.1% DMSO or 10 μM gefitinib for 24 h and then subjected to annexin-V and PI staining, followed by flow cytometry analysis. The percentages of apoptotic cells in the annexin V+/PI- population plus annexin-V+/PI+ are summarized. P value was calculated by the Student's t-test. The significant differences in experimental groups were compared to NC (*P < 0.05) for different treatments. (D) PC9 and PC9GR cells were treated with two concentrations of gefitinib for 5 h and then the cell lysates were evaluated for expression of p-EGFR, p-AKT, total AKT, p-ERK, total ERK, EGFR, and β-actin by western blotting. MiR-630 expression of these cells was evaluated by real-time PCR. The DNA binding activity of SP1 onto the miR-630 promoter was evaluated by ChIP. P value was calculated by the Student's t-test. The significant differences in experimental groups were compared to vehicle treatment (*P < 0.05). (E) PC9GR and PC9 cells were treated with or without ERK (10 μM; U0126 (U0)) and PI3K inhibitor (10 μM; LY294002 (LY)) for 5 h. MiR-630 expression of these cells was evaluated by real-time PCR. The DNA binding activity of SP1 onto the miR-630 promoter was evaluated by ChIP. (F) PC9GR and PC9 cells were transfected with shSP1 for 24 h, followed by treatment with or without ERK (10 μM; U0126 (U0)) for 5 h. The DNA binding activity of SP1 onto the miR-630 promoter was evaluated by ChIP. P value was calculated by the Student's t-test. The significant differences in experimental groups were compared to vehicle treatment (*P < 0.05).
Low miR-630 expression may confer TKI resistance in EGFR-mutated lung adenocarcinoma cells
A miR-630 mimic and inhibitor were transfected into low miR-630-expressing PC9GR and high miR-630-expressing PC9 cells. The IC50 value for gefitinib in PC9 cells was markedly increased by transfection of the miR-630 inhibitor. However, the IC50 value for gefitinib in the PC9GR cells was significantly decreased by transfection of the miR-630 mimic (Figure 1B). Annexin V-PI staining analysis indicated that the apoptosis induced by gefitinib was nearly eliminated by transfection of the miR-630 inhibitor into PC9 cells when compared to transfection with a non-specific miR (NC). Conversely, the percentage of apoptotic cells induced by gefitinib was markedly elevated by transfection of PC9GR cells with the miR-630 mimic when compared to cells transfected with the empty vector (VC) (Figure 1C). In addition, resistance to erlotinib, mediated by low miR-630 levels, was also observed in PC9 and PC9GR cells (Figure S1). These results clearly indicated that low miR-630 expression might confer TKI resistance in EGFR-mutated lung adenocarcinoma cells.
Upregulation of miR-630 expression by gefitinib may occur by decreased SP1 binding to the miR-630 promoter due to ERK inactivation in PC9 cells, but not in PC9GR cells
We next examined whether miR-630 could be upregulated by gefitinib by decreased SP1 binding to the miR-630 promoter following ERK inactivation (19). This would be expected to confer gefitinib sensitivity in PC9 cells, but not in PC9GR cells. Western blotting indicated that the expression of phosphorylated (p)-EGFR, p-ERK, and p-AKT was dose-dependently decreased by gefitinib in PC9 cells, but no decrease of p-ERK and p-AKT expression was observed in PC9GR cells (Figure 1D). Interestingly, miR-630 expression levels were markedly increased by gefitinib treatment in PC9 cells, but not in PC9GR cells (Figure 1D).
Chromatin immunoprecipitation (ChIP) analysis showed that gefitinib treatment markedly reduced the binding activity of SP1 onto the miR-630 promoter in PC9 cells, but not in PC9GR cells (Figure 1D). A time-course experiment conducted to examine the SP1 expression and the recruitment of SP1 to miR-630 promoter between PC9 and PC9GR cells. Western blotting indicated that similar SP1 expression levels were observed in both cell types. MiR-630 expression levels were markedly increased by gefitinib treatment in PC9 cells, but not in PC9GR cells. ChIP assay showed that the binding activity of SP1 onto miR-630 promoter in PC9 cells was gradually markedly decreased during the time intervals (0-10 h), but SP1 binding to miR-630 promoter was slightly decreased in PC9GR cells (Figure S2). A PI3K/AKT inhibitor (LY-294002) and a MEK/ERK inhibitor (U0126) were used to verify the signaling pathway possibly responsible for modulating miR-630 expression. Western blotting showed a decrease in the expression of p-ERK and p-AKT by their respective inhibitors; however, miR-630 expression was elevated by U0126, but not by LY-294002 treatment, in both PC9 and PC9GR cells (Figure 1E). The binding activity of SP1 onto the miR-630 promoter was markedly decreased by U0126 treatment, but was unchanged by LY-294002 treatment (Figure 1E). These results suggest that an increase in SP1 binding activity by ERK activation plays an important role in miR-630 expression in PC9 and PC9GR cells.
The decrease in the binding activity of SP1 onto the miR-630 promoter was further confirmed by SP1 silencing in both cell types (Figure 1F). These results clearly indicated that upregulation of miR-630 by gefitinib occurred in PC9 cells by decreased SP1 binding to the miR-630 promoter due to ERK inactivation, and consequently conferred gefitinib sensitivity, but similar events did not occur in PC9GR cells.
A miR-630/YAP1/ERK feedback loop may be responsible for TKI resistance in EGFR-mutated lung adenocarcinoma cells
MiR-630 modulates cell mobility and apoptosis by targeting YAP1, Bcl-2, Slug, or IGF1R (11,12,19). We therefore examined which of these genes, upon de-targeting by low miR-630, might contribute to TKI resistance. YAP, Slug and Bcl-2 expression were higher in PC9GR than in PC9 cells. However, the IGF1R expression was slightly different in either cell type (Figure 2A). YAP1 expression showed the highest decreases and increases in response to the miR-630 mimic and inhibitor in PC9GR and PC9 cells. A similar pattern, but a smaller response, was observed for Slug and Bcl-2, whereas the IGF1R expression remained unchanged by miR-630 manipulation in either cell type (Figure 2B). Annexin V-PI staining analysis further indicated that the highest increases and decreases in the percentage of apoptotic cells by the miR-630 mimic and inhibitor in PC9GR and PC9 cells were associated with YAP1 expression, followed by Bcl-2 and Slug (Figure 2C). We therefore hypothesized that a miR-630/YAP1/ERK feedback loop could be responsible for TKI resistance.
The miR-630/YAP1/ERK feedback loop may be responsible for gefitinib resistance in EGFR-mutated lung adenocarcinoma cells. (A) The cell lysates of PC9 and PC9GR were evaluated for the expression of YAP1, Bcl-2, Slug, and IGF1R by real-time PCR. (B) MiR-630 inhibitor were transfected into PC9 cells. MiR-630 mimic was transfected into low PC9GR cells. After 48 h, the cells lysates were evaluated for the expression of YAP1, Bcl-2, Slug, and IGF1R by real-time PCR. (C) PC9 cells were transfected with the indicated combination of miR-630 inhibitor, shYAP1, shBcl-2, and shSlug for 24 h. PC9GR cells were transfected with the indicated combination of miR-630 mimic, YAP1, Bcl-2, and Slug overexpression plasmids for 24 h. These cells were treated with 0.1% DMSO or 10 μM of gefitinib for 24 h and were subjected to annexin-V and PI staining, followed by a flow cytometry analysis. The percentages of apoptotic cells in the annexin V+/PI- population plus annexin-V+/PI+ are summarized. (D) PC9 cells were transfected with the indicated combination of miR-630 inhibitor and shYAP1 for 48 h. PC9GR cells were transfected with the indicated combination of miR-630 mimic and YAP1 overexpression plasmids for 48 h. The cells lysates were evaluated for expression of p-AKT, total AKT, p-ERK, total ERK and β-actin by western blotting. (E) YAP1-overexpressing PC9 and PC9GR cells were treated with 10 μM AZD6244 for 5 h. The cell lysates were evaluated for the expression of YAP1, p-ERK, total ERK and β-actin by western blotting. MiR-630 expression of these cells were evaluated by real-time PCR. P value was calculated by the Student's t-test. The significant differences in experimental groups were compared to vehicle or indicated treatment (*P < 0.05). N.s.: Non-significant.
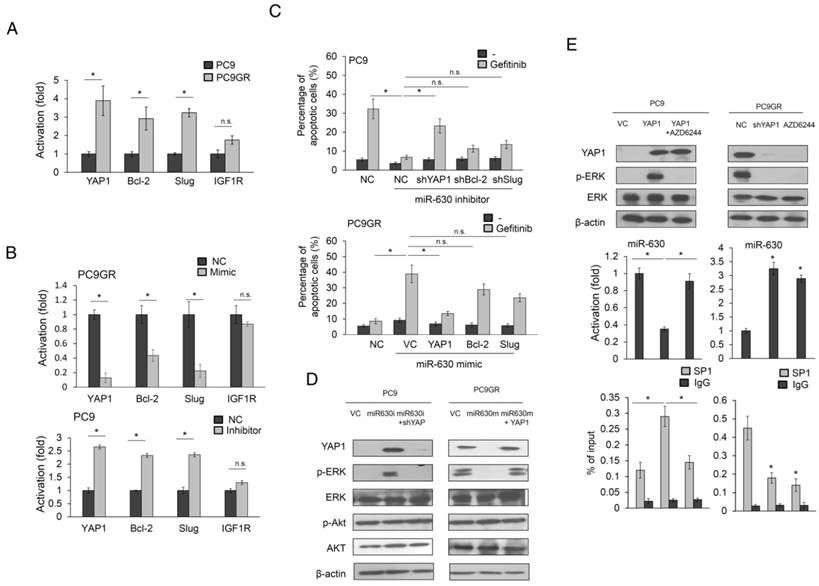
An increase in YAP1 and p-ERK expression was observed in miR-630-knockdown PC9 cells, but the increases in both expressions in response to the miR-630 inhibitor were suppressed by YAP1 silencing. Conversely, the expressions of YAP1 and p-ERK were markedly decreased by transfection of the miR-630 mimic into PC9GR cells, but both expressions were nearly completely reversed by ectopic YAP1 expression (Figure 2D). However, the expressions of ERK, p-AKT, and AKT were unchanged in either cell type subjected to these treatments.
Interestingly, the expression of miR-630 was markedly reduced by YAP1 overexpression in PC9 cells, but this decreased expression was nearly completely restored by AZD6244 treatment (Figure 2E upper left panel). However, miR-630 expression levels in PC9GR cells were markedly elevated by YAP1 silencing or AZD6244 treatment (Figure 2E middle left panel). ChIP analysis indicated that SP1 binding onto miR-630 was promoter markedly elevated in YAP1-overexpressing PC9 cells, but the binding activity of SP1 onto miR-630 promoter was nearly restored in PC9 cells with YAP1 plus AZD6244 treatments (Figure 2E lower left panel). An increased miR-630 expression was observed in YAP1-knowndown PC9GR cells or PC9GR cells with AZD6244 treatment when compared with PC9GR VC cells. The binding activity of SP1 onto miR-630 promoter was markedly decreased by YAP1 silencing or AZD6244 treatment in PC9GR cells (Figure 2E middle and lower right panels). These results indicated that the miR-630/YAP1/ERK feedback loop might be responsible for TKI resistance in EGFR-mutated lung adenocarcinoma cells.
Decreased Bad expression by its phosphorylation at Serine 75 may be responsible for gefitinib resistance via the miR-630/YAP1/ERK feedback loop
An apoptotic protein chip analysis verified which apoptotic gene(s) were responsible for gefitinib resistance mediated by low miR-630 expression. The most significant change in these protein expressions was a higher proapoptotic protein Bad expression in miR-630-overexpressing PC9GR cells than in NC cells (Figure 3A). PC9 and PC9GR cells were transfected with miR-630 inhibitor and mimic and/or co-transfected with a Bad expression plasmid and a small hairpin RNA of Bad (shBad). Western blotting showed that Bad expression was decreased and increased by miR-630 inhibitor and mimic treatments, respectively, but these responses were completely suppressed by transfection of a Bad expression plasmid and shBad into PC9 and PC9GR cells (Figure 3B upper panel). The percentage of apoptotic cells induced by gefitinib was markedly decreased by transfection of the miR-630 inhibitor, but ectopic Bad expression in PC9 cells almost completely restored the decrease in the percentage of apoptotic cells in PC9 cells. By contrast, the percentage of apoptotic cells induced by gefitinib was significantly increased by transfection of the miR-630 mimic, but the increase in apoptotic cells was almost completely reversed by transfection of shBad into PC9GR cells (Figure 3B lower panel).
Decreased Bad expression by its phosphorylation at Serine 75 may be responsible for gefitinib resistance via the miR-630/YAP1/ERK feedback loop. (A) MiR-630 mimic was transfected into PC9GR cells. After 48 h, the cell lysates were evaluated for the expression of apoptotic protein using an apoptotic protein chip analysis. (B) PC9 cells were transfected with the indicated combination of miR-630 inhibitor and Bad overexpression plasmid for 24 h. PC9GR cells were transfected with the indicated combination of miR-630 mimic and shBad for 24 h. These cells were treated with 0.1% DMSO or 10 μM of gefitinib for 24 h and were subjected to annexin-V and PI staining, followed by a flow cytometry analysis. The percentage of apoptotic cells included with the annexin V+/PI- population plus annexin-V+/PI+ is summarized. (C) PC9 cells were transfected with the indicated combination of miR-630 inhibitor and shYAP1 for 48h. PC9GR cells were transfected with the indicated combination of miR-630 mimic and YAP1 overexpression plasmid for 48 h. The cells lysates were evaluated for expression of Bad, p-ERK, total ERK and β-actin by western blotting. (D) PC9 cells transfected with miR-630 inhibitors were treated with 5 μM verteporfin (VP) or 10 μM AZD6244 for 5 h. MiR-630-overexpressing PC9GR cells were treated with 10 μM AZD6244 for 5 h or transfected with YAP1 overexpression plasmid for 48 h. The cell lysates were evaluated for expression of Bad, pS75-Bad, pS99-Bad, p-ERK, total ERK and β-actin by western blotting. The Bad mRNA expression was evaluated by real-time PCR. (E) PC9 cells transfected with miR-630 inhibitors were treated with 5 μM MG132 for 5 h. MiR-630-overexpressing PC9GR cells were transfected with YAP1 overexpression plasmid for 43 h, followed by treatment with 5 μM MG132 for 5 h. The cell lysates were evaluated for expression of Bad, pS75-Bad, pS99-Bad, and β-actin by western blotting. (F) PC9 cells were transfected with indicated combinations of miR-630 inhibitor, wildtype (WT), and S75A mutant (Mut) Bad overexpression plasmids for 24 h. PC9GR cells were transfected with the indicated combination of wildtype (WT) and S75A mutant (Mut) Bad overexpression plasmids for 24 h. The cell lysates were evaluated for expression of Bad, pS75-Bad, p-ERK, total ERK and β-actin by western blotting. (G) PC9 cells were transfected with indicated combinations of miR-630 inhibitor, wildtype (WT), and S75A mutant (Mut) Bad overexpression plasmids for 24 h. PC9GR cells were transfected with the indicated combination of miR-630 mimic, wildtype (WT), and S75A mutant (Mut) Bad overexpression plasmids for 24 h. These cells were treated with 0.1% DMSO or 10 μM of gefitinib for 24 h and were subjected to annexin-V and PI staining, followed by flow cytometry analysis. The percentage of apoptotic cells included with the annexin V+/PI- population plus annexin-V+/PI+ is summarized. P value was calculated by the Student's t-test. The significant differences in experimental groups were compared to vehicle or indicated treatment (*P < 0.05). N.s.: Non-significant.
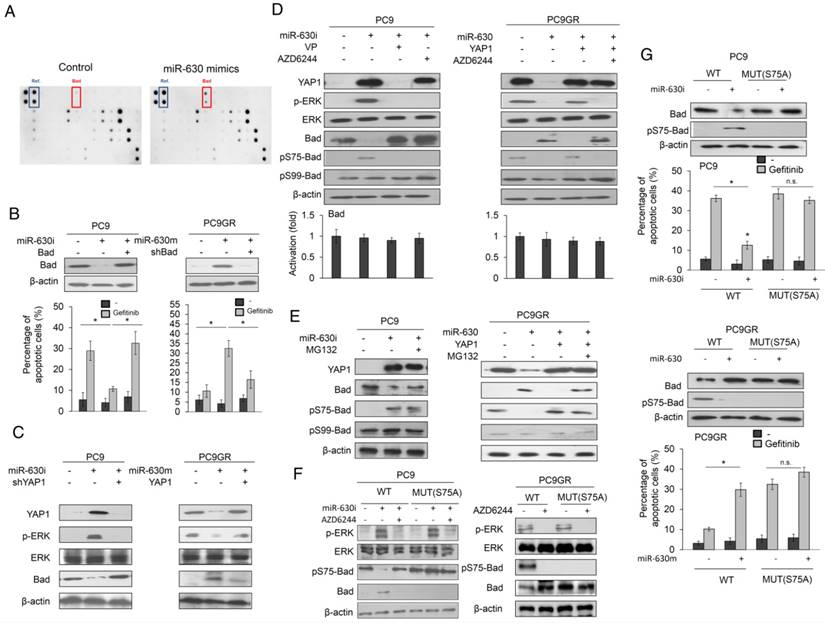
Western blotting further confirmed that Bad expression was markedly increased by the miR-630 mimic, but ectopic YAP1 expression in PC9GR cells prevented this increase (Figure 3C). The reverse phenomenon in Bad expression was observed in PC9 cells treated with the miR-630 inhibitor and/or a combination of ectopic YAP1 expression (Figure 3C). Phosphorylation of Bad protein at Serine 75 and Serine 99 by ERK signaling may decrease Bad expression by its degradation by ubiquitin proteasomes (20-22). We therefore examined p-Bad expression in PC9 and PC9GR cells subjected to miR-630 manipulation combined with verteporfin (VP) or AZD6244 treatment. The increase in p-Bad at Serine 75 (pS75-Bad) expression was almost completely suppressed by VP or AZD6244 in PC9 cells transfected with miR630 inhibitor. Conversely, pS75-Bad expression was nearly eliminated by transfection of the miR-630 mimic into PC9GR cells (Figure 3D). Moreover, the decrease in pS75-Bad expression was rescued by transfection with the miR-630 mimic plus a YAP1 expression plasmid, but this restoration of pS75-Bad expression was nearly eliminated by an additional AZD6244 treatment. However, the pS99-Bad expression was unchanged in either cell type subjected to these treatments (Figure 3D). The expression of pS75-Bad by miR-630 manipulation in both cell types was reversed by MG132 treatment, when compared with their control cells. Real-time PCR analysis indicated that Bad mRNA expression levels in both cell types were unchanged by these treatments (Figure 3D lower panel). However, the decrease in pS75-Bad expression in response to transfection of the miR-630 mimic in PC9GR cells was restored by an additional ectopic YAP1 expression plus MG132 treatment. Similarly, pS99-Bad expression was unchanged in both cell types subjected to these treatments (Figure 3E). We further transfected wild-type or mutant Bad expression vector (S75A) into PC9 and PC9GR cells to examine whether ERK activation by miR-630-mediated YAP1 de-targeting could be responsible for Bad phosphorylation at serine 75. Western blotting showed that the expression of pS75-Bad was markedly decreased by miR-630 inhibitor treatment in PC9 cells with wild-type Bad expression vector transfection. However, the expression of pS75-Bad was nearly unchanged by miR-630 inhibitor and/or AZD6244 treatment in PC9 cells with mutant Bad expression vector transfection. Interestingly, the expression of p-ERK and pS75-Bad was eliminated by AZD6244 treatment in wild-type Bad-overexpressing PC9GR cells. More interestingly, the expression of pS75-Bad completely disappeared in mutant Bad-overexpressing PC9GR cells (Figure 3F).
We next examined whether Bad phosphorylation at Serine-75 could be responsible for Bad degradation by miR-630 loss. We constructed wild-type Bad and mutant Bad (S75A) to test this hypothesis. Pulse-chase experiments indicated that Bad protein expression was slightly decreased during the time intervals (0-9 h) in wild-type Bad-transfected PC9 cells when compared with miR-630-inhibition PC9 cells transfected with wild-type Mcl-1 expression vector (Figure S3A). However, Bad expression was markedly decreased in PC9GR cells with wild-type Bad transfection when compared with wild-type Bad-transfected PC9GR cells with miR-630 overexpression. The Bad protein expression was almost completely unchanged by transfection with mutant Bad (S75A) in PC9 with or without miR-630 inhibitor treatment and in PC9GR cells with or without miR-630 mimic treatment (Figure S3A). The ubiquitin ladder of Bad protein was more revealed in wild-type Bad-transfected PC9GR cells and miR-630-inhibition PC9 cells, but not in both mutant Bad-transfected cell types (Figure S3B). These results clearly indicated that a decrease in Bad expression by miR-630 loss occurs through increased Bad degradation by ERK-induced Bad phosphorylation at Serine-75.
Moreover, we transfected S75A-mutant Bad expression plasmid into PC9 and PC9GR cells to verify whether Bad phosphorylation at Serine 75 could be responsible for low mR-630-mediated TKI resistance. Western blotting showed that Bad expression by miR-630 manipulation was not observed in both cell types transfected with S75A-mutant Bad expression plasmid (Figure 3G left panel). Annexin V-PI staining analysis indicated that the change in percentage of apoptotic cells by miR-630 manipulation was not observed in both cell types transfected with S75A-mutant expression plasmid (Figure 3G right panel). These results clearly indicated that a decrease in Bad expression by its phosphorylation at Serine 75 could be responsible for TKI resistance mediated by low miR-630 levels and the miR-630/YAP1/ERK feedback loop.
Induction of subcutaneous tumors in nude mice by miR-630-knockdown PC9 and PC9GR cells was nearly suppressed by VP+gefitinib or AZD6244+gefitinib
MiR-630-knockdown PC9 and PC9GR cells were subcutaneously injected into nude mice, which were then randomly divided into six groups for treatments with vehicle, gefitinib, VP, VP+gefitinib, AZD6244, or AZD6244+gefitinib at three-day intervals. The tumor burdens of these mice were removed on day 27 for comparisons between PC9- or PC9GR-injected mice with or without gefitinib treatment. The tumor burdens of miR-630-knockdown PC9GR-injected mice with or without gefitinib treatments were also compared to PC9GR-injected mice subjected to the different treatments. The representative tumor burdens induced by miR-630-knockdown PC9 (upper panel) and PC9GR cells (low panel) in each group are shown in Figure 4A. The tumor burdens normally induced by PC9 cells were almost completely eliminated by gefitinib, when compared with vehicle controls. The tumor burdens induced by PC9GR cells were nearly unchanged by gefitinib treatment; however, the tumor burdens normally induced by miR-630-overexpressing PC9GR cells were almost completely eliminated by gefitinib, when compared with vehicle controls. Interestingly, the tumor burdens normally induced by miR-630 knockdown PC9 and PC9GR cells were nearly completely suppressed by VP+gefitinib or AZD6244+gefitinib treatments when compared with their vehicle controls. The suppressive effects on tumor burdens induced by miR-630-knockdown PC9 and PC9GR cells were greater for both combination treatments than for gefitinib, VP, or AZD6244 alone (Figure 4A).
The formation of subcutaneous tumors induced by miR-630-knockdown PC9 and PC9GR cells in nude mice was nearly completely suppressed by VP+gefitinib or AZD6244+gefitinib. (A) The PC9, PC9GR, and miR-630-overexpressing PC9GR xenografts were treated with vehicle and gefitinib (5 mg/kg). The PC9GR and miR-630-inhibiting PC9 xenografts were treated with vehicle, gefitinib (5 mg/kg), verteporfin (5 mg/kg), AZD6244 (5 mg/kg), or a combination. Representative tumor burdens in the ten groups are illustrated. The tumor volumes in the nude mice of the 8 groups were measured at 3-day intervals from Day 9 to Day 27. Mean ± SD values (mm3) were calculated from the tumor volume of five nude mice in each group. (B) The miR-630 expression in tumors of each group of nude mice were evaluated by real-time PCR. (C) Representative immunostaining results of YAP1, p-ERK, Bad, and cleavage caspase-3 in tumors of each group of nude mice. Scale bar is 50 µm (D) The possible model of miR-630 influence on gefitinib resistance in lung adenocarcinoma cells with EGFR mutation. P values were calculated by the Student's t-test. The significant differences in experimental groups were compared to vehicle or indicated treatment (*P < 0.05).
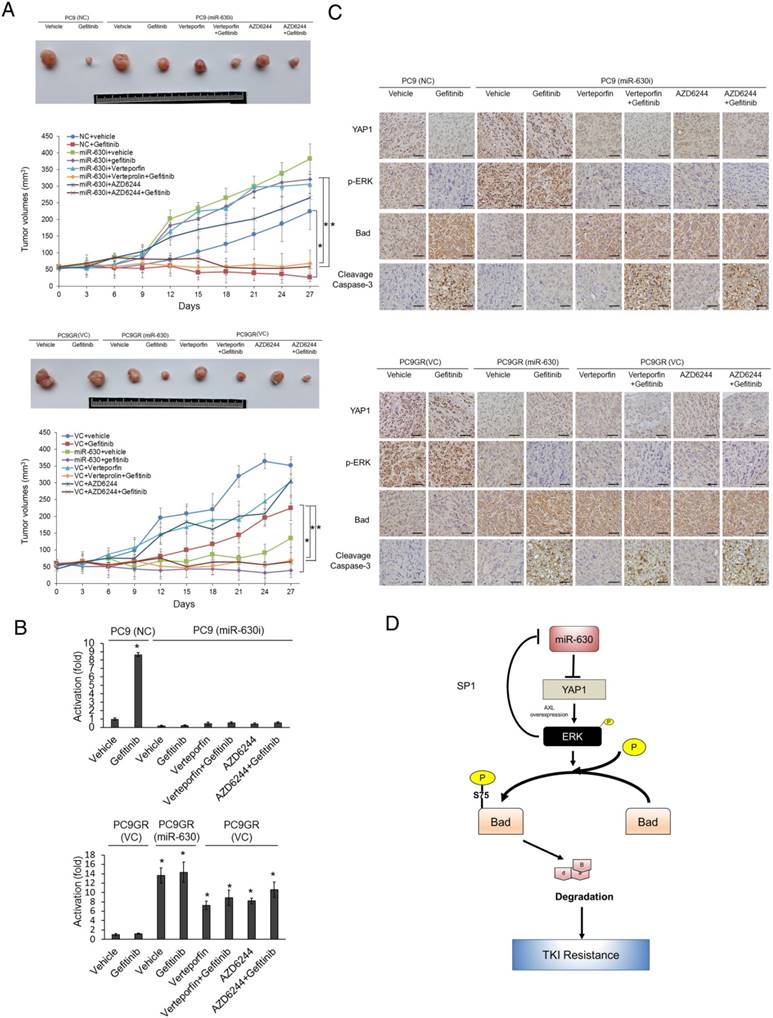
Real-time PCR analysis showed that the expression of miR-630 was significantly increased by gefitinib treatment in tumors induced by the PC9 NC cells (Figure 4B). However, miR-630 level was unchanged by gefitinib in tumors induced by miR-630-inhibition PC9 stable clone with or without Verteporfin or AZD6244, treatment. Conversely, miR-630 level was markedly increased by miR-630 overexpression, Verteporfin, AZD6244, and/or combination with gefitinib, but were unchanged by gefitinib in tumors induced by PC9GR VC cells (Figure 4B). Immunohistochemistry analysis showed increased YAP1 and p-ERK expression and decreased Bad expression in tumors induced by the PC9 NC cells that received gefitinib treatment (Figure 4C). Increased YAP1 and p-ERK expression and decreased Bad expression were found in tumors induced by miR-630-inhibition PC9 stable clone. Moreover, the expression of YAP1 and p-ERK were markedly decreased by Verteporfin, AZD6244, and/or combination with gefitinib, but were unchanged by gefitinib in tumors induced by miR-630-inhibition PC9 stable clone. However, the expression of Bad was markedly increased by Verteporfin, AZD6244, and/or combined with gefitinib, but was unchanged by gefitinib in tumors induced by miR-630-inhibition PC9 stable clone. In addition, the cleavage caspase-3 expression was negatively associated with the changes in tumor burden induced by PC9GR or PAK-overexpressing PC9 cells subjected to the indicated treatments (Figure 4C). Conversely, similar results were revealed for PC9GR VC and MiR-630-overexpressing stable clone. These results from animal models strongly support the mechanistic action of the cell model and suggest that miR-630 loss confers TKI resistance via decreasing Bad expression due to persistent activation of the YAP1/ERK signaling pathway. A proposed mechanism of action of low miR-630-mediated TKI resistance is depicted in Figure 4D.
Relationships of miR-630 expression with clinical parameters and correlation of miR-630 with YAP1 expression in lung adenocarcinoma patients who have undergone TKI therapy
We evaluated miR-630 and YAP1 mRNA expression using real-time PCR in lung tumors from 46 NSCLC patients who had undergone TKI therapy. The median value of miR-630 and YAP1 mRNA in patient tumors was used as a cutoff point to divide tumors into “high” and “low” subgroups. The low miR-630 subgroup was more commonly encountered in advanced tumors (II, III, IV) than in early tumors (I) (68% vs. 29%; Table 1); conversely, the high miR-630 subgroup was more frequently encountered in early tumors than in advanced tumors (71% vs. 32%; P = 0.008). No association of miR-630 and YAP1 mRNA expression with other clinical parameters was observed in this study population (Table 1). Interestingly, a prevalence of high YAP1 expression was more common in the low miR-630 subgroup than in the high miR-630 subgroup (65% vs. 35%, P = 0.039; Table 1). These results obtained from patients supported the mechanism of action indicated by the cell models, and suggested that high YAP1 expression, induced by low miR-630, may confer TKI resistance in lung adenocarcinoma.
Relationships of miR-630 mRNA levels with clinico-pathological parameters, and the association between miR-630 and YAP1 mRNA levels in lung adenocarcinoma patients
| miR-630 | YAP1 | ||||||
|---|---|---|---|---|---|---|---|
| Variables | No. | Low | High | P | Low | High | P |
| Age | |||||||
| ≤60 | 24 | 12 (50) | 12 (50) | 1.000 | 11 (46) | 13 (54) | 0.555 |
| >60 | 22 | 11 (50) | 11 (50) | 12 (55) | 10 (46) | ||
| Gender | |||||||
| Female | 23 | 14 (61) | 9 (39) | 0.140 | 11 (48) | 12 (52) | 0.768 |
| Male | 23 | 9 (39) | 14 (61) | 12 (52) | 11 (48) | ||
| Smoking status | |||||||
| Nonsmokers | 36 | 20 (56) | 16 (44) | 0.153 | 18 (50) | 18 (50) | 1.000 |
| Smokers | 10 | 3 (30) | 7 (70) | 5 (50) | 5 (50) | ||
| Stage | |||||||
| I | 21 | 6 (29) | 15 (71) | 0.008 | 12 (57) | 9 (43) | 0.375 |
| II, III, IV | 25 | 17 (68 ) | 8 (32) | 11 (44) | 14 (56) | ||
| miR-630 | |||||||
| Low | 23 | 8 (35) | 15 (65) | 0.039 | |||
| High | 23 | 15 (65) | 8 (35) | ||||
Low miR-630 and high YAP1 mRNA levels are associated with unfavorable response to TKI therapy in lung adenocarcinoma patients
We next examined the possibility that low miR-630 and high YAP1 mRNA levels in lung adenocarcinoma patients could be associated with an unfavorable response to TKI. A higher unfavorable response to TKI was observed in the low miR-630 and high YAP1 mRNA subgroup than in the high miR-630 and low YAP1 mRNA subgroup, respectively (70% vs. 30%, P = 0.038 for miR-630, 83% vs. 17%, P < 0.001 for YAP1 mRNA; Table 2). These results strongly support the mechanism of action of the cell model, indicating that TKI resistance mediated by low miR-630 via decreased Bad expression may be through the miR-630/YAP1/ERK feedback loop (Figure 4).
The association of miR-630 and YAP1 mRNA levels with response to TKI therapy in lung adenocarcinoma patients.
| Response to TKI therapy | ||||
|---|---|---|---|---|
| Variables | Patient No. | Unfavorable (%) | Favorable (%) | P |
| miR-630 | ||||
| Low | 23 | 16 (70) | 7 (30) | 0.038 |
| High | 23 | 9 (39) | 14 (61) | |
| YAP1 | ||||
| Low | 23 | 6 (26) | 17 (74) | <0.001 |
| High | 23 | 19 (83) | 4 (17) | |
Unfavorable response is defined as a ≥25% increase in the size or number of tumors; else, favorable response. The median values of miR-630 and YAP1 mRNA levels were used as cutoff points to divide patients into “high” and “low” subgroups
Low miR-630 and high YAP1 mRNA expression are associated with poorer overall survival (OS) and relapse free survival (RFS) than their counterparts
We enrolled 46 patients with lung adenocarcinoma who had received TKI therapy. We examined whether miR-630 and YAP1 expression could be associated with prognosis in this study population. Kaplan-Meier analysis showed a poorer OS and RFS in the low miR-630 and high YAP1 mRNA subgroup than in high miR-630 and low YAP1 mRNA subgroup (OS: P = 0.001 for miR-630, P < 0.001 for YAP1 mRNA; RFS: P = 0.014 for miR-630, P = 0.001 for YAP1 mRNA; Figure 4S). Cox regression analysis further confirmed a worse OS and RFS in the subgroup with low miR-630 and high YAP1 mRNA than in the subgroup with high miR-630 and low YAP1 mRNA (Table S1). The hazard ratio (HR) values in the low miR-630 and high YAP1 mRNA subgroup were higher when the high miR-630 and low YAP1 mRNA subgroup was used as reference (OS: 95% CI, 1.97-22.9, P = 0.002 for miR-630, 95% CI, 1.99-20.1, P = 0.002 for YAP1 mRNA; RFS: 95% CI, 1.27-6.69, P = 0.012 for miR-630, 95% CI, 1.31-5.70, P = 0.007; Table S2). These results suggested that low miR-630 and high YAP1 mRNA levels in lung adenocarcinoma patients who have received TKI therapy were associated with poorer OS and RFS than their counterparts.
Discussion
We have provided molecular evidence to demonstrate that low miR-630 expression may promote ERK activation via de-targeting of YAP1. This, in turn, suppresses miR-630 transcription by increased SP1 binding to the miR-630 promoter. Therefore, low miR-630 expression may confer TKI resistance due to ERK activation by YAP1 de-targeting, and the miR-630/YAP1/ERK feedback loop may persistently confer TKI resistance in EGFR-mutated lung adenocarcinoma cells (Figures 1 and 2). These results were similar to those reported in a previous study indicating that angiopoietin-like protein 1 suppressed Slug and inhibited cancer cell mobility due to increased transcription of miR-630 triggered in an integrin α1β1/FAK/ERK/SP1 pathway-dependent manner (19).
Phospho-△N63α upregulates miR-630 to target BCL2, BCL2L2, YES1, and YAP1 and consequently to confer chemo-sensitivity (11). MiR-630 induces apoptosis in pancreatic cancer cells by targeting IGF-1R (12). This targeting of IGF-1R by miR-630 regulates the response to HER-targeting drugs and overall cancer cell progression in HER2-overexpressing breast cancer (23). However, in the present study, targeting of YAP1 by miR-630 plays a more important role than targeting of BCL2 or IGF-1R in miR-630-mediated TKI sensitivity (Figure 2).
We and other groups have indicated that ERK signaling plays a critical role in TKI resistance of EGFR-mutated lung adenocarcinoma (24,25). YAP1 may act as a transcription factor to activate ERK signaling via upregulation of AXL and EGFR expression and consequently conferring TKI resistance in lung cancer (18,26,27). EGFR was targeted by miR-630, as it also targets IGF-1R and HER2 in head and neck cancer cells, thereby conferring sensitivity to HER-targeting drugs (23). However, no change in EGFR expression by miR-630 manipulation was observed in PC9 and PC9GR cells (Figure S5). Inhibition of ERK decreases YAP1 expression at the post-translational level, but ERK signaling was reactivated by ectopic YAP1 expression in lung cancer cells (28). We therefore suggest that the reciprocal activation of the YAP1/ERK axis, rather than the EGFR signaling, may play a key role in TKI resistance in lung cancer mediated by low miR-630.
YAP1 may activate ERK signaling via upregulation of AXL expression (26). We therefore examined whether ERK signaling was regulated by miR-630 via upregulation of AXL expression. An increase in AXL and p-ERK expression was observed in YAP1-overexpressing PC9 cells, but the increases in both protein expressions in response to ectopic YAP1 expression can be suppressed by AXL silencing. Conversely, the expressions of AXL and p-ERK were markedly decreased by YAP1 knockdown in PC9GR cells, but both protein expressions were nearly completely reversed by ectopic AXL expression (Figure S6A). An increase in p-ERK expression was rescued by transfection with the miR-630 inhibitor plus a YAP1 knockdown; however, the decrease of p-ERK expression was nearly rescued by transfection with AXL overexpression plasmid (Figure S6B). Moreover, a decrease in p-ERK expression was restored by transfection with the miR-630 inhibitor plus a YAP1-overexpressing plasmid, but the restoration of p-ERK expression was nearly eliminated by AXL knockdown (Figure S6B). We therefore suggest that activation of YAP1/ERK axis via AXL signaling may play a key role in low miR-630-mediated TKI resistance in lung cancer.
Src-YAP1 axis has been known to cooperate with STAT3 signaling to confer TKI resistance in EGFR-mutated lung adenocarcinoma cells (29). Inhibition of Src phosphorylation by Dasatinib plus TKI completely suppressed phosphorylation of AKT and ERK and in turn overcame TKI resistance in PC9GR cells (30). To verify whether the involvement of Src signaling pathway in low miR-630-mediated TKI resistance exists, PC9 cells were treated with miR-630 inhibitor and/or Dasatinib. Western blotting showed that p-Src expression was not changed by miR-630 inhibitor. In addition, p-ERK expression was increased by miR-630 inhibitor but was not changed by miR-630 inhibitor combination with Dasatinib in PC9 cells (Figure S7). These results suggest that the involvement of Src signaling pathway in low miR-630-mediated TKI resistance was not observed in EGFR-mutated lung adenocarcinoma cells.
ERK activation of Bad phosphorylation via the miR-630/YAP1/ERK feedback loop conferred TKI resistance mediated by low miR-630 expression (Figure 3). However, ERK signaling was not activated by Bad manipulation in PC9GR and PC9 cells (Figure S8). A previous report indicated that Bad expression decreased through proteasomal degradation following its phosphorylation at Serine 75 by C-RAF-mediated MEK and the RAF pathway (31), in agreement with the present study (Figure 3). Moreover, Bad phosphorylation at Serine 75 was associated with ovarian cancer chemosensitivity and patient survival, but neither association was observed for Bad phosphorylation at Serine 99 (32). We therefore suggest that decreased Bad expression due to its phosphorylation at Serine 75 via the miR-630/YAP1/ERK feedback loop may play a critical role in TKI resistance mediated by low miR-630.
In summary, we have provided evidence from cells, animals, and patients that support the hypothesis that low miR-630 may confer TKI resistance in lung adenocarcinoma (PC9 and PC9GR cells) via the miR-630/YAP1/ERK feedback loop. Similar observations were shown in HCC827 and H1975 cells (Figure S9). We therefore suggest that combinations of the YAP1 inhibitor VP or the MEK/ERK inhibitor AZD6244 with TKI may suppress TKI resistance and tumor recurrence, thereby improving outcomes in EGFR-mutated lung adenocarcinoma patients who have undergone TKI therapy.
Abbreviations
MiR-630: microRNA-630; TKI: tyrosine kinase inhibitor; EGFR: epidermal growth factor receptor; p-AKT: phospho-AKT; p-ERK: phospho-ERK; PCR: polymerase chain reaction; RT: reverse transcription; IC50: the inhibitory concentration of gefitinib yielding 50% cell viability; PI: propidium iodide; FITC: fluorescein isothiocyanate; MTT: 3-(4,5-Dimethylthiazol-2-yl)-2,5-diphenyltetrazolium bromide; ChIP: chromatin immunoprecipitation; SDS-PAGE: sodium dodecyl sulfate-polyacrylamide gel electrophoresis; OS: overall survival; RFS: relapse free survival; ATCC: American Type Culture Collection); shRNA: small hairpin RNA; NC: non-specific shRNA; VC: vector control; HR: Hazard ratio.
Acknowledgements
This work was jointly supported by grants from Tung's Taichung Metro-Harbor Hospital (TTM-TMU-106-02), lung cancer research fund, Taipei Medical University (104-6602-001-400), and the Ministry of Science and Technology in Taiwan, ROC (105-2320-B-038 -057; 105-2325-B-038 -003 -CC2).
Supplementary Material
Supplementary figures and tables.
Competing Interests
The authors have declared that no competing interest exists.
References
1. Jin L, Yi J, Gao Y, Han S, He Z, Chen L. et al. MiR-630 inhibits invasion and metastasis in esophageal squamous cell carcinoma. Acta Biochim Biophys Sin (Shanghai). 2016;48:810-819
2. Chen WX, Zhang ZG, Ding ZY, Liang HF, Song J, Tan XL. et al. MicroRNA-630 suppresses tumor metastasis through the TGF-beta- miR-630-Slug signaling pathway and correlates inversely with poor prognosis in hepatocellular carcinoma. Oncotarget. 2016;7:22674-22686
3. Zhou CX, Wang CL, Yu AL, Wang QY, Zhan MN, Tang J. et al. MiR-630 suppresses breast cancer progression by targeting metadherin. Oncotarget. 2016;7:1288-1299
4. Zhao JJ, Chen PJ, Duan RQ, Li KJ, Wang YZ, Li Y. miR-630 functions as a tumor oncogene in renal cell carcinoma. Arch Med Sci. 2016;12:473-478
5. Chu D, Zheng J, Li J, Li Y, Zhang J, Zhao Q. et al. MicroRNA-630 is a prognostic marker for patients with colorectal cancer. Tumour Biol. 2014;35:9787-9792
6. Chu D, Zhao Z, Li Y, Li J, Zheng J, Wang W. et al. Increased microRNA-630 expression in gastric cancer is associated with poor overall survival. PLoS One. 2014;9:e90526
7. Gu L, Li H, Chen L, Ma X, Gao Y, Li X. et al. MicroRNAs as prognostic molecular signatures in renal cell carcinoma: a systematic review and meta-analysis. Oncotarget. 2015;6:32545-32560
8. Zhao JJ, Chen PJ, Duan RQ, Li KJ, Wang YZ, Li Y. Up-regulation of miR-630 in clear cell renal cell carcinoma is associated with lower overall survival. Int J Clin Exp Pathol. 2014;7:3318-3323
9. Galluzzi L, Morselli E, Vitale I, Kepp O, Senovilla L, Criollo A. et al. miR-181a and miR-630 regulate cisplatin-induced cancer cell death. Cancer Res. 2010;70:1793-1803
10. Cao JX, Lu Y, Qi JJ, An GS, Mao ZB, Jia HT. et al. MiR-630 inhibits proliferation by targeting CDC7 kinase, but maintains the apoptotic balance by targeting multiple modulators in human lung cancer A549 cells. Cell Death Dis. 2014;5:e1426
11. Huang Y, Chuang A, Hao H, Talbot C, Sen T, Trink B. et al. Phospho-DeltaNp63alpha is a key regulator of the cisplatin-induced microRNAome in cancer cells. Cell Death Differ. 2011;18:1220-1230
12. Farhana L, Dawson MI, Murshed F, Das JK, Rishi AK, Fontana JA. Upregulation of miR-150* and miR-630 induces apoptosis in pancreatic cancer cells by targeting IGF-1R. PLoS One. 2013;8:e61015
13. Pao W, Chmielecki J. Rational, biologically based treatment of EGFR-mutant non-small-cell lung cancer. Nat Rev Cancer. 2010;10:760-774
14. Bell DW, Gore I, Okimoto RA, Godin-Heymann N, Sordella R, Mulloy R. et al. Inherited susceptibility to lung cancer may be associated with the T790M drug resistance mutation in EGFR. Nat Genet. 2005;37:1315-1316
15. Turke AB, Zejnullahu K, Wu YL, Song Y, Dias-Santagata D, Lifshits E. et al. Preexistence and clonal selection of MET amplification in EGFR mutant NSCLC. Cancer Cell. 2010;17:77-88
16. Sequist LV, Waltman BA, Dias-Santagata D, Digumarthy S, Turke AB, Fidias P. et al. Genotypic and histological evolution of lung cancers acquiring resistance to EGFR inhibitors. Sci Transl Med. 2011;3:75ra26
17. Wu DW, Wu TC, Wu JY, Cheng YW, Chen YC, Lee MC. et al. Phosphorylation of paxillin confers cisplatin resistance in non-small cell lung cancer via activating ERK-mediated Bcl-2 expression. Oncogene. 2014;33:4385-4395
18. Song S, Honjo S, Jin J, Chang SS, Scott AW, Chen Q. et al. The Hippo Coactivator YAP1 Mediates EGFR Overexpression and Confers Chemoresistance in Esophageal Cancer. Clin Cancer Res. 2015;21:2580-2590
19. Kuo TC, Tan CT, Chang YW, Hong CC, Lee WJ, Chen MW. et al. Angiopoietin-like protein 1 suppresses SLUG to inhibit cancer cell motility. J Clin Invest. 2013;123:1082-1095
20. Liu Y, Sun SY, Owonikoko TK, Sica GL, Curran WJ, Khuri FR. et al. Rapamycin induces Bad phosphorylation in association with its resistance to human lung cancer cells. Mol Cancer Ther. 2012;11:45-56
21. Eisenmann KM, VanBrocklin MW, Staffend NA, Kitchen SM, Koo HM. Mitogen-activated protein kinase pathway-dependent tumor-specific survival signaling in melanoma cells through inactivation of the proapoptotic protein bad. Cancer Res. 2003;63:8330-8337
22. Chao OS, Clement MV. Epidermal growth factor and serum activate distinct pathways to inhibit the BH3 only protein BAD in prostate carcinoma LNCaP cells. Oncogene. 2006;25:4458-4469
23. Corcoran C, Rani S, Breslin S, Gogarty M, Ghobrial IM, Crown J. et al. miR-630 targets IGF1R to regulate response to HER-targeting drugs and overall cancer cell progression in HER2 over-expressing breast cancer. Mol Cancer. 2014;13:71
24. Wu DW, Chen CY, Chu CL, Lee H. Paxillin confers resistance to tyrosine kinase inhibitors in EGFR-mutant lung cancers via modulating BIM and Mcl-1 protein stability. Oncogene. 2016;35:621-630
25. Huang MH, Lee JH, Chang YJ, Tsai HH, Lin YL, Lin AM. et al. MEK inhibitors reverse resistance in epidermal growth factor receptor mutation lung cancer cells with acquired resistance to gefitinib. Mol Oncol. 2013;7:112-120
26. Li M, Lu J, Zhang F, Li H, Zhang B, Wu X. et al. Yes-associated protein 1 (YAP1) promotes human gallbladder tumor growth via activation of the AXL/MAPK pathway. Cancer Lett. 2014;355:201-209
27. Lee JE, Park HS, Lee D, Yoo G, Kim T, Jeon H. et al. Hippo pathway effector YAP inhibition restores the sensitivity of EGFR-TKI in lung adenocarcinoma having primary or acquired EGFR-TKI resistance. Biochem Biophys Res Commun. 2016;474:154-160
28. You B, Yang YL, Xu Z, Dai Y, Liu S, Mao JH. et al. Inhibition of ERK1/2 down-regulates the Hippo/YAP signaling pathway in human NSCLC cells. Oncotarget. 2015;6:4357-4368
29. Chaib I, Karachaliou N, Pilotto S, Codony Servat J, Cai X, Li X. et al. Co-activation of STAT3 and YES-Associated Protein 1 (YAP1) Pathway in EGFR-Mutant NSCLC. J Natl Cancer Inst. 2017 109
30. Yoshida T, Zhang G, Smith MA, Lopez AS, Bai Y, Li J. et al. Tyrosine phosphoproteomics identifies both codrivers and cotargeting strategies for T790M-related EGFR-TKI resistance in non-small cell lung cancer. Clin Cancer Res. 2014;20:4059-4074
31. Boisvert-Adamo K, Aplin AE. Mutant B-RAF mediates resistance to anoikis via Bad and Bim. Oncogene. 2008;27:3301-3312
32. Marchion DC, Cottrill HM, Xiong Y, Chen N, Bicaku E, Fulp WJ. et al. BAD phosphorylation determines ovarian cancer chemosensitivity and patient survival. Clin Cancer Res. 2011;17:6356-6366
Author contact
![]() Corresponding author: H. Lee, Ph. D., Professor, Graduate Institute of Cancer Biology and Drug Discovery, Taipei Medical University, Room 5, 12th floor, F building, No. 3, Park Street, Nangang District, Taipei 115, Taiwan. Tel: 886-2-27361661 ext. 7616; Fax: 886-2-26558562; E-mail: hledu.tw
Corresponding author: H. Lee, Ph. D., Professor, Graduate Institute of Cancer Biology and Drug Discovery, Taipei Medical University, Room 5, 12th floor, F building, No. 3, Park Street, Nangang District, Taipei 115, Taiwan. Tel: 886-2-27361661 ext. 7616; Fax: 886-2-26558562; E-mail: hledu.tw