Impact Factor
- Issue 14; 2026
- Issue 13; 2026
- Issue 12; 2026
- Issue 11; 2026
- Issue 10; 2026
- Volume 16; 2026
- Advance Articles
- Past Issues
- Cover Images
- Cover Suggestion
- Index & Coverage
- Special Issues
Introduction
Materials and Methods
Results and Discussion
Conclusion
Abbreviations
Acknowledgements
Supplementary Material
References
International Journal of Biological Sciences
International Journal of Medical Sciences
 Global reach, higher impact

Theranostics 2018; 8(6):1558-1574. doi:10.7150/thno.22989 This issue Cite
Research Paper
Oxygen-generating Hybrid Polymeric Nanoparticles with Encapsulated Doxorubicin and Chlorin e6 for Trimodal Imaging-Guided Combined Chemo-Photodynamic Therapy
DanRong Hu, LiJuan Chen, Ying Qu, JinRong Peng, BingYang Chu, Kun Shi, Ying Hao, Lin Zhong, MengYao Wang, ZhiYong Qian ![]()
State Key Laboratory of Biotherapy and Cancer Center, West China Hospital, West China Medical School, Sichuan University, and Collaborative Innovation Center. Chengdu 610041, PR China
Received 2017-9-25; Accepted 2017-12-8; Published 2018-2-7
Abstract

The combination of chemotherapy with photodynamic therapy (PDT) has attracted broad attention as it can overcome limitations of conventional chemo-treatment by using different modes of action. However, the efficacy of PDT to treat solid tumors is severely affected by hypoxia in tumors.
Methods: In this study, we developed oxygen-generating theranostic nanoparticles (CDM NPs) by hierarchically assembling doxorubicin (DOX), chlorin e6 (Ce6) and colloidal manganese dioxide (MnO2) with poly (ε-caprolactone-co-lactide)-b-poly (ethylene glycol)-b-poly (ε-caprolactone-co-lactide) for treating breast cancer. The in vitro and in vivo antitumor efficacy and imaging performance were investigated.
Results: The theranostic nanoparticles showed high stability and biocompatibility both in vitro and in vivo. MnO2 within the nanoparticles could trigger decomposition of excessive endogenous H2O2 in the tumor microenvironment to generate oxygen in-situ to relieve tumor hypoxia. With enhanced oxygen generation, the PDT effect was significantly improved under laser-irradiation. More importantly, this effect together with that of DOX was able to dramatically promote the combined chemotherapy-PDT efficacy of CDM NPs in an MCF-7 tumor-bearing mouse model. Furthermore, the real-time tumor accumulation of the nanocomposites could be monitored by fluorescence imaging, photoacoustic (PA) imaging and magnetic resonance imaging (MRI).
Conclusion: The designed CDM NPs are expected to provide an alternative way of improving antitumor efficacy by combined chemo-PDT further enhanced by oxygen generation, and would have broad applications in cancer theranostics.
Keywords: Multifunctional nanoparticles, manganese dioxide nanoparticles, hypoxia relieve, oxygen generation, combination therapy, theranostics
Introduction
Chemotherapy has long been an important therapeutic option for several types of malignancies. Doxorubicin (DOX) is one of the most effective antitumor drugs and is used to treat a wide variety of tumors, but severe cardiotoxicity and myelosuppression hamper its clinical dosage regimens [1]. To date, numerous nanosized drug delivery systems have been developed to ameliorate the therapeutic performance and biosafety of DOX, including nanoparticles [2], liposomes [3], micelles [4] and dendrimers [5]. Nonetheless, cancer therapy currently relying on a single treatment remains unsatisfying due to tumor heterogeneity, drug resistance, or frequent relapses. Considering the complex tumor structures and unique tumor microenvironment (TME), a combination of therapeutic approaches with different drugs and/or mechanisms may cooperatively boost therapeutic efficacy and simultaneously reduce the side effects of cancer chemotherapy [6].
Photodynamic therapy (PDT), a minimally-invasive modality that kills cancer cells by the cytotoxic singlet oxygen (1O2) generated from light-activated photosensitizers (PSs), has attracted broad attention in recent years [7-13]. Based on the attractive antitumor outcomes of PDT, the combined treatment of PDT and chemotherapy may optimize cancer treatment and achieve enhanced antitumor efficacy. However, as an oxygen (O2)-requiring therapy, the efficacy of PDT to treat solid tumors is severely affected by the pre-existence of hypoxia in tumors originating from the heterogeneous tumor cell proliferation and dysfunctional vasculature and lymphatic systems [14-20]. So far, to overcome the hypoxia-associated poor response of PDT, a few strategies have been introduced to modify the hypoxic TME and to promote the oxygenation of tumors [21-24]. For instance, artificial blood substitutes, such as perfluorocarbon-based O2 nanoparticles used to deliver O2 to tumor sites, have been utilized to ameliorate hypoxia, and have shown the improved therapeutic efficacy of PDT [25, 26]. Nevertheless, developing smart nano-therapeutics sensitive to the TME for better PDT efficacy is still challenging. Recently, various manganese oxide (MnO2) nanostructures have been used to relieve tumor hypoxia in situ by catalyzing the decomposition of excessive endogenous hydrogen peroxide (H2O2) and producing O2 inside solid tumors thereby significantly promoting treatment outcomes of radiotherapy and PDT [27-31]. Moreover, the reduction product Mn2+ offers strong T1-weighted contrast signal for magnetic resonance imaging (MRI). Thus, MnO2-based tumor-targeted nanomaterials can act as both assistant agents for PDT as well as bio-imaging agents.
Nanocarriers could enhance the antitumor efficacy by combining different therapeutic mechanisms and overcoming limitations of single therapeutic approaches. Also, it is highly desirable to create “all-in-one” or “all-for-one” nanosystems that are flexible, multifunctional, and biocompatible [32-34]. In our previous studies on combined anticancer therapy, we developed various types of polymeric micelles, nanoparticles, and polymersomes, which were synthesized by block polymers, such as methoxy poly (ethylene glycol)-poly (D, L-lactide) (mPEG-PDLLA), and cationic PCL grafted poly (ethylene imine) (PCL-g-PEI). Our previous results indicated that the therapeutic efficacy of combination therapy was distinctively superior to either chemotherapy or photothermal therapy (PTT) alone [35, 36]. We had also fabricated magnetic targeting theranostic nanocapsules to hierarchically assemble superparamagnetic iron oxide nanoparticles (SPIOs), cyanine dye (IR820), and paclitaxel with poly (ε-caprolactone-co-lactide)-b-poly (ethylene glycol)-b-poly (ε-caprolactone-co-lactide) (PCLA-PEG-PCLA). The triblock copolymers exhibited desired formulation properties, especially ideal loading properties of both drugs and nanoparticles [37]. However, to the best of our knowledge, reports about co-loading drugs and nanoparticles with one-step fabrication were not sufficient.
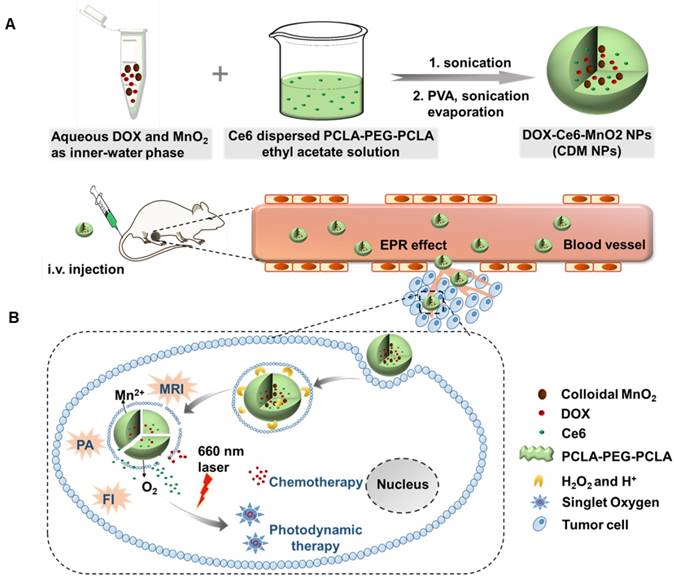
Therefore, in this study, to optimize the combination chemotherapeutic efficacy of DOX and the PDT efficacy of photosensitizer chlorin e6 (Ce6), we fabricated a multifunctional polymeric nanoparticle system that could co-deliver Ce6, DOX, and MnO2 (Ce6-DOX-MnO2 NPs, CDM NPs) for breast cancer theranostics. As illustrated in Figure 1, the amphiphilic block copolymer PCLA-PEG-PCLA with appropriate hydrophilic/hydrophobic ratio self-assembled into polymeric nanoparticles. Ce6, DOX, and MnO2 were hierarchically loaded into the nanoparticles by a water-in-oil-in-water (W/O/W) double emulsion solvent evaporation method, with hydrophilic DOX and colloidal MnO2 in the inner water phase and Ce6 in the middle hydrophobic layer. The resultant nanoparticles exhibited good stability and biocompatibility both in vitro and in vivo. These theranostic nanoparticles administrated through systemic injection passively accumulated at the tumor location via the enhanced permeability and retention (EPR) effect. After being internalized via endocytosis, encapsulated MnO2 reacting with H2O2, a massive tumor metabolite, to generate O2, which is essential for improving PDT efficacy, and Mn2+ for T1-weighted MRI. To monitor the tumor accumulation of the nanoparticles, we took advantage of the fluorescence and photoacoustic (PA) imaging property of Ce6 and the T1-weighted MRI property of Mn2+. CDM NPs had high efficiency for tumor targeting and showed improved synergistic antitumor outcomes in combined chemotherapy and O2 generation-enhanced PDT. By integrating multiple functions in CDM NPs, it is expected that the nanocomposites will be a potential practical, targeted delivery platform for bio-imaging and combination therapy.
(A) Schematic illustration of the hybrid polymeric system consisting of Ce6, DOX, and MnO2 co-loaded nanoparticles (CDM NPs) prepared by a double emulsion solvent evaporation method. (B) Schematic illustration of tumor-targeting CDM NPs for combined O2-generating chemo-photodynamic cancer therapy and trimodal fluorescence (FI), photoacoustic (PA) and magnetic resonance (MRI) imaging.
Materials and Methods
Materials
Potassium permanganate (KMnO4) was purchased from Sinopharm Chemical Reagent Co., Ltd. Photosensitizer chlorin e6 (Ce6) was obtained from Frontier Scientific (Logan, UT, USA). Poly (allylamine hydrochloride) (PAH, Mw ~17,500), poly (ethylene glycol) (PEG, Mn 4000), D, L-lactide (LA), ε-caprolactone (ε-CL, Mn 114), stannous octoate (Sn(Oct)2), poly (vinyl alcohol) (PVA, 87-90%, hydrolyzed, Mw 30,000-70,000) and 3-(4,5-dimethylthiazol-2-yl)-2,5-diphenyl tetrazolium bromide (MTT) were purchased from Sigma-Aldrich (St Louis, MO, USA) and used without further purification. Doxorubicin hydrochloride (DOX) was commercially available from Meilune Biological Co., Ltd (Dalian, China). Dulbecco's modified Eagle's Medium (DMEM) and fetal bovine serum (FBS) were obtained from Gibco BRL (Carlsbad, CA, USA). Milli-Q water (18.2 MΩ cm) from a Milli-Q Gradient System was used throughout the experiments. PEG was vacuum dried at 60 °C for 12 h before use, and other materials used in this article were of analytical grade. Hoechst 33342, Reactive Oxygen Species (ROS) Assay Kit and Annexin V-FITC Apoptosis Detection Kit were purchased from KeyGEN BioTECH Co., Ltd (Nanjing, China).
Cell Culture
Human breast carcinoma cell line MCF-7 and murine fibroblast cell line NIH 3T3 were obtained from American Type Culture Collection (ATCC) and cultured in high-glucose DMEM with 10% FBS and 1% penicillin-streptomycin at 37 °C in 5% CO2 atmosphere.
Synthesis and Characterization of PCLA-PEG-PCLA Copolymer
PCLA-PEG-PCLA copolymer with designed LA/ε-CL/PEG molecular weight of 14400/21600/4000 was synthesized by ring-opening polymerization as previously reported [37, 38]. In brief, specific amounts of ε-CL, LA and PEG were added to a dry round-bottom flask at nitrogen atmosphere. Subsequently, Sn(Oct)2 was added to the system under stirring. The reaction was carried out at 130 ℃ for 10 h under nitrogen protection. The resultant copolymers were then purified, vacuum dried to a constant weight, and stored under -20℃ before further use. The obtained PCLA-PEG-PCLA copolymers were characterized by 1H-nuclear magnetic resonance spectroscopy (1H-NMR, Bruker 400 spectrometer, German) and Fourier transform infrared spectroscopy (FT-IR, Nicolet 6700 FTIR spectrometer, Thermo Fisher Scientific, MA, USA).
Preparation of Colloidal PAH-stabilized MnO2
Colloidal MnO2 was prepared by directly mixing the aqueous solutions of KMnO4 and PAH according to the literature [27, 39]. Briefly, 18 mL of KMnO4 solution (3.5 mg/mL) was mixed with 2 mL of PAH solution (37.4 mg/mL), and the mixture was left for 15 min at room temperature until all permanganate was converted to MnO2. The colloidal MnO2 formation was confirmed by UV-vis absorption spectroscopy (UV-2600, SHIMADZU, Japan) and X-ray photoelectron spectroscopy (XPS). Colloidal MnO2 was washed three times with Milli-Q water using ultracentrifugation (229600 rcf for 1 h) followed by sonication. This step led to small (~15 nm) MnO2 NPs stabilized with PAH (named colloidal MnO2).
Preparation of Ce6, DOX, and MnO2 Co-loaded Nanoparticles
The PCLA-PEG-PCLA-based nanoparticles were prepared by W/O/W emulsion solvent evaporation process [37, 40]. Briefly, 5 mg of DOX dissolved in 200 μL of the Tris-HCl solution (pH 8.0, 500 mM) and colloidal MnO2 (2.2 mg/mL, 500 μL) were mixed as the inner-water phase. The primary emulsion was generated by adding the above-mentioned solution to the mixture of PCLA-PEG-PCLA (20 mg/mL in ethyl acetate, 2 mL) and Ce6 (4 mg/mL in tetrahydrofuran, 0.5 mL), followed by sonicating using a probe-type ultrasonicator (Scientz-IID, Ningbo Scientz Biotechnology Co., Ltd, Ningbo, China). The primary emulsion was immediately transferred into 10 mL of Tris-HCl (pH 8.0, 10 mM) containing 1% PVA and sonicated again. Next, the organic solvent was removed by rotary evaporation under vacuum. The obtained CDM NPs were then centrifuged and filtered to discard the unloaded reagent. For the control groups, Ce6 and DOX co-loaded PCLA-PEG-PCLA nanoparticles (CD NPs) without MnO2, as the chemotherapy and photodynamic therapy system (combination therapy system) without O2 generation was prepared with the same method. Additionally, Ce6-loaded, DOX-loaded, Ce6-MnO2 co-loaded and DOX-MnO2 co-loaded nanoparticles, abbreviated as Ce6 NPs, DOX NPs, CM NPs, and DM NPs, respectively, were also obtained using the same protocol.
Characterization of the Co-loaded Nanoparticles
The size and zeta potential of the nanoparticles were acquired from dynamic laser scattering (DLS) measurements using a Malvern Zetasizer Nano-ZS (Zetasizer nano ZSP, Malvern, England). The morphology and size distribution were observed by transmission electron microscopy (TEM) using a Tecnai G2 F20 S-TWIN TEM (FEI Company, Hillsboro, OR, USA) at an accelerating voltage of 120 kV. The samples were prepared by dropping them on a copper grid followed by negative staining with 2.5% sodium phosphotungstic acid and drying at room temperature. The contents of DOX and Ce6 in these formulations were determined by UV-vis absorption spectroscopy. The loading percentage of MnO2 was measured using an inductively coupled plasma atomic emission spectrometer (ICP-AES, SPECTRO ARCOS, Spectro, Germany). UV-vis absorption spectra of blank NPs and various loaded nanoparticles were also measured.
Measurement of O2 Generation from MnO2 NPs In Vitro
The O2 generated by MnO2 NPs was measured using a dissolved oxygen meter (JPBJ-608, INESA Scientific Instrument Co., Ltd, Shanghai, China). For this, in a sealed double-neck flask (wherein one neck contained a probe of the dissolved O2 meter immersed to the near bottom of the flask and sealed with a rubber plug), 100 mL of deoxygenated PBS 6.5 (0.1 M) or PBS 7.4 (0.1 M) was injected. Thereafter, 30% w/v H2O2 was injected into the flask to obtain the H2O2 solution with a concentration of 100 μM. The MnO2 NPs solution was injected into the flask after the readings recorded by the detector stabilized. Moderate shaking of the flask was maintained during the experiment. The values of the dissolved O2 detected by the probe were recorded at predetermined times.
Detection of 1O2 In Vitro
The method for 1O2 detection by UV-vis spectroscopy was based on the protocol reported previously [37]. Briefly, 100 μL of 1O2 sensor 9, 10-anthracenediyl-bis (methylene) dimalonic acid (ABDA) solution (1 mg/mL) was mixed well with different Ce6 formulations (Ce6 = 10 μM) in deoxygenated PBS (pH 6.5 or 7.4), and H2O2 solution was added to maintain the final concentration of H2O2 at 100 μM. Then the solutions were irradiated by 660 nm light at a power density of 100 mW/cm2. The generated 1O2 was determined by measuring the absorbance change of ABDA at 378 nm under different laser-irradiation periods. ABDA in deoxygenated PBS (pH 6.5) under laser-irradiation was used as a control.
In Vitro Drug Release of DOX
The in vitro release behavior of DOX from the nanoparticles was investigated by a dialysis method. In brief, 1 mL of nanoparticle dispersions containing 1.0 mg of DOX were sealed in a dialysis bag (molecular weight cut-off 8000 ~14000). The bags were immersed in the release media containing 0 M or 100 μM of H2O2. The containers were placed in a shaking bed with a rotation speed of 100 rpm at 37 °C. All the release media consisted of 10 mL PBS (pH 7.4 or 6.5, 0.1 M). At predetermined time intervals, the release media was replaced with the same volume of fresh buffer. DOX released from samples was measured by UV-vis spectrometry.
Intracellular Uptake and Distribution
Intracellular drug distribution of CDM NPs was investigated by confocal laser scanning microscopy (CLSM). MCF-7 cells cultured for 24 h in glass-bottom dishes were treated with CDM NPs (DOX = 10 μg/mL and Ce6 = 5 μg/mL) in the dark for different incubation times (1, 2, and 4 h). Cells were washed three times with ice-cold PBS and fixed by 1 mL of immune staining fix solution for 20 min. The nuclei were stained with Hoechst 33342 (10 μg/mL) for 30 min and washed thoroughly with ice-cold PBS before fluorescence imaging (A1R MP+, Nikon Corporation, Tokyo, Japan).
To quantify the intracellular uptake of nanoparticles, flow cytometric analysis with an excitation laser at 633 nm was used. MCF-7 cells during the exponential growth phase were seeded in 6-well plates at a seeding density of 1×10⁵ cells per well and incubated for 24 h to allow cell attachment. The cultures were replaced with fresh serum-free media containing free Ce6, Ce6 NPs, or CM NPs at a concentration of 2 μM (Ce6) for 4 h. Subsequently, the cells were washed with PBS for flow cytometry measurement (CYTOMICS FC 500, Beckman Coulter, Brea, California, USA).
Intracellular ROS Detection and Apoptosis After Laser-irradiation
MCF-7 cells were seeded at a density of 1×10⁵ cells per well in 12-well plates. After the cells were incubated for 24 h, the media was replaced with the fresh serum-free culture containing free Ce6, Ce6 NPs, or CM NPs. The final concentration of Ce6 was 500 nM. The cells were further incubated for 4 h and washed once with PBS, then incubated with 10 μM of 2', 7'-dichlorodihydrofluorescein diacetate (DCFH-DA, ROS-sensitive probe) for 20 min to detect the intracellular ROS generation followed by irradiation with a 660 nm laser (100 mW/cm2) for 5 min. After additional 30 min incubation, the cells were harvested, and the fluorescence was detected by flow cytometry (FITC channel) to measure the intracellular ROS level. The intracellular ROS was also detected by observing dichlorofluorescein (DCF) using confocal microscopy.
After treatment with free Ce6, Ce6 NPs, or CM NPs (500 nM of Ce6) for 4 h, MCF-7 cells were rinsed with culture media and photo-irradiated with a 660 nm laser (100 mW/cm2) for 5 min. At 4 h post irradiation, the cells were trypsinized and then stained with Annexin V-FITC Apoptosis Detection Kit according to the manufacturer's instruction. The fluorescence of FITC and propidium iodide (PI) was detected by flow cytometry.
Cytotoxicity Assay
To investigate the in vitro PDT effect of different Ce6 formulations, MCF-7 cells seeded in 96-well plates at a density of 1×10⁴ cells per well were cultured for 24 h and then treated with free Ce6, Ce6 NPs, and CM NPs for 4 h, which were then replaced with fresh culture media. Next, the cells were exposed to 660 nm light at a power density of 100 mW/cm2 for 5 min and further incubated for 24 h. The relative cell viabilities were measured and calculated by the standard MTT method. The cells incubated with identical Ce6 formulations but unexposed to laser were used as controls.
For combination therapy, MCF-7 cells were incubated with free DOX, DOX NPs, DM NPs, CD NPs (+laser), and CDM NPs (+laser). After 4 h of incubation, the cells in Ce6-treatment groups were exposed to 660 nm light at a power density of 100 mW/cm2 for 5 min, and further incubated for 24 h before MTT assay.
Animal Model
Female Balb/c nude mice (6-8 weeks-old) were purchased from Beijing HFK Bioscience Co., Ltd (Beijing, China) and used under protocols approved by Sichuan University Laboratory Animal Center. Solid tumors of human breast cancer MCF-7 cells were grown by subcutaneous injection of 1 × 10⁶ cells suspended in 100 μL serum-free DMEM medium onto the back of each mouse. Tumor volume was measured using vernier calipers by measuring length and width and calculated using the following formula: 1/2×width2×length.
Fluorescence, PA, and MR Imaging In Vitro and In Vivo
For fluorescence imaging, free Ce6/DOX (mixed solution of Ce6 and DOX), CD NPs, and CDM NPs were systemically administrated to tumor-bearing mice through the tail vein at a Ce6 dose of 2.5 mg/kg (DOX: 5 mg/kg, MnO2: 1 mg/kg). At predetermined time points, the mice were anesthetized, and fluorescence images were acquired on an IVIS Lumina III imaging system (Perkin Elmer, Caliper Life Sciences, MA, USA; excitation filter: 640 nm, emission filter: 710 nm). The mice were sacrificed at 24 h post-injection, and ex vivo imaging was performed on the excised tumors and organs.
PA imaging was conducted using a real-time multispectral optoacoustic tomography (MSOT) small animal scanner (inVision 128, iThera Medical GmbH, Neuherberg, Germany) at an excitation wavelength of 680 nm. CDM NPs at various concentrations in transparent polyethylene cylinders embedded in agar gel with a diameter of 2.0 cm were subjected to in vitro PA imaging. The averaged PA signal intensity was plotted against Ce6 concentration. For MSOT imaging in vivo, MCF-7 tumor-bearing mice were intravenously (i.v.) injected with 200 μL of free Ce6/DOX, CD NPs, and CDM NPs suspension at an identical Ce6 dose of 2.5 mg/kg, 5 mg/kg of DOX, and 1 mg/kg of MnO2 in the CDM NPs group. PA images of the tumor sites were acquired at different time points post-injection, and the PA signals were recorded.
For in vitro MRI, CDM NPs solutions with various Mn concentrations (0 to 1 mM) treated with 10 mM H2O2 at different pH values were scanned using a 7-T clinical MRI scanner (BioSpec 70/20 USR, Bruker Biospin Corporation, Billerica, MA, USA) at room temperature. T1-weighted MR signal intensity of each sample was acquired from MR images in the region of interest (ROI). The relaxation rate r1 (1/ T1) was then calculated from T1 values at different Mn2+ concentrations. For MRI in vivo, MCF-7 tumor-bearing nude mice were scanned with a 7-T clinical MR scanner equipped with a special animal imaging coil (GE Healthcare, USA), before and after i.v. injection with CDM NPs at a dose of 1 mg/kg (MnO2).
Fluorescence Immunostaining of Tumor Hypoxia
MCF-7 Balb/c tumor-bearing nude mice (n = 3/group) were i.v. injected with MnO2 NPs or saline (control). After 24 h, animals received an intraperitoneal injection of hypoxia marker pimonidazole HCl solution (60 mg/kg) (Hypoxyprobe-1 plus kit, Hypoxyprobe Inc., USA), and were sacrificed 60 min later. Tumor tissues were quickly harvested, embedded in OCT medium, and snap frozen. Consecutive 5 μm sections were cut at the largest circumference of the tumor. After thawing, the sections were fixed in cold acetone for 10 min and incubated overnight at 4 ℃ with the FITC-labeled mouse monoclonal anti-pimonidazole antibody (clone 4.3.11.3; FITC-MAb1) diluted in PBS containing 0.1% bovine serum albumin c and 0.1% Tween 20. Subsequently, the sections were incubated for 90 min with anti-FITC HRP, followed by incubation with Hoechst 33342 for nuclei location. Slides were scanned with a fluorescence microscope (Olympus, Shinjuku, Tokyo, Japan) and images were analyzed with ImageJ 7.0 software.
Blood Biochemistry and Hematology Studies of MnO2 NPs
Nine healthy female Balb/c mice randomly divided into three groups (n = 3/group) were i.v. injected with MnO2 NPs at a dose of 5 mg/kg (in terms of MnO2) and sacrificed at 1, 7, and 14-days post-injection. Three healthy female untreated mice were used as controls. 0.3 mL of blood was drawn from mice for blood biochemistry analysis and 0.1 mL for hematology assay.
Pharmacokinetics and Biodistribution In Vivo
To investigate the pharmacokinetics of the nanoparticles, Sprague-Dawley rats were randomly divided into four groups (n=3). Each group was i.v. injected with 1.0 mL of free DOX, DOX NPs, CD NPs, or CDM NPs solution with an identical DOX concentration of 5.0 mg/kg. Blood samples were collected from the orbital venous plexus with a heparinized tube at 5, 15, 30 min, 1, 2, 4, 8, 24, and 36 h post-administration. The supernatant of the blood sample was collected by centrifugation at 2380 rcf for 10 min, and the DOX content in the supernatant was determined using HPLC measurement. The organ biodistribution of CDM NPs was examined using MCF-7 tumor-bearing nude mice. Mice were administrated with CDM NPs at a MnO2 dose of 1.0 mg/kg. Animals were sacrificed at 2, 8, 12, and 24 h post-injection. All major organs (i.e., heart, liver, spleen, lung, kidneys) and tumor were collected, weighed, and digested in aqua regia overnight. The organ biodistribution was measured by analyzing Mn concentration in each organ using ICP-AES.
In Vivo Chemo-Photodynamic Therapy
MCF-7 tumor-bearing mice were randomly divided into eight groups when the tumors reached ~100 cm3 (n=5 for each group): (1) saline, (2) free DOX, (3) DOX NPs, (4) CD NPs, (5) CDM NPs, (6) CM NPs, (7) Ce6 NPs, and (8) DM NPs. The doses of DOX, Ce6, and MnO2 were 5 mg/kg, 2.5 mg/kg, and 1 mg/kg, respectively. Mice were administrated with corresponding formulations at days 0, 2, and 4. All Ce6-treated groups received 10 min of laser-irradiation (660 nm, 100 mW/cm2) at 24 h post-injection (laser was placed ~1 cm above the tumor). The tumor volume and body weight of each mouse were recorded during therapy. Mice were sacrificed on day 18, and the tumors were collected and weighed. Inhibition ratio (IR) was calculated as follows: IR (%) = [(x - y) / x] × 100 %, where x and y stand for the average tumor weight for the control group (saline) and treatment group, respectively.
To evaluate the apoptotic response in tumor tissues, Ki-67 and terminal deoxynucleotidyl transferase (TdT)-mediated dUTP-digoxigenin nick-end labeling (TUNEL) staining were applied. The major organs (heart, liver, spleen, lungs, and kidneys) were also collected and examined by hematoxylin and eosin (H&E) staining to evaluate the biosafety of the hybrid nanoparticles.
Statistical Analysis
Results are presented as mean ± SD. One-way analysis of variance (ANOVA) was used to determine the significance of differences. Statistical significance was set at p < 0.05 (∗p < 0.05, ∗∗p < 0.01, ∗∗∗p < 0.001).
Results and Discussion
Characterization of the Theranostic Nanoparticles
The PCLA-PEG-PCLA copolymer was successfully synthesized by ring-opening polymerization of ε-CL and LA in the presence of PEG and was confirmed by 1H-NMR and FT-IR (Figure S1and Table S1). Detailed information on the copolymer and its blank NPs by W/O/W double emulsion solvent evaporation process is summarized in Table S2. The successful synthesis of PCLA-PEG-PCLA and the blank NPs showed desirable particle size and narrow size distribution.
Colloidal MnO2 was synthesized in an aqueous solution by reducing KMnO4 in the presence of cationic polyelectrolyte PAH. TEM images showed that the diameter of colloidal MnO2 ranged from 10 nm to 20 nm, which is consistent with the DLS results (15.6 nm, Figure S2A, B). XPS and UV-vis absorption spectra of colloidal MnO2 further illustrated the successful formation of Mn (IV) O2 (Figure S2C, D). The hydrodynamic size of blank NPs formed by PCLA-PEG-PCLA was ~92 nm, and those of the drug-loaded nanoparticles were slightly larger (100-130 nm) (Figure 2C, Figure S3). Sizes obtained from TEM imaging showed a positive correlation with the DLS results, and the morphology of the nanoparticles (uniform spherical structure) was slightly changed after loading the drugs (Figure 2A, B).
Physicochemical characterization of CDM nanoparticles. (A-B) Morphology of Blank NPs (A) and CDM NPs (B) under TEM. (C) Hydrodynamic diameters of Blank NPs, DOX NPs, Ce6 NPs, MnO2 NPs, and CDM NPs measured by dynamic light scattering (DLS). (D) Zeta potentials of Blank NPs, Colloidal MnO2, DOX NPs, Ce6 NPs, MnO2 NPs, and CDM NPs.
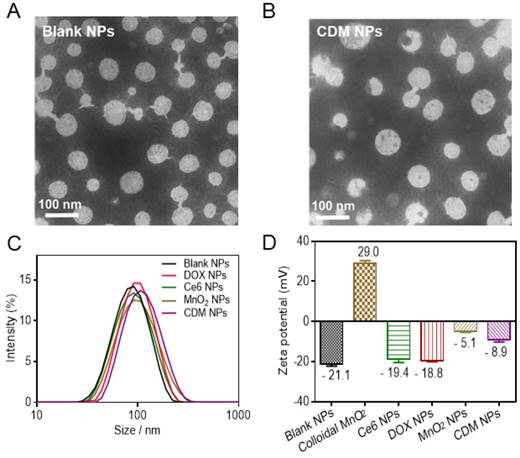
The zeta potential of blank NPs was approximately -20 mV, permitting long-term stability of the nanoparticles in the blood circulation and avoiding severe cytotoxicity [41, 42]. Interestingly, in contrast to the bare colloidal MnO2, which showed high positive charge at +29 mV and poor colloidal stability in saline and cell culture media (containing 50% FBS), the encapsulated form, MnO2 NPs, were negatively charged (-5.1 mV) and resisted aggregation in both media, making them suitable for in vivo application (Figure 2D, Figure S4). No precipitate was observed even after 15 days, supporting the hypothesis that MnO2 was successfully loaded into the nanoparticles. After the therapeutic agents were loaded, the zeta potential was about -8.9 mV and the CDM NPs also showed excellent stability in vitro (Figure S5).
Next, the UV-vis absorption spectrum of CDM NPs was measured (Figure 3A). A broad distinctive peak present around 300-400 nm could be attributed to the surface plasmon band of MnO2. The characteristic peaks from both DOX (489 nm) and Ce6 (405 nm, 671 nm) were also observed. These results suggested successful encapsulation of DOX, Ce6 and MnO2 into the nanoparticles. Notably, a new and slight red shift in the absorption spectrum was observed at ~700 nm, which could be due to the close interaction between Ce6 and the nanoparticles. By adjusting the dose, the contents of DOX, Ce6, and MnO2 in different formulations were tuned to be identical at 9.5%, 4.7% and 1.8%, respectively, as determined by UV-vis absorption spectroscopy and ICP-AES (Table S2).
Physicochemical characterization of CDM nanoparticles. (A) UV-vis absorption spectra of Blank NPs, DOX NPs, Ce6 NPs, MnO2 NPs, and CDM NPs. (B) Oxygen generation in H2O2 solutions (100 × 10-6 M) with MnO2 NPs (100 × 10-6 M, in terms of MnO2) added at different pH values (7.4 and 6.5). (C) The generation of singlet oxygen determined by the change in ABDA absorbance for CM NPs at different pH values (7.4 and 6.5). (D) DOX-release profiles in the presence and absence of H2O2 at different pH values.
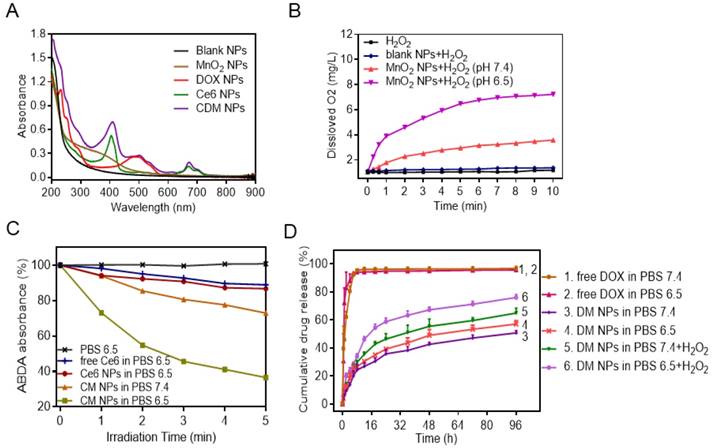
It is well recognized that the active metabolism of cancer cells and insufficient blood supply inside solid tumors not only result in acidification of TME but also lead to significantly increased H2O2 levels inside tumors. According to the MnO2-H2O2 reaction equation shown in Figure S6, MnO2 only serves as a catalyst to promote decomposition of H2O2 to generate O2 under neutral conditions [43]. However, in the mild acidic condition, MnO2 functions as both catalyst and reactant and can decompose to harmless, water-soluble Mn2+ ions and produce O2 by consuming the tumor metabolites (H2O2 and H+) [44]. Considering the reactivity of MnO2 with H2O2 and H+, we first studied the degradation of MnO2 NPs in different media (Figure S7). We found that MnO2 degraded rapidly at pH 6.5 in the presence of H2O2, and almost all MnO2 converted into colorless Mn2+ ions in 4 h. In contrast, MnO2 showed a limited change in other conditions. We subsequently investigated the O2 generation ability of H2O2 upon addition of MnO2 NPs at different pH values (6.5 or 7.4), with pure H2O2 and H2O2 in the presence of blank NPs as control groups. As expected, MnO2 NPs could trigger efficient O2 generation in H2O2 solution at both pH 6.5 and pH 7.4. The O2 generation at pH 7.4 was likely due to the catalytic activity of MnO2 for H2O2 decomposition. Notably, a distinctively higher amount of O2 was produced at pH 6.5 (Figure 3B). In the control study, H2O2 solution and blank NPs generated negligible O2.
Encouraged by the effective O2 generation of H2O2 in the presence of MnO2 NPs, we examined whether the produced O2 facilitated 1O2 generation during PDT. The generation of 1O2 produced by free Ce6, Ce6 NPs, and CM NPs at the same Ce6 concentration in the presence TME-relevant H2O2 concentration was measured by 1O2 indicator ABDA. The deoxygenated solution pH was adjusted to 6.5, and 100 μM of H2O2 was added to mimic the TME concentration. As expected, the free Ce6 and Ce6 NPs showed a weak change of ABDA absorbance with laser-irradiation for 5 min, indicating that only moderate amount of 1O2 was generated. In sharp contrast, the generation of 1O2 by H2O2 in the presence of CM NPs at pH 6.5 was remarkably higher, which was probably attributed to the additional O2 supply by H2O2 in the presence of MnO2 (Figure 3C, Figure S8). Therefore, the PDT efficiency of CM NPs is expected to be distinctively improved in the TME containing a certain amount of H2O2.
Next, we measured the release behavior of DOX from nanoparticles by a dialysis method. As shown in Figure 3D, in the absence of H2O2, there was slow release of DOX from nanoparticles compared to free DOX, indicating the sustained release property of the polymeric carrier for drug delivery. Conversely, after 96 h of incubation with 100 μM H2O2 in PBS 6.5, ~80% of DOX originally encapsulated within DM NPs was released into the media. This was probably attributed to the catalysis by MnO2 to quickly generate O2 gas in the media mimicking TME, causing rupture of the PCLA-PEG-PCLA shell and subsequent release of DOX [21].
In Vitro Antitumor Efficacy by Chemotherapy and Enhanced PDT Associated with O2 Generation
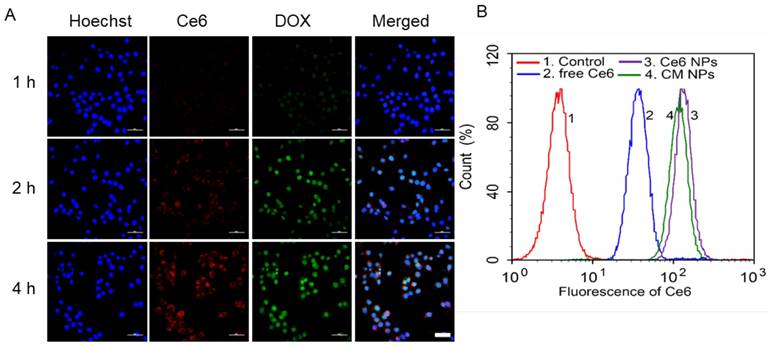
MCF-7 cells incubated with CDM NPs for different periods of time were imaged by a confocal microscope to investigate the intracellular distribution (Figure 4A). Both DOX and Ce6 fluorescence inside the cells significantly enhanced with the increase of incubation time. Interestingly, although Ce6 fluorescence was mostly located in the cytoplasm after incubation for 4 h, DOX preferentially accumulated inside the nuclei over time, indicating the gradual intracellular DOX release from CDM NPs. The quantitative cellular uptake of nanoparticles was also studied using Ce6 as the fluorescence probe. MCF-7 cells were incubated with free Ce6, Ce6 NPs and CM NPs with the same concentration of Ce6 for 4 h. As illustrated in Figure 4B, the Ce6-loaded nanoparticles showed significantly enhanced uptake vs. free Ce6. Also, the comparable fluorescence intensities observed in cells treated with Ce6 NPs and CM NPs indicated that the introduction of MnO2 did not interfere with the fluorescence of Ce6.
(A) Confocal fluorescence images of MCF-7 cells incubated with CDM NPs at various time points. Blue, green, and red represent DAPI, DOX, and Ce6 fluorescence, respectively. Scale bars correspond to 50 μm in all panels. (B) Flow cytometry analysis of MCF-7 cells incubated for 4 h with free Ce6, Ce6 NPs, and CM NPs, respectively.
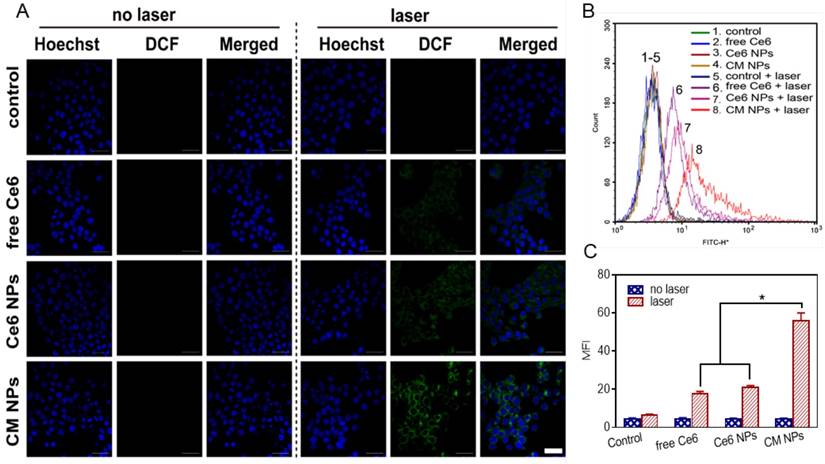
We next examined the generation of ROS such as 1O2 during intracellular PDT. MCF-7 cells were treated with DCFH-DA, a non-fluorescent molecule that can passively diffuse into cells and be oxidized by ROS and 1O2 to produce a bright green fluorescence compound DCF. The resulting oxidatively stressed cells showed green fluorescence indicating enhanced 1O2 gained. As shown in Figure 5A, cells treated with free Ce6, Ce6 NPs, or CM NPs without laser-irradiation presented a weak intracellular ROS signal (green). The control group not treated with any Ce6 formulation was also dim with/without laser-irradiation. However, in free Ce6, Ce6 NPs, and CM NPs groups under laser-irradiation, the bright green fluorescence signals of DCF were notably enhanced, suggesting that Ce6 could generate 1O2 in the cells under irradiation. Among the laser-irradiated groups, weak fluorescence observed in the free Ce6 group was attributed to lower cellular uptake efficiency of Ce6. As expected, compared with the Ce6 NPs group, a significant increase in 1O2 production by CM NPs was observed due to the MnO2-triggered generation of O2 from H2O2 in TME. Flow cytometry analysis (Figure 5B, C) further revealed that the order of ROS level was CM NPs > Ce6 NPs > free Ce6, which was consistent with confocal microscopy. These results verified the better performance of CM NPs as the 1O2 producer.
Enhanced 1O2 production by CM NPs-mediated PDT in MCF-7 cells. (A) Confocal images of ROS generation by DCFH-DA staining in cells incubated with medium (control), control + laser, free Ce6, free Ce6 + laser, Ce6 NPs, Ce6 NPs + laser, CM NPs, and CM NPs + laser (blue for Hoechst, green for DCF; scale bar represents 50 μm). (B) Flow-cytometry analysis of ROS generation in cells with different treatments. (C) Quantitative analysis of the mean fluorescence intensity of ROS in MCF-7 cells. The data are shown as mean ± SD (n = 3), ∗ indicates p < 0.05 vs. (CM NPs + laser).
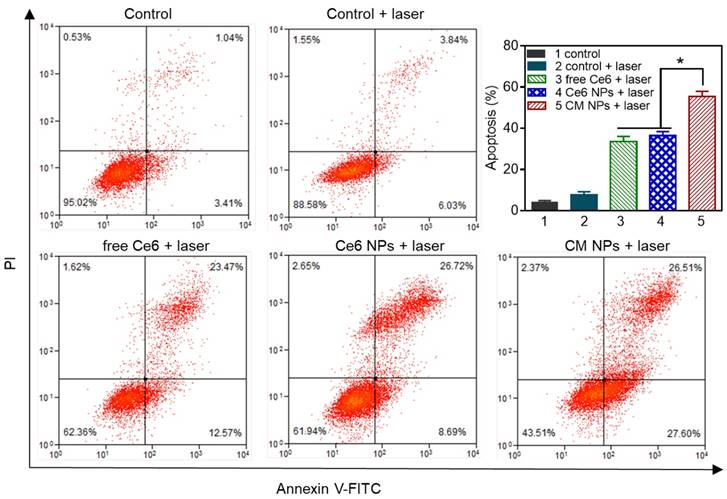
To elucidate the contribution of O2-enhanced PDT to the phototoxicity, we examined the cell apoptosis by flow cytometry. Annexin V-FITC and PI were introduced to distinguish viable cells from apoptotic and necrotic cells. The results in Figure 6 showed different cell populations (viable (Annexin V-FITC-/PI-), early apoptotic (Annexin V-FITC+/PI-), and late-stage apoptotic or dead (Annexin V-FITC+/PI+)) were induced by different treatments. With 660 nm laser irradiation at a power density of 100 mW/cm2 for 5 min, the CM NPs group was more effective at inducing apoptosis than free Ce6 and Ce6 NPs (54.1% vs. 36.04% and 35.40%) at 4 h post-irradiation. Given the ROS generation and apoptosis results above, the PDT efficiency was significantly improved using MnO2-based photosensitizer-encapsulated nanoparticles relevant to the TME inside tumors.
Flow cytometric analysis of MCF-7 cells apoptosis at 4 h induced by different Ce6 formulations with laser irradiation, using Annexin V-FITC and PI staining. The concentration of Ce6 was 500 nM. ∗ p < 0.05.
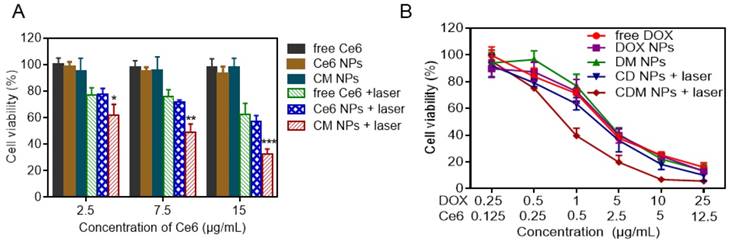
The in vitro antitumor efficacy was evaluated by the MTT assay. First, the biocompatibilities of blank NPs, colloidal MnO2, and MnO2-loaded NPs were studied, as shown in Figure S9. In striking contrast to the strong toxicity of positively charged colloidal MnO2, after 24 h treatment with either blank NPs or MnO2 NPs at the stated concentrations, the viabilities of both NIH 3T3 and MCF-7 cells were above 85%, indicating the good biocompatibility of the carriers. This result also indicated that colloidal MnO2 was successfully encapsulated in nanoparticles to shield its positive charge. Furthermore, upon laser-irradiation (660 nm, 100 mW/cm2) for 5 min, the cells incubated with blank NPs showed no significant decrease in viability, suggesting the cytotoxicity was negligible at the studied power density. Next, the cell viability of MCF-7 cells was examined to determine the PDT efficiency. We observed no obvious dark cytotoxicity in cells treated with free Ce6, Ce6 NPs, or CM NPs for 24 h (Figure 7A). However, under laser-irradiation, the PDT efficiency of CM NPs was distinctly higher than that of free Ce6 or Ce6 NPs at different concentrations. The results were consistent with those of ROS generation and cell apoptosis. Subsequently, we compared the combined chemo-PDT efficacy with the single chemotherapy. As shown in Figure 7B, a dose-dependent inhibitory effect was observed in all groups. Compared to chemotherapy alone (free DOX, DOX NPs, or DM NPs), the combined treatment by CD NPs (+laser) without MnO2 offered more effective cancer cell killing. As expected, the combination therapeutic efficacy could be further enhanced with O2-generation (CDM NPs group with the laser) at all concentrations. The IC50 values of free DOX, DOX NPs, DM NPs, CD NPs (+laser) and CDM NPs (+laser) against MCF-7 cells were 2.42, 3.30, 3.01, 1.98 and 0.85 μg/mL, respectively. Therefore, CDM NPs with MnO2 producing O2 from H2O2 in situ appear to be an efficient agent to improve PDT, enhancing the chemotherapeutic efficacy of polymeric DOX formulations for combined therapy.
In vitro chemo-photodynamic therapy in MCF-7 cells at 24 h. (A) Phototoxicity of free Ce6, Ce6, and CM NPs with or without laser irradiation (660 nm, 100 mW/cm2, 5 min). (B) Quantitative comparison of cytotoxicity following chemo (free DOX, DOX NPs, and DM NPs) and chemo-photodynamic combined treatments (CD NPs + laser, CDM NPs + laser). The data are shown as mean ± SD (n = 3). ∗ p < 0.05, ∗∗ p < 0.01 and ∗∗∗ p < 0.001.
Fluorescence, PA, and MR Multimodal Imaging
The ability of CDM NPs to perform multimodal tumor imaging was investigated in MCF-7 tumor-bearing nude mice. The mice were randomly grouped when the tumor volume reached 150 mm3 (n=3 for each group). Free Ce6/DOX, CD NPs, or CDM NPs were i.v. injected at an identical Ce6 dose of 2.5 mg/kg. As displayed in Figure 8A, whole-body fluorescence imaging showed that Ce6 fluorescence distributed widely throughout the body 4 h after i.v. injection of the three formulations. Later, both CD NPs and CDM NPs showed obvious tumor accumulation while the fluorescence signals detected in the free Ce6/DOX group faded away rapidly likely due to the rapid clearance of free small molecular compounds from blood circulation. The fluorescence at the tumor sites was still strong in mice treated with CD NPs or CDM NPs at 24 h post-injection. The semi-quantitative biodistribution of these formulations based on ex vivo imaging of tumors and major organs at 24 h post-injection further confirmed the higher tumor uptake and retention of CD NPs and CDM NPs because of their prolonged blood circulation (Figure 8B).
(A) Fluorescence images of MCF-7 tumor-bearing mice post i.v. injection of different formulations; the bottom panel shows the ex vivo images of isolated organs and tumors examined at 24 h post-injection. (B) Semi-quantitative analysis of the mean fluorescence intensity in organs and tumors isolated at 24 h post-injection. (C) PA imaging of the tumor-bearing mice injected with different formulations. (D) Time course PA signal quantifications of Ce6 at 680 nm. (E) Time course PA signal quantifications of oxygenated hemoglobin (HbO2) at 850 nm. (F) Confocal immunofluorescence images of tumor slices collected from mice 24 h post-injection of saline or MnO2 NPs after hypoxia staining. The nuclei and hypoxic areas were stained by Hoechst 33342-stained (blue) and anti-pimonidazole antibody (green), respectively. Scale bar: 100 μm. (G) In vitro T1-weighted MRI properties of CDM NPs at different Mn concentrations after H2O2 (100 μM) treatment in either mildly acidic environment (pH = 6.5) or neutral conditions (pH = 7.4). (H) T1-weighted MR images of MCF-7 tumor-bearing mice before and after injection with CDM NPs. ∗ p < 0.05 and ∗∗∗ p < 0.001.
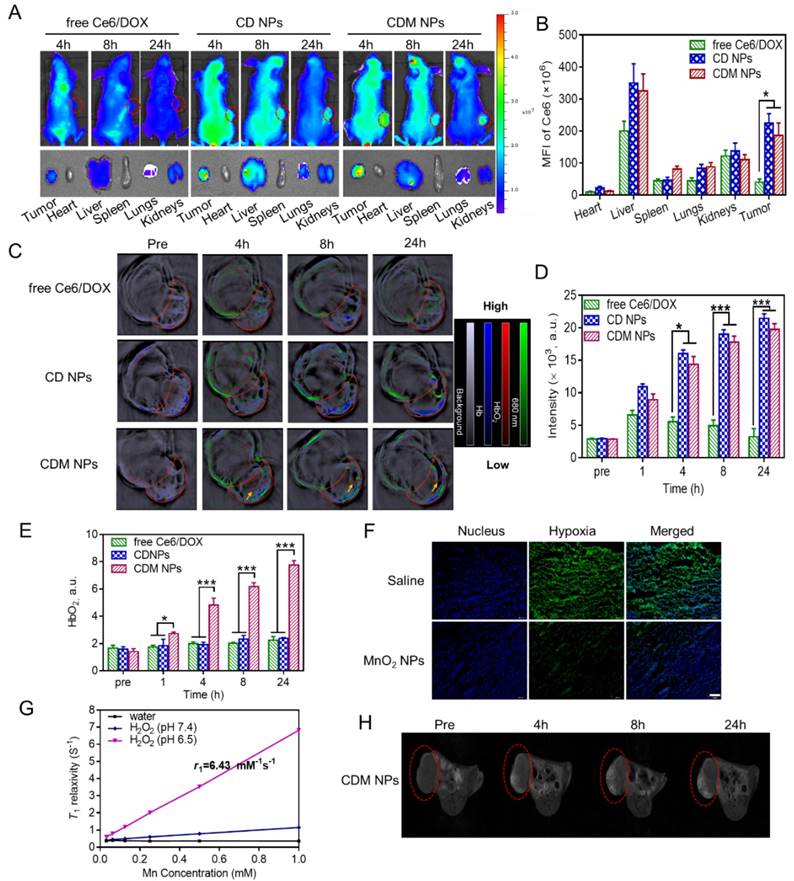
As expected, the CDM NPs showed Ce6 concentration-dependent PA imaging contrast ability at 680 nm (Figure S10), confirming that PA imaging can be used to analyze CDM NPs accumulation in tumors. The in vivo tumor accumulation of different formulations was studied by MSOT examination. The PA signal of Ce6 increased over time due to the intratumoral accumulation of nanoparticles, whereas signal in the free Ce6/DOX group showed weak tumor contrast (Figure 8C, D). The quantification of Ce6 signal (green) in tumors further indicated stronger tumor accumulation of nanoparticles (CD NPs and CDM NPs) than free Ce6/DOX at 24 h post-injection, which was in agreement with the fluorescence imaging results.
It was previously reported that PA imaging could be used to monitor the oxygenation status in tumors based on signals of oxygenated hemoglobin (HbO2) and deoxygenated hemoglobin (Hb) at 850 and 750 nm, respectively [45-48]. To study whether MnO2-loaded nanoparticles could relieve the tumor hypoxia and oxygenate Hb to HbO2, we tested the blood HbO2 level in tumors by PA imaging. As shown in Figure 8C, E, the blood HbO2 level in tumors after administration of CDM NPs showed a significant increase in the HbO2 intensity (red) while no obvious change was observed in tumors injected with free Ce6/DOX or CD NPs. The HbO2 intensity of the CDM group by PA imaging after 24 h was 3.5-fold and 3.3-fold greater than those of the free Ce6/DOX and CD NPs groups, respectively. Furthermore, by immunofluorescence staining of the tumor slices extracted from mice at 24 h post-injection, we further demonstrated MnO2 NPs could ameliorate the hypoxia inside the tumors. Tumor hypoxic areas and cell nuclei were stained with an anti-pimonidazole antibody (green) and Hoechst 33342 (blue) for confocal imaging (Figure 8F). Compared to the control group (saline), the tumor slices from mice treated with MnO2 NPs presented reduced green fluorescence, indicating that the tumor hypoxia was relieved, likely due to the decomposition reaction of endogenous tumor H2O2 into O2 triggered by MnO2. The produced O2 could oxygenate Hb, which was concentrated in the tumor site due to its hypoxic microenvironment. Such enhanced oxygenation in the TME was expected to relieve the hypoxia-associated resistance during PDT in vivo.
The T1-weighted MRI property of CDM NPs in TME was examined using a 7-T MRI instrument. As displayed in Figure 8G, the nanoparticles exhibited Mn concentration-dependent T1-weighted MRI performance under dispersing conditions mimicking in vivo TME (pH 6.5, H2O2). The longitudinal relaxivity (r1), which is a parameter of change in the spin-lattice relaxation rate (T1-1) per unit concentration, was calculated to be 6.43 mM-1s-1, a value higher than that of commercial T1 contrast agent Gd-DTPA (Magnevist®, r1 ≈ 3.40 mM-1s-1). This high value of r1 could probably be ascribed to the high reactivity between MnO2 and H2O2 in acidic condition to generate paramagnetic Mn2+. Subsequently, the in vivo MRI capacity was investigated in an MCF-7 tumor-xenografted mouse model. Tumor-bearing mice were administrated CDM NPs via tail vein, and the saline group was used as a control. As elucidated in Figure 8H, the contrast enhancement provided by CDM NPs was observed gradually over time. This enhanced contrast in the images originated from increasing accumulation of CDM NPs and generation of Mn2+ resulting from the acidic condition as well as the abundant H2O2 in tumor tissue [49]. These multimodal imaging results indicated that CDM NPs could act as a theranostic nanoplatform during tumor treatment.
Biosafety, Pharmacokinetics, Biodistribution, and Combined Chemo-photodynamic Therapeutic Efficacy In Vivo
For the biomedical applications of the metal-organic nanoparticles (MnO2 NPs), we first investigated their potential in vivo toxicity. Healthy Balb/c mice were i.v. injected with MnO2 NPs at a dose of 5 mg/kg, which was five times higher than the therapeutic dose in our study, followed by sacrificed at 1, 7, and 14-days post-injection for blood biochemistry and complete blood panel analysis (n = 3). Three healthy mice were used as controls. Liver function markers including total protein (TP), alanine aminotransferase (ALT), alkaline phosphatase (ALP), and aspartate aminotransferase (AST) and the kidney function marker urea nitrogen (BUN) as well as creatinine (CRE) were determined to be normal and not significantly different from the control group, suggesting no obvious hepatic or kidney disorder by MnO2 NPs nanoparticles in vivo. Hematology parameters including white blood cells (WBC), red blood cells, (RBC) and platelet count (PLT) were determined. Compared with the control group, all parameters were within the normal ranges in experimental mice (Figure S11).
The pharmacokinetics of the CDM NPs was investigated in Sprague-Dawley rats by examining the blood concentration of DOX using HPLC. Compared with free DOX, the CDM NPs significantly improved the maximal blood concentration (Cmax) and area under the curve of DOX (AUC(0‑t)) by 29-fold and 13-fold, respectively (Figure 9A and Table S3). Moreover, the quantitative biodistribution of Mn from CDM NPs in major organs and tumors was assessed by ICP-AES at 2, 8, 12, and 24 h post-injection. As shown in Figure 9B, CDM NPs had a decent tumor uptake of 14.16 %ID/g at 24 h.
(A) Pharmacokinetics of different DOX formulations at a DOX dose of 5 mg/kg in Sprague-Dawley rats. (B) Organ distribution of CDM NPs in MCF-7 tumor-bearing nude mice. (C) Tumor growth curves of various groups. Three injections on days 0, 2, and 4 were given, and 660 nm laser irradiation was performed at 24 h post-injection for 10 min. (D) Final tumor weights after 18 days. Scale bar: 1 cm. (E) Images of the tumors collected from various groups of mice at the end of the treatments (day 18). Error bars represent the standard deviations of 5 mice per group. ∗ p < 0.05, ∗∗ p < 0.01 and ∗∗∗ p < 0.001.
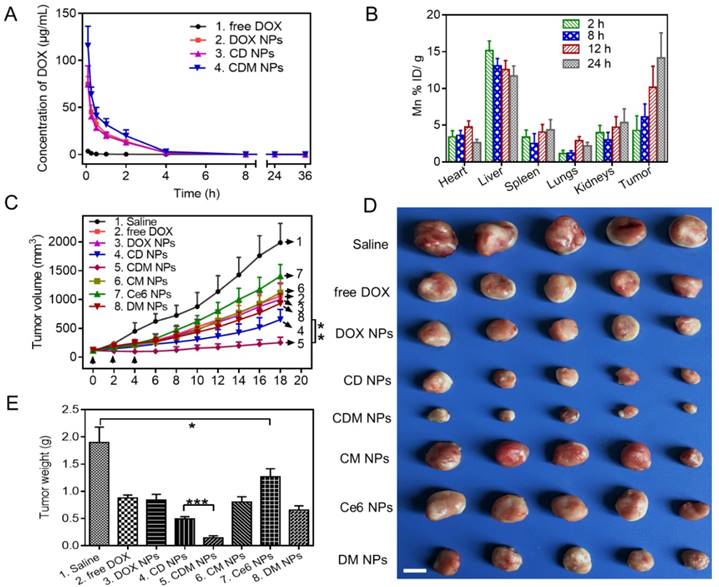
Encouraged by the in vitro antitumor effect of CDM NPs, we next evaluated the in vivo antitumor efficacy using an MCF-7 tumor xenografted mouse model. The tumor-bearing mice were randomly grouped when the tumor volume reached 100 mm3 (n=5). Mice were then i.v. injected with 200 μL of different formulations and laser-irradiation was performed in Ce6-treated groups at 24 h post-injection. As elucidated in Figure 9C, fast tumor growth was observed in the saline group. Mice after combination therapy using CDM NPs under 660 nm laser irradiation showed the most effective tumor growth inhibition efficacy compared with various control groups including chemotherapy alone (free DOX, DOX NPs, or DM NPs) and PDT alone (Ce6 NPs or CM NPs), confirming the benefits of co-delivering drug combinations in a single nanoparticle formulation as opposed to using individual single-drug nanoparticles. Notably, because of the presence of MnO2 to relieve tumor hypoxia, treatment with CDM NPs appeared to be significantly more effective compared to that with CD NPs, which was also the combination therapy but without the assistance of O2 generation in situ. At the end of the treatment period, mice treated with CDM NPs showed the smallest sizes and lightest weights of tumors among the seven treated groups (Figure 9D, E). This result revealed that CDM NPs inhibited the tumor growth most efficiently and the inhibition ratio (IR) calculated by tumor weight was 92.35%, followed by CD NPs (73.92%), DM NPs (65.48%), CM NPs (56.23%), DOX NPs (55.84%), free DOX (53.69%), and Ce6 NPs (32.98%). The body weight was also recorded to evaluate systemic toxicity in mice. Compared with the saline group, the body weight of mice in the free DOX group significantly decreased indicating its severe systemic side effect as reported previously, while no notable change was found in the nanoparticle groups (Figure S12) [50]. Furthermore, the H&E staining of tissue sections of major organs showed no obvious tissue damage from treatment with CDM NPs compared to the saline group (Figure S13).
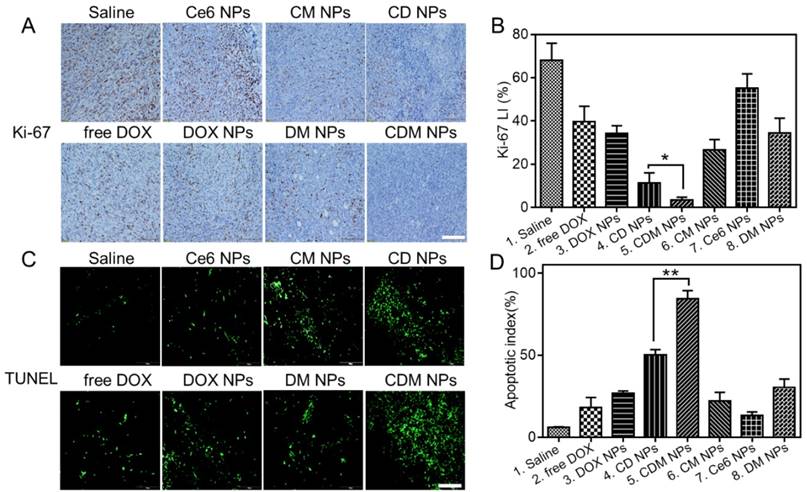
Immunohistochemical staining of tumor sections for Ki-67 antigen was employed to determine the extent of tumor cell proliferation (Figure 10A, B). Visually, tumor cells in the CDM NPs-treated group exhibited decreased Ki-67 expression indicating markedly reduced tumor cell proliferation after treatment. Moreover, the immunofluorescence TUNEL staining assay of tumors showed massive apoptotic tumor cells in the CDM NPs-treated group (apoptotic index 84.3%), while mice treated with the other groups exhibited far less apoptosis in tumor tissues (Figure 10C, D). With the chemo and photodynamic treatments, irreversible DNA/RNA and protein damage occurred, resulting in the inhibition of tumors. Thus, the in vivo study results validated CDM NPs as a potentially safe and efficient delivery platform for theranostics of malignant tumors.
Histological analysis of tumor slices after Ki-67 staining (A) and TUNEL assay (C). Scale bars are 100 μm. (B) The corresponding proliferation index of the tumor tissue in the Ki-67 staining assay. (D) The percentage of apoptotic cells after treatment. Data are expressed as mean ± SD (n = 3). ∗ p < 0.05 and ∗∗ p < 0.01.
Conclusion
We have successfully fabricated multifunctional, intelligent, tumor microenvironment-responsive nanoparticles through a rather simple one-step double emulsion solvent evaporation process. The nanoparticles were used against breast cancer to simultaneously deliver DOX, Ce6, and MnO2 for combined chemo and photodynamic therapy enhanced by O2 generation. The Ce6-DOX-MnO2 (CDM) nanoparticles showed efficient passive tumor accumulation, induced decomposition of endogenous tumor H2O2 to produce O2 in situ, and improved tumor oxygenation to enhance the efficacy of photodynamic therapy used in combination with chemotherapy. The CDM nanoparticles displayed good potential for fluorescence, MRI, and PA triple-modal tumor imaging which could be an informative tool to monitor the distribution in the body and the therapeutic effects on tumors. Overall, the theranostic nanoagent fabricated by this simple process might provide comprehensive diagnostic information of the targeted tumor for more effective synergistic anticancer therapy.
Abbreviations
PDT, photodynamic therapy; DOX, doxorubicin; Ce6, chlorin e6; MnO2, manganese dioxide; PCLA-PEG-PCLA, poly (ε-caprolactone-co-lactide)-b-poly (ethylene glycol)-b-poly (ε-caprolactone-co-lactide); MRI, magnetic resonance imaging; TME, tumor microenvironment; 1O2, singlet oxygen; H2O2, hydrogen peroxide; mPEG-PDLLA, methoxy poly (ethylene glycol)-poly (D, L-lactide); PCL-g-PEI, PCL grafted poly (ethylene imine); PTT, photothermal therapy; SPIOs, superparamagnetic iron oxide nanoparticles; EPR, enhanced permeability and retention; PA, photoacoustic; PAH, poly (allylamine hydrochloride); LA, D, L-lactide; ε-CL, ε-caprolactone; MTT, 3-(4,5-dimethylthiazol-2-yl)-2,5-diphenyl tetrazolium bromide; DMEM, dulbecco's modified eagle's medium; FBS, fetal bovine serum; ROS, reactive oxygen species; ATCC, American Type Culture Collection; 1H-NMR, 1H-nuclear magnetic resonance spectroscopy; FT-IR, fourier transform infrared spectroscopy; XPS, X-ray photoelectron spectroscopy; W/O/W, water-in-oil-in-water; DLS, dynamic laser scattering; TEM, transmission electron microscopy; ABDA, 9, 10-anthracenediyl-bis (methylene) dimalonic acid; CLSM, confocal laser scanning microscopy; DCFH-DA, 2', 7'-dichlorodihydrofluorescein diacetate; DCF, dichlorofluorescein; PI, propidium iodide; MSOT, multispectral optoacoustic tomography; i.v., intravenously; ROI, region of interest; TUNEL, terminal deoxynucleotidyl transferase (TdT)-mediated dUTP-digoxigenin nick-end labeling; H&E, hematoxylin and eosin; TP, total protein; ALT, aminotransferase; ALP, alkaline phosphatase; AST, aspartate aminotransferase; BUN, urea nitrogen; CRE, creatinine; WBC, white blood cells; RBC, red blood cells; PLT, platelet count; Cmax, maximal blood concentration; AUC(0‑t), area under the curve.
Acknowledgements
This work was financially supported by The National Natural Science Fund for Distinguished Young Scholars (NSFC31525009), National Natural Science Funds (NSFC31771096 and NSFC31500809), Sichuan Innovative Research Team Program for Young Scientists (2016TD0004) and Distinguished Young Scholars of Sichuan University (2011SCU04B18).
Supplementary Material
Supplementary figures.
Competing Interests
The authors have declared that no competing interest exists.
References
1. Legha SS, Benjamin RS, Mackay B, Ewer M, Wallace S, Valdivieso M. et al. Reduction of doxorubicin cardiotoxicity by prolonged continuous intravenous infusion. Ann Intern Med. 1982;96:133-9
2. Zhang L, Chan JM, Gu FX, Rhee JW, Wang AZ, Radovic-Moreno AF. et al. Self-assembled lipid-polymer hybrid nanoparticles: a robust drug delivery platform. ACS nano. 2008;2:1696-702
3. Li Y, Yang DD, Zhang Y, Zhu CY. Novel DSPE-PEG-Cholic Acid-Modified Liposomes with Hepatic Targeting Properties Improve the Anti-Tumor Efficacy of Oral Doxorubicin Hydrochloride for Liver Tumor-Bearing Mice. J Biomed Nanotechnol. 2017;13:727-36
4. Kim D, Lee ES, Oh KT, Gao ZG, Bae YH. Doxorubicin-loaded polymeric micelle overcomes multidrug resistance of cancer by double-targeting folate receptor and early endosomal pH. Small. 2008;4:2043-50
5. She WC, Li N, Luo K, Guo CH, Wang G, Geng YY. et al. Dendronized heparin-doxorubicin conjugate based nanoparticle as pH-responsive drug delivery system for cancer therapy. Biomaterials. 2013;34:2252-64
6. Jiang YY, Cui D, Fang Y, Zhen X, Upputuri PK, Pramanik M. et al. Amphiphilic semiconducting polymer as multifunctional nanocarrier for fluorescence/photoacoustic imaging guided chemo-photothermal therapy. Biomaterials. 2017;145:168-77
7. Agostinis P, Berg K, Cengel KA, Foster TH, Girotti AW, Gollnick SO. et al. Photodynamic therapy of cancer: an update. CA Cancer J Clin. 2011;61:250-81
8. Lucky SS, Soo KC, Zhang Y. Nanoparticles in photodynamic therapy. Chem Rev. 2015;115:1990-2042
9. Conte C, Maiolino S, Pellosi DS, Miro A, Ungaro F, Quaglia F. Polymeric Nanoparticles for Cancer Photodynamic Therapy. Top Curr Chem. 2016;370:61-112
10. Yue C, Yang Y, Zhang C, Alfranca G, Cheng S, Ma L. et al. ROS-Responsive Mitochondria-Targeting Blended Nanoparticles: Chemo- and Photodynamic Synergistic Therapy for Lung Cancer with On-Demand Drug Release upon Irradiation with a Single Light Source. Theranostics. 2016;6:2352-66
11. Yang LP, He J, Wen Y, Yi WJ, Li QL, Lin LW. et al. Nanoscale Photodynamic Agents for Colorectal Cancer Treatment: A Review. J Biomed Nanotechnol. 2016;12:1348-73
12. Broekgaarden M, Weijer R, van Wijk AC, Cox RC, Egmond MR, Hoebe R. et al. Photodynamic Therapy with Liposomal Zinc Phthalocyanine and Tirapazamine Increases Tumor Cell Death via DNA Damage. J Biomed Nanotechnol. 2017;13:204-20
13. Zhu H, Fang Y, Miao Q, Qi X, Ding D, Chen P. et al. Regulating Near-Infrared Photodynamic Properties of Semiconducting Polymer Nanotheranostics for Optimized Cancer Therapy. ACS nano. 2017;11:8998-9009
14. Foster TH, Murant RS, Bryant RG, Knox RS, Gibson SL, Hilf R. Oxygen consumption and diffusion effects in photodynamic therapy. Radiat Res. 1991;126:296-303
15. Henderson BW, Gollnick SO, Snyder JW, Busch TM, Kousis PC, Cheney RT. et al. Choice of oxygen-conserving treatment regimen determines the inflammatory response and outcome of photodynamic therapy of tumors. Cancer Res. 2004;64:2120-6
16. Dolmans DE, Fukumura D, Jain RK. Photodynamic therapy for cancer. Nat Rev Cancer. 2003;3:380-7
17. Celli JP, Spring BQ, Rizvi I, Evans CL, Samkoe KS, Verma S. et al. Imaging and photodynamic therapy: mechanisms, monitoring, and optimization. Chem Rev. 2010;110:2795-838
18. Hu YL, DeLay M, Jahangiri A, Molinaro AM, Rose SD, Carbonell WS. et al. Hypoxia-induced autophagy promotes tumor cell survival and adaptation to antiangiogenic treatment in glioblastoma. Cancer Res. 2012;72:1773-83
19. Tredan O, Galmarini CM, Patel K, Tannock IF. Drug resistance and the solid tumor microenvironment. J Natl Cancer Inst. 2007;99:1441-54
20. Liu Y, Liu Y, Bu W, Cheng C, Zuo C, Xiao Q. et al. Hypoxia Induced by Upconversion-Based Photodynamic Therapy: Towards Highly Effective Synergistic Bioreductive Therapy in Tumors. Angew Chem Int Ed Engl. 2015;54:8105-9
21. Chen H, Tian J, He W, Guo Z. H2O2-activatable and O2-evolving nanoparticles for highly efficient and selective photodynamic therapy against hypoxic tumor cells. J Am Chem Soc. 2015;137:1539-47
22. Wang PY, Li XM, Yao C, Wang WX, Zhao MY, El -Toni AM. et al. Orthogonal near-infrared upconversion co-regulated site-specific O-2 delivery and photodynamic therapy for hypoxia tumor by using red blood cell microcarriers. Biomaterials. 2017;125:90-100
23. Zhu WW, Dong ZL, Fu TT, Liu JJ, Chen Q, Li YG. et al. Modulation of Hypoxia in Solid Tumor Microenvironment with MnO2 Nanoparticles to Enhance Photodynamic Therapy. Adv Funct Mater. 2016;26:5490-8
24. Liu JN, Bu W, Shi J. Chemical Design and Synthesis of Functionalized Probes for Imaging and Treating Tumor Hypoxia. Chem Rev. 2017;117:6160-224
25. Cheng Y, Cheng H, Jiang C, Qiu X, Wang K, Huan W. et al. Perfluorocarbon nanoparticles enhance reactive oxygen levels and tumour growth inhibition in photodynamic therapy. Nat Commun. 2015;6:8785
26. Song X, Feng L, Liang C, Yang K, Liu Z. Ultrasound Triggered Tumor Oxygenation with Oxygen-Shuttle Nanoperfluorocarbon to Overcome Hypoxia-Associated Resistance in Cancer Therapies. Nano Lett. 2016;16:6145-53
27. Prasad P, Gordijo CR, Abbasi AZ, Maeda A, Ip A, Rauth AM. et al. Multifunctional Albumin-MnO2 Nanoparticles Modulate Solid Tumor Microenvironment by Attenuating Hypoxia, Acidosis, Vascular Endothelial Growth Factor and Enhance Radiation Response. ACS nano. 2014;8:3202-12
28. Yi X, Chen L, Zhong XY, Gao RL, Qian YT, Wu F. et al. Core-shell Au@MnO2 nanoparticles for enhanced radiotherapy via improving the tumor oxygenation. Nano Res. 2016;9:3267-78
29. Yang G, Xu L, Chao Y, Xu J, Sun X, Wu Y. et al. Hollow MnO2 as a tumor-microenvironment-responsive biodegradable nano-platform for combination therapy favoring antitumor immune responses. Nat Commun. 2017;8:902
30. Chen Q, Feng LZ, Liu JJ, Zhu WW, Dong ZL, Wu YF. et al. Intelligent Albumin-MnO2 Nanoparticles as pH-/H2O2-Responsive Dissociable Nanocarriers to Modulate Tumor Hypoxia for Effective Combination Therapy. Adv Mater. 2016;28:7129 -+
31. Fan W, Bu W, Shen B, He Q, Cui Z, Liu Y. et al. Intelligent MnO2 Nanosheets Anchored with Upconversion Nanoprobes for Concurrent pH-/H2O2-Responsive UCL Imaging and Oxygen-Elevated Synergetic Therapy. Adv Mater. 2015;27:4155-61
32. Zhang J, Zhen X, Upputuri PK, Pramanik M, Chen P, Pu K. Activatable Photoacoustic Nanoprobes for In Vivo Ratiometric Imaging of Peroxynitrite. Adv Mater. 2017:29
33. Yang BW, Gu Z, Chen Y. Nanomedicine-Augmented Cancer-Localized Treatment by 3D Theranostic Implants. J Biomed Nanotechnol. 2017;13:871-90
34. Pitchaimani A, Nguyen TDT, Maurmann L, Key J, Bossmann SH, Aryal S. Gd3+ Tethered Gold Nanorods for Combined Magnetic Resonance Imaging and Photo-Thermal Therapy. J Biomed Nanotechnol. 2017;13:417-26
35. Liao J, Li W, Peng J, Yang Q, Li H, Wei Y. et al. Combined cancer photothermal-chemotherapy based on doxorubicin/gold nanorod-loaded polymersomes. Theranostics. 2015;5:345-56
36. Li W, Peng J, Tan L, Wu J, Shi K, Qu Y. et al. Mild photothermal therapy/photodynamic therapy/chemotherapy of breast cancer by Lyp-1 modified Docetaxel/IR820 Co-loaded micelles. Biomaterials. 2016;106:119-33
37. Liao J, Wei X, Ran B, Peng J, Qu Y, Qian Z. Polymer hybrid magnetic nanocapsules encapsulating IR820 and PTX for external magnetic field-guided tumor targeting and multifunctional theranostics. Nanoscale. 2017;9:2479-91
38. Zhang Z, Ni J, Chen L, Yu L, Xu J, Ding J. Biodegradable and thermoreversible PCLA-PEG-PCLA hydrogel as a barrier for prevention of post-operative adhesion. Biomaterials. 2011;32:4725-36
39. Song M, Liu T, Shi C, Zhang X, Chen X. Bioconjugated Manganese Dioxide Nanoparticles Enhance Chemotherapy Response by Priming Tumor-Associated Macrophages toward M1-like Phenotype and Attenuating Tumor Hypoxia. ACS nano. 2015
40. Luk BT, Fang RH, Hu CMJ, Copp JA, Thamphiwatana S, Dehaini D. et al. Safe and Immunocompatible Nanocarriers Cloaked in RBC Membranes for Drug Delivery to Treat Solid Tumors. Theranostics. 2016;6:1004-11
41. Fischer D, Li YX, Ahlemeyer B, Krieglstein J, Kissel T. In vitro cytotoxicity testing of polycations: influence of polymer structure on cell viability and hemolysis. Biomaterials. 2003;24:1121-31
42. Ma SF, Nishikawa M, Katsumi H, Yamashita F, Hashida M. Liver targeting of catalase by cationization for prevention of acute liver failure in mice. J Control Release. 2006;110:273-82
43. Bai YH, Du Y, Xu JJ, Chen HY. Choline biosensors based on a bi-electrocatalytic property of MnO2 nanoparticles modified electrodes to H2O2. Electrochem Commun. 2007;9:2611-6
44. Luo XL, Xu JJ, Zhao W, Chen HY. A novel glucose ENFET based on the special reactivity of MnO2 nanoparticles. Biosens Bioelectron. 2004;19:1295-300
45. Pagel MD. Science to Practice: Can Photoacoustic Imaging Be Used to Monitor Tumor Oxygenation and the Effects of Antivascular Chemotherapies? Radiology. 2015;275:1-2
46. Pu KY, Shuhendler AJ, Jokerst JV, Mei JG, Gambhir SS, Bao ZN. et al. Semiconducting polymer nanoparticles as photoacoustic molecular imaging probes in living mice. Nat Nanotechnol. 2014;9:233-9
47. Rich LJ, Seshadri M. Photoacoustic imaging of vascular hemodynamics: validation with blood oxygenation level-dependent MR imaging. Radiology. 2015;275:110-8
48. Shao Q, Morgounova E, Jiang CL, Choi J, Bischof J, Ashkenazi S. In vivo photoacoustic lifetime imaging of tumor hypoxia in small animals. J Biomed Opt. 2013:18
49. Chen Y, Ye DL, Wu MY, Chen HR, Zhang LL, Shi JL. et al. Break-up of Two-Dimensional MnO2 Nanosheets Promotes Ultrasensitive pH-Triggered Theranostics of Cancer. Adv Mater. 2014;26:7019 -+
50. Octavia Y, Tocchetti CG, Gabrielson KL, Janssens S, Crijns HJ, Moens AL. Doxorubicin-induced cardiomyopathy: from molecular mechanisms to therapeutic strategies. J Mol Cell Cardiol. 2012;52:1213-25
Author contact
![]() Corresponding author: Tel: +86-28-85501986, E-mail: anderson-qiancom (Z.Y. Qian)
Corresponding author: Tel: +86-28-85501986, E-mail: anderson-qiancom (Z.Y. Qian)