Impact Factor
- Issue 14; 2026
- Issue 13; 2026
- Issue 12; 2026
- Issue 11; 2026
- Issue 10; 2026
- Volume 16; 2026
- Advance Articles
- Past Issues
- Cover Images
- Cover Suggestion
- Index & Coverage
- Special Issues
Introduction
Patients and Methods
Results
Discussion
Conclusion
Abbreviations
Acknowledgements
Supplementary Material
References
International Journal of Biological Sciences
International Journal of Medical Sciences
 Global reach, higher impact

Theranostics 2018; 8(7):1752-1765. doi:10.7150/thno.23180 This issue Cite
Research Paper
Genes involved in prostate cancer progression determine MRI visibility
Ping Li*1, Sungyong You*1,2, Christopher Nguyen2,3, Yanping Wang1, Jayoung Kim1,2, Deepika Sirohi4, Asha Ziembiec5, Daniel Luthringer4, Shih-Chieh Lin6, Timothy Daskivich1, Jonathan Wu1, Michael R Freeman1,2, Rola Saouaf5, Debiao Li2,3, Hyung L. Kim1 ![]()
1. Cedars Sinai Medical Center, Department of Surgery
2. Cedars Sinai Medical Center, Department of Biomedical Sciences
3. Cedars Sinai Medical Center, Biomedical Imaging Research Institute
4. Cedars Sinai Medical Center, Department of Pathology
5. Cedars Sinai Medical Center, Department of Radiology
6. Baylor College of Medicine, Cell Biology
*equal contribution
Received 2017-10-5; Accepted 2018-1-1; Published 2018-2-12
Abstract

MRI is used to image prostate cancer and target tumors for biopsy or therapeutic ablation. The objective was to understand the biology of tumors not visible on MRI that may go undiagnosed and untreated.
Methods: Prostate cancers visible or invisible on multiparametric MRI were macrodissected and examined by RNAseq. Differentially expressed genes (DEGs) based on MRI visibility status were cross-referenced with publicly available gene expression databases to identify genes associated with disease progression. Genes with potential roles in determining MRI visibility and disease progression were knocked down in murine prostate cancer xenografts, and imaged by MRI.
Results: RNAseq identified 1,654 DEGs based on MRI visibility status. Comparison of DEGs based on MRI visibility and tumor characteristics revealed that Gleason score (dissimilarity test, p<0.0001) and tumor size (dissimilarity test, p<0.039) did not completely determine MRI visibility. Genes in previously reported prognostic signatures significantly correlated with MRI visibility suggesting that MRI visibility was prognostic. Cross-referencing DEGs with external datasets identified four genes (PHYHD1, CENPF, ALDH2, GDF15) that predict MRI visibility, progression free survival and metastatic deposits. Genetic modification of a human prostate cancer cell line to induce miR-101 and suppress CENPF decreased cell migration and invasion. As prostate cancer xenografts in mice, these cells had decreased visibility on diffusion weighted MRI and decreased perfusion, which correlated with immunostaining showing decreased cell density and proliferation.
Conclusions: Genes involved in prostate cancer prognosis and metastasis determine MRI visibility, indicating that MRI visibility has prognostic significance. MRI visibility was associated with genetic features linked to poor prognosis.
Keywords: prostate cancer, MRI, RNAseq, diffusion weighted imaging, prognosis
Introduction
Prostate cancer is the most commonly diagnosed noncutaneous malignancy in men [1]. Multiparametric MRI is gaining acceptance as a tool for managing prostate cancer. Tumors visible on MRI are being targeted for biopsy, focal ablation and monitoring during active surveillance. However, not all tumors are visible on MRI [2-5]. It is tempting to assume that all clinically significant and potentially lethal tumors are visible on MRI. However, even some high-grade tumors are not seen on modern MP-MRI, and there is little information on the metastatic potential of these tumors.
Most men with newly diagnosed prostate cancer are candidates for active surveillance and do not need definitive local therapies such as prostatectomy or radiotherapy. However, men on active surveillance require serial transrectal prostate biopsies, and because most prostate tumors are not visible on MRI, men undergo systematic biopsies of the entire gland. Each systematic biopsy is associated with a 1-4% risk of sepsis due to rectal flora introduced into the blood stream [6]. A surveillance strategy that is less reliant on invasive biopsies can have a major impact on the burden of active surveillance on individual men and the health care system.
In this study, we sought to better understand the molecular basis for tumor visibility on diffusion weighted MRI, and assess its prognostic significance. We started by mapping tumors seen on prostatectomy pathology, noting their grade, size and location. Tumors both visible and invisible on MRI were dissected and analyzed by RNA sequencing. Comparison of gene expressions identified genes and pathways associated with MRI visibility. Several of these genes correlated with metastasis and survival, independent of clinical prognostic factors; and, their expression profiles suggest that tumors not visible on MRI are more favorable. To better understand the biology underlying tumor visibility, a human prostate cancer cell line was genetically manipulated based on our RNAseq analysis. When these cells were used to establish xenograft tumors in mice, decreased MRI visibility was associated with decreased cellular proliferation and cell density. Our results provide a biologic basis for understanding MRI visibility and indicate that MRI characteristics can reflect clinically relevant cancer biology with prognostic implications.
Patients and Methods
Patients and Tissues
Patients who had preoperative MRI and radical prostatectomy were identified from the institutional prostate cancer database. Cedars-Sinai Medical Center Pathology Department (Los Angeles, CA) provided sections from 16 primary prostate tumors from formalin-fixed paraffin-embedded (FFPE) blocks. Following radical prostatectomy, prostate specimens were fixed in 10% neutral buffered formalin and processed according to the International Society of Urological Pathology Consensus Guidelines on prostatectomy handling [7]. Briefly, after fixation and surface capsular inking with multiple colors for anatomic orientation, 5 mm bladder neck and apex shave sections were sampled as margins parallel to the urethra, as were longitudinal sections of both seminal vesicles. The remainder of the gland was sectioned in 3 mm increments perpendicular to the urethra. For prostates <30 g, all serial sections were submitted entirely; for prostates >30 g an ISUP Guideline-compliant partial submission protocol was used, which emphasizes submission of all grossly visible tumor and any areas suspicious for cancer. The sections were submitted with ordered anatomic designations to enable three-dimensional reconstruction of the gland from histologic sections. The FFPE tissues had been stored for 1 to 5 years at room temperature prior to use in this study.
Patient MR Imaging and Interpretation
All patients underwent imaging using a 3.0 T MRI system (Verio, Siemens) equipped with a 12-channel pelvic phased array coil [8]. Anatomical images, including Axial T1-weighted turbo spin echo (0.6×0.6×3.0 mm3, TR/TE = 650/11 ms) and Axial/Sagittal/Coronal T2-weighted turbo spin echo (0.6×0.6×3.0 mm3, TR/TE = 5000/125 ms). Axial diffusion-weighted imaging (DWI) was acquired using a standard single-shot echo-planar imaging sequence (2.1×1.7×3.5 mm3. TR/TE = 5000/80 ms, iPat = 2, NEX = 3). Three orthogonal diffusion directions including a single b0 measurement were acquired at two nonzero b-values, (400 and 800 s/mm2), yielding a total of 3 measurements to calculate the apparent diffusion coefficient (ADC) maps. Dynamic contrast enhanced (DCE) MRI (1.3×1.3×3.5mm3, TR/TE = 3.02/1.09 ms, temporal resolution = 10 s) was acquired and consisted of a pre-scan, a series of continuous acquisitions of 30 volumes post contrast delivery, and a final 9 min delay post scan. The DWI and dynamic series were post-processed on Hologic Aegis workstation (version 3.2.3.3). All cases were reviewed by two radiologists with 20 years and 1 year of expertise in prostate MRIs, respectively. All lesions were assigned a score according to the prostate imaging and reporting data system, version 2 (PI-RAD v2) [9].
RNA Extraction
Tumor volume was calculated using the formula V = (L × W × W)/2, where V is tumor volume, W is tumor width, L is tumor length [10]. Representative H&E slides showing the tumor outline are shown in Figure S1.
Our method for RNA extraction from FFPE renal tumors has been previously described [11]. Briefly, RNA was extracted from nine 10 μm sections. Tumor sections were placed in 2.0 mL RNase-free Eppendorf tubes. Sections were treated twice with 1.9 mL xylene for 5 min at 55 °C while rocking. The sections were washed twice with 100% ethanol. RNA was extracted from the paraffin samples using the MasterPure™ RNA Purification Kit (Epicenter Biotechnologies, Madison, WI, USA). In an attempt to further increase RNA yield, FFPE samples were treated with 200 μg proteinase K for 3 h at 55 °C. RNA was then treated with 20 units DNase I (Ambion, Austin, TX, USA) for 30 min and checked for residual genomic DNA by TaqMan RT-PCR targeting ACTB. If there was measurable DNA after 34 PCR cycles using 50 ng input RNA, the samples were treated with 20 units DNase I for an additional 15 min, and the assay for residual DNA was repeated. The final RNA concentration (A260:0.025) and purity (A260:A280 ratio) were measured using a NanoDrop ND-2000 spectrophotometer (NanoDrop Technologies, Wilmington, DE, USA).
RNAseq Library Preparation and Sequencing
All H&E stained sections from each case were reviewed by two genitourinary pathologists (DS and DL) who mapped each tumor (location, size and Gleason; Figure 1 and Table 1S) and drew an outline of the tumor directly on the slide, which facilitated the macrodissection of the tumor for RNA extraction (Figure S1). The RNA characteristics are listed in Table S2. For RNA sequencing (quantification) analysis, 300 ng total RNA were sent to Beijing Genomics Institute, Hong Kong. Sample quality was tested by Agilent 2100 Bioanalyzer (Agilent technologies, Santa Clara, CA, USA; Figure S2). For library preparation, total RNA was hybridized with the probe, treated with RNase H and depleted of rRNA. Then RNA was subjected to fragmentation, cDNA synthesis, adaptor ligation and PCR. Amplified PCR product was sequenced on Illumina HiSeqTM 4000 (Illumina Inc, San Diego, CA, USA). The average depth of sequencing for each library was 26 million reads (Table S3).
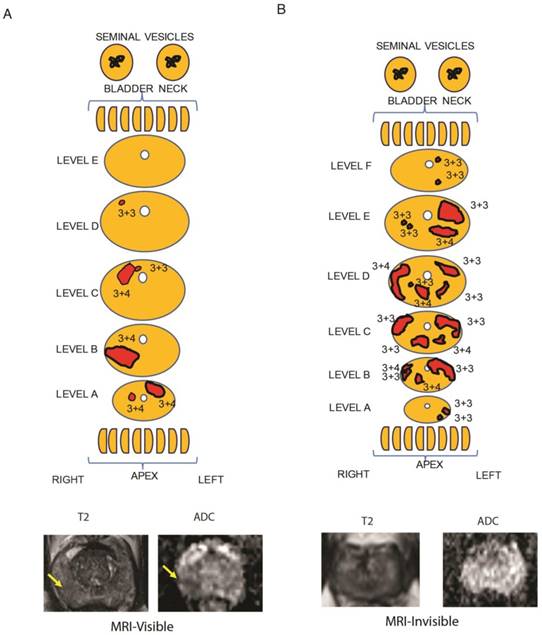
Representative tumor maps from prostatectomy pathologies and MRI. Tumor maps were created based on prostatectomy pathology. The representative maps show 5 mm sections from the bladder neck and apex, parallel to the urethra. They show sections through the main prostate, perpendicular to the urethra taken at 3 mm increments. The tumor location and tumor-specific Gleason scores are note. The size of the sections and each tumor size are listed in Table S1. A) From a representative patient with a MRI-visible tumor (yellow arrow), the pathology map and the axial MRI slice corresponding to level B is shown. T2-weighted MRI and apparent diffusion coefficient map are shown for a prostate cancer detected as a hypointense or darker region. B) From a representative patient with a MRI-invisible tumor, the pathology map is shown along with the corresponding axial MRI slice from level E. Despite histologically proven cancer the MRI is normal.
MRI4 signature applied to two external datasets to predict recurrence free survival
| Univariate analysis | Multivariate analysis | ||||||||
|---|---|---|---|---|---|---|---|---|---|
| Variable | Coefficient | Hazard ratio | P value | C-index | Variable | Coefficient | Hazard ratio | P value | C-index |
| Cox proportional hazards analysis in Taylor et al. (GSE21034) | |||||||||
| MRI4 | 0.93 | 2.53 (1.55-4.11) | <0.001 | 0.7 | MRI4 | 0.74 | 2.09 (1.27-3.44) | 0.003 | 0.78 |
| Gleason score | 0.86 | 2.36 (1.48-3.77) | <0.001 | ||||||
| Gleason score | 0.96 | 2.62 (1.69-4.06) | <0.001 | 0.72 | MRI4 | 0.86 | 2.36 (1.37-4.05) | 0.002 | 0.72 |
| Stage | 1.34 | 3.81 (1.41-10.31) | 0.008 | ||||||
| Stage | 1.73 | 5.64 (2.14-14.80) | <0.001 | 0.56 | MRI4 | 0.65 | 1.92 (1.31-2.81) | <0.001 | 0.74 |
| PSA level | 0.002 | 1.00 (0.99-1.01) | 0.149 | ||||||
| PSA level | 0.01 | 1.01 (1.00-1.01) | 0.011 | 0.67 | MRI4 | 0.67 | 1.95 (1.10-3.46) | 0.021 | 0.77 |
| Gleason score | 0.79 | 2.21 (1.36-3.58) | 0.001 | ||||||
| Stage | 1.27 | 3.56 (1.21-10.50) | 0.021 | ||||||
| PSA level | 0.002 | 1.00 (0.99-1.01) | 0.243 | ||||||
| Cox proportional hazards analysis in Taylor et al. (GSE40272) | |||||||||
| MRI4 | 0.26 | 1.30 (1.04-1.63) | 0.021 | 0.61 | MRI4 | 0.22 | 1.24 (1.01-1.53) | 0.037 | 0.65 |
| Gleason score | 0.82 | 2.27 (1.15-4.49) | 0.018 | ||||||
| Gleason score | 0.93 | 2.53 (1.23-5.18) | 0.011 | 0.63 | MRI4 | 0.12 | 1.13 (0.90-1.41) | 0.308 | 0.63 |
| Stage | 1.69 | 5.44 (1.74-16.92) | 0.003 | ||||||
| Stage | 1.90 | 6.68 (2.34-19.05) | <0.001 | 0.59 | MRI4 | 0.28 | 1.32 (1.06-1.64) | 0.012 | 0.65 |
| PSA level | 0.05 | 1.05 (1.01-1.09) | 0.007 | ||||||
| PSA level | 0.04 | 1.04 (1.01-1.53) | 0.016 | 0.64 | MRI4 | 0.12 | 1.13 (0.89-1.42) | 0.310 | 0.68 |
| Gleason score | 0.55 | 1.74 (0.82-3.64) | 0.143 | ||||||
| Stage | 1.24 | 3.45 (0.91-12.96) | 0.066 | ||||||
| PSA level | 0.02 | 1.04 (1.00-1.08) | 0.025 | ||||||
Cell culture and treatment
PC3 cells carrying a doxycycline-inducible miR-101 gene (miR-101-PC3) were a gift from Dr. Ming-Jer Tsai in Baylor College of Medicine (Houston, TX). miR-101-PC3 cells were cultured in DMEM medium supplemented with 10% FBS, antibiotics (100 μg/mL streptomycin and 100 U/mL penicillin G), 5 μg/mL G418 and 1 μg/mL puromycin in a humidified atmosphere of 5% CO2 and 95% air at 37°C. Medium was changed every three days of incubation. Cells were checked for mycoplasma contamination by using MycoAlert Mycoplasma Detection kit (LONZA) within 6 months of conducting all experiments. miR-101-PC3 cells were seeded into 6-well plates at a concentration of 1.5×10⁵/well. Cells were treated with or without 5 μL/mL doxycycline. 72 h later, cells were harvested and counted using TC20™ Automated Cell Counter (Biorad, Hercules, California).
Cell migration and invasion
Migration chamber preparation: Falcon® permeable support for 24 well plates with 8 μm transparent PET membrane was coated on the outside with 60 μL of 0.015 μg/μL collagen type I solution. The coated support was dried in a cell culture hood for 1-2 h and then put into 24-well plates.
Invasion chamber preparation: The Falcon® permeable support was coated on the inside with 60 μL of 200 μg/mL Corning Matrigel matrix. The coated support was put into 24-well plates and incubated at 37 °C for 0.5-1 h.
Cells preparation: Cells were grown in a 6-well plate. The culture medium was replaced with FBS-free medium 24 h before the migration and invasion assay. A total of 5×10⁴ cells (for migration assay) or 1×10⁵ cells (for invasion assay) were plated into the chamber containing FBS-free medium. Culture medium with 10% FBS was then added to the well and incubated for 4 h (for migration) or 24 h (for invasion). After incubation, medium was aspirated, cells were fixed with 4% paraformaldehyde and then stained with 0.12 μg/μL crystal violet solution. The cells inside the chamber were removed. The migrated/invaded cells were counted and analyzed using All-in-one Fluorescence Microscope BZ-X700 from Keyence (Itasca, IL).
Western blot
Cells were washed with ice-cold PBS before being treated with RIPA buffer (50 mM Tris-HCl pH 7.5, 150 mM NaCl, 1 mM EDTA, 10 mM DL-Dithiothreitol, 10% glycerol, 0.5% sodium deoxycholate, 1% Triton-X100) supplemented with 10 mM NaF, protease inhibitors (1:100 dilution of protease inhibitor cocktail from SIGMA-Aldrich). Protein concentrations were measured with the Bio-Rad Protein Assay. 40 μg of lysate was subjected to Western blot analysis. The blots were probed with CENPF, (1:500, Ab5, Abcam) and β-actin (1:1000, clone AC-15, Sigma) antibodies.
Mice
Male Fox Chase SCID® Beige mice were purchased from Charles River Laboratories (San Diego, CA). Mouse tumors were generated by subcutaneously injecting 1×10⁶ miR-101-PC3 cells into the flank. Doxycycline (0 or 2 μg/mL) was added to drinking water starting 2 days after injection of tumor cells.
All mice were housed under pathogen-free conditions. All experiments involving animals were in compliance with federal and state standards, which include the federal Animal Welfare Act and the NIH guide for the care and use of laboratory animals. Tumor diameter was measured with calipers and tumor volume was calculated (shortest diameter2 × longest diameter/2). 20-30 days after injection, tumors were scanned for MRI visibility. The mice were sacrificed, and the tumors were removed to be fixed in 10% neutral buffered formalin.
Immunohistochemistry Staining and microscopy analysis
Xenograft tumors were removed and were routinely formalin-fixed and embedded in paraffin blocks. Paraffin blocks were cut to 5 μm sections. H&E staining and immunohistochemistry staining was done on Discovery Ultra Autostainer from Ventana Medical Systems (Tucson, AZ). All the antibodies and reagents were from Ventana Medical Systems unless indicated otherwise. Briefly, antigen retrieval was done with Ventana CC1 Buffer (pH 8) for 64 min at 95 °C. Blocking was performed with Ventana Inhibitor CM for 12 min. Slides were incubated with primary antibodies individually for 32 min at 37 °C. For Ki-67 staining, Ki-67(30-9) primary antibody was used. The slides were then incubated with Anti-Rabbit HQ secondary antibody for 20 min at 37 °C. For CD31 staining, CD31 (JC70) primary antibody was used, and the slides were incubated with Anti-Mouse HQ secondary antibody for 12min at 37 °C. Slides were then incubated with Anti-HQ HRP linking antibody for 20 min (for Ki-67 staining) or 12 min (for CD31 staining). Finally, slides were incubated with Discovery ChromoMap DAB reagent. All slides were counterstained by hematoxylin.
All the slides were scanned at 20x magnification using Aperio Scanscope AT Turbo from Leica Biosystems Inc (Buffalo Grove, IL). Digital slides were visualized and analyzed using Leica Systems Tissue Image Analysis 2.0. All tumor areas were selected for analysis with high magnification (×20 objective). Ki-67 algorithm preference was used for Ki-67 analysis. Default preferences for “Measure Stained Area” were used for CD31 analysis. Default preferences for “Measure Stained Cells” were used for H&E staining, and cell density was calculated by the formula: 106 × total number of cells / total tissue area (µm2).
Mouse Imaging and Interpretation
In vivo MRI was performed on a 9.4 T small animal scanner (BioSpec 94/20 USR, Bruker Biospin). A surface coil was placed on the lesion and anatomical scout images were acquired to localize the lesion using a steady-state free precession (SSFP) readout (TR = 2.3 ms, TE = 1.86 ms, NEX = 10, spatial resolution = 0.2 × 0.2 × 1.0 mm3, flip angle = 30º). Eleven diffusion-weighted images were acquired (b = 3, 33, 60, 87, 113, 165, 192, 217, 424, 832, and 1442 s/mm2) in three orthogonal directions using a single shot echo-planar imaging (SS-EPI) readout (TR = 3000 ms, TE = 20 ms, NEX = 8, spatial resolution = 0.4 × 0.4 × 2.0 mm3). A bi-exponential non-linear least squares fit was applied in each voxel to calculate apparent diffusion coefficient (ADC) and pseudo perfusion coefficient (D*) maps assuming the following intravoxel incoherent motion (IVIM) model [12]: S/S0 = e-b(fD*+(1-f)ADC), where S/S0 is the normalized diffusion weighted signal, b is the b-value, and f is the vascular volume fraction. Regions of interest (ROI) to calculate mean lesion ADC were manually placed at the center of the lesion for each slice to reduce the effect of partial volume artifact.
Statistics
Sequence reads were aligned to the GRCh37/hg19 build of the Homo sapiens genome using the Subread aligner [13], implemented in the R subread software package. Gene-wise counts were obtained using featureCounts [14] and its inbuilt hg19 annotation, which includes Entrez gene ID, chromosome and gene length information, corresponding to the NCBI RefSeq annotations. The raw counts were used for differential expression testing in DESeq2 [15] and differentially expressed genes (DEGs) were selected with a false discovery rate (FDR) of 0.05, which was computed by Storey's correction method for multiple comparisons [16]. Read counts were converted to log2, TMM normalized [17]. Functional enrichment analysis of the DEGs was performed using DAVID software (online at http://david.abcc.ncifcrf.gov/) to identify cellular processes overrepresented by the DEGs between MRI-visible and -invisible tumors. Angiogenesis signature was from MSigDB (http://software.broadinstitute.org/gsea/msigdb/index.jsp) and enrichment score was computed by gene set enrichment analysis (GSEA) method. For every comparison, Genes with adjusted P value<0.05 were considered significant. Sequence data that support the findings of this study have been deposited in GEO (GSE95369).
For RNAseq analysis, we performed a minimal pre-filtering to remove genes that have only 0 or 1 read for downstream analysis. Predicted genes and the genes without official gene symbols were also removed. To evaluate our 4-gene signature and previously published signatures, the classifiers were trained and applied to the MRI visibility data set. We then compared classification efficiency by area under the ROC curves of the three classifiers. Akaike information criterion (AIC) and Bayes information criterion (BIC) were also computed to assess model accuracy. Leave-one-out cross validation was used to estimate classification error. To assess dissimilarity, Euclidean distance was computed as a dissimilarity measure between the two vectors of fold change based on MRI visibility and based on Gleason score or tumor size. A permutation test strategy was used to determine the significance of overlap of DEGs and tumor size-correlated genes. A total of 100,000 random permuted samples were used to compute the empirical P value of the overlapping genes. To evaluate our MRI4 gene signature, we modeled classifiers with three independent gene signatures including MRI4, Nakagawa signature [18], and Decipher signature [19] by logistic regression method.
Kaplan-Meier curve analysis and Cox proportional hazard regression analysis were performed to examine the relationship between clinical relapse and gene expression using independent datasets [20] [21]. Comparisons of the numerical data between groups were performed by Wilcoxon rank-sum test and Student's t-test. P values < 0.05 were considered statistically significant. For risk assessment of the MRI4 signature, we determined a risk score using principal component analysis (PCA). We found its coordinates in the PCA coordinate systems obtained from our MRI dataset in order to project the independent datasets, and then multiplied MRI4 gene expression values of new data from the independent datasets with the PCA rotation (or loadings) matrix. Finally, the first principal dimension using PCA was extracted from the expression matrix of the MRI4 signature as the risk score of the MRI4 signature.
Study Approval
This study was approved by Cedars-Sinai Medical Center's Institutional Review Board (IRB 00019812). The need for patient consent was waived. All animal studies were approved by the Institutional Animal Care and Use Committee (IACUC 006360).
Results
Tumor Characteristics
As a first step, MRI visibility status was determined for prostate cancers. We identified patients who underwent prostatectomy who had preoperative multiparametric (MP)-MRI of the prostate that was negative for PIRADS 2-5 lesions. These tumors were considered MRI-invisible. During the same time interval, we randomly identified patients who underwent prostatectomy and had tumors that were seen on MP-MRI (PIRADS 4-5 lesions). To ensure that the radiologist and pathologist were referring to the same tumor, detailed maps of the histology were created and compared to the MP-MRI (Figure 1, Table S1). Tumors were mapped, noting the location, size and Gleason score for each tumor. Representative MRI images of visible and invisible lesions are shown in Figure 1A and B. The T2 images are best suited for visualizing normal prostate anatomy and ADC maps are used to visualize tumors. Patients with MRI-visible tumors tended to have Gleason 7-9 tumors; however, 2 patients with MRI-invisible tumors also had Gleason 7 tumors (Table S4). A single dominant tumor with appropriate MRI visibility status was macrodissected from FFPE sections for each patient and RNAseq was performed.
Differential Gene Expression between MRI-Visible vs. -Invisible Tumors
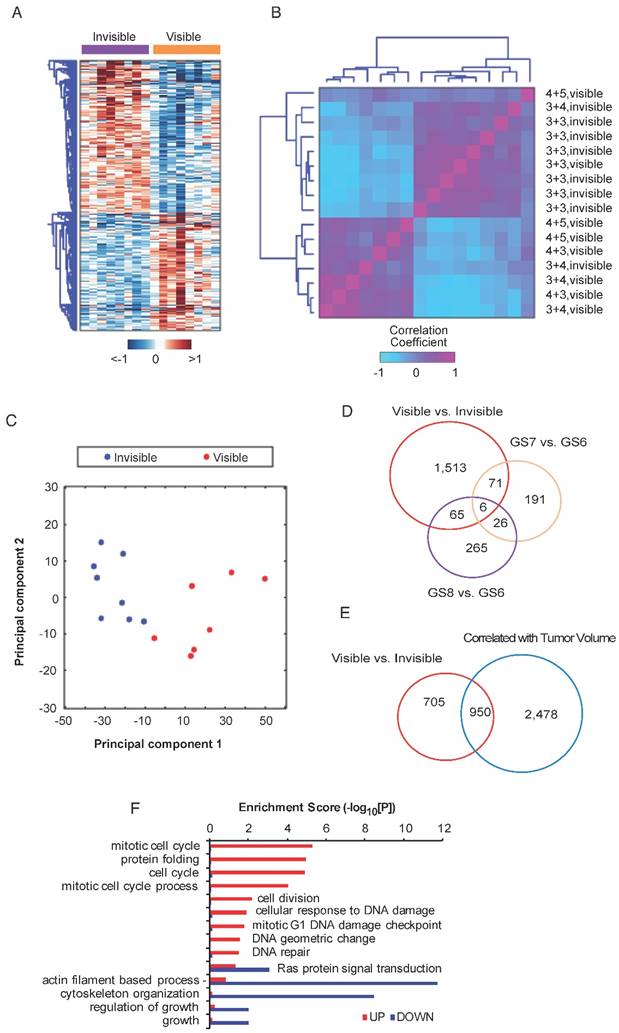
To identify genes associated with MRI visibility, RNAseq was performed for MRI-visible and -invisible tumors. Genes were selected with FDR <0.05 and fold change ≥1.5. A total of 1,654 genes were differentially expressed with 933 up-regulated genes and 721 down-regulated genes. A heatmap of the DEGs shows the difference in expression between MRI-visible and -invisible tumors (Figure 2A). A correlation matrix-based hierarchical clustering analysis was used to extract correlation patterns from MRI-visible and -invisible tumors using the median-centered profile of the DEGs, which resulted in two clusters based on MRI visibility status (Figure 2B). Principal component analysis revealed that the first two principal components perfectly separate tumors based on MRI visibility (Figure 2C). This indicates that MRI visibility is linked to specific gene expressions.
Differential expression analysis of MRI-visible and -invisible tumors. Genes with FDR <0.05 and fold change ≥1.5 were selected. A) Heatmap showing the expression pattern of the differentially expressed genes (DEGs) in visible and invisible tumors. Hierarchical clustering of the DEGs was performed using Euclidean distance and ward linkage method. B) A correlation matrix shows the distribution of Gleason scores and visibility status. C) A biplot of the first two principal components based on DEGs shows perfect separation of the MRI-visible and -invisible tumors. D and E) To assess the biological basis for MRI visibility, differential expression analyses were performed based on visibility status (MRI-visible vs. -invisible), Gleason score (GS6 vs. GS7, GS6 vs. GS8) and tumor volume (genes significantly correlated vs. not correlated with volume). D) The Venn diagram shows modest overlap between genes differentiating MRI visibility and Gleason scores. E) There was moderate overlap between genes differentiating MRI visibility and genes associated with tumor volume. F) Bar graph depicting the significance level of enriched pathways associated with MRI visibility status.
Biological Basis for MRI Visibility
It is possible that tumors visible on MRI are simply high-grade tumors or large tumors. To better understand the relationship between MRI visibility and tumor grade or tumor size, a differential expression analysis was performed for various Gleason scores (7 vs. 6 and 6 vs. 8) and for tumor volume. A Venn diagram shows that genes associated with tumor visibility have modest overlap with genes associated with various Gleason scores (Figure 2D). There was greater overlap between genes associated with MRI visibility and tumor volume; however, there were 705 genes that were only associated with MRI visibility but not tumor volume (Figure 2E). A dissimilarity analysis confirmed that fold changes of the DEGs based on MRI visibility and based on Gleason score were significantly different (p<0.0001, Figure S3A, B). This was also the case for MRI visibility and tumor size (p<0.039, Figure S3C). These results suggest that MRI visibility is not fully explained by variability in Gleason score or tumor volume. Furthermore, difference in mean tumor volumes of the MRI-visible and MRI-invisible tumors was not statistically significant (Figure S3D). A functional enrichment analysis identified potential pathways associated with MRI visibility (Figure 2F).
Genes Associated with MRI Visibility Driving Prognosis
Based on the pathway analysis, we hypothesized that some of the genes determining MRI visibility are also important in determining cancer prognosis. To identify genes associated with MRI visibility that may be driving prognosis, we used a publicly available gene expression dataset from Gulzar et al. (GSE40272), which evaluated 98 prostatectomy samples and contains information on recurrence free survival (RFS). There were 33 genes associated with both MRI visibility and RFS, and 26 of these genes had fold changes in concordant directions in the two datasets (Figure 3A). Of these 26 genes, there were 4 genes that were differentially expressed between primary and metastatic prostate deposits in two additional external datasets (GSE359888 and GSE21034). In this manuscript, we refer to these genes as MRI4. Interestingly, these genes had modest fold change (<1.5) when comparing recurrent and nonrecurrent prostate cancer in GSE40272 (Figure 3B), and therefore Gulzar et al. did not identify them in their original analysis as being associated with recurrence. However, groups separated by high/low expression of each of the 4 genes had different RFSs at FDA <0.1 (Figure 3C).
Genes associated with MRI visibility that determine prognosis. A) This schematic describes the use of external datasets to identify genes associated with MRI visibility that are also associated with progression free survival (PFS) and metastatic deposits. B) This analysis identified four genes (MRI4). The fold changes in gene expression comparing recurrent and nonrecurrent prostate cancer in the external dataset (GSE40272) are provided. C) PFS is shown for MRI4 in the independent dataset, GSE40272. D and E) In two additional independent datasets (GSE35988 and GSE21034), these genes had significantly different expressions in primary and castration-recurrent prostate cancer (CRPC) metastases. F) None of the MRI4 genes were differentially expressed when comparing tumors based on tumor-volume. None of the MRI4 genes correlated significantly with tumor volume.
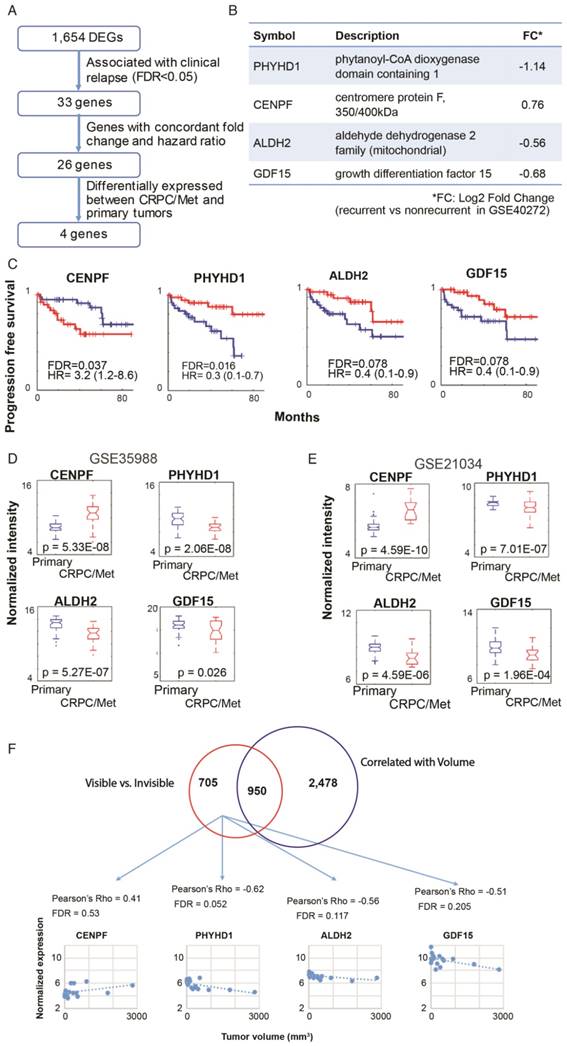
These four genes were identified in two external datasets (GSE359888 and GSE21034) where the expression of primary tumors and castration-recurrent metastatic prostate cancers were compared. The majority of newly diagnosed prostate cancers are indolent and can be managed with active surveillance rather than immediate surgery or radiation; however, lethal prostate cancer has the potential to metastasize. Metastatic potential clearly identifies prostate cancers that require aggressive treatment. All four genes in MRI4 had significantly different expression with the same direction of differential expression in both datasets (Figure 3D, E). Therefore, these 4 genes, identified in multiple external datasets, may play a role in conferring metastatic potential to MRI-visible prostate cancers.
Each of the MRI4 genes had weak and statistically insignificant correlations with tumor size (Figure 3F). This is not surprising since all four genes were initially contained in a group of 705 genes selected for determining MRI visibility but not tumor size. Taken together, these results suggest that the MRI4 genes, which are associated with tumor recurrence and metastasis, contribute to tumor visibility, independent of tumor size.
Established Prognostic Genes Predict MRI Visibility
Another complementary and reciprocal strategy for linking MRI visibility to cancer prognosis starts with well-established prognostic genes. If we hypothesize that MRI visibility has prognostic significance, then it would follow that prognostic genes will predict MRI visibility status. Decipher® is a commercially available molecular test that uses prostatectomy samples to measure the expression of 22 RNA biomarkers and predict the risk of developing clinical metastasis [22, 23]. Nakagawa et al. performed a case-control study of men who had a PSA recurrence after prostatectomy at the Mayo Clinic, comparing 213 men who developed clinical metastasis to 213 who did not develop clinical metastasis within 5 years of the PSA rise [18]. They developed a 17-gene expression signature. Neither of these prognostic signatures includes any of the MRI4 genes. Both of these previously reported prognostic signatures as well as our MRI4 signature (Figure 3) were able to predict MRI visibility in our dataset (Figure 4A). The first two principal components of all 3 signatures separated cases based on MRI visibility (Figure 4B).
MRI4 genes predict MRI visibility and biochemical recurrence-free survival. A) MRI4 and genes from two previously published prognostic signatures predict MRI visibility. Akaike information criterion (AIC), Bayes information criterion (BIC), and leave-one-out cross validation error (LOO error) are provided. B) Principal component analysis shows that the first two components from prognostic signatures provide excellent separation based on MRI visibility status. C) In two external datasets (GSE21034 and GSE40272), MRI4 genes define two groups with significantly different biochemical recurrence-free survival.
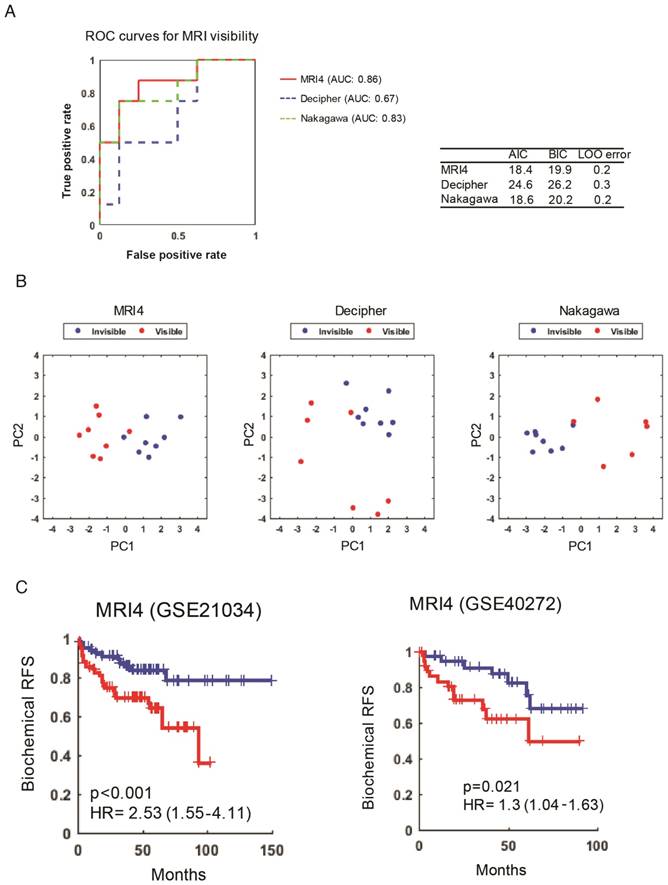
MRI4 Independently Predicts Progression Free Survival
To provide additional evidence that MRI4 is a prognostic signature, MRI4 was applied to two external datasets (GSE21034 and GSE40272). High and low risk groups defined by MRI4 had statistically different biochemical RFS (Figure 4C). In multivariable analysis, MRI4 was a significant predictor of RFS, independent of PSA, stage and grade, suggesting that MRI4 may be a useful genomic signature for clinical decision-making (Table 1). However, also important is that this analysis provides strong evidence for MRI visibility being a prognostic biomarker.
Functional Analysis of CENPF and miR-101 on Cell Migration and Invasion
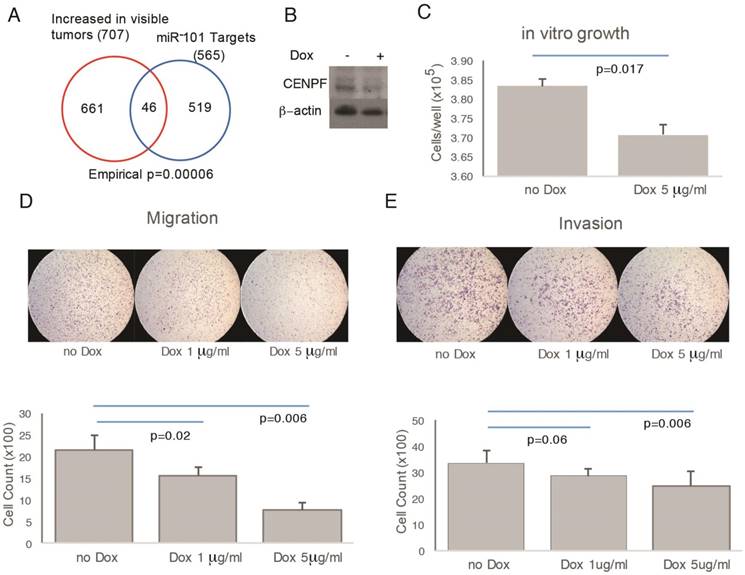
To assess function, CENPF was knocked out in PC3 cells; however, the resulting cells did not proliferate and were not suitable for further study (data not shown). miR-101 negatively regulates CENPF expression [24]. Therefore, as an alternate strategy to manipulate CENPF, a doxycycline-inducible miR-101 system was used. In support of this approach, the RNAseq profiles from prostatectomies showed significant overlap between miR-101 targets and DEGs comparing visible and invisible tumors (Figure 5A, B). However, this approach leaves open the possibility that miR-101 target genes other than CENPF may be contributing to phenotypes we observe. Despite this limitation, this model system is suitable for demonstrating the principle that genetic manipulation that alters cancer biology can influence MRI visibility. Doxycycline decreased the growth of miR-101-PC3 cells in vitro (Figure 5C). Doxycycline decreased both the migration and invasion of miR-101-PC3 cells in a dose dependent manner (Figure 5D, E).
Overexpression of miRNA101 and down regulation of CENPF alter cell migration and invasion. A) There was statistically significant overlap in the Venn diagram of genes differentially expressed based on MRI visibility of human prostate cancer and miR-101 target genes. B) PC3 cells carrying a doxycycline-inducible miR-101 gene (miR-101-PC3) were treated with doxycycline (dox) for 72 h and the Western blot showed a reduction in CENPF. C) miR-101-PC3 treated with dox showed decreased cell growth. D and E) miR-101-PC3 treated with dox showed decreased migration (4 h) and invasion (24 h) in a dose-dependent manner. Results are representative of triplicate experiments.
CENPF and miR-101 on MRI Visibility and Histology of Xenograft Tumors
To assess the role of CENPF and miR-101 on tumor visibility, miR-101-PC3 cells were implanted into mice. As expected, mice with miR-101-PC3 tumors fed doxycycline had decreased CENPF protein levels in the tumors and decreased tumor growth (Figure 6A). For patients undergoing MP-MRI, prostate cancers are identified on DWI and tumors that are less visible have higher ADC values, reflecting lower restriction of water diffusion when compared to benign tissue. Mice that had doxycycline added to drinking water had significantly increased tumor ADC values, indicating decreased visibility (Figure 6B, C). ADC values largely reflect the movement of intracellular water. DWI can be used to estimate the movement of extracellular water, which largely reflects tumor perfusion (D*). D* values were increased in the doxycycline mouse group, suggesting decreased tumor perfusion in the poorly visible tumors (Figure 6D, E). It is not technically feasible to inject IV contrast into mice, however, D* provides similar information provided by DCE images in clinical MRIs.
Overexpression of miR-101 and down regulation of CENPF decrease PC3 visibility in mice. A) Mouse tumors were generated by subcutaneously injecting 1×10⁶ miR-101-PC3 cells into SCID mice (n=14). Mice given doxycycline (dox) in their drinking water had decreased CENPF in their tumor. Mice given dox also had decreased tumor growth. B and C) On MRI, the miR-101-PC3 tumors from mice given dox were less visible, with higher ADC values (red on ADC image) on diffusion weighted images (DWI). Results are representative of duplicate experiments. D and E) On MRI, mouse tumor vascular perfusion and diffusion were measured separately. Lower perfusion and diffusion values correlate with better visibility on DWI. F) Representative H&E staining, Ki-67 staining and CD31 staining are shown at ×20 magnification. G) Mice that had doxycycline (dox) added to drinking water had tumors with decreased cell density, decreased Ki-67 staining and decreased CD31 staining. H) Correlation analysis of CENPF and angiogenesis gene signature or tumor angiogenesis-associated genes in the RNAseq dataset. Scatter plots display the distribution of the samples by gene expression or enrichment score. The dotted line indicates the regression line. Correlation was assessed by Spearman's correlation coefficient (Spearman's rho).
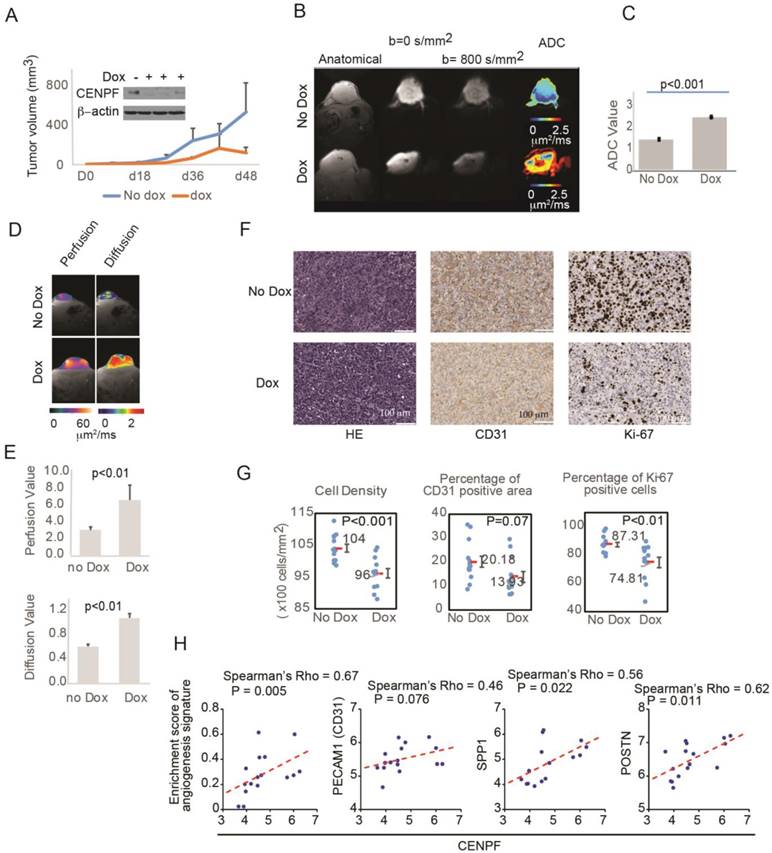
To understand the histologic changes responsible for changes in diffusion and perfusion on MRI, xenograft tumors were examined histologically (Figure S4). Representative H&E staining, Ki-67 staining and CD31 staining are shown in Figure 6F. Tumors from mice given doxycycline were less visible and had decreased cell density and decreased Ki-67 positivity (Figure 6F, G). Therefore, miR-101 induction decreased cell proliferation and decreased cell density, which can decrease water restriction and lowered visibility on DWI. The decrease in CD31 staining approached statistical significance, suggesting that decreased angiogenesis may also contribute to lower visibility. To further examine the role of angiogenesis, we analyzed the correlation between CENPF and angiogenesis gene signature or endothelial genes in our RNAseq dataset. The angiogenesis signature was significantly correlated with CENPF expression. CENPF expression also correlated with individual angiogenesis genes such as SPP1 and POSTN, and the correlation between CENPF and PECAM1 (CD31) approached significance.
Discussion
Multiparametric (MP)-MRI is the best imaging modality for primary prostate cancer and combines images that are T2-weighted, diffusion-weighted, and DCE. It is commonly employed to help detect and localize prostate cancer [25, 26]. Unfortunately, MRI alone is unable to detect all prostate cancers. Therefore, prostate biopsies are necessary despite a nearly 4% risk of hospitalization due to rectal bleeding and sepsis [27]. The limitations of modern MP-MRI are well documented. In up to 96% of cases, standard MP-MRI cannot detect small (<0.5 cm3), low grade (i.e., Gleason 3+3) prostate cancers [2, 3]. This is concerning because the long-term natural history of these small lesions is not fully known. Furthermore, even higher-grade cancers can escape detection on MP-MRI. Radtke et al. compared saturation transperineal biopsy with MRI-US fusion targeted biopsies and found that almost 20% of intermediate and high-grade (i.e., Gleason 7 or greater) tumors are missed [4]. Therefore, until we have stronger evidence that lesions not detected on standard MRI can be safely ignored, particularly in younger patients, efforts are needed to identify and characterize these lesions.
This study sought to characterize genes associated with MRI visibility. We reasoned that if lack of visibility on MRI is associated with favorable prognosis and minimal risk of metastasis, then patients undergoing MRI-directed prostate biopsies might not need random biopsies of apparently normal regions of the prostate. For patients presenting with an abnormal PSA, judicious use of MP-MRI can reduce the number of patients needing biopsy and the number of patients diagnosed with indolent cancers requiring surveillance. For patients with unifocal tumors, there would be less concern about missing a potentially lethal tumor by MRI, and focally ablative therapies could be applied with the goal of minimizing complications associated with radical surgery.
As a first step to establishing the prognostic significance of MRI visibility, we created detailed maps of prostate cancers using prostatectomy specimens from patients with MRI-visible and MRI-invisible tumors. These maps allowed for precise macrodissection of well-characterized prostate tumors for RNA sequencing. The difference in gene expression between MRI-visible and MRI-invisible tumors was not fully explained by differences in Gleason score or tumor volume. Support for the prognostic significance of MRI visibility was provided by using genes from two established prognostic signatures, including a commercially available signature, to accurately predict tumor visibility.
Pathway analysis revealed insights into biological processes that may account for tumor visibility. Pathways and gene sets classically associated with tumor progression were enriched in MRI-visible tumors, including gene sets for mitotic cell cycle, protein folding, cell cycle, mitotic cell cycle process, and cell division. Gene sets involved in cell structure (e.g., actin filament based process and cytoskeleton organization) and growth (e.g., regulation of growth and growth) were downregulated in MRI-visible tumors. Therefore, it was not surprising that DEGs based on MRI visibility contained four genes that could predict survival and were differentially expressed between primary tumors and metastatic deposits. The expression levels of these genes were independent of tumor size, suggesting that they do not simply reflect tumor growth. An important strength of this analysis is that the four-gene signature was validated in multiple external datasets, providing confidence in their relevance to cancer progression.
We then set out to show that genes involved in cancer progression can influence MRI visibility. CENPF has been identified as a master regulator of metastatic prostate cancer [28]. CENPF is negatively regulated by miR-101 [24]. miR-101 induction in a human prostate cancer cell line altered cell migration and invasion in a dose-dependent manner and altered MRI visibility of xenograft tumors by restricting both intracellular and extracellular water diffusion. Histologic examination of human xenografts shows that miR101 induction and CENPF down regulation decreases cellular proliferation and cellular density, which can account for the major effect on intracellular water diffusion. The trend toward decreased vascularity due to miR101 induction likely accounts for the decrease in perfusion and extracellular water diffusion. With miR101 induction, cellular proliferation and vascularity were heterogeneous. This may reflect regulation of endogenous miR101 by tumor hypoxia [29], although technical factors such as miR101 loss or heterogeneous miR101 induction are possible as well. Our analysis fully reflects tumor heterogeneity because the pathologist marked all tumor areas based on H&E staining and an automated platform quantified immunostaining in the marked areas.
These results suggest MRI visibility can predict prognosis. For the management of prostate cancer, our study provides an ethical and scientific justification for a prospective clinical trial designed to evaluate surveillance strategies that “ignore” MRI-invisible lesions, without biopsy or treatment. To the best of our knowledge this is the first study to demonstrate that genes involved in cancer progression and patient survival can determine MRI visibility. Therefore, MRI features traditionally linked to altered anatomy can serve as biomarkers and are a reflection of clinically relevant molecular biology.
Conclusion
We identified genes relevant to metastasis and tumor visibility that can alter imaging characteristics. We established a cause-effect relationship between gene expressions, histologic changes, and visibility on DWI.
Abbreviations
DEGs: differentially expressed genes; FFPE: formalin-fixed paraffin-embedded; DWI: diffusion-weighted imaging; ADC: apparent diffusion coefficient; DCE: dynamic contrast enhanced; PI-RADS: prostate imaging and reporting data system; SSFP: steady-state free precession; SS-EPI: single shot echo-planar imaging; ADC: apparent diffusion coefficient; D*: pseudo perfusion coefficient; IVIM: intravoxel incoherent motion; ROI: regions of interest; FDR: false discovery rate; GSEA: gene set enrichment analysis; AIC: Akaike Information Criterion; BIC: Bayes Information Criterion; PCA: principal component analysis; MP: multiparametric; RFS: recurrence free survival.
Acknowledgements
We thank Dr. Ming-Jer Tsai and Dr. Sophia Tsai (Baylor College of Medicine) for generously providing PC3 cells carrying inducible miR-101.
Grant Support
This work was supported by the Cedars-Sinai Precision Medicine Initiative, the Lauhlere Family Fund, and the National Cancer Institute/ National Institute of Health (NCI/NIH) grant R01CA182438 (H.L.K.).
Supplementary Material
Supplementary figures and tables.
Competing Interests
The authors have declared that no competing interest exists.
References
1. Siegel RL, Miller KD, Jemal A. Cancer Statistics, 2017. CA: a cancer journal for clinicians. 2017;67:7-30
2. Shukla-Dave A, Hricak H, Akin O, Yu C, Zakian KL, Udo K. et al. Preoperative nomograms incorporating magnetic resonance imaging and spectroscopy for prediction of insignificant prostate cancer. BJU international. 2012;109:1315-22
3. Vargas HA, Akin O, Shukla-Dave A, Zhang J, Zakian KL, Zheng J. et al. Performance characteristics of MR imaging in the evaluation of clinically low-risk prostate cancer: a prospective study. Radiology. 2012;265:478-87
4. Radtke JP, Kuru TH, Boxler S, Alt CD, Popeneciu IV, Huettenbrink C. et al. Comparative analysis of transperineal template saturation prostate biopsy versus magnetic resonance imaging targeted biopsy with magnetic resonance imaging-ultrasound fusion guidance. J Urol. 2015;193:87-94
5. Chamie K, Sonn GA, Finley DS, Tan N, Margolis DJ, Raman SS. et al. The role of magnetic resonance imaging in delineating clinically significant prostate cancer. Urology. 2014;83:369-75
6. Wagenlehner FM, Pilatz A, Waliszewski P, Weidner W, Johansen TE. Reducing infection rates after prostate biopsy. Nature reviews Urology. 2014;11:80-6
7. Samaratunga H, Montironi R, True L, Epstein JI, Griffiths DF, Humphrey PA. et al. International Society of Urological Pathology (ISUP) Consensus Conference on Handling and Staging of Radical Prostatectomy Specimens. Working group 1: specimen handling. Modern pathology: an official journal of the United States and Canadian Academy of Pathology, Inc. 2011;24:6-15
8. Barentsz JO, Richenberg J, Clements R, Choyke P, Verma S, Villeirs G. et al. ESUR prostate MR guidelines 2012. European radiology. 2012;22:746-57
9. Weinreb JC, Barentsz JO, Choyke PL, Cornud F, Haider MA, Macura KJ. et al. PI-RADS Prostate Imaging - Reporting and Data System: 2015, Version 2. European urology. 2016;69:16-40
10. Faustino-Rocha A, Oliveira PA, Pinho-Oliveira J, Teixeira-Guedes C, Soares-Maia R, da Costa RG. et al. Estimation of rat mammary tumor volume using caliper and ultrasonography measurements. Lab Anim (NY). 2013;42:217-24
11. Glenn ST, Head KL, Teh BT, Gross KW, Kim HL. Maximizing RNA yield from archival renal tumors and optimizing gene expression analysis. Journal of biomolecular screening. 2010;15:80-5
12. Le Bihan D. Intravoxel incoherent motion perfusion MR imaging: a wake-up call. Radiology. 2008;249:748-52
13. Liao Y, Smyth GK, Shi W. The Subread aligner: fast, accurate and scalable read mapping by seed-and-vote. Nucleic Acids Res. 2013;41:e108
14. Liao Y, Smyth GK, Shi W. featureCounts: an efficient general purpose program for assigning sequence reads to genomic features. Bioinformatics. 2014;30:923-30
15. Love MI, Huber W, Anders S. Moderated estimation of fold change and dispersion for RNA-seq data with DESeq2. Genome Biol. 2014;15:550
16. Storey JD. A direct approach to false discovery rates. J Roy Stat Soc B. 2002;64:479-98
17. Robinson MD, Oshlack A. A scaling normalization method for differential expression analysis of RNA-seq data. Genome Biol. 2010;11:R25
18. Nakagawa T, Kollmeyer TM, Morlan BW, Anderson SK, Bergstralh EJ, Davis BJ. et al. A tissue biomarker panel predicting systemic progression after PSA recurrence post-definitive prostate cancer therapy. PLoS One. 2008;3:e2318
19. Erho N, Crisan A, Vergara IA, Mitra AP, Ghadessi M, Buerki C. et al. Discovery and validation of a prostate cancer genomic classifier that predicts early metastasis following radical prostatectomy. PLoS One. 2013;8:e66855
20. Taylor BS, Schultz N, Hieronymus H, Gopalan A, Xiao Y, Carver BS. et al. Integrative genomic profiling of human prostate cancer. Cancer cell. 2010;18:11-22
21. Gulzar ZG, McKenney JK, Brooks JD. Increased expression of NuSAP in recurrent prostate cancer is mediated by E2F1. Oncogene. 2013;32:70-7
22. Marrone M, Potosky AL, Penson D, Freedman AN. A 22 Gene-expression Assay, Decipher(R) (GenomeDx Biosciences) to Predict Five-year Risk of Metastatic Prostate Cancer in Men Treated with Radical Prostatectomy. PLoS Curr. 2015:7
23. Dalela D, Loppenberg B, Sood A, Sammon J, Abdollah F. Contemporary Role of the Decipher(R) Test in Prostate Cancer Management: Current Practice and Future Perspectives. Rev Urol. 2016;18:1-9
24. Lin SC, Kao CY, Lee HJ, Creighton CJ, Ittmann MM, Tsai SJ. et al. Dysregulation of miRNAs-COUP-TFII-FOXM1-CENPF axis contributes to the metastasis of prostate cancer. Nat Commun. 2016;7:11418
25. Lawrence EM, Gnanapragasam VJ, Priest AN, Sala E. The emerging role of diffusion-weighted MRI in prostate cancer management. Nature reviews Urology. 2012;9:94-101
26. Outwater EK, Montilla-Soler JL. Imaging of prostate carcinoma. Cancer control: journal of the Moffitt Cancer Center. 2013;20:161-76
27. Anastasiadis E, van der Meulen J, Emberton M. Hospital admissions after transrectal ultrasound-guided biopsy of the prostate in men diagnosed with prostate cancer: A database analysis in England. International journal of urology: official journal of the Japanese Urological Association. 2015;22:181-6
28. Aytes A, Mitrofanova A, Lefebvre C, Alvarez MJ, Castillo-Martin M, Zheng T. et al. Cross-species regulatory network analysis identifies a synergistic interaction between FOXM1 and CENPF that drives prostate cancer malignancy. Cancer cell. 2014;25:638-51
29. Kim JH, Lee KS, Lee DK, Kim J, Kwak SN, Ha KS. et al. Hypoxia-responsive microRNA-101 promotes angiogenesis via heme oxygenase-1/vascular endothelial growth factor axis by targeting cullin 3. Antioxid Redox Signal. 2014;21:2469-82
Author contact
![]() Corresponding author: Hyung L. Kim, 8635 W. Third St, 1070, Los Angeles, CA 90048. Email: kimhlorg; Phone: 310-423-4700; Fax: 310-423-4711
Corresponding author: Hyung L. Kim, 8635 W. Third St, 1070, Los Angeles, CA 90048. Email: kimhlorg; Phone: 310-423-4700; Fax: 310-423-4711