Impact Factor
- Issue 13; 2026
- Issue 12; 2026
- Issue 11; 2026
- Issue 10; 2026
- Issue 9; 2026
- Volume 16; 2026
- Advance Articles
- Past Issues
- Cover Images
- Cover Suggestion
- Index & Coverage
- Special Issues
Introduction
Material and Methods
Results
Discussion
Abbreviations
Supplementary Material
Acknowledgements
References
International Journal of Biological Sciences
International Journal of Medical Sciences
 Global reach, higher impact

Theranostics 2018; 8(8):2278-2288. doi:10.7150/thno.23544 This issue Cite
Research Paper
DNA Methylation Signatures Predicting Bevacizumab Efficacy in Metastatic Breast Cancer
Simon Peter Gampenrieder1,*, Gabriel Rinnerthaler1,*, Hubert Hackl2, Walter Pulverer3, Andreas Weinhaeusel3, Suzana Ilic3, Clemens Hufnagl4, Cornelia Hauser-Kronberger4, Alexander Egle1, Angela Risch5,6, Richard Greil1,6 ![]()
1. III rd Medical Department with Hematology, Medical Oncology, Hemostaseology, Infectious Diseases and Rheumatology, Oncologic Center; Salzburg Cancer Research Institute (SCRI) with Laboratory of Immunological and Molecular Cancer Research (LIMCR) and Center for Clinical Cancer and Immunology Trials (CCCIT); Paracelsus Medical University Salzburg, Salzburg, Austria;
2. Division of Bioinformatics, Biocenter, Medical University of Innsbruck, Innsbruck, Austria;
3. Center for Health & Bioresources, Business Unit for Molecular Diagnostics, AIT - Austrian Institute of Technology GmbH, Vienna, Austria;
4. Department of Pathology, Paracelsus Medical University Salzburg, Salzburg, Austria;
5. Division of Cancer Genetics/Epigenetics, Department of Molecular Biology, University of Salzburg, Salzburg, Austria;
6. Cancer Cluster Salzburg, Salzburg, Austria
*These authors contributed equally to this work.
Received 2017-10-29; Accepted 2017-12-8; Published 2018-3-11
Abstract

Background: Biomarkers predicting response to bevacizumab in breast cancer are still missing. Since epigenetic modifications can contribute to an aberrant regulation of angiogenesis and treatment resistance, we investigated the influence of DNA methylation patterns on bevacizumab efficacy.
Methods: Genome-wide methylation profiling using the Illumina Infinium HumanMethylation450 BeadChip was performed in archival FFPE specimens of 36 patients with HER2-negative metastatic breast cancer treated with chemotherapy in combination with bevacizumab as first-line therapy (learning set). Based on objective response and progression-free survival (PFS) and considering ER expression, patients were divided in responders (R) and non-responders (NR). Significantly differentially methylated gene loci (CpGs) with a strong change in methylation levels (Δβ>0.15 or Δβ<-0.15) between R and NR were identified and further investigated in 80 bevacizumab-treated breast cancer patients (optimization set) and in 15 patients treated with chemotherapy alone (control set) using targeted deep amplicon bisulfite sequencing. Methylated gene loci were considered predictive if there was a significant association with outcome (PFS) in the optimization set but not in the control set using Spearman rank correlation, Cox regression, and logrank test.
Results: Differentially methylated loci in 48 genes were identified, allowing a good separation between R and NR (odds ratio (OR) 101, p<0.0001). Methylation of at least one cytosine in 26 gene-regions was significantly associated with progression-free survival (PFS) in the optimization set, but not in the control set. Using information from the optimization set, the panel was reduced to a 9-gene signature, which could divide patients from the learning set into 2 clusters, thereby predicting response with an OR of 40 (p<0.001) and an AUC of 0.91 (LOOCV). A further restricted 3-gene methylation model showed a significant association of predicted responders with longer PFS in the learning and optimization set even in multivariate analysis with an excellent and good separation of R and NR with AUC=0.94 and AUC=0.86, respectively.
Conclusion: Both a 9-gene and 3-gene methylation signature can discriminate between R and NR to a bevacizumab-based therapy in MBC and could help identify patients deriving greater benefit from bevacizumab.
Keywords: Metastatic breast cancer, bevacizumab, methylation, signature, predictive
Introduction
For HER2-negative metastatic breast cancer (MBC), bevacizumab (BEV) in combination with paclitaxel or capecitabine is a treatment option approved by the European Medicines Agency (EMA). Several phase-III studies have shown improvement in progression-free survival (PFS) with bevacizumab when added to chemotherapy, although the extent of improvement in PFS varied [1-5]. The primary endpoint of all of these trials was PFS, thus, conclusions on overall survival (OS) are difficult. However, neither a single trial nor any meta-analysis showed benefit in terms of OS [6-8]. This situation calls for biomarkers allowing clear separation of patients with or without a relevant chance of clinical benefit from this drug. Unfortunately, established markers predicting substantial benefit from this anti-angiogenic monoclonal antibody are still lacking. Promising biomarkers like plasma levels of VEGF-A or VEGFR-2 [9, 10], tissue markers like the VEGFR co-receptor neuropilin-1 (NRP-1) [11-13], single nucleotide polymorphisms (SNPs) in VEGF-A [14] or clinical markers like treatment-induced hypertension [14-16] failed to demonstrate clinical utility or reproducibility. Given the complexity and multifactorial nature of angiogenic processes, probably no single biomarker is able to predict efficacy of anti-VEGF therapy.
DNA methylation is one of the known mechanisms of epigenetic regulation and there is increasing evidence for its involvement in the development of drug resistance [17-22]. By influencing expression levels of genes involved in angiogenesis, a certain methylation pattern could influence the response to an antiangiogenic therapy. Therefore, we aimed to generate a multigene-signature by using a whole-genome approach.
Material and Methods
Patients and study design
Key inclusion criteria for this analysis were histologically confirmed adenocarcinoma of the breast, locally advanced inoperable or metastatic tumor stage, ECOG performance status 0-3, at least one line of chemotherapy (taxane or capecitabine) alone or in combination with bevacizumab for advanced disease, sufficiently documented medical records (allowing calculation of PFS and OS) as well as sufficient tumor material for DNA isolation.
Learning Set
From the 212 breast cancer patients treated with chemotherapy in combination with bevacizumab (first- to fifth-line) at our institution between 2006 and 2012, 116 patients fulfilled the inclusion criteria. From this cohort, a learning set was selected consisting of 36 patients treated with a first-line chemotherapy and bevacizumab combination who clearly did (responder R; n=18) or did not (non-responder NR; n=18) benefit from this treatment based on objective response (ORR), progression-free survival (PFS), overall survival (OS) and estrogen receptor (ER) expression.
Optimization Set
The optimization set consisted of the 80 remaining patients from the bevacizumab-treated cohort that were not included in the learning set. Forty-one of these patients could clearly be classified as R or NR based on ORR, PFS, OS, and therapy-line and considering ER expression.
Control Set
Fifteen patients who never received bevacizumab and who were treated with a taxane or capecitabine as first-line chemotherapy were used as control set and were divided into R (n = 7) and NR (n = 8).
Patient characteristics of all patient sets are provided in Table 1.
Patient characteristics.
| Patient characteristics | Learning set (n = 36) | Optimization set (n = 80*) | Control set (n = 15) | ||||
|---|---|---|---|---|---|---|---|
| Median age (range) | 61 (34-81) | 60 (29-86) | 62 (49-86) | ||||
| DFS | de novo metastatic | 8 | 22% | 13 | 16% | 1 | 7% |
| ≤ 24 mo | 11 | 31% | 20 | 25% | 5 | 33% | |
| > 24 mo | 17 | 47% | 47 | 59% | 9 | 60% | |
| ECOG PS | 0-1 | 35 | 97% | 73 | 91% | 11 | 73% |
| 3 or unknown | 1 | 3% | 7 | 9% | 4 | 27% | |
| Grade | 1 -2 + unknown | 20 | 56% | 52 | 65% | 9 | 60% |
| 3 | 16 | 44% | 28 | 35% | 6 | 40% | |
| ER/PR status | ER or PR positive | 26 | 72% | 54 | 68% | 10 | 67% |
| ER and PR negative | 9 | 25% | 26 | 32% | 5 | 33% | |
| Metastases | visceral | 25 | 69% | 58 | 73% | 12 | 80% |
| non-visceral | 11 | 31% | 22 | 27% | 3 | 20% | |
| Adjuvant chemotherapy | yes | 17 | 47% | 52 | 65% | 8 | 53% |
| no | 19 | 53% | 28 | 35% | 7 | 47% | |
| Line of therapy | first-line | 36 | 100% | 27 | 34% | 15 | 100% |
| second-line | - | - | 19 | 24% | - | - | |
| > second-line | - | - | 34 | 42% | - | - | |
| Chemotherapy backbone | paclitaxel or docetaxel | 22 | 61% | 64 | 80% | 12 | 80% |
| capecitabine | 14 | 39% | 15 | 19% | 3 | 20% | |
| Sample type | primary tumor | 29 | 81% | 65 | 81% | 8 | 53% |
| metastases | 7 | 19% | 15 | 19% | 7 | 47% | |
| Outcome months (95%CI) | median PFS | 8.8 (5.1-16.6) | 7.8 (6.5-9.3) | 5.5 (4.3-NA) | |||
| median OS | 22.6 (18.4-33.5) | 18.9 (16.4-21.7) | 11.2 (7.5-NA) | ||||
| Responder/non-responder | R / NR | 18 / 18 (12 / 17)** | 16 | 8 / 7 | |||
* One sample was removed because of missing values in the methylation analyses
** Restricted to samples from the primary tumor
DFS: disease-free survival; ECOG PS: Eastern Cooperative Oncology Group Performance Status; ER: estrogen receptor; PR: progesterone receptor; CI: confidence interval; PFS: progression-free survival; OS: overall survival; R: responder; NR: non-responder
Tissue samples and DNA isolation
Formalin-fixed paraffin-embedded (FFPE) tissue blocks containing samples from primary tumors, or if available, from metastatic sites, were selected by an experienced breast pathologist (CH). All tissue samples were collected prior to the start of first-line chemotherapy for metastatic disease. Three to five 10 µm sections were cut from each block without micro- or macro-dissection and placed in sterile Eppendorf tubes. DNA isolation and quantification was performed with the Maxwell 16 FFPE Plus LEV DNA Purification KIT and the PicoGreen dsDNA quantitation assay, respectively. Quality of FFPE-derived DNA was evaluated with Illumina's FFPE QC kit.
Methylation analysis
Learning Set
Genome-wide methylation profiling using the Illumina Infinium HumanMethylation450 BeadChip was performed, which enabled determining the methylation state of 485,577 single CpG sites. DNA was deaminated with the EZ DNA Methylation Kit (Zymo Research) according to Illumina's recommended deamination protocol. Bisulfite conversion was checked by qPCR. One assay targeting a methylated region of DNAJC15 and two assays targeting the GNAS locus (one assay for the unmethylated allele and one assay for the methylated allele) were used for quality control [23]. Deaminated DNA derived from blood was amplified in parallel and served as positive control. A sample passed the quality control when the received ct-value either for the two GNAS loci or the DNAJC15 locus reached the threshold no later than 5 cycles compared to the positive control. All samples passed the quality control. For the detection p-value, the intensity of the 450k-beadchip probe was compared with the intensities of the background signal (intensities of negative control probes). Only probes with detection p-values < 10-5 were used for the analysis. 544 probes had at least 50% samples with detection p-values > 10-5. These 544 sites were removed from the normalized data.
Afterwards, Bead Chip analysis was performed. To ensure equal signal distributions for each subarray (samples) and to remove technical bias, the data underwent quantile normalization. Furthermore, a peak correction algorithm was applied to the normalized data [24, 25].
Optimization / Control Set
The methylation status of CpGs (± 200 base pairs) selected in the learning set was determined by targeted bisulfite sequencing (TDBS) [26, 27] on an IonTorrent PGM System. The MSP-HTPrimer was used for assay design following a bisulfite sequencing-specific approach, which enriches the region of interest independently of the methylation state [27]. Primer design resulted in assays with a length of 118-292 bp (average: 242 bp). The assays designed for bisulfite-assisted genomic sequencing PCR (BSP) were used to enrich the respective target regions in 96 deaminated samples. The EZ-96 DNA Methylation Kit (Zymo Research) was used according to manufacturer's recommendations to deaminate the samples. Target enrichment was done by qPCR in single PCR reactions, followed by pooling of the 48 targets sample by sample. Library preparation and targeted sequencing for the Ion Torrent PGM was done following the manufacturer's protocol. Briefly, after DNA end repair to generate blunt ends, individual barcodes and sequencing adapters (Xpress Barcode Adapters, Thermo Fisher Scientific) were attached to the pooled targets of each sample and purified with AMPure XP magnetic beads (Beckman Coulter). Generated libraries were quantified using the Ion Library Quantitation Kit (Thermo Fisher Scientific). The samples were divided in 3 batches of 32 samples each. For each batch, the barcoded samples were pooled equimolar for the template preparation by emulsion PCR with the Ion PGM HI-Q OT2 KIT on the Ion One Touch 2 Instrument (Thermo Fisher Scientific). Enrichment of Ion Sphere Particles (ISPs) was done on the Ion One Touch ES Instrument (Thermo Fisher Scientific). Quality of ISPs was controlled with the Ion Sphere Quality Control Assay (Thermo Fisher Scientific) on the Qubit 2.0 Fluorometer. The 318 Chip Kit v2 (Thermo Fisher Scientific) was used to sequence the two sample batches with the Ion PGM Hi-Q Sequencing Kit. The sequencing reads were aligned to the hg19 reference genome and fitted to the 48 designed amplicons. A special workflow, which was recently published by Pabinger et al. was used to map the reads from the Ion Torrent PGM to the reference genome [28].
Statistical analysis
All analyses were performed using the statistical software environment R including packages survival, ChAMP, IMA, ROCR as well as BRB array tools for class prediction, and Genesis for hierarchical clustering and heatmap visualization.
Learning Set
After quantile normalization and type I/II peak correction, significantly differentially methylated gene loci (CpGs) between R and NR (P < 0.001) were identified using a moderated t-test, whereby the variance of individual CpGs is calculated using information from all selected CpGs (chip analyses methylation pipeline, ChAMP) [29]. Significantly differentially methylated gene loci between R and NR (P < 0.001; |Δβ|>0.10 or |Δβ|>0.15 as stated) were selected and further validated if they showed an AUC ≥ 0.85 by logistic regression analysis, and/or sites in proximity to genes known to be involved in angiogenesis or carcinogenesis, and/or were included in significantly differentially methylated regions as identified by Illumina Methylation Analyzer (IMA) [25] or the Probe Lasso method [30].
Control Set
Cox regression analysis was used to associate methylation with PFS.
Optimization Set
Cox regression was used to associate methylation with PFS and OS. A hazard ratio was calculated for an increase of 10% in methylation level. Receiver operating characteristics (ROC) analyses, class prediction, and (consistent) differential methylation of single CpGs, were used to select CpGs predicting R and NR in the optimization set.
Gene-panel
Logistic regression (LR) models of a 9-gene methylation signature (based on single CpG-ß-values) and all combinations of 1 to 4 of the respective CpGs were learned from the learning set and then, based on leave-one-out cross validation (LOOCV), the model with the highest AUC was selected. As an optimal cutoff the point in the ROC curve closest to the true positive rate of 1 and the false positive rate of 0 was used. Only models with less than 35% missing values in the optimization set were considered. For validation ROC analyses of the logistic regression models and a logrank test to analyze the differences in PFS and OS between predicted R and NR were performed in the learning set and the optimization set.
Multivariate Analysis
Multivariate Cox regression analyses on PFS and OS were performed in the learning set and the optimization set on the predicted R and NR (based on the 3 CpGs/genes logistic regression model) and included the clinicopathological factors length of disease-free survival (DFS) between surgery of the primary tumor and recurrence, adjuvant chemotherapy, ECOG performance score, histologic subtype, tumor grade, receptor status, location of metastases, line of therapy, and origin of the specimen as categorical covariates. A Wald test was used to assess the significant impact of individual covariates (coefficients) and the overall model fit.
Endpoints
Progression-free survival (PFS) was defined as time from treatment initiation until progression or death from any cause, whichever occurred first. Overall survival (OS) was defined as time from treatment initiation until death from any cause. Patients alive (for OS) and who had not experienced progression (for PFS) at the data cutoff date, were censored at the last follow-up date. Overall response rate (ORR) was defined as the proportion of patients who achieved a complete or partial response. Because of the retrospective nature of the study, no categorization according to RECIST was possible. Therefore, partial response was defined as a relevant reduction in tumor burden as per clinical routine assessment and complete response as disappearance of all signs of cancer.
Ethics
The study was approved by the Ethics Committee of the province Salzburg (IRB number: 415-EP/73/67-2011).
Results
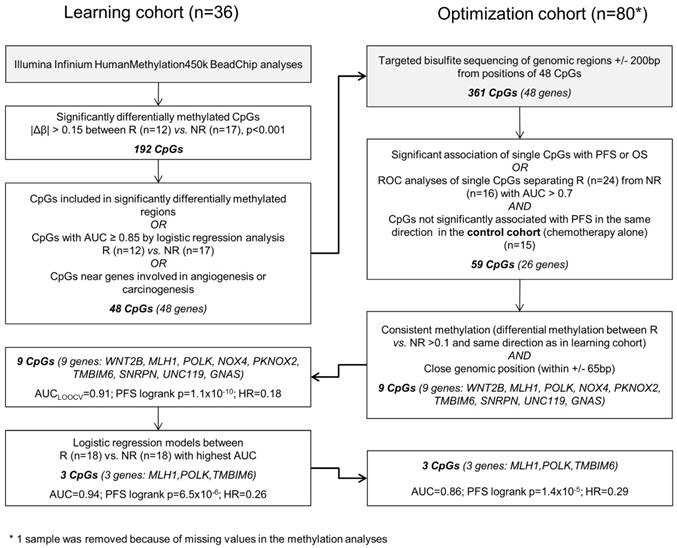
The different steps of biomarker discovery are summarized in a flow chart in Figure 1. In the learning set (n = 36) 417 CpGs showed significantly different methylation between R (n = 18) and NR (n = 18) with a Δβ-value > 0.10 or < -0.10 (P < 0.001). In R, 206 sites were hypermethylated and 211 sites were hypomethylated. To avoid a potential confounding by the different sample types (metastases samples are more represented in the R group) only samples from the primary tumor were further investigated (Figure S1). A panel of 48 genes (48 CpGs from Illumina's 450k array) allowed a good separation between R and NR (odds ratio = 101, P < 0.0001; Figure S2). Details on the selection methods and the CpG position for each gene are provided in Table S1. These 48 CpGs ± 200 base pairs (including 361 CpGs in total) were sequenced in the optimization and control set, respectively. At least one methylated cytosine within 26 of 48 analyzed regions was significantly associated with PFS or OS in the optimization set (n = 80) or had an AUC value > 0.7 in a ROC analysis. None of the analyzed CpGs showed a significant association of methylation levels with PFS in the control set (n = 15) in the same direction (Table S2). By using information from the optimization set based on consistency of the methylation and close genomic positions, the methylation panel was further reduced to 9 genes (16 CpGs) (Table S3).
Data analysis workflow.
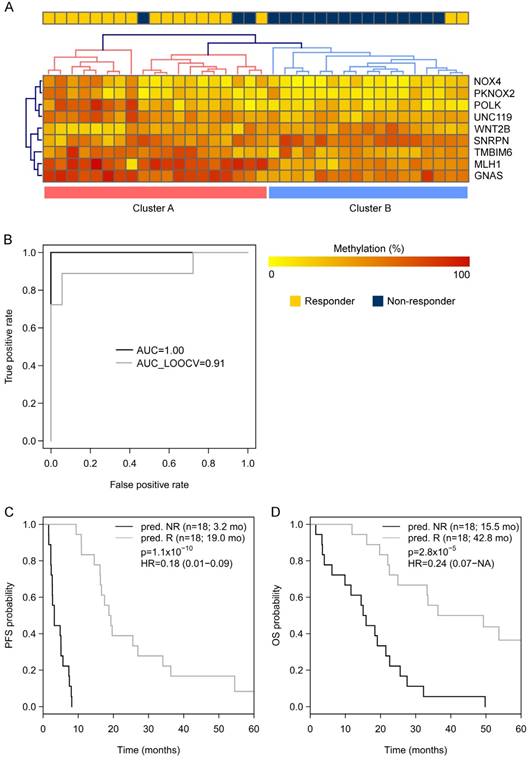
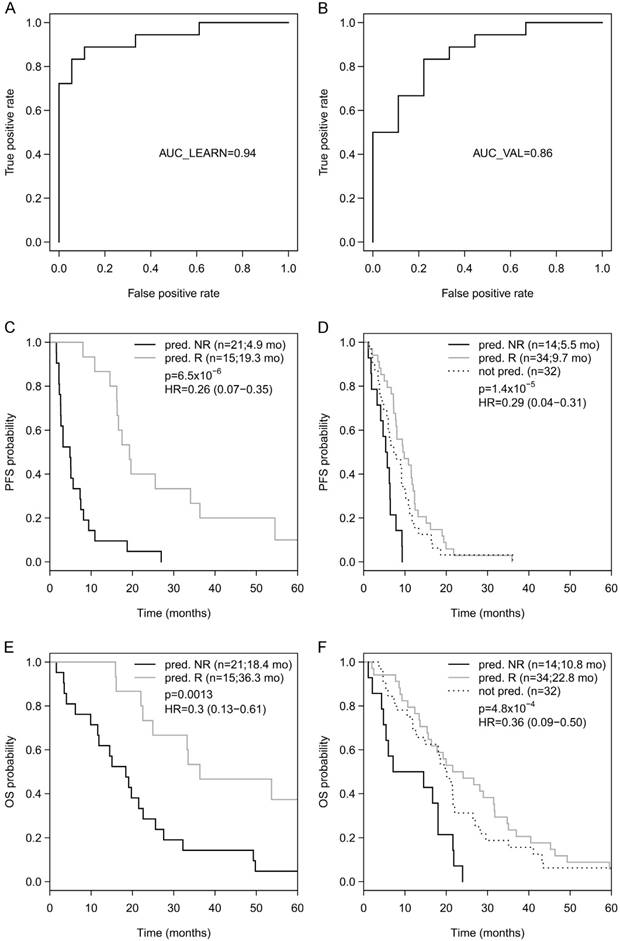
Going back to the learning set, unsupervised hierarchical clustering according to the methylation status of these 9 genes could divide patients into 2 clusters predicting R and NR with an odds ratio of 40 (P < 0.001) (Figure 2A). A ROC analysis of a logistic regression model for this 9-gene methylation signature (Table S4) resulted in AUC of 1.0 (AUC LOOCV 0.91) in the learning set (Figure 2B). The hazard ratios (HR) for predicted R and NR in the learning set were 0.18 (95%CI 0.01-NA; P < 0.001) and 0.24 (95%CI 0.07-0.38; P < 0.001) for PFS and OS, respectively (Figure 2C, 1D). In the optimization set from the 17 patients with a complete methylation profile of all 9 CpGs (genes), 9 patients could be predicted as R and 8 patients as NR. Predicted responders were associated with longer PFS (median PFS 9.5 months vs. 5.3 months; HR 0.61; 95%CI 0.21-1.60) and longer OS (median OS 26.7 months vs. 16.8 months; HR 0.56; 95%CI 0.18-NA), however, in both cases not to a significant extent (P = 0.29 and P = 0.21, respectively; Figure S3). To include more patients and hence increase the power, the number of CpGs was reduced by testing all possible logistic regression models including maximal 4 CpGs (genes). The best model with a 3-gene signature (Table S4) was based on the methylation status of single CpGs in MLH1, POLK, and TMBIM6, with an AUC of 0.94 in the learning set (Figure 3A) and an AUC of 0.86 in the optimization set (Figure 3B). The median PFS for predicted R and NR by the 3-gene signature was 19.3 months and 4.9 months in the learning set (HR 0.26, 95%CI 0.07-0.35; P < 0.001) and 9.7 months and 5.5 months in the optimization set (HR 0.29, 95%CI 0.04-0.21; P < 0.001), respectively (Figure 3C, 3D). The median OS was 36.3 months for predicted R and 18.4 months for predicted NR in the learning set (HR 0.30, 95%CI 0.13-0.61; P = 0.001) and 22.8 months for predicted R and 10.8 months for predicted NR in the optimization set (HR 0.36, 95%CI 0.09-0.50; P = 4.8 x 10⁻⁴) (Figure 3E, 3F). The median PFS and OS of patients from the optimization set not classified (n=32 of 80) because of missing values were 7.5 months and 19.9 months, respectively, lying in between the median values for predicted R and predicted NR (Figure 3D, 3F). The association of predicted responders with longer PFS (P = 0.001 and P < 0.001) and longer OS (P = 0.019 and P < 0.001) remained significant in multivariate analysis both in the learning set and the optimization set (Table 2).
(A) Unsupervised hierarchical clustering of the learning set (450k-chip methylation data) according to the methylation status of the 9 genes deduced from TDBS-derived methylation data of the optimization set allowed a good separation between R (Cluster A) and NR (Cluster B) with an odds ratio of 40 (P < 0.0001). (B) ROC analyses of a logistic regression model for the 9 genes in the learning set resulted in AUC of 1.0 (AUCLOOCV 0.91). (C) Progression-free survival (PFS) and (D) overall survival (OS) for predicted R and predicted NR from the learning set according to the 9-gene methylation signature.
(A) ROC analyses of a logistic regression model for the 3 genes in the learning set resulted in AUC of 0.94 and (B) in the optimization set resulted in AUC of 0.86. Progression-free survival (PFS) for predicted R and predicted NR according to the 3-gene methylation signature in the learning set (C) and in the optimization set (D), as well as overall survival (OS) in the learning set (E) and the optimization set (F).
Multivariate Cox proportional hazards regression model for the association of predicted responders with DFS and OS in the learning set (A) and the optimization set (B)
| PFS | OS | |||||||||||||||
|---|---|---|---|---|---|---|---|---|---|---|---|---|---|---|---|---|
| n | n1 | n2 | coef | HR | 95%-CI | p | p* | coef | HR | 95%-CI | p | p* | ||||
| (A) Learning set † | ||||||||||||||||
| Predicted responders | R vs. NR | 36 | 15 | 21 | -1.755 | 0.17 | 0.06-0.51 | 0.001 | 0.002 | -1.354 | 0.26 | 0.08-0.80 | 0.019 | 0.003 | ||
| DFS | M1 vs. <24 mo | 36 | 8 | 11 | -1.000 | 0.37 | 0.09-1.43 | 0.150 | -0.044 | 0.96 | 0.21-4.45 | 0.960 | ||||
| >24 mo vs. <24 mo | 17 | 11 | -0.107 | 0.90 | 0.35-2.32 | 0.830 | 0.560 | 1.75 | 0.63-4.87 | 0.280 | ||||||
| Adjuvant chemotherapy | yes vs. no | 36 | 18 | 18 | -0.664 | 0.51 | 0.17-1.57 | 0.240 | 0.250 | 1.28 | 0.45-3.63 | 0.640 | ||||
| Histology | lobular+other vs. ductal | 36 | 8 | 28 | -0.559 | 0.57 | 0.14-2.28 | 0.430 | -0.975 | 0.38 | 0.09-1.50 | 0.170 | ||||
| Tumor grade | 3 vs. 1|2|unknown | 36 | 16 | 20 | -0.396 | 0.67 | 0.27-1.70 | 0.400 | -0.282 | 0.75 | 0.32-1.77 | 0.520 | ||||
| Receptor status | HR+/HER2- vs. HR-/HER2- | 36 | 26 | 10 | 0.030 | 1.03 | 0.33-3.26 | 0.960 | -0.749 | 0.47 | 0.16-1.42 | 0.180 | ||||
| Type of metastases | visceral vs. non-visceral | 36 | 25 | 11 | 1.039 | 2.83 | 0.88-9.11 | 0.082 | 1.393 | 4.03 | 1.11-14.63 | 0.034 | ||||
| Origin of specimen | metastasis vs. primary tumor | 36 | 7 | 29 | -0.810 | 0.45 | 0.13-1.58 | 0.210 | -0.913 | 0.40 | 0.12-1.37 | 0.140 | ||||
| (B) Optimization set | ||||||||||||||||
| Predicted responders | R vs. NR | 48 | 34 | 14 | -1.914 | 0.15 | 0.05-0.41 | <0.001 | 0.006 | -1.573 | 0.21 | 0.08-0.51 | 0.001 | 0.009 | ||
| DFS | M1 vs. <24 mo | 48 | 9 | 12 | 0.524 | 1.69 | 0.39-7.27 | 0.480 | 0.069 | 1.07 | 0.26-4.49 | 0.930 | ||||
| >24 mo vs. <24 mo | 27 | 12 | -0.056 | 0.95 | 0.33-2.73 | 0.920 | -0.710 | 0.49 | 0.17-1.45 | 0.200 | ||||||
| Adjuvant chemotherapy | yes vs. no | 48 | 31 | 17 | 0.084 | 1.09 | 0.45-2.65 | 0.850 | -0.304 | 0.74 | 0.30-1.83 | 0.510 | ||||
| ECOG PS | ≥2 vs. 0|1 | 48 | 4 | 44 | 1.026 | 2.79 | 0.75-10.42 | 0.130 | 1.761 | 5.82 | 1.50-22.56 | 0.011 | ||||
| Histology | lobular vs. ductal | 48 | 6 | 37 | 1.196 | 3.31 | 1.05-10.41 | 0.041 | 1.236 | 3.44 | 1.07-11.11 | 0.039 | ||||
| other vs. ductal | 5 | 37 | 1.669 | 5.31 | 1.73-16.30 | 0.004 | 1.160 | 3.19 | 1.05-9.70 | 0.041 | ||||||
| Tumor grade | 3 vs. 1|2|unknown | 48 | 17 | 31 | 1.518 | 4.56 | 1.60-13.01 | 0.005 | 1.091 | 2.98 | 1.14-7.77 | 0.026 | ||||
| Receptor status | HR+/HER2- vs. HR-/HER2- | 48 | 30 | 18 | 0.778 | 2.18 | 0.74-6.43 | 0.160 | 0.655 | 1.92 | 0.68-5.44 | 0.220 | ||||
| Type of metastases | visceral vs. non-visceral | 48 | 31 | 17 | 0.741 | 2.10 | 0.86-5.10 | 0.100 | 0.508 | 1.66 | 0.67-4.11 | 0.270 | ||||
| Line of therapy | ≥2nd vs. 1st | 48 | 33 | 15 | -0.356 | 0.70 | 0.31-1.57 | 0.390 | 0.135 | 1.14 | 0.53-2.47 | 0.730 | ||||
| Origin of specimen | metastasis vs. primary tumor | 48 | 11 | 37 | 0.138 | 1.15 | 0.42-3.16 | 0.790 | -0.150 | 0.86 | 0.36-2.08 | 0.740 | ||||
* overall p-value using Wald test
† “ECOC PS” and “line of therapy” were not included in multivariate analysis in the learning set because all patients had ECOG PS 0 or 1 and all were treated 1st-line.
DFS: disease-free survival; ECOG PS: Eastern Cooperative Oncology Group Performance Status; ER: estrogen receptor; PR: progesterone receptor; CI: confidence interval; PFS: progression-free survival; OS: overall survival; coef is the coefficient in the Cox regression model for the respective variable; HR: hazard ratio (=exp(coef)); R: responder; NR: non-responder
Discussion
To our knowledge this is the first DNA methylation study investigating efficacy prediction for bevacizumab in cancer, especially in breast cancer patients. Using FFPE-derived DNA from primary tumor sections, we generated both a 9-gene and a 3-gene methylation signature with a high predictive value for bevacizumab efficacy in patients with MBC.
Single molecular alterations like estrogen receptor expression or HER2 overexpression are routinely used to estimate prognosis and treatment efficacy in breast cancer. Other alterations like BRCA1/2 mutation, HER2 mutation or ESR1 mutation are on the verge of getting clinically meaningful. Single gene approaches, however, have several limitations: techniques like immunohistochemistry have a low reproducibility, they allow only a rough classification into different subgroups and they ignore other genes affecting the same biologic pathway. Gene expression studies in breast cancer have demonstrated that mRNA signatures can predict different biological behavior, prognosis and therapeutic success more effectively than singe gene evaluations [31-34]. Such signatures developed by genome-wide approaches do not only reflect discrete differences in specific mRNA expressions but also the complex interplay between different genes, which is part of the so-called interactome. In a similar way, DNA methylation profiles, representing gene regulation on an epigenetic level, can mirror the molecular state of a cell [35]. Probably, the complex gene interactions can be even better represented since DNA methylation regulates gene networks rather than single genes [36]. In addition, using DNA instead of RNA for profiling has several advantages: compared to RNA or proteins, DNA and the DNA CpG-methylation profile is a much more robust analytical material [26, 37]. Furthermore, DNA methylation causes a stable long-term programming of the genome [38], whereas transcription activity is much more influenced by transient signals. Therefore, DNA methylation best fulfills prerequisites for developing robust biomarkers [26, 37].
Several proteins involved in angiogenesis like VEGF-A, VEGF-R2 (KDR) and VEGF-R3 (FLT4) are known to be silenced by promoter hypermethylation. Nevertheless, we used an unsupervised whole genome approach for biomarker generation because resistance or extraordinary sensitivity to anti-VEGF therapy are not automatically driven by genes directly involved in angiogenesis [39]. Confining biomarker research to predefined genes based on a biological rationale carries the danger of missing crucial information. VEGF-A plasma levels, for example, showed promising early results [40, 41] but failed when prospectively validated [10].
Furthermore, for the same reason, we did not concentrate on methylation sites within specific genomic regions like promotors or CpG island shores. The impact of the exact location of DNA methylation on gene expression is still not fully understood [42] and seems to vary between molecular subtypes of breast cancer [43]. Therefore, exclusion of methylation sites apart from promotors or CpG island shores could reduce the success rate of methylation biomarkers. Furthermore, non-protein-coding DNA like DNA transcribed into microRNAs seems to be regulated and dysregulated by methylation as well [44], making the regulatory machinery even more complex. Accordingly, most of the genes of our 9-gene signature (PKNOX2, POLK, UNC119, SNRPN, TMBIM6, MLH1 and GNAS) are not linked to angiogenesis yet.
In our analysis, the predicted difference in OS between patients categorized as R and NR according to the methylation pattern is more than 1 year in both cohorts, with a risk reduction for death of more than 60% (HR 0.30 and 0.36 in learning set and optimization set, respectively). When scored according to the European Society for Medical Oncology Magnitude of Clinical Benefit Scale (ESMO-MCBS) [45], such a trial result would result in a score of 4 out of 5 points (-1 point because no data on quality of life are available), while the approval study E2100 randomizing between paclitaxel plus bevacizumab and paclitaxel alone [4], reached 2 points only [45]. Knowing that none of the randomized phase III trials in HER2 negative breast cancer comparing bevacizumab plus chemotherapy with chemotherapy alone showed any effect on overall survival [1, 3-5, 10, 46, 47], such a survival difference would, if confirmed, certainly influence clinical practice. The risk reduction for progression or death (PFS) was more than 70% in both cohorts (HR 0.26 and HR 0.29, respectively). Notably, the absolute median PFS and OS values in the two cohorts differed significantly. The main explanation for this observation is that 46% of patients in the optimization set were treated in second-line and beyond. Furthermore, the two cohorts were not matched according to other factors known to influence outcome (e.g., adjuvant chemotherapy, chemotherapy backbone, location and number of metastases, etc.). However, a risk reduction in PFS of this magnitude was never observed in clinical trials investigating bevacizumab efficacy (HR ranging between 0.60 and 0.69 in first-line trials [3-5, 10]) and the HR were nearly identical in the two cohorts of patients. If confirmed, this approach could lead to more effective and cost-efficient use of bevacizumab in the clinical setting.
This study has several limitations. First of all, no clear validation of the 48-gene-signature generated in the learning set was possible, because low DNA content of some samples prevented the analysis of all selected CpGs in our validation set (therefore called optimization set). Second, the control set, including patients treated with first-line chemotherapy without bevacizumab, was very small. Third, it is a single-institution, uncontrolled study, which limits any firm conclusion about the utility of the methylation signatures. A further caveat might be that two different techniques were used in the learning and control/optimization sets: bead chip technology vs. targeted bisulfite sequencing. However, previous analyses have shown that generally methylation scores obtained by Illumina 450K analysis replicate well using targeted sequencing approaches [28]. In addition, this technical switch allowed a selection of genes that can be robustly analyzed by targeted bisulfite sequencing in archival FFPE samples, which is an important issue for biomarkers when transferred into the clinic.
In conclusion, this is the first study providing predictive DNA methylation signatures for bevacizumab efficacy in MBC: a 9-gene as well as a 3-gene-methylation signature could reproducibly discriminate between responders and non-responders to a bevacizumab-based therapy in two different patient sets. Before such a signature can be implemented in treatment decision-making, these data have to be validated in larger cohorts, ideally in tissue samples from a prospective trial. To demonstrate clinical utility according to the roadmap for development of omics-based tests defined by the United States Institute of Medicine (IOM) [48], a prospective retrospective study is planned using DNA samples from a randomized phase III trial comparing chemotherapy plus bevacizumab with chemotherapy alone.
Abbreviations
AUC: area under the curve; DNA: deoxyribonucleic acid; FFPE: formalin-fixed paraffin-embedded; HER2: human epidermal growth factor receptor 2; HR: hazard ratio; IMA: Illumina Methylation Analyzer; LOOCV: leave-one-out cross validation; MBC: metastatic breast cancer; MVP: methylation variable position; NR: non-responder; OR: odds ratio; ORR: objective response rate; OS: overall survival; PFS: progression-free survival; qPCR: real-time quantitative PCR; R: responder; RNA: ribonucleic acid; ROC: receiver operating characteristic; SNP: single nucleotide polymorphism; TDBS : targeted bisulfite sequencing; VEGF: vascular endothelial growth factor; VEGFR: vascular endothelial growth factor receptor.
Supplementary Material
Supplementary figures and tables.
Acknowledgements
This research project was partially supported by ROCHE Austria GmbH.
Authors' Contributions
Gampenrieder S.P. and Rinnerthaler G. were involved in the design of the study, in clinical data acquisition, quality control of the data, data interprettation and manuscript writing; Hackl H. performed the statistical analyses and was involved in data interpretation and manuscript writing; Pulverer W. and Weinhaeusel A. performed genome-wide and targeted methylation analyses, quality control of the data and participated in statistical analysis, data interpretation and manuscript writing; Ilic S. performed targeted methylation analyses; Hufnagl C. performed DNA isolation and quality control of the data; Hauser-Kronberger C. selected and cut the tissue samples and ensured the quality of the samples; Egle A. and Risch A. contributed to in the design of the study and to data interpretation; Greil R. was involved in the design of the study, in data interpretation, and manuscript preparation. All authors read and approved the final manuscript.
Competing Interests
Conflicts of interest with Roche®: Employment or Leadership Position: None; Consultant or Advisory Role: Gampenrieder S.P., Rinnerthaler G., Egle A., Greil R.; Stock Ownership: None; Speakers Honoraria: Gampenrieder S.P., Egle A., Greil R.; Travel Grants: Gampenrieder S.P., Rinnerthaler G., Hufnagl C., Hauser-Kronberger C., Egle A., Greil R.; Research Funding: Gampenrieder S.P., Rinnerthaler G., Hufnagl C., Egle. A, Greil R. All other authors declare that they have no conflicts of interest.
References
1. Brufsky AM, Hurvitz S, Perez E, Swamy R, Valero V, O'Neill V. et al. RIBBON-2: a randomized, double-blind, placebo-controlled, phase III trial evaluating the efficacy and safety of bevacizumab in combination with chemotherapy for second-line treatment of human epidermal growth factor receptor 2-negative metastatic breast cancer. J Clin Oncol. 2011;29:4286-93
2. Gianni L, Romieu GH, Lichinitser M, Serrano SV, Mansutti M, Pivot X. et al. AVEREL: A Randomized Phase III Trial Evaluating Bevacizumab in Combination With Docetaxel and Trastuzumab As First-Line Therapy for HER2-Positive Locally Recurrent/Metastatic Breast Cancer. J Clin Oncol. 2013;31:1719-25
3. Miles DW, Chan A, Dirix LY, Cortes J, Pivot X, Tomczak P. et al. Phase III study of bevacizumab plus docetaxel compared with placebo plus docetaxel for the first-line treatment of human epidermal growth factor receptor 2-negative metastatic breast cancer. J Clin Oncol. 2010;28:3239-47
4. Miller K, Wang M, Gralow J, Dickler M, Cobleigh M, Perez EA. et al. Paclitaxel plus bevacizumab versus paclitaxel alone for metastatic breast cancer. N Engl J Med. 2007;357:2666-76
5. Robert NJ, Dieras V, Glaspy J, Brufsky AM, Bondarenko I, Lipatov ON. et al. RIBBON-1: randomized, double-blind, placebo-controlled, phase III trial of chemotherapy with or without bevacizumab for first-line treatment of human epidermal growth factor receptor 2-negative, locally recurrent or metastatic breast cancer. J Clin Oncol. 2011;29:1252-60
6. Miles DW, Dieras V, Cortes J, Duenne AA, Yi J, O'Shaughnessy J. First-line bevacizumab in combination with chemotherapy for HER2-negative metastatic breast cancer: pooled and subgroup analyses of data from 2447 patients. Ann Oncol. 2013;24:2773-80
7. Rossari JR, Metzger-Filho O, Paesmans M, Saini KS, Gennari A, de Azambuja E. et al. Bevacizumab and Breast Cancer: A Meta-Analysis of First-Line Phase III Studies and a Critical Reappraisal of Available Evidence. Journal of oncology. 2012;2012:417673
8. Wagner AD, Thomssen C, Haerting J, Unverzagt S. Vascular-endothelial-growth-factor (VEGF) targeting therapies for endocrine refractory or resistant metastatic breast cancer. Cochrane Database Syst Rev. 2012;7:CD008941
9. Cameron D, Brown J, Dent R, Jackisch C, Mackey J, Pivot X. et al. Adjuvant bevacizumab-containing therapy in triple-negative breast cancer (BEATRICE): primary results of a randomised, phase 3 trial. Lancet Oncol. 2013;14:933-42
10. Miles D, Cameron D, Bondarenko I, Manzyuk L, Alcedo JC, Lopez RI. et al. Bevacizumab plus paclitaxel versus placebo plus paclitaxel as first-line therapy for HER2-negative metastatic breast cancer (MERiDiAN): A double-blind placebo-controlled randomised phase III trial with prospective biomarker evaluation. Eur J Cancer. 2017;70:146-55
11. Jubb AM, Miller KD, Rugo HS, Harris AL, Chen D, Reimann JD. et al. Impact of exploratory biomarkers on the treatment effect of bevacizumab in metastatic breast cancer. Clin Cancer Res. 2011;17:372-81
12. Van Cutsem E, de Haas S, Kang YK, Ohtsu A, Tebbutt NC, Ming Xu J. et al. Bevacizumab in combination with chemotherapy as first-line therapy in advanced gastric cancer: a biomarker evaluation from the AVAGAST randomized phase III trial. J Clin Oncol. 2012;30:2119-27
13. Foernzler D, Delmar P, Kockx M, Cassidy J, Saltz L, Scherer S. Tumor tissue based biomarker analysis in NO16966: A randomized phase III study of first-line bevacizumab in combination with oxaliplatin-based chemotherapy in patients with mCRC. ASCO Gastrointestinal Cancers Symposium; Orlando, FL; Jan 22-24. 2010 (abstr 374)
14. Schneider BP, Wang M, Radovich M, Sledge GW, Badve S, Thor A. et al. Association of vascular endothelial growth factor and vascular endothelial growth factor receptor-2 genetic polymorphisms with outcome in a trial of paclitaxel compared with paclitaxel plus bevacizumab in advanced breast cancer: ECOG 2100. J Clin Oncol. 2008;26:4672-8
15. Hurwitz HI, Douglas PS, Middleton JP, Sledge GW, Johnson DH, Reardon DA. et al. Analysis of Early Hypertension and Clinical Outcome With Bevacizumab: Results From Seven Phase III Studies. Oncologist. 2013;18:273-80
16. Gampenrieder SP, Romeder F, Muss C, Pircher M, Ressler S, Rinnerthaler G. et al. Hypertension as a predictive marker for bevacizumab in metastatic breast cancer: results from a retrospective matched-pair analysis. Anticancer research. 2014;34:227-33
17. Mohammad HP, Smitheman KN, Kamat CD, Soong D, Federowicz KE, Van Aller GS. et al. A DNA Hypomethylation Signature Predicts Antitumor Activity of LSD1 Inhibitors in SCLC. Cancer cell. 2015;28:57-69
18. Chen CC, Lee KD, Pai MY, Chu PY, Hsu CC, Chiu CC. et al. Changes in DNA methylation are associated with the development of drug resistance in cervical cancer cells. Cancer Cell Int. 2015;15:98
19. Du M, Su XM, Zhang T, Xing YJ. Aberrant promoter DNA methylation inhibits bone morphogenetic protein 2 expression and contributes to drug resistance in breast cancer. Mol Med Rep. 2014;10:1051-5
20. Liu G, Liu YJ, Lian WJ, Zhao ZW, Yi T, Zhou HY. Reduced BMP6 expression by DNA methylation contributes to EMT and drug resistance in breast cancer cells. Oncol Rep. 2014;32:581-8
21. Lund RJ, Huhtinen K, Salmi J, Rantala J, Nguyen EV, Moulder R. et al. DNA methylation and Transcriptome Changes Associated with Cisplatin Resistance in Ovarian Cancer. Sci Rep. 2017;7:1469
22. Wang QY, Zhong H. Epigenetic programming contributes to development of drug resistance in hematological malignancies. Front Biosci (Landmark Ed). 2015;20:728-42
23. Weinhaeusel A, Thiele S, Hofner M, Hiort O, Noehammer C. PCR-based analysis of differentially methylated regions of GNAS enables convenient diagnostic testing of pseudohypoparathyroidism type Ib. Clin Chem. 2008;54:1537-45
24. Touleimat N, Tost J. Complete pipeline for Infinium((R)) Human Methylation 450K BeadChip data processing using subset quantile normalization for accurate DNA methylation estimation. Epigenomics. 2012;4:325-41
25. Wang D, Yan L, Hu Q, Sucheston LE, Higgins MJ, Ambrosone CB. et al. IMA: an R package for high-throughput analysis of Illumina's 450K Infinium methylation data. Bioinformatics. 2012;28:729-30
26. Noehammer C, Pulverer W, Hassler MR, Hofner M, Wielscher M, Vierlinger K. et al. Strategies for validation and testing of DNA methylation biomarkers. Epigenomics. 2014;6:603-22
27. Pandey RV, Pulverer W, Kallmeyer R, Beikircher G, Pabinger S, Kriegner A. et al. MSP-HTPrimer: a high-throughput primer design tool to improve assay design for DNA methylation analysis in epigenetics. Clin Epigenetics. 2016;8:101
28. Pabinger S, Ernst K, Pulverer W, Kallmeyer R, Valdes AM, Metrustry S. et al. Analysis and Visualization Tool for Targeted Amplicon Bisulfite Sequencing on Ion Torrent Sequencers. PLoS One. 2016;11:e0160227
29. Morris TJ, Butcher LM, Feber A, Teschendorff AE, Chakravarthy AR, Wojdacz TK. et al. ChAMP: 450k Chip Analysis Methylation Pipeline. Bioinformatics. 2014;30:428-30
30. Butcher LM, Beck S. Probe Lasso: a novel method to rope in differentially methylated regions with 450K DNA methylation data. Methods. 2015;72:21-8
31. Sorlie T, Perou CM, Tibshirani R, Aas T, Geisler S, Johnsen H. et al. Gene expression patterns of breast carcinomas distinguish tumor subclasses with clinical implications. PNAS. 2001;98:10869-74
32. Cheang MC, Voduc KD, Tu D, Jiang S, Leung S, Chia SK. et al. Responsiveness of intrinsic subtypes to adjuvant anthracycline substitution in the NCIC.CTG MA.5 randomized trial. Clinical cancer research: an official journal of the American Association for Cancer Research. 2012;18:2402-12
33. Chia SK, Bramwell VH, Tu D, Shepherd LE, Jiang S, Vickery T. et al. A 50-gene intrinsic subtype classifier for prognosis and prediction of benefit from adjuvant tamoxifen. Clinical cancer research: an official journal of the American Association for Cancer Research. 2012;18:4465-72
34. Cardoso F, van't Veer LJ, Bogaerts J, Slaets L, Viale G, Delaloge S. et al. 70-Gene Signature as an Aid to Treatment Decisions in Early-Stage Breast Cancer. N Engl J Med. 2016;375:717-29
35. Bernstein BE, Meissner A, Lander ES. The mammalian epigenome. Cell. 2007;128:669-81
36. Ma X, Liu Z, Zhang Z, Huang X, Tang W. Multiple network algorithm for epigenetic modules via the integration of genome-wide DNA methylation and gene expression data. BMC Bioinformatics. 2017;18:72
37. Egger G, Wielscher M, Pulverer W, Kriegner A, Weinhausel A. DNA methylation testing and marker validation using PCR: diagnostic applications. Expert Rev Mol Diagn. 2012;12:75-92
38. Antequera F, Bird A. CpG islands as genomic footprints of promoters that are associated with replication origins. Curr Biol. 1999;9:R661-7
39. van Beijnum JR, Nowak-Sliwinska P, Huijbers EJ, Thijssen VL, Griffioen AW. The great escape; the hallmarks of resistance to antiangiogenic therapy. Pharmacol Rev. 2015;67:441-61
40. Burstein HJ, Chen YH, Parker LM, Savoie J, Younger J, Kuter I. et al. VEGF as a marker for outcome among advanced breast cancer patients receiving anti-VEGF therapy with bevacizumab and vinorelbine chemotherapy. Clin Cancer Res. 2008;14:7871-7
41. Miles DW, de Haas SL, Dirix LY, Romieu G, Chan A, Pivot X. et al. Biomarker results from the AVADO phase 3 trial of first-line bevacizumab plus docetaxel for HER2-negative metastatic breast cancer. Br J Cancer. 2013
42. Long MD, Smiraglia DJ, Campbell MJ. The Genomic Impact of DNA CpG Methylation on Gene Expression; Relationships in Prostate Cancer. Biomolecules. 2017:7
43. Chae H, Lee S, Nephew KP, Kim S. Subtype-specific CpG island shore methylation and mutation patterns in 30 breast cancer cell lines. BMC Syst Biol. 2016;10:116
44. Gulyaeva LF, Kushlinskiy NE. Regulatory mechanisms of microRNA expression. Journal of translational medicine. 2016;14:143
45. Cherny NI, Sullivan R, Dafni U, Kerst JM, Sobrero A, Zielinski C. et al. A standardised, generic, validated approach to stratify the magnitude of clinical benefit that can be anticipated from anti-cancer therapies: the European Society for Medical Oncology Magnitude of Clinical Benefit Scale (ESMO-MCBS). Ann Oncol. 2015;26:1547-73
46. Miller KD, Chap LI, Holmes FA, Cobleigh MA, Marcom PK, Fehrenbacher L. et al. Randomized phase III trial of capecitabine compared with bevacizumab plus capecitabine in patients with previously treated metastatic breast cancer. J Clin Oncol. 2005;23:792-9
47. Vrdoljak E, Marschner N, Zielinski C, Gligorov J, Cortes J, Puglisi F. et al. Final results of the TANIA randomised phase III trial of bevacizumab after progression on first-line bevacizumab therapy for HER2-negative locally recurrent/metastatic breast cancer. Annals of oncology. 2016;27:2046-52
48. Institute_of_Medicine. Evolution of Translational Omics: Lessons Learned and the Path Forward. Washington, DC: The National Academies Press. 2012
Author contact
![]() Corresponding author: Univ. Prof. Dr. Richard Greil, Department of Internal Medicine III, Paracelsus Medical University Salzburg, Müllner Hauptstraße 48, 5020 Salzburg, Austria. Phone: +43 (0) 5 7255 25801; Fax: +43 (0) 5 7255 25999; E-Mail: r.greilat
Corresponding author: Univ. Prof. Dr. Richard Greil, Department of Internal Medicine III, Paracelsus Medical University Salzburg, Müllner Hauptstraße 48, 5020 Salzburg, Austria. Phone: +43 (0) 5 7255 25801; Fax: +43 (0) 5 7255 25999; E-Mail: r.greilat