Impact Factor
- Issue 14; 2026
- Issue 13; 2026
- Issue 12; 2026
- Issue 11; 2026
- Issue 10; 2026
- Volume 16; 2026
- Advance Articles
- Past Issues
- Cover Images
- Cover Suggestion
- Index & Coverage
- Special Issues
Introduction
Methods
Results
Discussion
Abbreviations
Supplementary Material
Acknowledgements
References
International Journal of Biological Sciences
International Journal of Medical Sciences
 Global reach, higher impact

Theranostics 2018; 8(12):3237-3255. doi:10.7150/thno.23772 This issue Cite
Research Paper
Rich club disturbances of the human connectome from subjective cognitive decline to Alzheimer's disease
Tianyi Yan1,2 ![]() *, Wenhui Wang1,2*, Liu Yang3*, Kewei Chen4, Rong Chen5, Ying Han3,6,7,8
*, Wenhui Wang1,2*, Liu Yang3*, Kewei Chen4, Rong Chen5, Ying Han3,6,7,8 ![]()
1. School of Life Science, Beijing Institute of Technology, Beijing, China;
2. Key Laboratory of Convergence Medical Engineering System and Healthcare Technology, The Ministry of Industry and Information Technology, Beijing Institute of Technology, Beijing, China;
3. Department of Neurology, XuanWu Hospital of Capital Medical University, Beijing, China.
4. Banner Alzheimer's Institute and Banner Good Samaritan PET center, Phoenix, AZ, USA;
5. Department of Diagnostic Radiology and Nuclear Medicine, University of Maryland, Baltimore, USA.
6. Center of Alzheimer's Disease, Beijing Institute for Brain Disorders, Beijing, China;
7. Beijing Institute of Geriatrics, Beijing, China;
8. National Clinical Research Center for Geriatric Disorders, Beijing, China.
*These authors have contributed equally to this work
Received 2017-11-10; Accepted 2018-4-8; Published 2018-5-11
Abstract

Alzheimer's disease (AD) has a preclinical phase that can last for decades prior to clinical dementia onset. Subjective cognitive decline (SCD) is regarded as the last preclinical AD stage prior to the development of amnestic mild cognitive decline (aMCI) and AD dementia (d-AD). The analysis of brain structural networks based on diffusion tensor imaging (DTI) has identified the so-called 'rich club', a set of cortical regions highly connected to each other, with other regions referred to as peripheral. It has been reported that rich club architecture is affected by regional atrophy and connectivity, which are reduced in patients with aMCI and d-AD.
Methods: We recruited 62 normal controls, 47 SCD patients, 60 aMCI patients and 55 d-AD patients and collected DTI data to analyze rich-club organization.
Results: We demonstrated that rich club organization was disrupted, with reduced structural connectivity among rich club nodes, in aMCI and d-AD patients but remained stable in SCD patients. In addition, SCD, aMCI and d-AD patients showed similar patterns of disrupted peripheral regions and reduced connectivity involving these regions, suggesting that peripheral regions might contribute to cognitive decline and that disruptions here could be regarded as an early marker of SCD. This organization could provide the fundamental structural architecture for complex cognitive functions and explain the low prevalence of cognitive problems in SCD patients.
Conclusions: These findings reveal a disrupted pattern of the AD connectome that starts in peripheral regions and then hierarchically propagates to rich club regions, when patients show clinical symptoms. This pattern provides evidence that disruptions in rich club organization are a key factor in the progression of AD that can dynamically reflect the progression of AD, thus representing a potential biomarker for early diagnosis.
Keywords: subjective cognitive decline, Alzheimer's disease, DTI, rich club, graph theory
Introduction
Alzheimer's disease (AD) is a progressive neurodegenerative disorder characterized by loss of memory and cognitive decline. Early diagnosis and interventions for preclinical AD are urgently needed due to the failures seen in clinical trials of patients with AD dementia (d-AD) and prodromal AD/ amnestic mild cognitive impairment (aMCI). Subjective cognitive decline (SCD) has been defined as the last stage in the preclinical phase of AD, and it refers to elderly people who have consistent complaints of gradual cognitive decline, especially memory related, with a high risk of conversion to aMCI and d-AD [1-4]. Recent neuroimaging studies have found that patients with SCD present white matter (WM) degeneration [5, 6], gray matter atrophy [7, 8], high levels of brain amyloid-beta depositions [9, 10], altered spontaneous functional activity [11, 12], and brain hypometabolism [13-15]. These findings are similar to the pattern of alterations seen in aMCI and d-AD patients. Comparing and analyzing SCD, aMCI and d-AD patients can help us better understand the neurodegenerative mechanisms of AD from the preclinical to dementia stages and identify possible targets for treatment and prevention.
In addition to the neuropathological amyloid or tau hypotheses, AD is also viewed as a disconnection syndrome [16]. Jones et al. hypothesized a cascading network failure in AD: the failure begins with a local overload, which then transfers a processing burden to other systems that contain prominent connectivity hubs, eventually leading to widespread system failures [17]. Martijin and Olaf et al. demonstrated that a 'rich club' is formed by brain hubs of high-degree nodes. The rich club is characterized by a tendency for hubs to be more densely connected among themselves than with peripheral regions, i.e., lower-degree nodes; this organization provides important information on the higher-level topology of the brain network [18-20].
Network disruptions within the rich club have a significant impact on cognition, because the rich club is a high-capacity central core, and rich club connections play a key role in the global integration of neural information among regions of the brain [18]. Many studies have reported that patients with AD, from the preclinical to dementia stages, have significant hub-concentrated lesion distributions [21-25]. However, Daianu et al. proposed that the network disruption was predominate in the peripheral network components in patients with d-AD and less pronounced in those with MCI [26]. Zhao et al. also found that decreases in the connection strength of the edges between peripheral nodes were observed in aMCI patients compared with that in normal controls (NC) [27]. Wang et al. failed to detect significant hub alterations between patients with SCD and NC [28]. These inconsistent findings suggest that the network disruption mechanisms remain unclear.
Here, we recruited a relatively large sample (N=224) of study participants that consisted of NC and SCD, aMCI and d-AD subjects, representing normal aging and the preclinical, prodromal and dementia stages of AD, respectively. Diffusion tensor imaging (DTI) data were collected and utilized to reconstruct brain structural networks. We aimed to reveal how the patterns of rich club organization change with disease progression. This pattern of changes might be a biomarker for early diagnosis and may act as a guide for clinical trials and interventions.
Methods
Participants
A total of 224 right-handed Han Chinese subjects were recruited into this study between September 2009 and December 2015. Among them, 62 NC subjects were recruited from the local community through advertisements. A total of 162 subjects with memory concerns were recruited from the memory clinic of the Neurology Department of XuanWu Hospital in Beijing, China, including 47 SCD, 60 aMCI, and 55 d-AD subjects. The study was approved by the Medical Research Ethics Committee and Institutional Review Board of XuanWu Hospital (ClinicalTrials.gov identifiers: NCT02353884 and NCT02225964).
All subjects provided written informed consent prior to any experimental procedures. All subjects underwent a series of standardized clinical evaluations, including a medical history interview, a neurologic examination, and a battery of neuropsychological tests. Neuropsychological tests included the Chinese version of the Mini-Mental State Examination (MMSE), the Beijing version of Montreal Cognitive Assessment (MoCA) [29], the Clinical Dementia Rating Scale (CDR) [30], the auditory verbal learning test (AVLT) [31], an activities of daily living (ADL) assessment, the Hachinski Ischemic Scale, the Hamilton Depression Rating Scale (HAMD) [32], and The Center for Epidemiologic Studies Depression Scale. [33]. The diagnoses were performed by experienced neurologists. All the subjects were diagnosed according to guidelines and asked to undergo a brain magnetic resonance imaging (MRI) scan once they were enrolled.
- The NC patients were required to meet the following research criteria: (a) no memory concerns; (b) MMSE and MoCA scores within the normal range (adjusted for age, sex, and education); and (c) a CDR score of 0.
- The diagnosis of SCD was based on the published SCD research criteria proposed by the Subjective Cognitive Decline Initiative (SCD-I) [1]: (a) self-perceived continuous decline in memory compared with a previous normal status within the last 5 years combined with an informant report; (b) MMSE and MoCA scores within the normal range after age, gender, and education adjustments; and (c) a CDR score of 0.
- Inclusion criteria for aMCI diagnosis included the following: (a) memory complaints, confirmed by an informant; (b) objectively impaired memory confirmed by neuropsychological tests; (c) a definite history of cognitive decline; (d) not meeting the criteria for dementia according to the Diagnostic and Statistical Manual of Mental Disorders, Fourth Edition, Revised (DSM-IV-R); and (e) a CDR score of 0.5.
- d-AD subjects were diagnosed according to the National Institute of Aging-Alzheimer's Association (NIA-AA) criteria for clinically probable AD [34, 35]: (a) meeting the criteria for dementia; (b) insidious and gradual onset (not sudden) over more than 6 months; (c) definite history of declining cognition; (d) initial and most prominent cognitive deficits evident in amnestic or non-amnestic performance; and (e) hippocampal atrophy confirmed by structural MRI.
The exclusion criteria applied to all subjects and included the following: (a) a history of stroke (Hachinski Ischemic Scale score > 4 points); (b) severe depression (HAMD score > 24 points or The Center for Epidemiological Studies Depression Scale score > 21 points); (c) other central nervous system diseases that could cause cognitive decline (e.g., epilepsy, brain tumors, Parkinson's disease, or encephalitis); (d) systemic diseases that could cause cognitive impairments (e.g., anthracemia, syphilis, thyroid dysfunctions, severe anemia, or HIV); (e) a history of psychosis or congenital mental growth retardation; (f) severe hypopsia or dysacusis; (g) cognitive decline caused by traumatic brain injury; (h) severe end-stage disease or severe diseases in acute stages; or (i) unable to complete neuropsychological tests or with a contraindication for MRI.
Imaging
All MR scans were performed on a 3.0 Tesla MR system (Siemens Magnetom Trio Tim MRI system, Germany) using a standard head coil. During the entire scanning procedure, cushions and headphones were used to reduce subject movements and scanner noise. Structural DTI data and T1-weighted data were collected for all participants.
- Diffusion tensor imaging. DTI data were collected three times using an echo planar imaging (EPI) sequence with the following parameters: 31 independent, non-collinear directions of a b-value=1000
 and one additional image with no diffusion weighting (b=0), slices=60, TR=11000 ms, TE=98 ms, flip angle=90°, field of view (FOV)=256 mm × 232 mm, acquisition matrix=128×116, no gap, and thickness=2 mm, with reversed k-space read-out. The resulting T1-weighted images and cortical models were linearly aligned to the space of the diffusion weighted images (DWIs). DWIs as well as resulting tracts were further elastically registered to the T1-weighted images to account for susceptibility artifacts (we assume that the T1-weighted scan serves as a relatively undistorted anatomical reference).
 - Anatomical T1. T1-weighted MR images were obtained by a 3D magnetization-prepared rapid gradient echo (MPRAGE) with the following parameters: slices=176, TR=1900 ms, TE=2 ms, inversion time (TI)=900 ms, flip angle=9°, FOV=224×256 mm2, acquisition matrix=448×512, no gap, and thickness=1.0 mm [28]. These images were acquired for anatomical reference.
Image preprocessing
Image preprocessing steps were performed using the PANDA toolbox (http://www.nitrc.org/projects/panda) based on FSL 5.0 for all DTI images (http://fsl.fmrib.ox.ac.uk/fsl/fslwiki) and Diffusion Toolkit (http://www.trackvis.org/dtk/), including motion and eddy current corrections [36]. The fractional anisotropy (FA) of each voxel was computed, with higher values indicating more directionally restricted diffusion of water molecules. Affine transformation was used to co-register FA images in native space to their corresponding T1-weighted images. Structural images were then non-linearly registered to the ICBM152 template. Based on the above two steps, an inverse warping transformation from the standard space to the native dMRI space can be obtained. The automated anatomical labeling (AAL) atlas in the standard space was then used to inversely warp images back to individual native space by applying this inverse transformation. This parcellation divided the cortical surface into 90 regions (45 per hemisphere). The resulting inverse deformation map (T-1) for each subject was then applied to warp the AAL template to the DTI native space of each subject, using the nearest neighbor interpolation method, as each AAL region was defined as a brain network node.
Finally, for each individual DTI data set, WM pathways were reconstructed and referred as fibers or tracts using streamline tractography. The Fiber assignment by continuous tracking (FACT) algorithm was used [37, 38]. In the brain mask, 8 seeds followed the main diffusion direction from voxel to voxel. A streamline was terminated when it reached a voxel with an FA value lower than 0.1 (reflecting low levels of preferred diffusion, often gray matter voxels), when the streamline exceeded the brain mask (i.e., gray and white matter voxels), or when the trajectory of the streamline made a turn sharper than 45 degrees [18, 39]. Streamlines longer than 15 mm were considered in further analyses.
The integrity of the interregional WM connections was measured by estimating FA values for each of the interconnecting tracts. FA values represented the extent of the anisotropic diffusion of WM in a brain voxel and are one of the commonly used metrics to examine the microstructural aspects of brain connectivity. It is believed that a large contribution to the direction-dependent diffusion signal comes from axonal membranes, which hinder the diffusion of water molecules. Higher FA values indicate a higher level of microstructural organization of WM connections [18, 40], while lower levels of FA are commonly used as a marker for WM damage [41, 42]. Furthermore, higher FA values of WM tracts have been linked to faster task performance [43, 44], making FA values a possible marker for the efficacy of brain connections. In this paper, for each of the existing connections, the FA based inter-regional connection (FABIRC) was computed as the mean of the FA values of all included streamlines that formed the connection between two regions. The FABIRC value was then entered in the FABIRC-weighted connectivity matrix [18].
Network construction
Structural connectivity between regions differs across subjects. This study focused on the connections that were the most consistent across subjects, that is, the backbone network mask. To identify the highly consistent cortical connections, a nonparametric one-tailed sign test was applied. For each pair of cortical regions, the sign test was performed with the null hypothesis that there was no existing connection, that is, FABIRC =0. The Bonferroni method was used to correct for multiple comparisons (i.e., 90×89/2=4005 pairs of regions) at P<0.05. The sign test was chosen because of doubts about the validity of the absolute FABIRC estimation and to minimize the inclusion of false positives. The use of this conservative statistical criterion generated a symmetric binary matrix that can be considered a mask for each group that captured the underlying structural connectivity patterns in the cerebral cortex of each group [45]. The mask was chosen to balance the statistical evidence of connectivity, to avoid less reliable and sparser networks and exclude connections due to noise rather than pathology. The mask was then used as a threshold for the connectivity matrices in each group and generated sparse connectivity matrices for subsequent graph theoretic analyses. Thus, this paper generated four masks overall. Then, we controlled the network density at 16% for each subject.
Rich club organization
A connection matrix was constructed for each subject with the sparse mask defined above. The GRETNA toolbox (http://www.nitrc.org/projects/gretna/) [46], implemented in Matlab (MathWorks, Inc.), was used for network analyses.
We computed the 'rich club coefficient', defined as the density of connections (average connection weight) between rich club nodes [47]. A rich club analysis was performed to identify the rich club organization in each group. The weighted rich club coefficients were calculated for each participant and normalized relative to a set of 1000 comparable random networks [48, 49] (see Supplementary Material for details). Normalized rich club coefficients greater than 1 over a range of degrees (k) suggests the existence of a rich club organization in the brain [18, 26, 39].
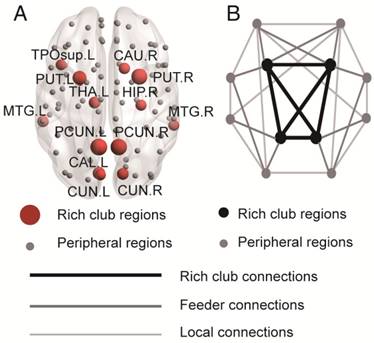
Rich club regions were defined as the top 13 (15%) brain regions with the highest degree averaged across all groups [18, 26, 39, 50, 51]. Based on the categorization of the nodes of the network into rich club and peripheral regions, the edges of the network were classified into rich club connections, linking two rich club nodes; feeder connections, linking one rich club node to one peripheral node; and local connections, linking two peripheral nodes (Figure 2B) [39, 51]. The 'connectivity strength', a summary measure of connectivity, was calculated as the sum of the edge weights for each connection type.
Rich club regions of all groups. (A) Rich club members (red nodes) across all healthy and patient groups (N=224). (B) A simplified example of the three classes of connections: rich club connections, linking two rich club nodes; feeder connections, linking one rich club node to one peripheral node; and local connections, linking two peripheral nodes.
In this study, the nodal efficiency was computed to examine the regional characteristics of each cortical region in a structural network, which describe the network integrity after deleting a node or the effects of perturbations on local network states [48, 52-54]. The results of the network analyses were visualized using the BrainNet Viewer toolbox (http://www.nitrc.org/projects/bnv) [55].
Statistical analysis
Statistical Package for Social Science (SPSS, v20.0) (http://www.spss.com/) was employed for all statistical analyses. ANOVAs were used to test for group differences in age and education, and a chi-square test was used to test for differences in gender.
ANCOVAs (age- and gender-corrected) were used to test for group differences in network topology metrics, nodal efficiency and three classes of connectivity strength, with post hoc tests and Bonferroni corrections for multiple comparisons at P<0.05. In addition, rich club coefficients and normalized rich club coefficients were corrected (Bonferroni) for groups and all degree levels.
We used partial Pearson's correlations controlled for age, gender, and education to assess how graph metrics related to clinical performance in each group. The P values were Bonferroni-corrected for the number of cognitive test variables (AVLT-immediate recall, AVLT-delayed recall, AVLT-recognition, MMSE and MoCA). Significance was set at P<0.05. For nodal efficiency, we only examined the nodes with the most abnormal connectivity (more than 11 abnormal edges) [56].
To compare the abnormal connections in patient groups and NC, we first detected the significant non-zero connections (backbone) within each group by performing a nonparametric one-tailed sign test (P<0.05, corrected). Next, the non-zero connections within both the patient and control groups were detected and combined into a connection mask. Two-sample t-tests (NC group versus each diagnostic group) were then conducted within the connection mask, with the FDR corrected to the P values to correct for multiple comparisons across all edges. Significance was set at P<0.05. For each diagnostic group, a chi-squared (χ2) test was performed to assess the differences between the expected proportions of the edges (i.e., the known number of average rich club, feeder, and local edges) and the observed proportions (i.e., altered edges) compared to the NC group [50].
Age-matched replication dataset
Since there was almost 10 years of difference between NC and d-AD patients, to obtain a matched sample for NC and SCD, aMCI and d-AD patients, this paper excluded participants above the age of 75. A total of 183 participants were included in this replication dataset, consisting of 59 NC, 42 SCD patients, 47 aMCI patients, and 35 d-AD patients.
ANOVAs were used to test for group differences in age and education, and a chi-square test was used to test for group differences in gender. ANOVAs were used to test for group differences in rich club coefficients, normalized rich club coefficients, three classes of connectivity strength and network topological metrics, with post hoc tests and Bonferroni corrections for multiple comparisons at P<0.05. In addition, rich club coefficients and normalized rich club coefficients were corrected (Bonferroni) for groups and all degree levels. We used partial Pearson's correlations controlled for education to assess how rich club organization and network topological metrics related to clinical impairments in each group. The P values were Bonferroni-corrected for the number of cognitive test variables (AVLT-immediate recall, AVLT-delayed recall, AVLT-recognition, MMSE and MoCA). Significance was set at P<0.05.
Results
Neuropsychological testing
A total of 62 NC and 47 SCD, 60 aMCI, and 55 d-AD patients were included in this study. Table 1 summarizes the demographic characteristics and neuropsychological performance of the four groups. Significant group differences were found in age and education (See post hoc details in Table S1), but no significant group differences were found (P>0.05 for all) in gender. Group differences (ANCOVA; age, gender and education covariates) were found for all cognitive variables (Table 1). d-AD and aMCI patients performed significantly worse than NC and SCD patients on all tasks. The best memory performance was for the NC, intermediate performance in the SCD patients, worse performance in aMCI patients, and the worst performance in d-AD patients (See post hoc details in Table S2).
Demographic, clinical and cognitive test variables.
| Demographics and Neuropsychological Tests | NC | SCD | aMCI | d-AD | F | pa | Esb | Post hocsc |
|---|---|---|---|---|---|---|---|---|
| 62 | 47 | 60 | 55 | |||||
| Age (years) | 63.27 (8.11) | 65.34 (8.35) | 67.27 (9.39) | 70.93 (9.80) | 7.436 | <0.001 | 0.093 | NC<aMCI<d-AD; SCD<d-AD |
| Education (years) | 10.95 (4.97) | 11.70 (4.61) | 9.75 (4.91) | 8.85 (5.55) | 3.274 | 0.022 | 0.043 | SCD>aMCI, d-AD; NC>d-AD |
| Gender (F/M) | 39/23 | 26/21 | 31/29 | 35/20 | 2.442 | 0.486 | - | - |
| AVLT-Immediate Recall Scores | 9.01 (1.87) | 8.32 (1.74) | 6.11 (1.72) | 3.67 (1.65) | 81.23 | <0.001 | 0.553 | NC>SCD>aMCI>d-AD |
| AVLT-Delayed Recall Scores | 9.76 (3.00) | 8.55 (2.72) | 3.85 (2.91) | 1.08 (1.67) | 96.56 | <0.001 | 0.595 | NC>SCD>aMCI>d-AD |
| AVLT-Recognition Scores | 11.70 (2.58) | 11.11 (2.40) | 7.71 (3.83) | 3.67 (3.33) | 55.07 | <0.001 | 0.456 | NC, SCD>aMCI>d-AD |
| MMSE | 27.78 (2.25) | 27.98 (1.72) | 24.74 (4.12) | 16.96 (6.33) | 70.56 | <0.001 | 0.518 | NC, SCD>aMCI>d-AD |
| MoCA | 25.89 (3.36) | 25.14 (2.87) | 19.71 (4.30) | 12.75 (5.12) | 117.6 | <0.001 | 0.642 | NC>SCD>aMCI>d-AD |
a Values for age and education derived from ANOVA; gender from chi-square test; all clinical/cognitive variables from ANCOVA with age, gender, and education as covariates.
b Effect size; η2 for demographic and clinical variables and partial η2 for cognitive variables.
c Least significant difference; post hoc testing on cognitive variables based on means adjusted for age, gender and education.
aMCI: amnestic mild cognitive impairment; AVLT: auditory verbal learning test; d-AD: dementia of Alzheimer's disease; MMSE: mini-mental state examination; MoCA: Montreal cognitive assessment; NC: normal control; SCD: subjective cognitive decline.
Rich club organization of all groups
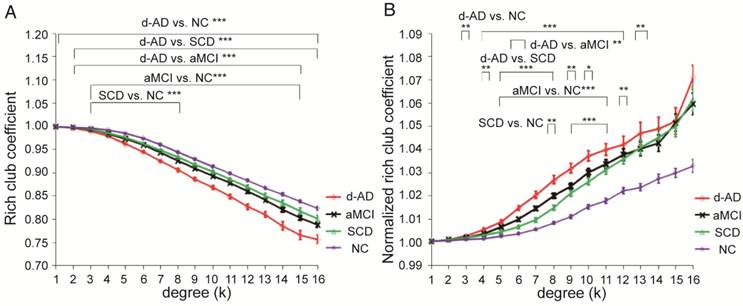
In the whole-brain network, rich club coefficient was significantly lower in patients than in controls (Figure 1A). Rich club organization was evident in all groups (Figure 1B), with the normalized rich club coefficient (Ønorm) increasing as a function of node degree (k) higher than 1. A k of 16 was the highest value where all subjects had data and the k-value functions exhibited no sharp discontinuities, as edges that interconnected brain regions dropped off more readily in patients (especially in aMCI and d-AD patients) than in NC. We only reported degree (k) levels in all patient groups at which the rich club effects were detected across most participants (90%) [26]. The top 13 (15%) highest-degree nodes (Figure 2A, red nodes) were chosen to represent rich club regions on the basis of the averaged nodal degree across all groups. This rich club selection ensures equal numbers of nodes are used to construct the rich clubs regardless of the average degree across subjects. In other words, this method avoids a (potential) bias towards the notion of patients having fewer hub regions and therefore (as a rather trivial result) less inter-hub connectivity. The rich club regions identified included (in order of degree): the left and right precuneus (PCUN), right and left lenticular nucleus, putamen (PUT), left calcarine fissure and surrounding cortex (CAL.L), left thalamus (THA.L), left and right cuneus (CUN), left middle temporal gyrus (MTG.L), right caudate nucleus (CAU.R), right hippocampus (HIP.R), right middle temporal gyrus (MTG.R), left temporal pole: superior temporal gyrus (TPOsup.L). The remaining regions were identified as peripheral regions.
Rich club functions of FABIRC-weighted group networks. The figures show (A) rich club coefficients and (B) normalized rich club coefficients for a range of ks. The graph shows the association between the mean (standard error) Ønorm as a function of node degree (k) for each of the groups. The differences between NC and patient groups emerge as the node degree increases (N=224). *P<0.05, ** P<0.01, *** P<0.001. Normalized rich club coefficients were larger than 1, suggesting rich club organization in all groups.
Rich Club Disturbances with Disease Progression
Figure 1A-B display Ø and Ønorm as a function of node degree (k), respectively. A k of 16 was the highest value for which all subjects had data and the k-value functions exhibited no sharp discontinuities. The rich club coefficient (Ø) was significantly lower in all patient groups relative to controls, but especially at low-degree k-levels: k=3-8 in SCD patients, k=3-15 in aMCI patients, and k=1-16 in d-AD patients (Bonferroni-corrected for groups and all degree levels, Figure 1A; see ANCOVA details in Table S3 and post hoc details in Table S4).
Normalized rich club coefficients (Ønorm) were significantly higher in all patient groups relative to controls, but especially at low-degree k-levels: k=8-11 in SCD patients, k=5-12 in aMCI patients, and k=3-13 in d-AD patients (Bonferroni-corrected for groups and all degree levels, Figure 1B; see ANCOVA details in Table S5 and post hoc details in Table S6). Ønorm in the d-AD group was the largest among all groups at every k-level. These findings may suggest that the low-degree k-value regions are more affected than the high-degree regions in patients, as indicated by the tendency for higher Ønorm values with increasing disease progression.
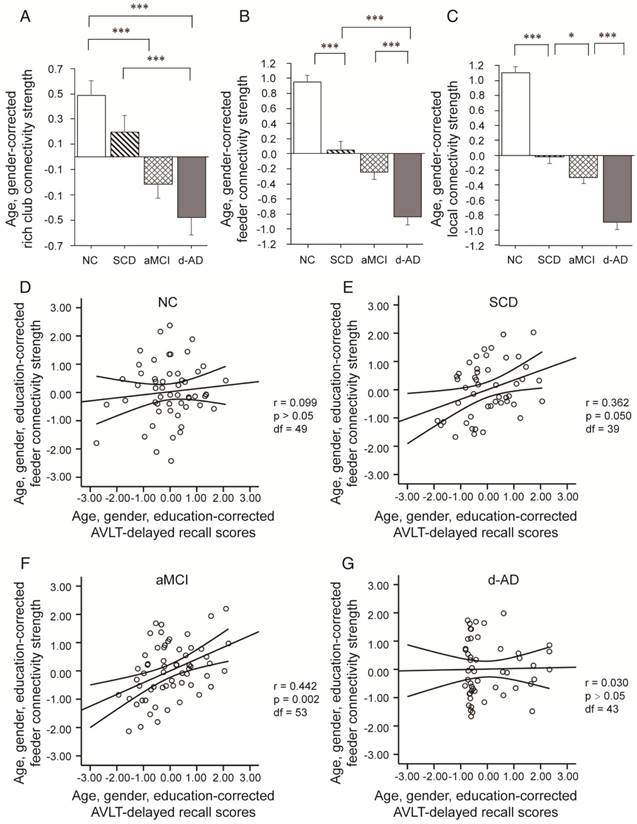
Connectivity strength was examined by distinguishing different types of connections: local connections between peripheral nodes; feeder connections between peripheral and rich club nodes; and rich club connections between rich club nodes only (Figure 2B). Significant group differences (ANCOVA; age and gender covariates) were observed in rich club connectivity strength (F(3,220)=13.594, P<0.001, partial η2=0.158), feeder connectivity strength (F(3,220)=67.933, P<0.001, partial η2=0.483), and local connectivity strength (F(3,220)=116.247, P<0.001, partial η2=0.615).
Post hoc tests demonstrated that compared to that in the NC, local connectivity strength significantly decreased in the SCD (P<0.001), aMCI (P<0.001) and d-AD (P<0.001) patients, meaning that all patient groups had abnormal connections between peripheral regions (see post hoc details in Table S7 and Figure 3). Significant declines were seen in aMCI (P=0.045) and d-AD (P<0.001) patients versus SCD patients, and a more severe decline was seen in d-AD patients versus aMCI patients (P<0.001). In other words, this disruption of local connections between peripheral nodes gradually increased as the disease progressed (Figure 3C). The feeder connectivity followed a similar trend with disease progression as the local connectivity strength. Aberrant feeder connections between peripheral and rich club regions were observed in all patient groups, as indicated by the significant declines in the SCD (P<0.001), aMCI (P<0.001) and d-AD (P<0.001) patients compared to NC. The d-AD group also showed more severe disturbances in feeder connections (declines in the d-AD group compared to the SCD group (P<0.001) and the aMCI group (P<0.001). Although there was no significant difference between the SCD and aMCI groups (P=0.109), the corresponding values in the aMCI group were lower than those in the SCD group, meaning that the disruption of feeder connections between peripheral and rich club nodes had a tendency to worsen as the disease progressed (Figure 3B). The rich club connectivity strength patterns were not entirely similar to the two types of connections above (Figure 3A): while significant declines were observed in the aMCI (P<0.001) and d-AD (P<0.001) groups compared to NC, there were no significant group difference between the SCD group and NC. In other words, aMCI and d-AD groups suffered disturbances in the connections between rich club regions, while the SCD group had relatively stable rich club connections. A gradually increasing abnormal tendency was witnessed as the disease progressed, as indicated by lower rich club connectivity strength in the aMCI group than the SCD group and the lowest connectivity strength among all groups in the d-AD group. These results suggest that these disturbances seem to be more likely to occur in the peripheral brain regions. On the other hand, the rich club regions show preserved structural stability during the preclinical stage (SCD). Additional analyses were performed using different rich club node selection methods based on individual networks to examine the robustness of the results independent of the method used, but these differences did not substantially affect the results. (see results in Supplementary Material and Figure S1).
Rich club organization during disease progression. Group differences in rich club network properties are displayed. Bar graphs display the mean (standard error) age- and gender-adjusted connectivity strengths for (A) rich club, (B) feeder and (C) local (N=224). *P<0.05, ** P<0.01, *** P<0.001. Scatter plots show the relationship between the feeder connectivity strength and AVLT-delayed recall score (age-, gender- and education-corrected, after Bonferroni corrections for the number of cognitive test variables) for the (D) NC group, (E) SCD group, (F) aMCI group, and (G) d-AD group. The solid lines show the best-fitting linear regression line and the 95% confidence intervals.
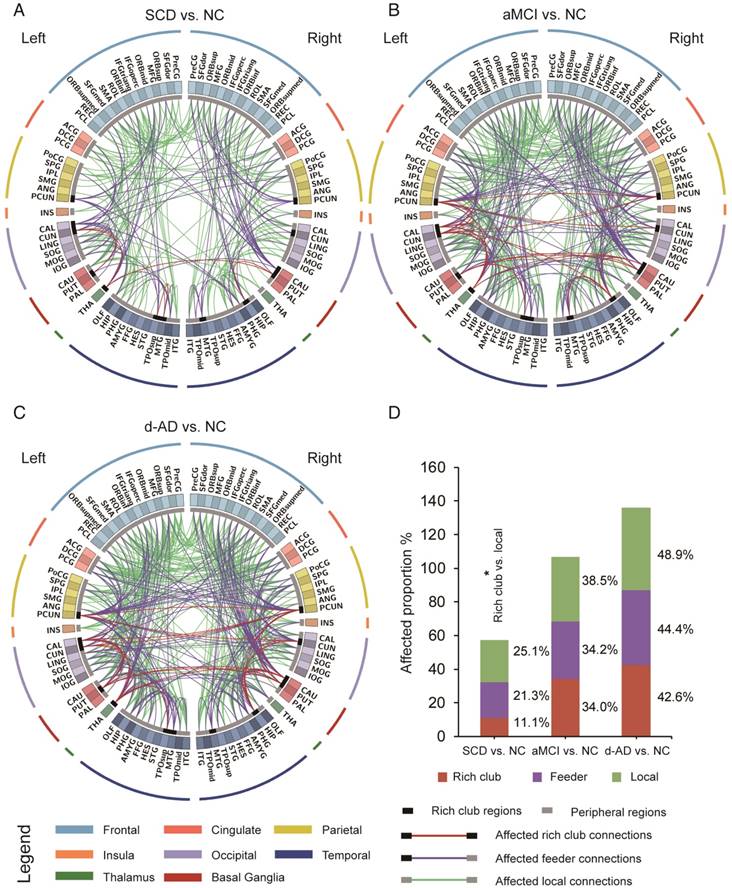
To examine whether the relatively stable connectivity might, to some extent, be concentrated to rich club connections or be disproportionally distributed among rich club, feeder, or local edges in the SCD group compared to NC group, an additional analysis was performed in which the distributions between rich and feeder connections and between rich club and local connections were assessed. FABIRC connectivity was lower in the SCD group than the NC, with 233 connections (5/45 rich club, 74/348 feeder, 154/614 local; Figure 4A), and the proportion of rich club connections was significantly less altered than that of the local connections in the SCD group compared to NC (χ2 P=0.034, Figure 4D). On the other hand, the FABIRC connectivity was affected in the aMCI group, with 383 connections (16/47 rich club, 123/360 feeder, 244/634 local; Figure 4B), and in the d-AD group, with 481 connections (20/47 rich club, 158/356 feeder, 303/620 local; Figure 4C), relative to NC. Neither of these two groups showed significant differences in the proportions between rich club and local connections or between rich club and feeder connections, meaning that the group differences in the abnormal edges were proportionally distributed between rich club and feeder or between rich club and local edges in the aMCI and d-AD groups. These findings tend to suggest that connectivity effects might be concentrated to local connections in patients with SCD and are affected throughout the brain networks in patients with aMCI and d-AD.
The aberrant connections in diagnostic groups relative to NC: (A) SCD patients and NC, (B) aMCI patients and NC, and (C) d-AD patients and NC. Red edges indicate affected rich club connections, purple edges indicate affected feeder connections, and green edges indicate affected local connections. The classification of rich club nodes and non-rich club nodes is depicted by the inner ring (gray palette, with black squares indicating rich club nodes and gray ones indicating non-rich club nodes). (D) Proportion (%, y-axis) of significantly altered connections (100% × observed/expected) illustrated by rich club, feeder and local edges.
Additional analysis was performed to examine whether the observed relatively stable rich club connectivity was simply an effect of the relatively stable longer distances in patients with SCD. Similar results were obtained when FABIRC measurements were corrected for the influences of physical length by regressing out average fiber length across each category of connections. These results showed that the vulnerability of the peripheral regions in patients with SCD is independent of the shorter fiber length (see results in Supplementary Material and Figure S2-3).
Network topological metrics
Group differences (ANCOVA; age and gender covariates) were observed for the strength metric (F(3,220)=108.939, P<0.001, partial η2=0.600; Table 2). Post hoc comparisons revealed decreased strength in the SCD group versus NC (P<0.001), the aMCI group versus the SCD group (P=0.024), and the d-AD group versus the aMCI group (P<0.001; Figure 5A and Table S8).
Network topological metrics.
| Network Topological Metrics | F | pa | Esb |
|---|---|---|---|
| Strength | 108.939 | <0.001 | 0.600 |
| Clustering Coefficient | 13.693 | <0.001 | 0.159 |
| Normalized Clustering Coefficient | 41.412 | <0.001 | 0.363 |
| Characteristic Path Length | 47.919 | <0.001 | 0.397 |
| Normalized Characteristic Path length | 4.787 | 0.003 | 0.062 |
a Values from ANCOVA with age, gender, and education as covariates.
b Effect size; partial η2 for network topological metrics.
Group differences in network topological metrics during disease progression. Bar graphs display the mean (standard error) of the age- and gender-corrected metrics of (A) strength, (B) clustering coefficient, (C) characteristic path length, (D) normalized clustering coefficient and (E) normalized characteristic path length (N=224). *P<0.05, ** P<0.01, *** P<0.001.
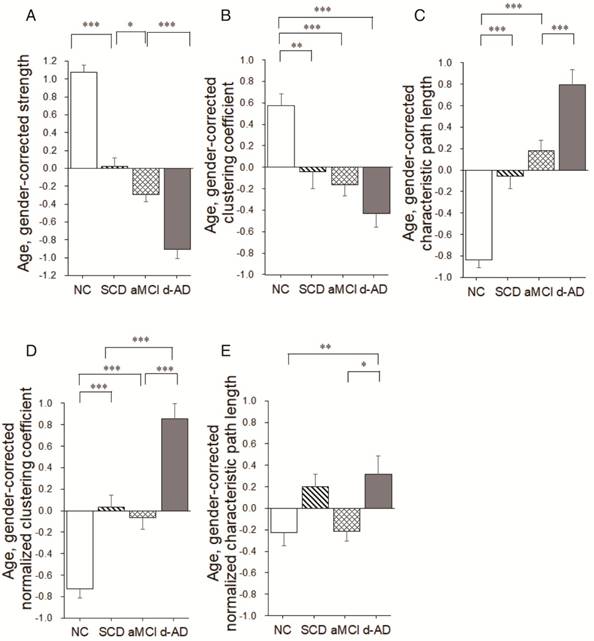
Group differences were observed for the clustering coefficient (F(3,220)=13.693, P<0.001, partial η2=0.159; Table 2). Significant reductions were seen in the three patient groups compared to NC (SCD patients versus NC: P=0.003; aMCI patients versus NC: P<0.001; d-AD patients versus NC: P<0.001). There were no significant differences between patient groups (P>0.05; Figure 5B and Table S8). In addition, there were significant group differences in normalized clustering coefficient (F(3,220)= 41.412, P<0.001, partial η2=0.363; Table 2). Normalized clustering coefficient was significantly higher in SCD patients versus NC (P<0.001) and in d-AD patients versus aMCI patients (P<0.001), although there was no significant difference in SCD patients versus aMCI patients (P>0.05; Figure 5D and Table S8).
There were significant group differences in characteristic path length (F(3,220)=47.919, P<0.001, partial η2=0.397; Table 2).Characteristic path length was significantly higher in SCD patients versus NC (P<0.001) and in d-AD patients versus aMCI patients (P<0.001), although there was no significant difference in SCD patients versus aMCI patients (P>0.05; Figure 5C and Table S8). Group differences were also observed for the normalized characteristic path length (F(3,220)= 4.787, P= 0.003, partial η2=0.062; Table 2). Post hoc comparisons revealed increased value in the d-AD group versus NC (P=0.019), the d-AD group versus the aMCI group (P=0.025; Figure 5E and Table S8).
Whole-brain structural connectivity of abnormal nodes
Some nodes exhibited abnormal connectivity in the SCD, aMCI and d-AD groups. As disturbances in these nodes might be an important source of abnormal communication, we explored the effects of disease progression on 'whole-brain connectivity' within this subset of nodes. To identify these nodes, the frequency of aberrant connections linked by the 90 nodes in patient groups was plotted (Table S9 and Figure S4). We identified the nodes with higher number of abnormal connections (range=11 to 27 aberrant connections; Table S9). The nodes with the most aberrant connections that showed significant group differences in nodal efficiency between patient groups and NC were further analyzed.
In the SCD group, three nodes (Figure 6A-C) were chosen as they contained most aberrant connections compared to NC, including two peripheral nodes, the left caudate nucleus (CAU.L) and left middle frontal gyrus, orbital part (ORBmid.L), and one rich club node, the right caudate nucleus (CAU.R). There were 29 regions (9 rich club regions: PCUN.L, HIP.R, PCUN.R, THA.L, CAU.R, CAL.L, CUN.L, PUT.L, and PUT.R) and 47 regions (9 rich club regions: PCUN.L, PCUN.R, CAU.R, THA.L, PUT.R, PUT.L, HIP.R, CAL.L, and CUN.R) that were shown to be aberrant in the aMCI and d-AD groups, respectively (see Table S9 and Figure S4).
Whole-brain structural connectivity of nodes with the highest number of aberrant connections in SCD individuals relative to NC. (A-C) Nodes in the blue box (CAU.L, CAU.R, ORBmid.L) were those with the highest number of aberrant connections in SCD individuals relative to NC. The connections displayed are those that connect with the CAU.L, CAU.R, and ORBmid.L. The bar graphs display the mean (standard error) of the age- and gender-corrected nodal efficiency values of (D) CAU.L, (E) ORBmid.L and (F) CAU.R for each group.
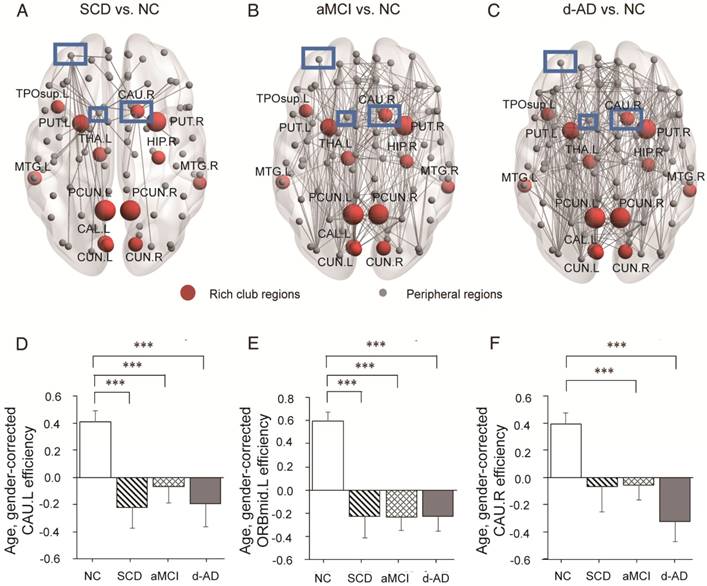
The nodal efficiency of the CAU.L and ORBmid.L followed strikingly similar patterns as the disease progressed (Figure 6D-E): they both showed decreases in all patient groups compared with the levels in the NC and no significant differences among the three patient groups. Significant declines were seen in the local efficiency of CAU.L in the SCD group versus NC (P=0.004), the aMCI group versus NC (P=0.031) and the d-AD group versus NC (P=0.003). Corresponding figures for ORBmid.L showed significant declines in the SCD group versus NC (P<0.001), the aMCI group versus NC (P<0.001) and the d-AD group versus NC (P<0.001). The patterns in the CAU.R were not entirely different from the two regions above (Figure 6F): while no significant group differences were observed between the SCD group and NC, the aMCI (P=0.044) and d-AD (P<0.001) groups showed significantly different declines relative to the NC (see post hoc details in Table S10). These results indicate that rich club regions tend to remain persistent in SCD patients and are disrupted gradually as the disease progresses. However, the peripheral regions are more likely to suffer disruptions, even in preclinical stages.
Behavioral correlation analysis
In aMCI patients, rich club coefficient was significantly positive correlated with AVLT-D performance, after Bonferroni corrections (k=12-16, Table 3). In d-AD patients, rich club coefficient showed a significantly positive association with AVLT-I (k=2), MMSE (k=2,8,9) and MoCA (k=2,8,9, Table 3). These relationships were not observed in NC and SCD groups (Table 3). For normalized rich club coefficient, in NC patients, this metric was significantly negative correlated with AVLT-D performance, after Bonferroni corrections (k=3, Table 4). In addition, in aMCI patients, normalized rich club coefficient showed a significantly negative association with AVLT-D (k=4,5) and MoCA (k=5, Table 4). These relationships were not displayed in SCD and d-AD patients (Table 4).
Partial Pearson's correlations between rich club coefficients and clinical performance. Partial Pearson's correlations controlled for age, gender, and education were used to assess how rich club coefficients related to clinical performance in each group. The bold numbers represent significant correlations at P<0.05 without Bonferroni corrections. The star-labeled numbers represent significant correlations at P<0.05 after Bonferroni corrections for the number of cognitive test variables (AVLT-immediate recall, AVLT-delayed recall, AVLT-recognition, MMSE and MoCA).
| COV: Age & Gender & Education | k | 2 | 3 | 4 | 5 | 6 | 7 | 8 | 9 | 10 | 11 | 12 | 13 | 14 | 15 | 16 | |
|---|---|---|---|---|---|---|---|---|---|---|---|---|---|---|---|---|---|
| NC DF=49 | AVLT-Immediate Recall Scores | r | 0.104 | 0.111 | 0.144 | -0.064 | 0.081 | -0.074 | -0.031 | 0.049 | -0.046 | -0.025 | 0.071 | 0.090 | 0.079 | 0.129 | 0.155 |
| p | 0.233 | 0.219 | 0.157 | 0.327 | 0.286 | 0.304 | 0.414 | 0.366 | 0.374 | 0.430 | 0.309 | 0.265 | 0.290 | 0.184 | 0.139 | ||
| AVLT-Delayed Recall Scores | r | 0.197 | 0.043 | 0.020 | -0.029 | -0.070 | -0.166 | -0.126 | 0.047 | -0.050 | 0.053 | 0.069 | 0.086 | 0.059 | 0.108 | 0.099 | |
| p | 0.083 | 0.381 | 0.443 | 0.419 | 0.313 | 0.122 | 0.190 | 0.373 | 0.363 | 0.356 | 0.314 | 0.275 | 0.342 | 0.225 | 0.245 | ||
| AVLT-Recognition Scores | r | 0.275 | 0.081 | 0.050 | -0.011 | 0.081 | -0.005 | 0.053 | 0.249 | 0.223 | 0.188 | 0.113 | 0.055 | 0.037 | 0.127 | 0.067 | |
| p | 0.025 | 0.287 | 0.365 | 0.470 | 0.287 | 0.486 | 0.355 | 0.039 | 0.058 | 0.093 | 0.215 | 0.350 | 0.397 | 0.188 | 0.321 | ||
| MMSE | r | 0.061 | 0.063 | 0.120 | 0.135 | 0.188 | 0.103 | 0.074 | 0.125 | 0.219 | 0.136 | 0.027 | 0.148 | 0.176 | 0.209 | 0.102 | |
| p | 0.335 | 0.330 | 0.200 | 0.172 | 0.094 | 0.237 | 0.303 | 0.190 | 0.061 | 0.171 | 0.425 | 0.150 | 0.108 | 0.071 | 0.237 | ||
| MoCA | r | 0.019 | 0.052 | 0.138 | 0.224 | 0.245 | 0.226 | 0.194 | 0.264 | 0.280 | 0.187 | 0.126 | 0.203 | 0.243 | 0.215 | 0.142 | |
| p | 0.448 | 0.359 | 0.167 | 0.057 | 0.041 | 0.056 | 0.086 | 0.030 | 0.023 | 0.094 | 0.190 | 0.077 | 0.043 | 0.065 | 0.160 | ||
| SCD DF=39 | AVLT-Immediate Recall Scores | r | 0.109 | 0.164 | 0.262 | 0.266 | 0.246 | 0.217 | 0.077 | 0.101 | 0.001 | -0.091 | 0.023 | 0.081 | 0.050 | 0.115 | 0.079 |
| p | 0.249 | 0.152 | 0.049 | 0.046 | 0.061 | 0.086 | 0.317 | 0.265 | 0.498 | 0.286 | 0.443 | 0.308 | 0.378 | 0.236 | 0.312 | ||
| AVLT-Delayed Recall Scores | r | 0.157 | 0.083 | 0.177 | 0.237 | 0.301 | 0.326 | 0.200 | 0.201 | 0.109 | 0.115 | 0.227 | 0.209 | 0.229 | 0.215 | 0.288 | |
| p | 0.164 | 0.304 | 0.134 | 0.068 | 0.028 | 0.019 | 0.105 | 0.104 | 0.250 | 0.238 | 0.077 | 0.095 | 0.075 | 0.088 | 0.034 | ||
| AVLT-Recognition Scores | r | 0.101 | 0.043 | -0.072 | -0.133 | -0.142 | -0.102 | -0.273 | -0.139 | -0.057 | -0.132 | -0.046 | -0.086 | -0.100 | -0.060 | 0.004 | |
| p | 0.265 | 0.396 | 0.326 | 0.203 | 0.187 | 0.264 | 0.042 | 0.193 | 0.361 | 0.206 | 0.388 | 0.297 | 0.266 | 0.354 | 0.491 | ||
| MMSE | r | 0.146 | -0.009 | -0.017 | 0.027 | -0.011 | -0.061 | -0.088 | -0.126 | -0.092 | -0.068 | -0.005 | 0.032 | -0.001 | -0.034 | 0.106 | |
| p | 0.181 | 0.478 | 0.458 | 0.434 | 0.473 | 0.352 | 0.291 | 0.216 | 0.284 | 0.337 | 0.488 | 0.422 | 0.498 | 0.416 | 0.255 | ||
| MoCA | r | -0.046 | 0.059 | 0.094 | -0.078 | -0.139 | -0.094 | 0.023 | 0.081 | 0.168 | 0.054 | 0.064 | 0.042 | 0.070 | 0.074 | 0.273 | |
| p | 0.387 | 0.356 | 0.280 | 0.313 | 0.194 | 0.279 | 0.444 | 0.308 | 0.146 | 0.369 | 0.346 | 0.397 | 0.332 | 0.324 | 0.042 | ||
| aMCI DF=53 | AVLT-Immediate Recall Scores | r | 0.237 | 0.272 | 0.060 | 0.065 | -0.012 | -0.108 | -0.072 | -0.095 | 0.035 | 0.056 | 0.089 | 0.113 | 0.180 | 0.141 | 0.165 |
| p | 0.041 | 0.022 | 0.332 | 0.318 | 0.465 | 0.217 | 0.300 | 0.245 | 0.401 | 0.343 | 0.260 | 0.206 | 0.095 | 0.151 | 0.114 | ||
| AVLT-Delayed Recall Scores | r | 0.225 | 0.274 | 0.202 | 0.155 | 0.187 | 0.023 | 0.053 | 0.051 | 0.189 | 0.266 | 0.352 | 0.395 | 0.459 | 0.385 | 0.435 | |
| p | 0.049 | 0.021 | 0.069 | 0.129 | 0.086 | 0.432 | 0.350 | 0.357 | 0.083 | 0.025 | 0.004* | 0.001* | 0.000* | 0.001* | 0.000* | ||
| AVLT-Recognition Scores | r | 0.055 | -0.016 | 0.068 | 0.013 | 0.069 | -0.053 | 0.025 | 0.011 | 0.190 | 0.174 | 0.241 | 0.183 | 0.258 | 0.169 | 0.188 | |
| p | 0.344 | 0.453 | 0.312 | 0.462 | 0.309 | 0.350 | 0.429 | 0.468 | 0.082 | 0.101 | 0.038 | 0.091 | 0.029 | 0.109 | 0.085 | ||
| MMSE | r | 0.056 | 0.226 | 0.138 | 0.015 | -0.001 | -0.127 | -0.075 | -0.046 | 0.078 | 0.123 | 0.209 | 0.215 | 0.147 | 0.086 | 0.102 | |
| p | 0.342 | 0.049 | 0.158 | 0.455 | 0.497 | 0.178 | 0.292 | 0.368 | 0.285 | 0.185 | 0.063 | 0.057 | 0.142 | 0.267 | 0.229 | ||
| MoCA | r | 0.193 | 0.261 | 0.120 | 0.027 | 0.104 | -0.012 | 0.093 | -0.023 | 0.040 | 0.154 | 0.258 | 0.257 | 0.261 | 0.195 | 0.269 | |
| p | 0.079 | 0.027 | 0.191 | 0.422 | 0.225 | 0.466 | 0.249 | 0.434 | 0.386 | 0.131 | 0.028 | 0.029 | 0.027 | 0.077 | 0.023 | ||
| d-AD DF=43 | AVLT-Immediate Recall Scores | r | 0.378 | 0.139 | 0.028 | 0.041 | 0.078 | 0.104 | 0.179 | 0.180 | 0.145 | 0.025 | -0.013 | -0.073 | -0.078 | -0.032 | -0.026 |
| p | 0.005* | 0.182 | 0.426 | 0.395 | 0.306 | 0.249 | 0.120 | 0.119 | 0.172 | 0.436 | 0.467 | 0.316 | 0.305 | 0.417 | 0.433 | ||
| AVLT-Delayed Recall Scores | r | 0.286 | 0.060 | -0.046 | -0.115 | -0.053 | 0.099 | 0.077 | 0.099 | 0.015 | 0.020 | -0.075 | -0.129 | -0.107 | -0.108 | 0.002 | |
| p | 0.028 | 0.347 | 0.382 | 0.226 | 0.365 | 0.259 | 0.307 | 0.259 | 0.460 | 0.447 | 0.313 | 0.200 | 0.242 | 0.240 | 0.495 | ||
| AVLT-Recognition Scores | r | 0.176 | -0.009 | 0.040 | 0.024 | 0.038 | 0.088 | 0.055 | 0.118 | 0.120 | 0.079 | -0.005 | -0.078 | -0.053 | -0.074 | -0.004 | |
| p | 0.124 | 0.477 | 0.398 | 0.439 | 0.403 | 0.282 | 0.360 | 0.221 | 0.217 | 0.303 | 0.488 | 0.306 | 0.365 | 0.316 | 0.489 | ||
| MMSE | r | 0.520 | 0.151 | 0.118 | 0.200 | 0.249 | 0.273 | 0.390 | 0.379 | 0.313 | 0.185 | 0.179 | 0.103 | 0.077 | 0.104 | 0.141 | |
| p | 0.000* | 0.162 | 0.221 | 0.094 | 0.050 | 0.035 | 0.004* | 0.005* | 0.018 | 0.112 | 0.120 | 0.250 | 0.307 | 0.248 | 0.177 | ||
| MoCA | r | 0.550 | 0.117 | 0.095 | 0.105 | 0.197 | 0.268 | 0.344 | 0.366 | 0.232 | 0.118 | 0.106 | 0.063 | 0.049 | 0.061 | 0.102 | |
| p | 0.000* | 0.221 | 0.267 | 0.247 | 0.097 | 0.037 | 0.010* | 0.006* | 0.063 | 0.221 | 0.244 | 0.340 | 0.374 | 0.345 | 0.252 | ||
Partial Pearson's correlations between normalized rich club coefficients and clinical performance. Partial Pearson's correlations controlled for age, gender and education were used to assess how normalized rich club coefficients related to clinical performance in each group. The bold numbers represent significant correlations at P<0.05 without Bonferroni corrections. The star-labeled numbers represent significant correlations at P<0.05 after Bonferroni corrections for the number of cognitive test variables (AVLT-immediate recall, AVLT-delayed recall, AVLT-recognition, MMSE and MoCA).
| COV: Age & Gender & Education | k | 2 | 3 | 4 | 5 | 6 | 7 | 8 | 9 | 10 | 11 | 12 | 13 | 14 | 15 | 16 | |
|---|---|---|---|---|---|---|---|---|---|---|---|---|---|---|---|---|---|
| NC DF=49 | AVLT-Immediate Recall Scores | r | -0.104 | -0.227 | -0.070 | 0.043 | 0.087 | 0.156 | 0.139 | 0.109 | 0.049 | 0.089 | 0.048 | 0.074 | -0.001 | -0.018 | -0.017 |
| p | 0.233 | 0.054 | 0.313 | 0.381 | 0.273 | 0.137 | 0.166 | 0.223 | 0.367 | 0.268 | 0.370 | 0.303 | 0.496 | 0.451 | 0.453 | ||
| AVLT-Delayed Recall Scores | r | 0.063 | -0.351 | -0.288 | -0.035 | -0.107 | 0.035 | -0.030 | -0.042 | -0.057 | -0.043 | -0.036 | -0.028 | -0.135 | -0.123 | -0.186 | |
| p | 0.330 | 0.005* | 0.020 | 0.403 | 0.227 | 0.404 | 0.417 | 0.384 | 0.346 | 0.382 | 0.400 | 0.424 | 0.173 | 0.195 | 0.095 | ||
| AVLT-Recognition Scores | r | 0.112 | -0.094 | -0.102 | 0.110 | 0.082 | 0.208 | 0.178 | 0.136 | 0.071 | 0.026 | -0.034 | -0.186 | -0.262 | -0.158 | -0.233 | |
| p | 0.217 | 0.257 | 0.239 | 0.221 | 0.284 | 0.071 | 0.106 | 0.171 | 0.310 | 0.429 | 0.406 | 0.095 | 0.032 | 0.134 | 0.050 | ||
| MMSE | r | 0.063 | -0.111 | -0.007 | -0.038 | 0.053 | 0.150 | 0.038 | -0.058 | -0.103 | -0.052 | -0.089 | 0.057 | -0.019 | -0.035 | -0.161 | |
| p | 0.329 | 0.220 | 0.480 | 0.395 | 0.357 | 0.147 | 0.395 | 0.342 | 0.235 | 0.359 | 0.268 | 0.345 | 0.446 | 0.404 | 0.130 | ||
| MoCA | r | 0.053 | -0.188 | -0.074 | -0.020 | -0.031 | 0.034 | -0.053 | -0.037 | -0.047 | -0.011 | -0.086 | 0.014 | -0.057 | -0.043 | -0.122 | |
| p | 0.355 | 0.093 | 0.304 | 0.445 | 0.414 | 0.405 | 0.357 | 0.399 | 0.370 | 0.469 | 0.275 | 0.461 | 0.346 | 0.383 | 0.197 | ||
| SCD DF=39 | AVLT-Immediate Recall Scores | r | -0.065 | 0.010 | 0.078 | 0.055 | -0.080 | -0.052 | -0.114 | -0.110 | -0.163 | -0.115 | 0.030 | -0.018 | -0.083 | -0.079 | 0.063 |
| p | 0.344 | 0.475 | 0.314 | 0.367 | 0.310 | 0.374 | 0.240 | 0.247 | 0.154 | 0.236 | 0.425 | 0.457 | 0.303 | 0.312 | 0.349 | ||
| AVLT-Delayed Recall Scores | r | 0.105 | -0.051 | -0.186 | -0.183 | -0.222 | -0.197 | -0.194 | -0.062 | -0.185 | -0.203 | -0.035 | -0.027 | 0.056 | -0.019 | 0.080 | |
| p | 0.257 | 0.377 | 0.122 | 0.126 | 0.081 | 0.108 | 0.113 | 0.350 | 0.124 | 0.102 | 0.415 | 0.433 | 0.365 | 0.453 | 0.309 | ||
| AVLT-Recognition Scores | r | 0.049 | 0.176 | -0.036 | -0.160 | -0.132 | -0.106 | -0.121 | -0.098 | -0.146 | -0.154 | -0.171 | -0.266 | -0.236 | -0.280 | -0.189 | |
| p | 0.381 | 0.135 | 0.412 | 0.159 | 0.206 | 0.255 | 0.226 | 0.271 | 0.181 | 0.168 | 0.142 | 0.046 | 0.069 | 0.038 | 0.118 | ||
| MMSE | r | -0.007 | 0.042 | -0.077 | -0.067 | -0.119 | -0.151 | -0.102 | -0.098 | -0.217 | -0.284 | -0.161 | -0.167 | -0.184 | -0.307 | 0.036 | |
| p | 0.482 | 0.398 | 0.315 | 0.338 | 0.230 | 0.173 | 0.264 | 0.272 | 0.087 | 0.036 | 0.158 | 0.148 | 0.125 | 0.026 | 0.412 | ||
| MoCA | r | 0.061 | 0.128 | 0.011 | 0.033 | 0.107 | -0.018 | -0.039 | -0.037 | -0.023 | -0.167 | -0.079 | -0.133 | -0.131 | -0.208 | 0.086 | |
| p | 0.352 | 0.212 | 0.472 | 0.418 | 0.254 | 0.455 | 0.405 | 0.408 | 0.442 | 0.149 | 0.312 | 0.204 | 0.207 | 0.096 | 0.295 | ||
| aMCI DF=53 | AVLT-Immediate Recall Scores | r | -0.151 | -0.134 | -0.269 | -0.238 | -0.159 | -0.009 | -0.031 | -0.126 | -0.108 | -0.161 | -0.094 | -0.035 | 0.031 | -0.014 | -0.030 |
| p | 0.135 | 0.165 | 0.023 | 0.040 | 0.123 | 0.474 | 0.411 | 0.179 | 0.216 | 0.120 | 0.247 | 0.399 | 0.412 | 0.460 | 0.414 | ||
| AVLT-Delayed Recall Scores | r | -0.083 | -0.097 | -0.314 | -0.358 | -0.259 | -0.228 | -0.189 | -0.201 | -0.199 | -0.260 | -0.169 | -0.029 | 0.086 | -0.092 | 0.204 | |
| p | 0.273 | 0.239 | 0.009* | 0.003* | 0.028 | 0.047 | 0.084 | 0.071 | 0.073 | 0.028 | 0.109 | 0.416 | 0.266 | 0.251 | 0.068 | ||
| AVLT-Recognition Scores | r | -0.109 | -0.226 | -0.204 | -0.261 | -0.209 | -0.202 | -0.108 | -0.102 | -0.090 | -0.213 | -0.090 | -0.074 | 0.035 | -0.173 | 0.075 | |
| p | 0.215 | 0.049 | 0.068 | 0.027 | 0.063 | 0.069 | 0.216 | 0.229 | 0.258 | 0.059 | 0.257 | 0.295 | 0.400 | 0.104 | 0.293 | ||
| MMSE | r | 0.050 | -0.157 | -0.136 | -0.173 | -0.236 | -0.142 | -0.217 | -0.043 | -0.027 | -0.019 | 0.091 | 0.115 | 0.029 | -0.031 | -0.050 | |
| p | 0.359 | 0.126 | 0.161 | 0.104 | 0.041 | 0.151 | 0.056 | 0.379 | 0.421 | 0.445 | 0.254 | 0.201 | 0.417 | 0.410 | 0.359 | ||
| MoCA | r | 0.055 | -0.249 | -0.377 | -0.411 | -0.273 | -0.191 | -0.241 | -0.238 | -0.237 | -0.232 | -0.074 | 0.050 | 0.020 | -0.026 | 0.014 | |
| p | 0.345 | 0.034 | 0.002 | 0.001* | 0.022 | 0.082 | 0.038 | 0.040 | 0.041 | 0.044 | 0.295 | 0.358 | 0.442 | 0.426 | 0.460 | ||
| d-AD DF=43 | AVLT-Immediate Recall Scores | r | -0.011 | 0.072 | -0.202 | -0.121 | -0.247 | -0.231 | -0.205 | -0.057 | -0.045 | -0.029 | -0.136 | -0.246 | -0.112 | 0.126 | 0.077 |
| p | 0.471 | 0.319 | 0.091 | 0.214 | 0.051 | 0.063 | 0.088 | 0.356 | 0.385 | 0.424 | 0.186 | 0.052 | 0.231 | 0.205 | 0.308 | ||
| AVLT-Delayed Recall Scores | r | -0.275 | -0.287 | -0.104 | -0.004 | -0.093 | -0.050 | -0.141 | -0.104 | -0.131 | -0.010 | -0.147 | -0.164 | -0.040 | 0.169 | 0.073 | |
| p | 0.034 | 0.028 | 0.248 | 0.490 | 0.271 | 0.371 | 0.177 | 0.249 | 0.196 | 0.473 | 0.168 | 0.141 | 0.397 | 0.134 | 0.317 | ||
| AVLT-Recognition Scores | r | -0.239 | -0.240 | -0.023 | -0.170 | -0.229 | -0.183 | -0.235 | -0.180 | -0.121 | -0.161 | -0.241 | -0.271 | -0.194 | 0.224 | 0.206 | |
| p | 0.057 | 0.056 | 0.440 | 0.131 | 0.065 | 0.114 | 0.060 | 0.119 | 0.214 | 0.146 | 0.056 | 0.036 | 0.100 | 0.070 | 0.087 | ||
| MMSE | r | 0.032 | 0.072 | -0.130 | -0.142 | -0.221 | -0.263 | -0.280 | -0.115 | -0.121 | -0.192 | -0.167 | -0.255 | -0.046 | 0.025 | 0.074 | |
| p | 0.416 | 0.320 | 0.197 | 0.176 | 0.072 | 0.040 | 0.031 | 0.226 | 0.214 | 0.103 | 0.137 | 0.046 | 0.382 | 0.436 | 0.314 | ||
| MoCA | r | -0.019 | 0.007 | -0.068 | -0.093 | -0.196 | -0.217 | -0.271 | -0.129 | -0.175 | -0.207 | -0.177 | -0.199 | -0.049 | 0.019 | 0.046 | |
| p | 0.450 | 0.483 | 0.329 | 0.272 | 0.099 | 0.076 | 0.036 | 0.199 | 0.125 | 0.086 | 0.122 | 0.095 | 0.374 | 0.451 | 0.382 | ||
In SCD patients, the AVLT-D performance was significantly positively correlated with feeder connectivity strength after Bonferroni corrections: those people who showed poorer memory performance tended to suffer from a greater disruption of feeder connections involving peripheral regions (r=0.362). Similar results were also found in aMCI patients (r=0.442). This relationship seen in SCD and aMCI patients was not displayed by NC or d-AD patients (Figure 3D-G and Table S11).
After Bonferroni corrections, in aMCI patients, the AVLT-D performance was significantly negatively correlated with normalized clustering coefficient (r=-0.391). Similar association was also between MoCA and normalized characteristic path length (r=-0.360). This relationship was not displayed by NC, SCD and d-AD patients (Table 5).
Partial Pearson's correlations between network topological metrics and clinical performance. Partial Pearson's correlations controlled for age, gender, and education were used to assess how network topological metrics related to clinical performance in each group. The bold numbers represent significant correlations at P<0.05 without Bonferroni corrections. The star-labeled numbers represent significant correlations at P<0.05 after Bonferroni corrections for the number of cognitive test variables (AVLT-immediate recall, AVLT-delayed recall, AVLT-recognition, MMSE and MoCA).
| COV: Gender & Age & Education | Strength | Clustering Coefficient | Normalized Clustering Coefficient | Characteristic Path Length | Normalized Characteristic Path Length | ||
|---|---|---|---|---|---|---|---|
| NC DF=49 | AVLT-Immediate Recall Scores | r | 0.090 | 0.019 | -0.083 | -0.119 | 0.052 |
| p | 0.264 | 0.448 | 0.282 | 0.203 | 0.358 | ||
| AVLT-Delayed Recall Scores | r | 0.015 | 0.207 | 0.076 | -0.020 | 0.162 | |
| p | 0.459 | 0.072 | 0.299 | 0.443 | 0.128 | ||
| AVLT-Recognition Scores | r | 0.143 | 0.093 | -0.096 | -0.119 | 0.117 | |
| p | 0.159 | 0.259 | 0.252 | 0.203 | 0.206 | ||
| MMSE | r | 0.154 | 0.050 | -0.068 | -0.181 | -0.104 | |
| p | 0.141 | 0.363 | 0.317 | 0.102 | 0.234 | ||
| MoCA | r | 0.205 | 0.162 | -0.130 | -0.156 | -0.057 | |
| p | 0.074 | 0.127 | 0.181 | 0.137 | 0.347 | ||
| SCD DF=39 | AVLT-Immediate Recall Scores | r | 0.156 | 0.111 | -0.294 | -0.086 | 0.079 |
| p | 0.164 | 0.245 | 0.031 | 0.297 | 0.313 | ||
| AVLT-Delayed Recall Scores | r | 0.305 | 0.050 | -0.232 | -0.297 | -0.119 | |
| p | 0.026 | 0.378 | 0.072 | 0.030 | 0.230 | ||
| AVLT-Recognition Scores | r | 0.025 | 0.105 | -0.091 | 0.009 | 0.145 | |
| p | 0.438 | 0.256 | 0.286 | 0.478 | 0.183 | ||
| MMSE | r | 0.002 | 0.252 | -0.113 | -0.031 | -0.182 | |
| p | 0.495 | 0.056 | 0.242 | 0.425 | 0.127 | ||
| MoCA | r | 0.045 | 0.034 | -0.210 | -0.073 | -0.022 | |
| p | 0.389 | 0.417 | 0.094 | 0.325 | 0.446 | ||
| aMCI DF=53 | AVLT-Immediate Recall Scores | r | 0.119 | 0.172 | -0.171 | -0.024 | -0.101 |
| p | 0.193 | 0.105 | 0.106 | 0.431 | 0.232 | ||
| AVLT-Delayed Recall Scores | r | 0.304 | 0.294 | -0.391 | -0.218 | -0.170 | |
| p | 0.012 | 0.015 | 0.001* | 0.055 | 0.107 | ||
| AVLT-Recognition Scores | r | 0.117 | 0.294 | -0.276 | -0.047 | -0.249 | |
| p | 0.197 | 0.015 | 0.021 | 0.367 | 0.033 | ||
| MMSE | r | 0.079 | 0.196 | -0.086 | -0.018 | -0.202 | |
| p | 0.282 | 0.075 | 0.267 | 0.450 | 0.070 | ||
| MoCA | r | 0.203 | 0.263 | -0.189 | -0.119 | -0.360 | |
| p | 0.068 | 0.026 | 0.084 | 0.193 | 0.003* | ||
| d-AD DF=43 | AVLT-Immediate Recall Scores | r | 0.060 | -0.121 | -0.270 | 0.010 | -0.133 |
| p | 0.347 | 0.213 | 0.036 | 0.473 | 0.192 | ||
| AVLT-Delayed Recall Scores | r | 0.060 | -0.009 | 0.040 | -0.055 | -0.102 | |
| p | 0.348 | 0.477 | 0.398 | 0.360 | 0.252 | ||
| AVLT-Recognition Scores | r | 0.219 | 0.105 | -0.090 | -0.253 | -0.103 | |
| p | 0.074 | 0.247 | 0.278 | 0.047 | 0.251 | ||
| MMSE | r | 0.274 | 0.149 | -0.213 | -0.207 | -0.075 | |
| p | 0.034 | 0.164 | 0.080 | 0.086 | 0.313 | ||
| MoCA | r | 0.172 | -0.007 | -0.209 | -0.123 | -0.107 | |
| p | 0.129 | 0.483 | 0.084 | 0.211 | 0.243 | ||
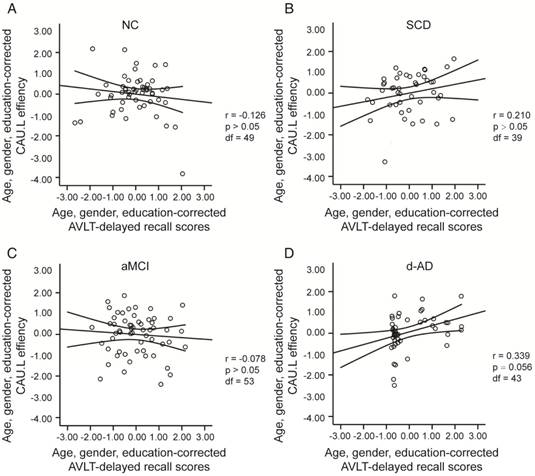
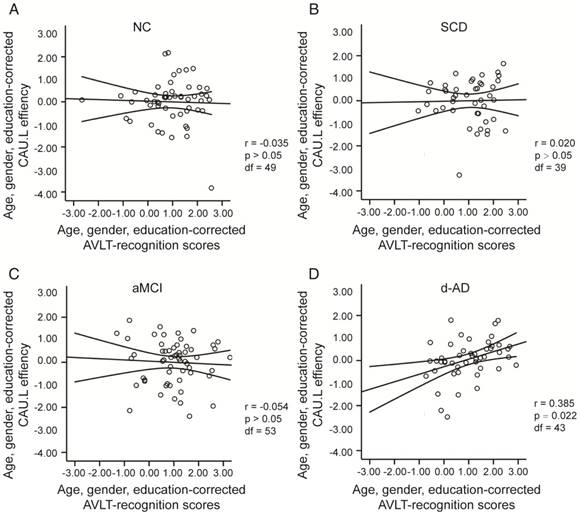
To assess the relationships between network metrics and behavioral performance, we only examined the nodes (CAU.L and ORBmid.L) that had the most abnormal connectivity in SCD patients and showed significant group differences compared with that in NC. In d-AD patients, the CAU.L efficiency values showed a significant association with AVLT-D (r=0.339, Figure 7) and AVLT-R (r=0.385, Figure 8), meaning that the patients who showed the greatest reduction in nodal efficiency in peripheral nodes tended to show the worst memory performance. This relationship was not displayed by NC, SCD patients or aMCI patients. There were no significant correlations between the nodal efficiency of the ORBmid.L and any clinical variables in any individual group (Table S12).
The scatter plots illustrate the significant associations between CAU.L nodal efficiency and AVLT-delayed recall scores controlled for age, gender and education after Bonferroni corrections for the number of cognitive test variables in (A) NC, (B) SCD, (C) aMCI, (D) d-AD groups. The solid lines show the best-fitting linear regression line and the 95% confidence intervals.
The scatter plots illustrate the significant associations between CAU.L nodal efficiency and AVLT-recognition scores controlled for age, gender and education after Bonferroni corrections for the number of cognitive test variables in (A) NC, (B) SCD, (C) aMCI, (D) d-AD groups. The solid lines show the best-fitting linear regression line and the 95% confidence intervals.
Age-matched dataset
Neuropsychological testing
A total of 59 NC, 42 SCD patients, 47 aMCI patients, and 35 d-AD patients were included in an age-matched dataset. Table S13 summarizes the demographic characteristics and neuropsychological performance of the four groups. No significant group differences were found in age, gender, or education (P>0.05 for all). Group differences (ANCOVA; education covariates) were found for all cognitive variables (Table S13). The d-AD and aMCI groups performed significantly worse than the NC and SCD groups on all tasks. The best memory performance was in NC, an intermediate performance was seen in SCD patients, a worse performance in aMCI patients, and the worst performance in d-AD patients (see Table S14 in post hoc details).
The rich club analysis and network topological metrics results were similar to those of the non-age-matched dataset (see results in Supplementary Material)
Discussion
Rich club organization is a property common to complex networks [47] and is hypothesized to be a basis for efficient global information transfer and complex neurological function in the brain [51, 57]. Rich club regions efficiently integrate information between peripheral brain regions and engage in various behavioral and cognitive tasks [58, 59]. The rich club phenomenon has been found not only in the adult brain also in the newborn human brain [57]. A rich club network of densely connected brain hubs was established in all groups that involved the parietal, occipital, and temporal cortices, thalamus and basal ganglia. It has been demonstrated that the precuneus as well as important subcortical regions including the hippocampus, thalamus, and putamen form a rich club network. All midline cortical rich club nodes (i.e., bilateral precuneus, superior frontal, superior parietal) are connector hubs, playing an important role in between-module connectivity, while subcortical rich club regions (bilateral thalamus, putamen) play an important role in module structure [18, 60-62].
Rich club organization may provide a new perspective on how AD affects brain topology and function. The main finding of this study was a relatively resistant rich club connectivity in SCD patients that was affected in aMCI and d-AD patients. Peripheral region connectivity was significantly affected in all patient groups. Another main observation was that the brain regions with the most aberrant connections involving peripheral and rich club regions in aMCI patients compared with NC were distributed throughout the whole brain (frontal, parietal, occipital, temporal, cingulate and insula). Similar and additional regions were distributed throughout the whole brain, especially frontal regions, in d-AD patients.
An increasing normalized rich club coefficient (Ønorm) greater than 1 over a range of degrees (k) reflects the existence of a rich club organization in brain networks [18, 26, 39]. So far, as to our literature research, only Daianu's research group assessed the rich club coefficient in DTI networks in AD. Consistent with Daianu's research, the Ønorm increased in patient groups, mostly in the low-degree regime (k<15) [26]. This finding indicates that connections that link rich club regions remain resistant to disruptions in the total amount of the strongest connections they could share, which may connect to peripheral regions in patients; this finding suggests a distinctive pattern of disruptions where brain connectivity is targeted globally and concentrated in more peripheral regions rather than the central core of the network in d-AD patients. This pattern is less pronounced in aMCI and SCD patients. The highly connected core was relatively preserved, which offers new evidence of the neural basis of the progressive risk for cognitive decline. Specifically, the mechanisms of AD onset and progression may be different from those of schizophrenia and Huntington's disease, in which the selective vulnerability of rich club regions and a decreased Ønorm were found, especially in the high-degree regime (i.e., schizophrenia: rich club range k=16 to k=28) [39, 56].
We found that two affected peripheral regions (CAU.L and ORBmid.L) that were showed the most aberrant connections in SCD patients relative to NC. In addition, rich club regions remained stable in SCD patients, consistent with previous findings [28]. Functional MRI research has found that SCD patients exhibit higher amplitude of low-frequency fluctuations (ALFF) values than NC in peripheral regions such as parietal, occipital and temporal lobes, and these values are negatively correlated with memory task performance [28]. This finding is consistent with our results and further demonstrate that our results are reasonable and credible. In addition, previous research has found localized WM alterations in the corpus callosum, anterior corona radiata and bilateral superior longitudinal fasciculus in SCD patients, similar to the alterations seen in aMCI and d-AD patients; these alterations defined the structural connections involving peripheral regions in our analysis [11]. These findings converged to the notion that AD-related patients all present widespread aberrant connections involving peripheral regions, which may contribute to the early memory declines they experience.
The CAU is related to learning and working memory, involved in the integration of various sources of information as well as instructions, and involved in the coordination of the transmission of information among cortical regions when no established pathways exist [63, 64]. The CAU atrophies progressively in patients with AD, and the bilateral CAU are affected and atrophied in both aMCI and d-AD patients [65-67]. Amyloid and tau deposit accumulations have been demonstrated in the CAU in d-AD patients, which could lead to deficits in executive control and cognitive processing speed [68, 69]. Combining this information, we can conclude that the connections linked to the CAU are already disturbed in SCD patients before obvious symptoms appear. In this study, the CAU.R was identified as rich club region, while the CAU.L was classified as a peripheral region. It has been reported that the CAU.R possess a larger volume, higher neuronal density and more connections than the CAU.L [70, 71]. The atrophy of the CAU.R has been correlated with cerebrospinal fluid tau concentrations, cognitive behavior, and the conversion from MCI to d-AD [66]. ORBmid.L was found to be abnormal in all patient groups, and this region is involved in the multimodal processing of complex cognitive functions such as imagery, associations, memory and novelty [72]. The three selected regions showed relationships with cognitive performance in the patient groups. Although cognitive changes in SCD patients are subtle and often not clinically significant, potential deterioration in these regions may be present before diagnosis.
Previous studies have found the selective vulnerability of rich club regions involving the parietal, cingulate and frontal lobes in patients with aMCI and d-AD [28, 54, 73]. One of the rich club regions, PCUN, which is a posterior element of the default mode network (DMN) that is consistently associated with the successful recollection of previously studied items, was affected in aMCI and d-AD patients but remained consistent in SCD patients [74]. Previous studies have found that AD is associated with cognitive dysfunction in domains linked to the DMN [20, 75], which are disrupted early, even in the preclinical stage, as the disease progresses [76]. The DMN is implicated in various 'high-level' cognitive processes [20]. Memory systems may be preferentially affected by AD because these systems play a central role in resting brain activity as part of the DMN [75].
Previous graph theory studies found a decrease of strength and an increase of characteristic path length in preclinical AD, which was consistent with our results [25, 77]. In addition, in line with MCI and AD DTI network studies, there is a decrease in clustering coefficient [78]. In the behavioral correlation analysis, rich club coefficient, normalized club coefficient and network topological metrics did not provide sufficient evidence to illustrate the relationship between disrupted brain connectome and clinical performance in SCD. In contrast, this study demonstrated that dividing the connections into rich club, feeder and local connections helps reveal the association between cognitive function decline and different classes of connections in SCD. Rich club organization is associated with cognitive performance [79], and its disruptions have a significant impact on cognition. Abnormal feeder connectivity strength was correlated with decreased AVLT-D scores in SCD and aMCI patients. The delayed recall test best discriminates early stages of AD and predicts the conversion to d-AD [11, 80]. Although we observed significant differences between SCD patients and NC in AVLT-D and AVLT-I scores, the performance of SCD patients on the AVLT was still within the normal range adjusted for age and gender [29, 31]. The relatively stable rich club organization may contribute to the normal performance of SCD patients on this test. The biomarker model that relates disease stage to AD suggests that synaptic dysfunction and brain structural losses occur earlier than the decline of clinical performance. Therefore, neuroimaging methods are more sensitive than traditional neuropsychological tests in detecting the early changes and abnormity of brains in the early stages of AD.
Combining these results and previous studies, we propose that rich club organization disturbances dynamically and potently interrupt communication among peripheral and rich club regions of the brain in patients with AD. In the preclinical stage (SCD), peripheral regions are originally disrupted, while rich club regions are relatively preserved. This perturbation gradually extends to rich club regions in the prodromal (aMCI) and dementia stage (d-AD) and becomes more severe. The persistence of the rich club organization may help explain why the brain has a buffer or reserve capacity to withstand a certain degree of change brought about by aging and disease [81]. A loss of connectivity involving peripheral regions (feeder and local connections) followed by rich club regions (feeder and rich club connections) may contribute to the breakdown of global scale network organization. As the disease progresses, rich club regions become involved, and the brain network is damaged more severely, making clinical symptoms evident and visible. In conclusion, AD may be a disorder best characterized by overall, or global, underlying changes in connectivity, not the selective vulnerability of rich club regions and connections. The stable rich club connections help to maintain the core organization of the brain when some rich club regions suffer from disruptions [18].
Stam has proposed a scenario of hub overload and failure that is consistent with our findings. He proposed that hub overload is a final common pathway in brain networks with multilayered hierarchical structures [82]. In the SCD phase, peripheral regions are initially affected due to their reduced resistance and lower level in the hierarchical network, and then they redirect their input to higher-up nodes. Nodes at higher hierarchy levels thus load more traffic. As the disease propagates, this abnormal rerouting becomes severe and sustained, and hub nodes may also be affected, resulting in a diminished capacity to handle traffic [82].
Although results were corrected for age and gender, there was an almost 10-year difference between NC and AD patients, so this paper also used an age-matched sample for the SCD, aMCI and AD groups. These results followed a similar pattern as those of the non-age-matched dataset, suggesting that age is not a factor leading to AD progression.
The diagnoses of SCD, aMCI and AD were based on clinical criteria without any pathological or amyloid imaging data. Although we did not collect amyloid data in this study, other research has found using amyloid data that there are affected peripheral and rich club regions in patients with early-onset AD, which corresponds with our results [50]. We plan to re-test aMCI and SCD patients at follow-up to check for conversion to AD or aMCI or stability over the next several years.
The disruption pattern may shed light on how AD progresses and affects brain function. Peripheral regions and connections were abnormal earlier than rich club regions and connections. As these results mirror the gradual progression of AD, we suggest that this disrupted rich club organization pattern could be used to investigate prevention and treatment strategies for early AD patients. Moreover, this study aids in the development of more efficient therapies and diagnostic tools for this very early stage of AD.
Abbreviations
ALFF: amplitude of low-frequency fluctuations; AD: Alzheimer's disease; aMCI: amnestic mild cognitive decline; AVLT: auditory verbal learning test; AVLT-I: AVLT-immediate recall; AVLT-D: AVLT-delayed recall; AVLT-R: AVLT-recognition; AAL atlas: automated anatomical labeling atlas; ADL: activities of daily living assessment; CDR: clinical dementia rating scale; CAL: calcarine fissure and surrounding cortex; CUN: cuneus; CAU: caudate nucleus; d-AD: AD dementia; DTI: diffusion tensor imaging; DWIs: diffusion weighted images; DMN: default mode network; FOV: field of view; FACT: fiber assignment by continuous tracking; FA: fractional anisotropy; FABIRC: FA based inter-regional connection; HAMD: Hamilton depression rating Scale; HIP: hippocampus; PCUN: precuneus; PUT: lenticular nucleus, putamen; MMSE: mini-mental state examination; MRI: magnetic resonance imaging; MoCA: Montreal cognitive assessment; MPRAGE: magnetization-prepared rapid gradient echo; NC: normal control; MTG: middle temporal gyrus; MTG: middle temporal gyrus; ORBmid: middle frontal gyrus, orbital part; SCD: subjective cognitive decline; SCD-I: subjective cognitive decline initiative; THA: thalamus; TPOsup: temporal pole: superior temporal gyrus; WM: white matter.
Supplementary Material
Supplementary figures and tables.
Acknowledgements
This work was supported by the National Key Research and Development Program of China under grant 2017YFB1002504, the National Natural Science Foundation of China (Grant No. 81671776, 61633018, 61727807), the Beijing Municipal Science & Technology Commission (Z131100006813022, PXM2017_026283_000002), the Beijing Nova Program (Grant No. Z171100001117057).
Competing Interests
The authors have declared that no competing interest exists.
References
1. Jessen F, Amariglio RE, van Boxtel M, Breteler M, Ceccaldi M, Chetelat G. et al. A conceptual framework for research on subjective cognitive decline in preclinical Alzheimer's disease. Alzheimers Dement. 2014;10:844-52
2. Buckley RF, Maruff P, Ames D, Bourgeat P, Martins RN, Masters CL. et al. Subjective memory decline predicts greater rates of clinical progression in preclinical Alzheimer's disease. Alzheimers Dement. 2016;12(7):796-804
3. Mitchell AJ, Beaumont H, Ferguson D, Yadegarfar M, Stubbs B. Risk of dementia and mild cognitive impairment in older people with subjective memory complaints: meta-analysis. Acta Psychiatr Scand. 2014;130:439-51
4. Rönnlund M, Sundström A, Rolf Adolfsson MD, Nilsson LG. Self-Reported Memory Failures: Associations with Future Dementia in a Population-Based Study with Long-Term Follow-Up. J Am Geriatr Soc. 2015;63:1766-73
5. Li XY, Tang ZC, Sun Y, Tian J, Liu ZY, Han Y. White matter degeneration in subjective cognitive decline: a diffusion tensor imaging study. Oncotarget. 2016;7:54405-14
6. Wang Y, West JD, Flashman LA, Wishart HA, Santulli RB, Rabin LA. et al. Selective changes in white matter integrity in MCI and older adults with cognitive complaints. Biochim Biophys Acta. 2012;1822:423-30
7. Cantero JL, Iglesias JE, Van Leemput K, Atienza M. Regional Hippocampal Atrophy and Higher Levels of Plasma Amyloid-Beta Are Associated With Subjective Memory Complaints in Nondemented Elderly Subjects. J Gerontol A Biol Sci Med Sci. 2016;71:1210-5
8. Meiberth D, Scheef L, Wolfsgruber S, Boecker H, Block W, Traber F. et al. Cortical thinning in individuals with subjective memory impairment. J Alzheimers Dis. 2015;45:139-46
9. Snitz BE, Lopez OL, McDade E, Becker JT, Cohen AD, Price JC. et al. Amyloid-beta Imaging in Older Adults Presenting to a Memory Clinic with Subjective Cognitive Decline: A Pilot Study. J Alzheimers Dis. 2015;48(Suppl 1):S151-9
10. Amariglio RE, Becker JA, Carmasin J, Wadsworth LP, Lorius N, Sullivan C. et al. Subjective cognitive complaints and amyloid burden in cognitively normal older individuals. Neuropsychologia. 2012;50:2880-6
11. Sun Y, Dai ZJ, Li YX, Sheng C, Li HY, Wang XN. et al. Subjective Cognitive Decline: Mapping Functional and Structural Brain Changes-A Combined Resting-State Functional and Structural MR Imaging Study. Radiology. 2016;281:185-92
12. Hafkemeijer A, Altmann-Schneider I, Oleksik AM, van de Wiel L, Middelkoop HA, van Buchem MA. et al. Increased functional connectivity and brain atrophy in elderly with subjective memory complaints. Brain Connect. 2013;3:353-62
13. Scheef L, Spottke A, Daerr M, Joe A, Striepens N, Kolsch H. et al. Glucose metabolism, gray matter structure, and memory decline in subjective memory impairment. Neurology. 2012;79:1332-9
14. Song IU, Choi EK, Oh JK, Chung YA, Chung SW. Alteration patterns of brain glucose metabolism: comparisons of healthy controls, subjective memory impairment and mild cognitive impairment. Acta Radiol. 2016;57:90-7
15. Jeong HS, Park JS, Song IU, Chung YA, Rhie SJ. Changes in cognitive function and brain glucose metabolism in elderly women with subjective memory impairment: a 24-month prospective pilot study. Acta Neurol Scand. 2017;135:108-14
16. Reid AT, Evans AC. Structural networks in Alzheimer's disease. Eur Neuropsychopharmacol. 2013;23:63-77
17. Jones DT, Knopman DS, Gunter JL, Graff-Radford J, Vemuri P, Boeve BF. et al. Cascading network failure across the Alzheimer's disease spectrum. Brain. 2016;139:547-62
18. van den Heuvel MP, Sporns O. Rich-Club Organization of the Human Connectome. J Neurosci. 2011;31:15775-86
19. Zamora-Lopez G, Zhou C, Kurths J. Cortical hubs form a module for multisensory integration on top of the hierarchy of cortical networks. Front Neuroinform. 2010;4:1-13
20. Power JD, Schlaggar BL, Lessov-Schlaggar CN, Petersen SE. Evidence for hubs in human functional brain networks. Neuron. 2013;79:798-813
21. Crossley NA, Mechelli A, Scott J, Carletti F, Fox PT, McGuire P. et al. The hubs of the human connectome are generally implicated in the anatomy of brain disorders. Brain. 2014;137:2382-95
22. Buckner RL, Sepulcre J, Talukdar T, Krienen FM, Liu H, Hedden T. et al. Cortical hubs revealed by intrinsic functional connectivity: mapping, assessment of stability, and relation to Alzheimer's disease. J Neurosci. 2009;29:1860-73
23. Dai Z, Yan C, Li K, Wang Z, Wang J, Cao M. et al. Identifying and Mapping Connectivity Patterns of Brain Network Hubs in Alzheimer's Disease. Cereb Cortex. 2015;25:3723-42
24. Brier MR, Thomas JB, Fagan AM, Hassenstab J, Holtzman DM, Benzinger TL. et al. Functional connectivity and graph theory in preclinical Alzheimer's disease. Neurobiol Aging. 2014;35:757-68
25. Shu N, Wang XN, Bi QH, Zhao TD, Han Y. Disrupted Topologic Efficiency of White Matter Structural Connectome in Individuals with Subjective Cognitive Decline. Radiology. 2018;286:229-38
26. Daianu M, Jahanshad N, Nir TM Jr. Jack CR, Weiner MW, Bernstein MA, et al. Rich club analysis in the Alzheimer's disease connectome reveals a relatively undisturbed structural core network. Hum Brain Mapp. 2015;36:3087-103
27. Zhao T, Sheng C, Bi Q, Niu W, Shu N, Han Y. Age-related differences in the topological efficiency of the brain structural connectome in amnestic mild cognitive impairment. Neurobiol Aging. 2017;59:144-55
28. Wang XN, Zeng Y, Chen GQ, Zhang YH, Li XY, Hao XY. et al. Abnormal organization of white matter networks in patients with subjective cognitive decline and mild cognitive impairment. Oncotarget. 2016;7:48953-62
29. Lu J, Li D, Li F, Zhou A, Wang F, Zuo X. et al. Montreal cognitive assessment in detecting cognitive impairment in Chinese elderly individuals: a population-based study. J Geriatr Psychiatry Neurol. 2011;24:184-90
30. Morris JC. The Clinical Dementia Rating (CDR): current version and scoring rules. Neurology. 1993;43:2412-4
31. Guo QH, Sun YM, Pei-Min YU, Hong Z. Norm of Auditory Verbal Learning Test in the Normal Aged in China Community. Chinese Journal of Clinical Psychology. 2007;15(2):132-134
32. Hamilton M. A rating scale for depression. J Neurol Neurosurg Psychiatry. 1960;23:56-62
33. Dozeman E, van Schaik DJ, van Marwijk HW, Stek ML, van der Horst HE, Beekman AT. The center for epidemiological studies depression scale (CES-D) is an adequate screening instrument for depressive and anxiety disorders in a very old population living in residential homes. Int J Geriatr Psychiatry. 2011;26:239-46
34. McKhann G, Drachman D, Folstein M, Katzman R, Price D, Stadlan EM. Clinical diagnosis of Alzheimer's disease: report of the NINCDS-ADRDA Work Group under the auspices of Department of Health and Human Services Task Force on Alzheimer's Disease. Neurology. 1984;34:939-44
35. McKhann GM, Knopman DS, Chertkow H, Hyman BT, Jack CR Jr, Kawas CH. et al. The diagnosis of dementia due to Alzheimer's disease: recommendations from the National Institute on Aging-Alzheimer's Association workgroups on diagnostic guidelines for Alzheimer's disease. Alzheimers Dement. 2011;7:263-9
36. Cui Z, Zhong S, Xu P, He Y, Gong G. PANDA: a pipeline toolbox for analyzing brain diffusion images. Front Hum Neurosci. 2013;7:42
37. Mori S, van Zijl PCM. Fiber tracking: principles and strategies - a technical review. Nmr Biomed. 2002;15:468-80
38. Mori S, Crain BJ, Chacko VP, van Zijl PCM. Three-dimensional tracking of axonal projections in the brain by magnetic resonance imaging. Ann Neurol. 1999;45:265-9
39. van den Heuvel MP, Sporns O, Collin G, Scheewe T, Mandl RCW, Cahn W. et al. Abnormal Rich Club Organization and Functional Brain Dynamics in Schizophrenia. JAMA Psychiatry. 2013;70:783-92
40. Beaulieu C. The basis of anisotropic water diffusion in the nervous system - a technical review. Nmr Biomed. 2002;15:435-55
41. Verstraete E, van den Heuvel MP, Veldink JH, Blanken N, Mandl RC, Hulshoff Pol HE. et al. Motor network degeneration in amyotrophic lateral sclerosis: a structural and functional connectivity study. PloS one. 2010;5:e13664
42. Kubicki M, Park H, Westin CF. et al. DTI and MTR abnormalities in schizophrenia: analysis of white matter integrity. Neuroimage. 2005;26(4):1109-1118
43. Ewing-Cobbs L, Hasan KM, Prasad MR, Kramer L, Bachevalier J. Corpus callosum diffusion anisotropy correlates with neuropsychological outcomes in twins disconcordant for traumatic brain injury. AJNR Am J Neuroradiol. 2006;27:879-81
44. Gold BT, Powell DK, Xuan L, Jiang Y, Hardy PA. Speed of lexical decision correlates with diffusion anisotropy in left parietal and frontal white matter: Evidence from diffusion tensor imaging. Neuropsychologia. 2007;45:2439-46
45. Gong GL, He Y, Concha L, Lebel C, Gross DW, Evans AC. et al. Mapping Anatomical Connectivity Patterns of Human Cerebral Cortex Using In Vivo Diffusion Tensor Imaging Tractography. Cereb Cortex. 2009;19:524-36
46. Wang J, Wang X, Xia M, Liao X, Evans A, He Y. GRETNA: a graph theoretical network analysis toolbox for imaging connectomics. Front Hum Neurosci. 2015;9:386
47. Colizza V, Flammini A, Serrano MA, Vespignani A. Detecting rich-club ordering in complex networks. Nat Phys. 2006;2:110-5
48. Rubinov M, Sporns O. Complex network measures of brain connectivity: Uses and interpretations. Neuroimage. 2010;52:1059-69
49. Rubinov M, Sporns O. Weight-conserving characterization of complex functional brain networks. Neuroimage. 2011;56:2068-79
50. Daianu M, Mezher A, Mendez MF, Jahanshad N, Jimenez EE, Thompson PM. Disrupted rich club network in behavioral variant frontotemporal dementia and early-onset Alzheimer's disease. Hum Brain Mapp. 2016;37:868-83
51. van den Heuvel MP, Kahn RS, Goni J, Sporns O. High-cost, high-capacity backbone for global brain communication. Proc Natl Acad Sci U S A. 2012;109:11372-7
52. Bullmore ET, Sporns O. Complex brain networks: graph theoretical analysis of structural and functional systems. Nat Rev Neurosci. 2009;10:186-98
53. Latora V, Marchiori M. Efficient behavior of small-world networks. Phys Rev Lett. 2001;87:198701
54. Lo CY, Wang PN, Chou KH, Wang JH, He Y, Lin CP. Diffusion Tensor Tractography Reveals Abnormal Topological Organization in Structural Cortical Networks in Alzheimer's Disease. J Neurosci. 2010;30:16876-85
55. Xia M, Wang J, He Y. BrainNet Viewer: a network visualization tool for human brain connectomics. PloS one. 2013;8:e68910
56. Harrington DL, Rubinov M, Durgerian S, Lyla M, Reece C, Koenig K. et al. Network topology and functional connectivity disturbances precede the onset of Huntington's disease. Brain. 2015;138:3327-44
57. Ball G, Aljabar P, Zebari S, Tusor N, Arichi T, Merchant N. et al. Rich-club organization of the newborn human brain. Proc Natl Acad Sci U S A. 2014;111:7456-61
58. Kaiser M, Varier S. Evolution and development of brain networks: from Caenorhabditis elegans to Homo sapiens. Network. 2011;22:143-7
59. Mp VDH, Stam CJ, Kahn RS, Hulshoff Pol HE. Efficiency of functional brain networks and intellectual performance. J Neurosci. 2009;29:7619-24
60. Sporns O. The human connectome: a complex network. Ann N Y Acad Sci. 2011;1224:109-25
61. Hagmann P, Cammoun L, Gigandet X, Meuli R, Honey CJ, Wedeen V. et al. Mapping the structural core of human cerebral cortex. PloS Biol. 2008;6:1479-93
62. van den Heuvel MP, Mandl RCW, Stam CJ, Kahn RS, Pol HEH. Aberrant Frontal and Temporal Complex Network Structure in Schizophrenia: A Graph Theoretical Analysis. J Neurosci. 2010;30:15915-26
63. Levitt JJ, Mccarley RW, Dickey CC, Voglmaier MM, Niznikiewicz MA, Seidman LJ. et al. MRI study of caudate nucleus volume and its cognitive correlates in neuroleptic-naive patients with schizotypal personality disorder. Am J Psychiatry. 2002;159:1190-7
64. Stocco A, Lebiere C. Distinct contributions of the caudate nucleus, rostral prefrontal cortex, and parietal cortex to the execution of instructed tasks. Cogn Affect Behav Neurosci. 2012;12:611-28
65. Kazui H, Takahashi R, Yamamoto Y, Yoshiyama K, Kanemoto H, Suzuki Y. et al. Neural Basis of Apathy in Patients with Amnestic Mild Cognitive Impairment. J Alzheimers Dis. 2016:1-14
66. Madsen SK, Ho AJ, Xue H, Saharan PS, Toga AW Jr CRJ. et al. 3D maps localize caudate nucleus atrophy in 400 AD, MCI, and healthy elderly subjects. Neurobiol Aging. 2010;31:1312-25
67. Duan HQ, Jiang JH, Xu J, Zhou HC, Huang ZM, Yu ZH. et al. Differences in A beta brain networks in Alzheimer's disease and healthy controls. Brain Res. 2017;1655:77-89
68. Braak H, Braak E. Alzheimer's disease: striatal amyloid deposits and neurofibrillary changes. J Neuropathol Exp Neurol. 1990;49:215-24
69. Rubin DC. Frontal-Striatal Circuits in Cognitive Aging: Evidence for Caudate Involvement. Aging Neuropsychol Cogn. 1999;6:241-59
70. Yamashita K, Yoshiura T, Hiwatashi A, Noguchi T, Togao O, Takayama Y. et al. Volumetric asymmetry and differential aging effect of the human caudate nucleus in normal individuals: a prospective MR imaging study. J Neuroimaging. 2011;21:34-7
71. Fabiano AJ, Horsfield MA, Bakshi R. Interhemispheric asymmetry of brain diffusivity in normal individuals: a diffusion-weighted MR imaging study. AJNR Am J Neuroradiol. 2005;26:1089-94
72. Ch\U00E1Vez RA, Guerrero AG, Vaugier V, Fuentes CC. Neurobiología de la creatividad: resultados preliminares de un estudio de activación cerebral. Salud Ment. 2004;27:38-46
73. Seeley WW, Crawford RK, Zhou J, Miller BL, Greicius MD. Neurodegenerative diseases target large-scale human brain networks. Neuron. 2009;62:42-52
74. Raichle ME. The brain's default mode network. Annu Rev Neurosci. 2015;38:433-47
75. Buckner RL, Andrews-Hanna JR, Schacter DL. The brain's default network: anatomy, function, and relevance to disease. Ann N Y Acad Sci. 2008;1124:1-38
76. Buckner RL, Snyder AZ, Shannon BJ, LaRossa G, Sachs R, Fotenos AF. et al. Molecular, structural, and functional characterization of Alzheimer's disease: evidence for a relationship between default activity, amyloid, and memory. J Neurosci. 2005;25:7709-17
77. Fischer FU, Wolf D, Scheurich A, Fellgiebel A, Neuroimaging AD. Altered whole-brain white matter networks in preclinical Alzheimer's disease. Neuroimage Clin. 2015;8:660-6
78. Prescott JW, Guidon A, Doraiswamy PM, Choudhury KR, Liu C, Petrella JR. et al. The Alzheimer Structural Connectome: Changes in Cortical Network Topology with Increased Amyloid Plaque Burden. Radiology. 2016;279:328
79. Baggio HC, Segura B, Junque C, De Reus MA, Sala-Llonch R, Van dH, Martijn P. Rich club organization and cognitive performance in healthy older participants. J Cogn Neurosci. 2015;27:1801-10
80. Tierney MC, Yao C, Kiss A, McDowell I. Neuropsychological tests accurately predict incident Alzheimer disease after 5 and 10 years. Neurology. 2005;64:1853-9
81. Staff RT. Reserve, brain changes, and decline. Neuroimaging Clin N Am. 2012;22:99
82. Stam CJ. Modern network science of neurological disorders. Nat Rev Neurosci. 2014;15:683-95
Author contact
![]() Corresponding authors: Tianyi Yan, Email: yantianyiedu.cn, Tel: 13070188777; Ying Han, Email: hanyingccmu.edu.cn, Tel: 18515692701
Corresponding authors: Tianyi Yan, Email: yantianyiedu.cn, Tel: 13070188777; Ying Han, Email: hanyingccmu.edu.cn, Tel: 18515692701