Impact Factor
- Issue 14; 2026
- Issue 13; 2026
- Issue 12; 2026
- Issue 11; 2026
- Issue 10; 2026
- Volume 16; 2026
- Advance Articles
- Past Issues
- Cover Images
- Cover Suggestion
- Index & Coverage
- Special Issues
Introduction
Materials and Methods
Results and Discussion
Conclusion
Abbreviations
Supplementary Material
Acknowledgements
References
International Journal of Biological Sciences
International Journal of Medical Sciences
 Global reach, higher impact

Theranostics 2018; 8(12):3275-3283. doi:10.7150/thno.25123 This issue Cite
Research Paper
Colorimetric in situ assay of membrane-bound enzyme based on lipid bilayer inhibition of ion transport
Juan Zhang1, Defeng Li1,2, Xiquan Yue1, Meiling Zhang3, Ping Liu3 ![]() , Genxi Li1,4
, Genxi Li1,4 ![]()
1. Center for Molecular Recognition and Biosensing, School of Life Sciences, Shanghai University, Shanghai 200444, P. R. China
2. Shanghai Key Laboratory of Bio-Energy Crops, Shanghai University, Shanghai 200444, P. R. China
3. Department of Oncology, the First Affiliated Hospital of Nanjing Medical University, Nanjing 210029, P. R. China
4. State Key Laboratory of Pharmaceutical Biotechnology, Department of Biochemistry, Nanjing University, Nanjing 210093, P. R. China
Received 2018-1-24; Accepted 2018-4-1; Published 2018-5-11
Abstract

Membrane-bound enzymes (MBEs), which make up a very high proportion of intracellular enzymes, catalyze a variety of activities that are currently analyzed by various techniques after purification. However, due to their amphipathic character, the purification of MBEs is difficult. Therefore, the most productive approach represents in situ analysis of MBEs in the cellular membrane.
Methods: In this study, using membrane-bound α-glucosidase (α-Glu) as an example, we have developed a colorimetric in situ assay for MBEs based on the inhibitory effect of lipid bilayer on ion transport. The enzyme substrate could mediate the self-assembly of phospholipid PEG derivative around magnetic nanospheres that were modified with boronic acid. The formation of lipid bilayer could inhibit the leaking of iron ions under acidic conditions. However, the product of the catalytic reaction had no capability for self-assembly of the lipid bilayer, leading to the release of iron ions from the magnetic nanospheres under acidic pH.
Results: The colorimetric in situ assay for MBEs could not only analyze the activity of membrane-bound α-Glu located on Caco-2 cells but could also evaluate the α-Glu inhibitors in cell medium.
Conclusions: The simple, economic, and efficient method proposed here offers a potential application for high-throughput testing of α-Glu and its inhibitors. Our study also outlines a strategy for exploring the colorimetric method to detect the activities of MBEs in situ.
Keywords: membrane-bound enzyme, in situ analysis, lipid bilayer, ion transport, inhibitor evaluation
Introduction
Membrane-bound enzymes (MBEs) associated with the plasma membrane [1], endoplasmic reticulum [2, 3], membranes of mitochondria and chloroplasts [4, 5], and the membranes of other organelles [6] constitute a large proportion of intracellular enzymes. These enzymes catalyze a variety of activities including translocation [7] and information transfer [8] and act on locally concentrated substrates [9]. Importantly, MBEs are targets of over 50% of recent medical drugs [10-12]. Currently, the activities of MBEs are analyzed through purification [13, 14], followed by determination with colorimetric [15, 16], fluorescent [17-19], chemiluminescent [20], and electrochemical techniques [21], as well as Western blotting [22].
In contrast to the soluble enzymes, MBEs are difficult to purify because of their amphipathic nature [23, 24]. For purification, MBEs are usually solubilized disrupting the integrity of the membrane and resulting in changes in stability, affinity, specificity for substrates and effectors, optimum pH, and other kinetic properties [23, 25]. Therefore, the most constructive approach is to analyze MBEs in situ in cellular membranes. Recently, fluorescent enzyme substrates have been developed to label and test the activity of MBEs in situ. For instance, Wang et al. developed two novel fluorescent in situ targeting probes that specifically target γ-glutamyltranspeptidase (GGT) in tumor cells and monitored the GGT activity in living cells [26]. However, it is rare for a colorimetric method to detect the activity of MBEs at the cellular level in situ.
The lipid bilayer is a thin polar membrane composed of two layers of lipid molecules. It is the barrier that prevents favorable ions and other substances from diffusing into other areas [27]. The bilayer is particularly impermeable to ions and allows cells to regulate the ion concentrations [28]. A variety of artificial lipid bilayers, such as liposomes and planer lipid bilayers, have been prepared and used to investigate ion translocation [29-31]. Also, black lipid membrane [32], solid lipid bilayer [33], hybrid lipid bilayer [34, 35], and polymer cushioned lipid bilayer [36] have been constructed to study the surface chemistry of the cells [37].
In this study, using α-glucosidase (α-Glu) as an example, we propose a new strategy for MBE analysis in cell medium. α-Glu is located in the brush border of the small intestine that acts on α(1→4) bonds and its inhibitors show a broad spectrum of activity for the treatment of diabetes [38]. The enzyme can catalyze the hydrolysis of the substrate, para-aminophenyl-α-D-glucopyranoside [39], which forms stable complexes of cyclic esters with boronic acid groups [15, 40]. It is predicted that the substrate can assist the assembly of reactive phospholipid PEG derivatives in the vicinity of magnetic nanoparticle clusters modified by boronic acid and inhibit the leakage of iron ions into the solution and the subsequent catalyzed breakdown of hydrogen peroxide [41]. Thus, we designed a novel colorimetric strategy based on the substrate-mediated formation of the lipid bilayer and inhibition of ion transport for the analysis of MBEs. The slight change in the substrate can modulate the density of lipid bilayer around nanoparticles cluster and the subsequent release of iron ions. Also, compared with current colorimetric methods, which detect the concentrations of enzyme substrates or products in the complicated cell medium [42], the catalyzed property of iron ions confers high sensitivity to the in situ assay. Furthermore, the magnetic separation capability of the nanoparticles cluster allows for the removal of interfering substances thereby enhancing the analytical accuracy [43]. Importantly, this method for the analysis of MBE activity can be used in a high-throughput fashion with a simple colorimetric reader.
Materials and Methods
α-Glu (EC 3.2.1.20, from Saccharomyces cerevisiae), alkaline phosphatase (ALP), ovalbumin (Ova), sodium acetate, trisodium citrate, 3-aminophenylboronic acid (APBA), 1-(3-dimethlaminopropyl)-3-ethylcarbodimide hydrochloride (EDC), 2,2'-azino-bis(3-ethylbenzothiazoline-6-sulphonic acid) diammonium salt (ABTS), N-hydroxysuccinimidepurum (NHS), N-2-hydroxyethylpiperazine-N'-2-ethanesulfonic acid (HEPES), 2-(N-morpholino)ethanesulfonic acid (MES), and trizmabase were purchased from Sigma (Shanghai, China). para-Aminophenyl-α-D-glucopyranoside (pAPG) was acquired from Beijing Chemsynlab Pharmaceutical Co. Ltd (Beijing, China). 1,2-Distearoyl-sn-glycero-3-phosphoethanolamine (DSPE)-conjugated polyethylene Glycol 10000 and NHS (DSPE-PEG-NHS) were obtained from Ponsure Biotechnology Co. Ltd. (Shanghai, China). Vybrant® DiO cell-labeling solution and Cyanine 3 amine were purchased from Thermofisher (Shanghai, China). FeCl3•6H2O, bovine serum albumin (BSA), α-amylase, lactoferrin (LF), lipase, trypsin, glucose oxidase (GO), hemoglobin, gallic acid (GA), quercetin (Que), maltopentaose (Mal), and ethylene glycol were obtained from Sinopharm Chemical Reagent Co. Ltd. (Shanghai, China). All other reagents used were of analytical grade. Caco-2 cells were acquired from Shanghai Genechem Co. Ltd. (Shanghai, China). All buffers and aqueous solutions were prepared with ultrapure water purified with a Millipore Milli-Q water purification system (Barnstead, USA) with a specific resistance of 18 MΩ cm. The solution of α-Glu with different concentrations was prepared in HEPES buffer (20 mM, pH 6.8).
Preparation of assembled magnetic nanospheres (AMNSs) and APBA/AMNSs
AMNSs were prepared according to the method reported previously [44]. APBA was immobilized onto the surface of AMNSs by using EDC as a linker [27]. Detailed experimental conditions have been described in Supplementary Material.
Construction and characterization of the lipid bilayer (LB)
20 μL of pAPG (15 μM) in HEPES buffer (20 mM, pH 7.4) was mixed with 20 μL of DSPE-PEG-NHS (500 μM) dissolved in 20 mM HEPES buffer (100 mM NaCl, 5 mM CaCl2, pH 7.4). The mixture was incubated for 50 min at room temperature (25 °C), to yield DSPE-PEG-NHS/pAPG. Subsequently, 2.28 μL of NaOH (200 mM) was added to the mixture for adjusting the pH of the solution to 9.4. Next, 5 μL of 2 mg/mL APBA/AMNSs was added to the solution and the resulting mixture was incubated for 13 min at room temperature with gentle shaking to form the stable complex through boronate ester bond between APBA and pAPG. Finally, the mixture was washed three times with HEPES buffer (20 mM, pH 9.4) to produce a lipid bilayer around AMNSs (LB/pAPG/APBA/AMNSs).
The lipid bilayer was further characterized by using laser scanning confocal fluorescence microscopy, fluorescence spectroscopy, dynamic light scattering, and Fourier transform infrared spectrometer. Detailed conditions have been described in Supplementary Material.
Detection of released iron ions
100 µL of 100 mM MES solution was added to LB/pAPG/APBA/AMNSs with 15 μM of pAPG concentration. Five minutes later, the supernatants resulting from magnetic separation were used for the detection of iron ions. The content of iron ions was measured using an inductively coupled plasma optical emission spectrometer (JY 2000-2, Horibia, France).
Analysis of enzyme activity
10 μL of purified α-Glu solution (0.01-2.1 U/mL) or cell suspension (0-0.5×10⁸ cells/mL) was added to 20 μL of pAPG solution, and the resulting mixture was kept at 37 °C for 20 min. Subsequently, 1.5 μL of NaOH (50 mM) was added to adjust the pH value to 7.4. Next, 20 μL of DSPE-PEG-NHS (500 μM) was added and after 50 min the mixture was washed three times followed by addition of 2.28 μL of NaOH (200 mM) to adjust the pH value to 9.4. Then, 5 μL of 2 mg/mL APBA/AMNSs solution was added. After 13 min, the reaction mixture was separated by magnet and washed three times to obtain LB/pAPG/APBA/AMNSs. Finally, 100 µL of 100 mM MES buffer solution, 20 µL of 5 mM ABTS, and 20 µL of 4 mM H2O2 were added to LB/pAPG/APBA/AMNSs. Five minutes later, the supernatants resulting from magnetic separation were used for UV-Vis spectroscopic measurements, and the absorbance values were recorded with a UV-Vis spectrometer (Shimadzu Co., Kyoto, Japan).
Analysis of enzyme inhibitors
In the inhibition assay, 10 μL gallic acid or quercetin solutions with different concentrations were premixed with purified α-Glu (10 μL, 2.1 U/mL) or cell culture (10 μL, 0.5×10⁸ cells/mL) for 20 min at 37 °C. Next, 20 μL of pAPG solution was added and the solution was incubated for 20 min at 37 °C. Subsequently, LB/pAPG/APBA/AMNSs were obtained and the absorbance values were recorded.
The inhibitory ratio was calculated as follows:
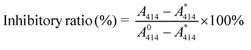
where A414 was the absorbance obtained in the presence of enzyme and inhibitor, A* 414 was the absorbance obtained with enzyme only, and A0 414 was the absorbance obtained without enzyme and inhibitor.
Results and Discussion
As α-Glu substrate, pAPG was composed of two moieties, i.e. phenyl ring and saccharide. The 2'-OH and 4'-OH in saccharide fraction of pAPG could react with boric acid on the surface of AMNSs, forming a stable six-membered ring of the complex (Figure 1A) [45]. As shown in Figure 1B (black curve), the spectrum of APBA/AMNSs exhibited two peaks at 1105 cm-1 and 1016 cm-1, which could be attributed to B-O-H stretching and deformation vibrations, respectively [46]. The two peaks disappeared for pAPG/APBA/AMNSs and the other two peaks at 1045 cm-1 and 1180 cm-1, corresponding to B-O-C stretching and deformation vibrations, appeared inversely (Figure 1B, red curve). Furthermore, the mean hydrodynamic diameter increased from 262.53 nm to 295.22 nm and the zeta potential decreased from -34.89 mV to -36.25 mV (Figure 1C). On the other hand, the primary amino group in phenyl ring fraction of pAPG could readily crosslink with NHS ester moiety of DSPE-PEG-NHS (Figure 1A) [47]. As shown in Figure 1B (red curve), the broad band around 3443 cm-1 was assigned to the stretching vibration of -NH2 group in pAPG fraction for pAPG/APBA/AMNSs [48]. For LB/pAPG/APBA/AMNSs, the band became narrow (Figure 1B, blue curve). Also, a strong peak at about 2917 cm-1 appeared and belonged to -CH2 CH2O- in the PEG fraction of DSPE-PEG-NHS [48]. Moreover, the negative charge increased from -36.25 mV to -41.58 mV after the linkage of DSPE-PEG-NHS (Figure 1C) due to the presence of phosphate groups in the structure of DSPE-PEG-NHS. As reactive phospholipid PEG derivative, DSPE-PEG-NHS could spontaneously form liposomes in the aqueous environment [49]. Therefore, it appeared that pAPG could assist the self-assembly of DSPE-PEG-NHS, leading to the formation of lipid bilayer surrounding of AMNSs (Figure 1A). As shown in Figure 1C, an approximate increase of 76 nm in the mean hydrodynamic diameter for LB/pAPG/APBA/AMNSs (371.47 nm) compared to that of pAPG/APBA/AMNSs (295.22 nm), indicated the coating of lipid bilayer [50].
(A) Schematic illustration of the mechanism of lipid bilayer formation around AMNSs. (B) FT-IR spectra as well as (C) particle size distribution and zeta potential of AMNSs, APBA/AMNSs, pAPG/APBA/AMNSs, and LB/pAPG/APBA/AMNSs. (D) Fluorescence intensities of maximum emission peaks at 515 nm and 580 nm for LB/pAPG/APBA/AMNSs with different concentrations of pAPG (0, 1, 3, 5, 7, 10, 13, 16, and 20 μM) using Dio and Cyanine 3 amine as molecular probes, respectively. (E) Fluorescence images of LB/pAPG/APBA/AMNSs with different pAPG concentrations ((a) 0, (b) 1, (c) 3, (d) 5, (e) 7, (f) 10, (g) 13, (h) 16, (i) 20 μM) separately using Dio and Cyanine 3 amine as molecular probes: (1) green fluorescence, (2) red fluorescence, and (3) merged fluorescence.
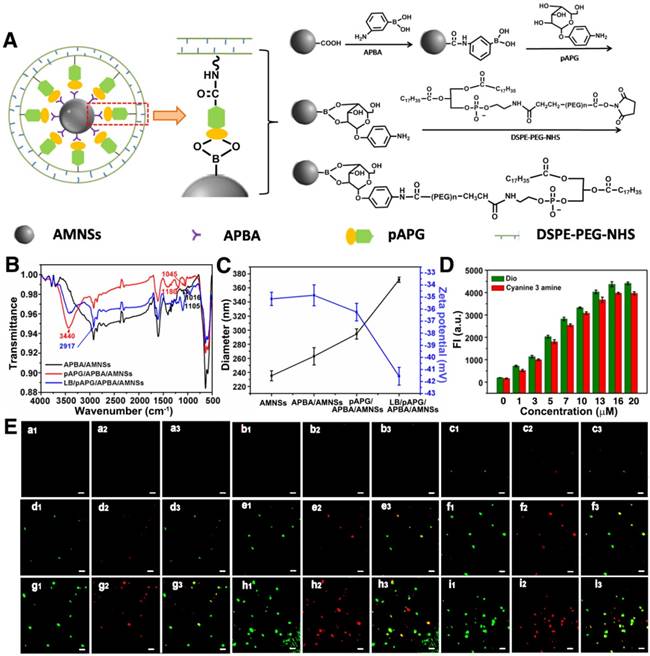
To further validate the existence of lipid bilayer, two different fluorescent dyes, Dio and Cyanine 3 amine, were used for fluorescence image and fluorescent spectra measurement. As a long-chain carbocyanine dye, Dio is essentially insoluble in water and becomes inserted into the lipid bilayer with its alkyl chains and is widely used for the characterization of membranes [51]. Therefore, it was assumed that the formation of lipid bilayer would result in the exposure of NHS moiety in the molecular structure of DSPE-PEG-NHS. NHS could react with amino group of Cyanine 3 amine generating green fluorescence near AMNSs [52]. In the absence of pAPG, no fluorescence could be observed (Figure 1D-Ea) because of the lack of lipid bilayer close to APBA/AMNSs. With the increase in pAPG concentrations from 1 μM to 16 μM, the fluorescent intensities increased (Figure 1D) and the green and red fluorescence gradually became brighter (Figure 1Eb1-h1 for green fluorescence and Figure 1Eb2-h2 for red fluorescence). This could be due to the incremental formation of lipid bilayer mediated by pAPG at the surface of AMNSs. However, fluorescence intensities were unchanged with further increase in the pAPG concentration from 16 μM to 20 μM (Figure 1D) indicating that AMNSs were totally covered by lipid. These results confirmed the formation of lipid bilayer around AMNSs.
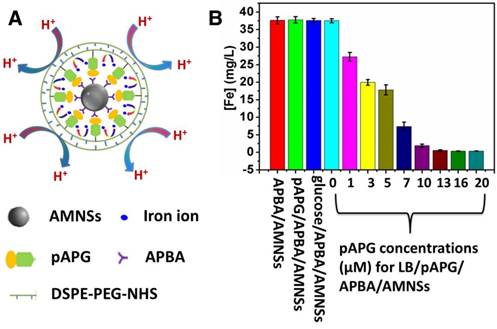
It has been reported that under acidic conditions, iron ions could be leached from AMNSs [53]. pAPG-assisted lipid bilayer could protect AMNSs against acid leaching due to its inhibitory effect on the transport of hydrogen and iron ions [27] (Figure 2A). As displayed in Figure 2B, the concentration of iron ions was maximized for APBA/AMNSs, pAPG/APBA/AMNSs, and α-glucose/APBA/AMNSs, indicating no inhibitory effect of APBA, pAPG, and α-glucose on the leakage of iron ions in the acidic solution. For LB/pAPG/APBA/AMNSs, the concentration of iron ions was unchanged in the absence pAPG compared with that for APBA/AMNSs, because of the absence of lipid bilayer around AMNSs. With the increase of pAPG concentration from 1 μM to 20 μM, the concentration of iron ions gradually decreased from 37.52 mg/L to 0.353 mg/L. This could be due to the increased self-assembly of DSPE-PEG-NHS and the formation of lipid bilayer which could not only prevent the transport of hydrogen ions to inhibit the leaching of iron ions, but also hinder the release of leached iron ions form the outer layer of AMNSs into the solution.
(A) Schematic illustration for the release of iron ions inhibited by the pAPG-mediated lipid bilayer. (B) The release of iron ions for APBA/AMNSs, pAPG/APBA/AMNSs, glucose/APBA/AMNSs, and LB/pAPG/APBA/AMNSs with different concentrations of pAPG (0, 1, 3, 5, 7, 10, 13, 16, and 20 μM).
The mechanism for α-Glu assay is illustrated in Figure 3A. The enzyme could catalyze the breakage of α-1,4 glycosidic bond, resulting in the hydrolysis of pAPG into pAP and α-glucose [39]. The α-glucose consisting of the cis 2,4-diols group, could interact with boronic acid group at the outer layer of APBA/AMNSs forming a stable six-membered ring of the complex. After magnetic separation, α-glucose/APBA/AMNSs obtained could release iron ions into the solution under acidic pH, because of the no barrier effect around the AMNSs. In the presence of H2O2, the iron ions could catalyze the oxidation of ABTS to the colored product (ABTS•+) with a maximum absorbance peak at 414 nm producing the dark green supernatant [41, 54]. On the contrary, without α-Glu, pAPG as a linker could mediate the self-assembly of DSPE-PEG-NHS and subsequent formation of lipid bilayer around the AMNSs which was confirmed by the above experiment (Figure 1). At acidic pH, the lipid bilayer could inhibit the accumulation of hydrogen ions onto the surface of AMNSs and prevent the leaching of iron ions (Figure 2). In this case, ABTS could not be oxidized due to the deficiency of iron ions in the H2O2 solution and a weak absorbance and light green supernatant liquid could be observed. Thus, α-Glu activity was closely related to the concentration of iron ions in the solution and a new method for enzyme analysis based on inhibition of ion transport in the lipid bilayer could be developed. Considering specific cleavage of the substrate by the enzyme and magnetic separation property of AMNSs, we could analyze enzyme activity specifically, accurately, and efficiently.
(A) Schematic illustration for the mechanism of α-Glu assay via inhibition of lipid bilayer on iron release. (B) UV-vis spectra of the mixtures prepared by separate addition of ABTS (20 μL, 5 mM) + H2O2 (20 μL, 4 mM) (vial 1, black curve), pAPG (20 μL, 20 μM) + ABTS (20 μL, 5 mM) + H2O2 (20 μL, 4 mM) (vial 2, red curve), α-Glu (10 μL, 1 U/mL) + ABTS (20 μL, 5 mM) + H2O2 (20 μL, 4 mM) (vial 3, blue curve), α-Glu (10 μL, 1 U/mL) + pAPG (20 μL, 20 μM) + ABTS (20 μL, 5 mM) + H2O2 (20 μL, 4 mM) (vial 4, green curve), Fe2+ (5 μL, 25 mM) + ABTS (20 μL, 5 mM) + H2O2 (20 μL, 4 mM) (vial 5, pink curve), pAPG (20 μL, 20 μM) + Fe2+ (5 μL, 25 mM) + ABTS (20 μL, 5 mM) + H2O2 (20 μL, 4 mM) (vial 6, yellow curve), α-Glu (10 μL, 1 U/mL) + Fe2+ (5 μL, 25 mM) + ABTS (20 μL, 5 mM) + H2O2 (20 μL, 4 mM) (vial 7, navy curve), APBA/AMNSs + ABTS (20 μL, 5 mM) + H2O2 (20 μL, 4 mM) (vial 8, wine curve), pAPG/APBA/AMNSs + ABTS (20 μL, 5 mM) + H2O2 (20 μL, 4 mM) (vial 9, Rose red curve), LB/pAPG/APBA/AMNSs + ABTS (20 μL, 5 mM) + H2O2 (20 μL, 4 mM) (vial 10, palegreen curve), and LB/pAPG/APBA/AMNSs + α-Glu (10 μL, 1 U/mL) + ABTS (20 μL, 5 mM) + H2O2 (20 μL, 4 mM) (vial 11, dark blue curve) into a tube with the final volume of 140 μL by adding 100 mM MES buffer solution. Inset: the corresponding magnified spectra.
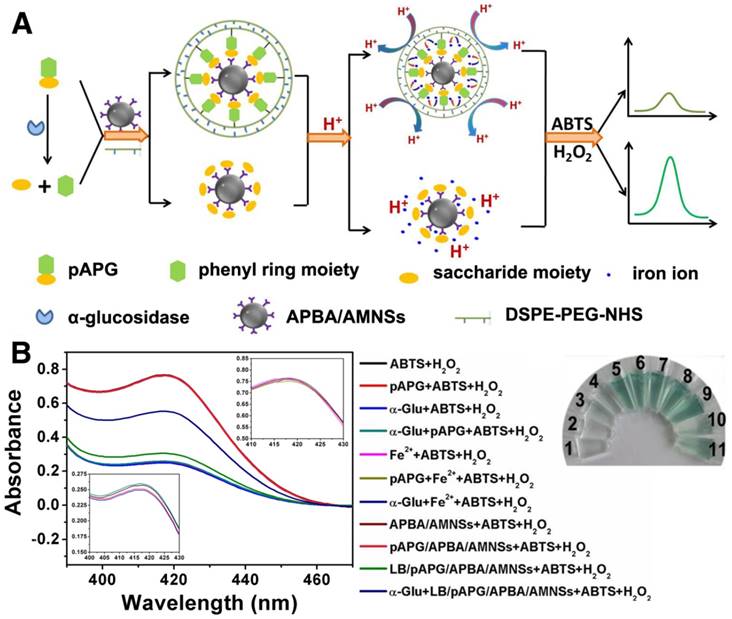
To validate the feasibility of our proposed method for enzyme activity analysis, a series of experiments were conducted and the results are presented in Figure 3B. In the presence of H2O2, ABTS could be mildly oxidized resulting in a low absorbance peak at 414 nm (Figure 3B, blank curve) and a nearly colorless reaction solution (vial 1). pAPG, α-Glu, and the mixture of both had a negligible effect on the oxidation of ABTS as there was almost no change in the absorbance value (Figure 3B, red, blue, and green curves) or the color of solution (vials 2, 3, and 4). However, addition of iron ions led to a high absorbance value (Figure 3B, pink curve) and dark green solution (vial 5) that could be attributed to the catalyzing effect of iron ions on the oxidation of ABTS by H2O2. pAPG and the enzyme had nearly no impact on the catalyzed oxidation of iron ions as no change in absorbance values (Figure 3B, yellow and navy curves) and the color of the solution (vials 6 and 7) was observed. Like iron ions, addition of APBA/AMNSs and pAPG/APBA/AMNSs yielded high absorbance value (Figure 3B, dark red and rose red curves) and dark green solution (vials 8 and 9) indicating the oxidation effect catalyzed by the two composites due to the leaching of iron ions from APBA/AMNSs and pAPG/APBA/AMNSs under acidic pH. As shown in Figure 2B, iron ions could be separately leached from APBA/AMNSs and pAPG/APBA/AMNSs into the solution. Addition of LB/pAPG/APBA/AMNSs resulted in a low absorbance value (Figure 3B, pale green curve) and light solution color (vial 10), implying that it decreased the number of iron ions in the solution. The phenomena could be explained by the formation of lipid bilayer originating from the self-assembly of DSPE-PEG-NHS. On the one hand, the lipid bilayer could inhibit the permeation of hydrogen ions into AMNSs to prevent the leaching of iron ions [27, 28].
On the other hand, the bilayer also hindered the release of iron ions into the solution [27, 28]. α-Glu cleaved pAPG into pAP and α-glucose [39], increasing the absorbance value (Figure 3B, dark blue curve) and yielding a relatively dark solution color (vial 11). Different from pAPG, the hydrolyzed products (pAP and α-glucose) could not be used as linkers to assist the self-assembly of DSPE-PEG-NHS and the eventual formation of lipid bilayer around AMNSs. Conversely, after magnetic separation, α-glucose/APBA/AMNSs obtained could release iron ions in the acid solution (Figure 2B).
As a membrane-bound enzyme in the epithelium of the small intestine, α-Glu catalyzes the final step of carbohydrate hydrolysis to produce absorbable monosaccharides which determine the postprandial blood level [38]. Therefore, the inhibitors can be accurately analyzed using the membrane-bound enzyme in cell medium. The human intestinal Caco-2 cell line has been extensively used as a model of the absorptive and defensive properties of the intestinal mucosa [55]. We further confirmed that the established method could be applied for the analysis of membrane-bound enzyme and the screening of inhibitors by using Caco-2 cell. Consistent with the observed increase in absorbance values, color of the solution turned from colorless to dark green upon addition of 0 to 0.5×10⁸ cells/mL (Figure 4A). The experiment verified the progressive cleavage of pAPG catalyzed by the membrane-bound α-Glu located on Caco-2 cells, decreasing the lipid bilayer around AMNSs and increasing the concentration of released iron ions. The results indicated that the method can be utilized for the analysis of membrane-bound enzyme in cell medium.
(A) UV-vis spectra and photographs (inset) of the mixtures prepared by the addition of various numbers of Caco-2 cells. Inset, from vial 1 to vial 15: the cell numbers are 0, 0.5×10², 0.8×10², 1.0×10², 0.5×10³, 1.0×10³, 0.5×10⁴, 1.0×10⁴, 0.5×10⁵, 1.0×10⁵, 0.5×10⁶, 1.0×10⁶, 0.5×10⁷, 1.0×10⁷, and 0.5×10⁸ cells/mL. (B) UV-vis spectra and photographs (inset) of mixtures, (C) absorbance values, and (D) inhibition ratios following the addition of various concentrations of GA to Caco-2 cells. Inset (B), vial 1 to vial 9: the GA concentrations are 0.5, 0.6, 0.7, 0.8, 0.9, 1, 1.1, 1.2, 1.3, 1.4, 1.5, and 1.6 mM. (E) UV-vis spectra and photographs (inset) of mixtures, (F) absorbance values, and (G) inhibition ratios following the addition of various concentrations of Que to Caco-2 cells. Inset (E), vial 1 to vial 9: the Que concentrations are 0.2, 0.9, 1.8, 3.6, 5.4, 7.2, 9, 10.8, 12.6, 14.4, and 16.2 μM. (H) IC50 values of GA and Que on purified α-Glu (PG) and membrane-bound α-Glu (MBG). Cell numbers are 5×10⁷ cells/mL. Error bars indicate standard deviations (n = 3).
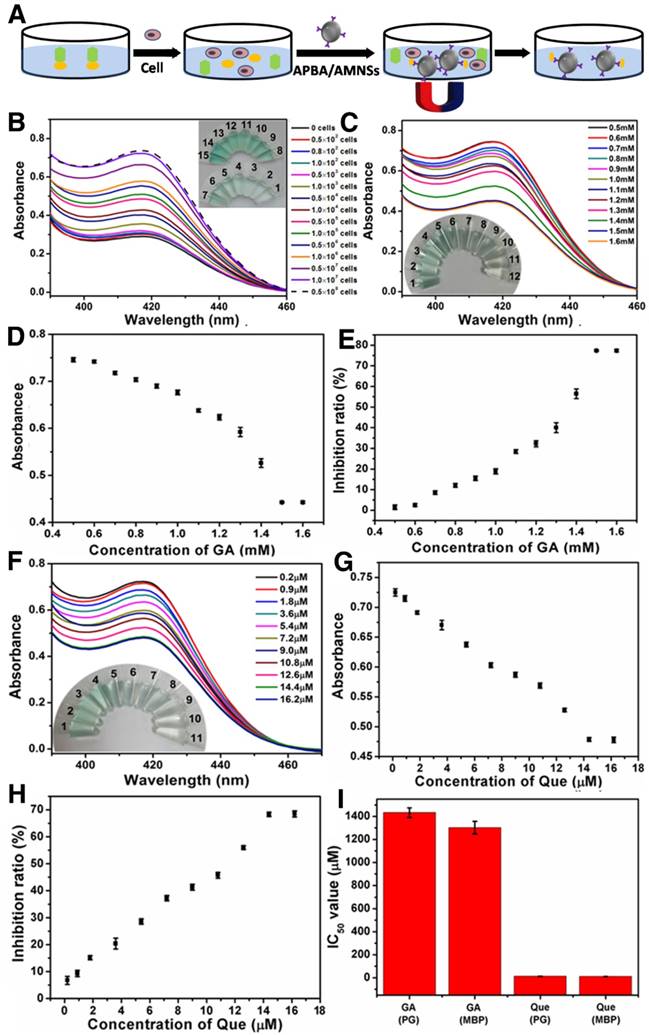
We further evaluated the efficiencies of inhibitors in cell medium. Changes in absorbance spectra, absorbance values, and inhibitory ratios with the increasing concentrations of GA (Figure 4B-D) and Que (Figure 4E-G) were obtained and compared with those acquired by using purified α-Glu (Figure S3D-I). For both GA and Que, the inhibitory ratios (80.25% and 70.99%, respectively) and IC50 values (1.4 mM and 13.5 μM, respectively) tested using purified enzyme were in agreement with the corresponding ratios (78.1% and 70.1%, respectively) and values (1.36 mM and 12.4 μM, respectively) obtained by membrane-bound enzyme. The results confirmed that the method could not only be successfully employed for the evaluation of inhibitors using purified α-Glu but also by the membrane-bound enzyme.
Conclusion
In this study, a new strategy for direct analysis of a membrane-bound enzyme has been proposed based on the inhibition of ion transport by the lipid bilayer. We used membrane-bound α-Glu as an example, since its substrate can mediate the self-assembly of lipid bilayer around AMNSs to inhibit the release and transport of iron ions under acidic pH. A simple and specific method was established for α-Glu. The method could test the activities of both purified α-Glu and membrane-bound α-Glu in cell medium. Furthermore, it could be applied for the evaluation of inhibitors at the molecular as well as cellular levels. Our study provides a new strategy for the development of a method to detect membrane-bound enzymes in situ.
Abbreviations
ABTS: 2, 2'-azino-bis(3-ethylbenzothiazoline-6-sulphonic acid) diammonium salt; ALP: alkaline phospatase; AMNSs: assembled magnetic nanospheres; APBA: 3-aminophenylboronic acid; BSA: bovine serum albumin; DSPE-PEG-NHS: 1, 2-distearoyl-sn-glycero-3-phosphoethanolamine (DSPE) conjugated polyethylene glycol 10000 (PEG) and N-hydroxysuccinimide (NHS); EDC: 1-(3-dimethlaminopropyl)-3-ethylcarbodimide hydrochloride; GA: gallic acid; GO: glucose oxidase; HEPES: N-2-hydroxyethylpiperazine-N'-2-ethanesulfonic acid; LB: lipid bilayer; LF: lactoferrin; Mal: maltopentaose; MBEs: membrane-bound enzymes; MES: 2-(N-morpholino)ethanesulfonic acid; Ova: ovalbumin; pAPG: para-aminophenyl-α-D-glucopyranoside; Que: quercetin.
Supplementary Material
Experimental procedures for the preparation of AMNSs and APBA/AMNSs, characterization of the lipid bilayer, cell culture, specificity analysis, results and discussion for optimization of experimental conditions, as well as purified α-Glu assay and screening of its inhibitors are provided in the Supplementary Material and figures.
Acknowledgements
This work was supported by the National Natural Science Foundation of China (Grant Nos. 31671923 and 21235003).
Competing Interests
The authors have declared that no competing interest exists.
References
1. Cantley LC. The phosphoinositide 3-kinase pathway. Science. 2002;296:1655-7
2. Stone SJ, Levin MC, Zhou P, Han J, Walther TC, Farese RV. The endoplasmic reticulum enzyme DGAT2 is found in mitochondria-associated membranes and has a mitochondrial targeting signal that promotes its association with mitochondria. J Biol Chem. 2009;284:5352-61
3. Meunier L, Usherwood YK, Chung KT, Hendershot LM. A subset of chaperones and folding enzymes form multiprotein complexes in endoplasmic reticulum to bind nascent proteins. Mol Biol Cell. 2002;13:4456-69
4. Moberg P, Ståhl A, Bhushan S, Wright SJ, Eriksson A, Bruce BD. et al. Characterization of a novel zinc metalloprotease involved in degrading targeting peptides in mitochondria and chloroplasts. Plant J. 2003;36:616-28
5. Watanabe N, Che FS, Iwano M, Takayama S, Yoshida S, Isogai A. Dual targeting of spinach protoporphyrinogen oxidase II to mitochondria and chloroplasts by alternative use of two in-frame initiation codons. J Biol Chem. 2001;276:20474-81
6. Martin S, Parton RG. Lipid droplets: a unified view of a dynamic organelle. Nat Rev Mol Cell Bio. 2006;7:373-8
7. Balzan S, De Almeida Quadros C, De Cleva R, Zilberstein B, Cecconello I. Bacterial translocation: overview of mechanisms and clinical impact. J Gastroen Hepatol. 2007;22:464-71
8. Good MC, Zalatan JG, Lim WA. Scaffold proteins: hubs for controlling the flow of cellular information. Science. 2011;332:680-6
9. Cornish-Bowden A. Fundamentals of enzyme kinetics. Colchester, UK: Portland Press. 1995
10. Overington JP, Al-Lazikani B, Hopkins AL. How many drug targets are there? Nat Rev Drug Discov. 2006;5:993-6
11. Srivastava D, Bernhard SA. Metabolite transfer via enzyme-enzyme complexes. Science. 1986;234:1081-6
12. Bordon Y. Immunometabolism: Innate sensing role for metabolic enzyme. Nat Rev Immunol. 2016;16:463
13. Shirzad-Wasei N, van Oostrum J, Bovee-Geurts PHM, Kusters LJA, Bosman GJCGM, DeGrip WJ. Rapid transfer of overexpressed integral membrane protein from the host membrane into soluble lipid nanodiscs without previous purification. Biol Chem. 2015;396:903-15
14. Lee DW, Park KM, Banerjee M, Ha SH, Lee T, Suh K. et al. Supramolecular fishing for plasma membrane proteins using an ultrastable synthetic host-guest binding pair. Nat Chem. 2011;3:154-9
15. Zhang J, Liu Y, Lv J, Li G. A colorimetric method for α-glucosidase activity assay and its inhibitor screening based on aggregation of gold nanoparticles induced by specific recognition between phenylenediboronic acid and 4-aminophenyl-α-d-glucopyranoside. Nano Res. 2015;8:920-30
16. Yu RJ, Ma W, Liu XY, Jin HY, Han HX, Wang HY. et al. Metal-linked immunosorbent assay (MeLISA): the enzyme-free alternative to ELISA for biomarker detection in serum. Theranostics. 2016;6:1732-9
17. Wei X, Wu Q, Zhang J, Zhang Y, Guo W, Chen M. et al. Synthesis of precipitating chromogenic/fluorogenic β-glucosidase/β-galactosidase substrates by a new method and their application in the visual detection of foodborne pathogenic bacteria. Chem Commun. 2017;53:103-6
18. Qian RC, Cao Y, Zhao LJ, Gu Z, Long YT. A Two-stage dissociation system for multilayer imaging of cancer biomarker-synergic networks in single cells. Angew Chem Int Edit. 2017;56:4802-5
19. Qian R, Cao Y, Long YT. Dual-targeting nanovesicles for in situ intracellular imaging of and discrimination between wild-type and mutant p53. Angew Chem Int Edit. 2016;55:719-23
20. Abulimite Z, Mu X, Xiao S, Liu M, Li Q, Chen G. New chemiluminescent substrates of paraoxonase 1 with improved specificity: synthesis and properties. Appl Biochem Biotech. 2015;176:301-16
21. O'Hara T, Seddon B, O'Connor A, McClean S, Singh B, Iwuoha E. et al. Quantum dot nanotoxicity investigations using human lung cells and toxor electrochemical enzyme assay methodology. ACS Sensors. 2017;2:165-71
22. Wagner S, Bader ML, Drew D, de Gier JW. Rationalizing membrane protein overexpression. Trends Biotechnol. 2006;24:364-71
23. Oizumi J, Hayakawa K. Purification of the membrane protein enzyme lipoamidase by affinity chromatography. Biomed Chromatogr. 1989;3:274-5
24. Kimberly WT, LaVoie MJ, Ostaszewski BL, Ye W, Wolfe MS, Selkoe DJ. γ-Secretase is a membrane protein complex comprised of presenilin, nicastrin, Aph-1, and Pen-2. P Natl Acad Sci USA. 2003;100:6382-7
25. Freedman R. Membrane-bound enzymes. In: Finean JB, Michell RH, ed. New Comprehensive Biochemistry, Membrane Structure, 1st ed. New York: Elsevier. 1981;1:161-214
26. Wang F, Zhu Y, Zhou L, Pan L, Cui Z, Fei Q. et al. Fluorescent in situ targeting probes for rapid imaging of ovarian-cancer-specific gamma-glutamyltranspeptidase. Angew Chem Int Edit. 2015;54:7349-53
27. Wang S, Larson RG. Water channel formation and ion transport in linear and branched lipid bilayers. Phys Chem Chem Phys. 2014;16:7251-62
28. Moya AA. Numerical simulation of ionic transport processes through bilayer ion-exchange membranes in reverse electrodialysis stacks. J Membrane Sci. 2017;524:400-8
29. Garcia-Fandiño R, Piñeiro An, Trick JL, Sansom MS. Lipid bilayer membrane perturbation by embedded nanopores: A simulation study. ACS Nano. 2016;10:3693-701
30. Skelton A, Khedkar V, Fried J. All-atom molecular dynamics simulations of an artificial sodium channel in a lipid bilayer: the effect of water solvation/desolvation of the sodium ion. J Biomol Struct Dyn. 2016;34:529-39
31. Yoo J, Li CY, Aksimentiev A. Membrane-spanning dna ion channels: conductance mechanism, electro-osmotic transport and mechanical gating. Biophys J. 2016;110:119a
32. Fujiwara H, Yonezawa Y. Photoelectric response of a black lipid membrane containing an amphiphilic azobenzene derivative. Nature. 1991;351:724-726
33. Morigaki K, Baumgart T, Offenhäusser A, Knoll W. Patterning solid-supported lipid bilayer membranes by lithographic polymerization of a diacetylene lipid. Angew Chem Int Edit. 2001;40:172-4
34. Ma W, Li DW, Sutherland TC, Li Y, Long YT, Chen HY. Reversible redox of NADH and NAD+ at a hybrid lipid bilayer membrane using ubiquinone. J Am Chem Soc. 2011;133:12366-9
35. Zhou X, Moran-Mirabal JM, Craighead HG, McEuen PL. Supported lipid bilayer/carbon nanotube hybrids. Nat Nanotechnol. 2007;2:185-90
36. Luo G, Liu T, Zhao XS, Huang Y, Huang C, Cao W. Investigation of polymer-cushioned phospholipid bilayers in the solid phase by atomic force microscopy. Langmuir. 2001;17:4074-80
37. Castellana ET, Cremer PS. Solid supported lipid bilayers: From biophysical studies to sensor design. Surf Sci Rep. 2006;61:429-44
38. Ag H. Pharmacology of α-glucosidase inhibition. Eur J Clin Invest. 1994;24:3-10
39. Zhang J, Liu Y, Wang X, Chen Y, Li G. Electrochemical assay of α-glucosidase activity and the inhibitor screening in cell medium. Biosens Bioelectron. 2015;74:666-72
40. Shoji E, Freund MS. Potentiometric saccharide detection based on the pKa changes of poly (aniline boronic acid). J Am Chem Soc. 2002;124:12486-93
41. Gao L, Zhuang J, Nie L, Zhang J, Zhang Y, Gu N. et al. Intrinsic peroxidase-like activity of ferromagnetic nanoparticles. Nat Nanotechnol. 2007;2:577-83
42. Cheng MW, Chegeni M, Kim KH, Zhang G, Benmoussa M, Quezada-Calvillo R. et al. Different sucrose-isomaltase response of Caco-2 cells to glucose and maltose suggests dietary maltose sensing. J Clin Biochem Nutr. 2014;54:55-60
43. Haun JB, Yoon TJ, Lee H, Weissleder R. Magnetic nanoparticle biosensors. Wires Nanomed Nanobi. 2010;2:291-304
44. Lu AH, Salabas EeL, Schüth F. Magnetic nanoparticles: synthesis, protection, functionalization, and application. Angew Chem Int Edit. 2007;46:1222-44
45. Li H, Rothberg L. Colorimetric detection of DNA sequences based on electrostatic interactions with unmodified gold nanoparticles. Proc Natl Acad Sci USA. 2004;101:14036-9
46. Shen P, Xia Y. Synthesis-modification integration: One-step fabrication of boronic acid functionalized carbon dots for fluorescent blood sugar sensing. Anal Chem. 2014;86:5323-9
47. Patil US, Qu H, Caruntu D, O'Connor CJ, Sharma A, Cai Y. et al. Labeling primary amine groups in peptides and proteins with N-hydroxysuccinimidyl ester modified Fe3O4@SiO2 nanoparticles containing cleavable disulfide-bond linkers. Bioconjugate Chem. 2013;24:1562-9
48. Lin L, Kong Y, Xie K, Lu F, Liu R, Guo L. et al. Polyethylene glycol/polyurethane blend membranes for gasoline desulphurization by pervaporation technique. Sep Purif Technol. 2008;61:293-300
49. Wang D, Fu J, Shi Y, Peng D, Yuan L, He B. et al. The modulation of tumor vessel permeability by thalidomide and its impacts on different types of targeted drug delivery systems in a sarcoma mouse model. J Control Release. 2016;238:186-96
50. Jacobson KH, Gunsolus IL, Kuech TR, Troiano JM, Melby ES, Lohse SE. et al. Lipopolysaccharide density and structure govern the extent and distance of nanoparticle interaction with actual and model bacterial outer membranes. Environ Sci Technol. 2015;49:10642-50
51. Honig MG, Hume RI. Dil and DIO: versatile fluorescent dyes for neuronal labelling and pathway tracing. Trends Neurosci. 1989;12:333-41
52. Hermanson GT. Bioconjugate techniques. London, UK: Academic Press. 2013
53. Shubayev VI, Pisanic Ii TR, Jin S. Magnetic nanoparticles for theragnostics. Adv Drug Deliver Rev. 2009;61:467-77
54. Wei H, Wang E. Fe3O4 magnetic nanoparticles as peroxidase mimetics and their applications in H2O2 and glucose detection. Anal Chem. 2008;80:2250-4
55. Sambuy Y, De Angelis I, Ranaldi G, Scarino M, Stammati A, Zucco F. The Caco-2 cell line as a model of the intestinal barrier: influence of cell and culture-related factors on Caco-2 cell functional characteristics. Cell Biol Toxicol. 2005;21:1-26
Author contact
![]() Corresponding authors: Fax: +86 25 68136043 (P. Liu); +86 25 83592510 (G. Li). E-mail addresses: liupinga28com (P. Liu); genxiliedu.cn (G. Li)
Corresponding authors: Fax: +86 25 68136043 (P. Liu); +86 25 83592510 (G. Li). E-mail addresses: liupinga28com (P. Liu); genxiliedu.cn (G. Li)