Impact Factor
- Issue 13; 2026
- Issue 12; 2026
- Issue 11; 2026
- Issue 10; 2026
- Issue 9; 2026
- Volume 16; 2026
- Advance Articles
- Past Issues
- Cover Images
- Cover Suggestion
- Index & Coverage
- Special Issues
Introduction
Methods
Results
Discussion
Abbreviations
Acknowledgements
Supplementary Material
References
International Journal of Biological Sciences
International Journal of Medical Sciences
 Global reach, higher impact

Theranostics 2018; 8(14):3766-3780. doi:10.7150/thno.24333 This issue Cite
Research Paper
Molecular signatures of liver dysfunction are distinct in fungal and bacterial infections in mice
Barbara Schaarschmidt1,2, Sebastian Vlaic3,4,5, Anna Medyukhina6, Sophie Neugebauer2,7, Sandor Nietzsche8, Falk A. Gonnert1, Jürgen Rödel9, Mervyn Singer10, Michael Kiehntopf2,7, Marc Thilo Figge2,6,12, Ilse D. Jacobsen2,11,12, Michael Bauer1,2 ![]() , Adrian T. Press1,2
, Adrian T. Press1,2 ![]()
1. Department for Anesthesiology and Intensive Care Medicine, AG Nanophysiology, Jena University Hospital, Jena, Germany
2. Center for Sepsis Control and Care, Jena University Hospital, Jena, Germany
3. Department of General, Visceral and Vascular Surgery, Experimental Transplantation Surgery, Jena University Hospital, Jena, Germany
4. Research Group Systems Biology/Bioinformatics, Leibniz Institute for Natural Product Research and Infection Biology (Hans Knöll Institute), Jena, Germany
5. Department of Bioinformatics, Friedrich-Schiller-University, Jena, Germany
6. Research Group Applied Systems Biology, Leibniz Institute for Natural Product Research and Infection Biology (Hans Knöll Institute), Jena, Germany
7. Department of Clinical Chemistry and Laboratory Medicine, Jena University Hospital, Jena, Germany
8. Electron Microscopy Center, Jena University Hospital, Jena, Germany
9. Institute of Medical Microbiology, Jena University Hospital, Jena, Germany
10. Bloomsbury Institute of Intensive Care Medicine, University College London, London, UK
11. Research Group Microbial Immunology, Leibniz Institute for Natural Product Research and Infection Biology (Hans Knöll Institute), Jena, Germany
12. Friedrich-Schiller-University, Jena, Germany
Received 2017-12-23; Accepted 2018-4-16; Published 2018-6-13
Abstract

Rationale: The liver is a central organ not only for metabolism but also immune function. Life-threatening infections of both bacterial and fungal origin can affect liver function but it is yet unknown whether molecular changes differ depending on the pathogen. We aimed to determine whether the hepatic host response to bacterial and fungal infections differs in terms of hepatic metabolism and liver function.
Methods: We compared murine models of infection, including bacterial peritoneal contamination and infection (PCI), intraperitoneal and systemic C. albicans infection, at 6 and 24 h post-infection, to sham controls. The molecular hepatic host response was investigated by the detection of regulatory modules based on large-scale protein-protein interaction networks and expression data. Topological analysis of these regulatory modules was used to reveal infection-specific biological processes and molecular mechanisms. Intravital microscopy and immunofluorescence microscopy were used to further analyze specific aspects of pathophysiology such as cholestasis.
Results: Down-regulation of lipid catabolism and bile acid synthesis was observed after 6 h in all infection groups. Alterations in lipid catabolism were characterized by accumulation of long chain acylcarnitines and defective beta-oxidation, which affected metabolism by 6 h. While PCI led to an accumulation of unconjugated bile acids (BA), C. albicans infection caused accumulation of conjugated BA independent of the route of infection. Hepatic dye clearance and transporter expression revealed reduced hepatic uptake in fungal infections vs. defects in secretion following polybacterial infection.
Conclusion: Molecular phenotypes of lipid accumulation and cholestasis allow differentiation between pathogens as well as routes of infection at early stages in mice. Targeted metabolomics could be a useful tool for the profiling of infected/septic patients and the type of pathogen, with subsequent customization and targeting of therapy.
Keywords: sepsis, cholestasis, Candida albicans, metabolism, host response
Introduction
Sepsis is differentiated from uncomplicated infection by a dysregulated host response leading to organ dysfunction which carries high morbidity and mortality. Sepsis is commonly triggered by bacterial or fungal pathogens, with predominant organisms including Staphylococcus aureus (20.5%), Pseudomonas species (19.9%), Enterobacteriacae (mainly E. coli, 16.0%), and fungi (19%) [1]. Approximately 5-15% of nosocomial bloodstream infections are caused by invasive Candida strains, predominantly C. albicans [2, 3]. In clinical practice, systemic infections are usually treated in the first instance as bacterial, with antifungal treatment commenced concurrently only in high-risk patients (e.g., immunosuppressed), or belatedly on laboratory isolation of a likely fungal pathogen. However, the risk of infection by opportunistic pathogens such as Candida increases after antibacterial therapy [4]. Furthermore, disruption of the balance of gut-associated microbial communities by antibiotic treatment can deplete microbiota-derived metabolites, thereby enhancing host susceptibility to pathogens and impairing immune homeostasis [5].
Bacteria and fungi are fundamentally different organisms. Bacteria, regardless of their Gram status, are prokaryotic organisms that grow rapidly and have a high rate of mutagenesis. Inadequate clearance of bacteria may lead to an overwhelmed host. Bacteria contain many constituents that can trigger a host immune response through activation of pathogen recognition receptors. For example, Gram negative bacteria activate a Toll-like receptor 4-dependent immune response via lipopolysaccharide (endotoxin), while Gram positive bacteria activate Toll-like receptor 2 and NOD-like receptors via peptidoglycan and lipoteichoic acid [6, 7].
In contrast, Candida is a eukaryotic organism with gradual growth that is capable of growing as a unicellular yeast or as filamentous hyphae or pseudohyphae within its host [8]. It can colonize mucosal surfaces, but also grow invasively in tissue. Differential recognition of yeast and hyphal cells is considered key to the different immune responses elicited during colonization and invasion [9]. Various components of the outer and inner layer of the cell wall (e.g., mannans, glycoproteins, chitin, beta-glucan) can activate Toll-like receptors, C-type lectin reporters and NOD-like receptors to induce a host response [10, 11].
The liver plays a pivotal role in combating infection; its failure significantly worsens patient prognosis [12]. With its large number of macrophages (Kupffer cells), the liver represents the first line of defense against gut-derived pathogens due to drainage of the portal vein, the direct venous outflow from the intestine, into the liver [13]. In addition, it is a central metabolic organ. Beyond its synthetic capacity for secreted proteins and nutrition, including key proteins within the acute stress response, substances produced by the liver are absorbed by the gut and have a direct influence on the microbiota and barrier function. Obstruction of bile, for example, leads to microbial overgrowth, mucosal injury and, in some cases, translocation and systemic infection [14, 15]. This present work aims to elucidate differences in the metabolic host response to fungal and bacterial infection, and the effects of these infections on the host's liver function.
Methods
Animals
Animal studies and protocols were approved by the animal welfare legislation of the state of Thuringia. Animals were housed under specific pathogen-free conditions, a 12 h day/night cycle and 1 h dusk/dawn within the animal facility of the Jena University Hospital and the Hans-Knoell-Institute, Jena, Germany, with free access to food and water. During all invasive procedures and imaging methods, animals remained under deep general anesthesia. All surgical interventions were performed in a state of surgical tolerance of the animal in a semi-sterile environment using sterile equipment.
Systemic polymicrobial and fungal infection
Male, 17-20-week-old C57BL/6 mice were used for all infection models. For the polymicrobial sepsis model of PCI, mice were injected intraperitoneally with a microbiologically characterized human stool suspension [16] (1.2 μL/g body weight (BW)), which contains various aerobic and anaerobic gram-positive and gram-negative bacteria as well as trace amounts of C. albicans (Table S1). Candida albicans strains SC5314 and M137 (GFP expressing, for intravital microscopy) were used for fungal infection models. For candidemia (Ca i.v.), C. albicans was administered intravenously (2.5×10⁴ colony forming units (CFU)/g BW); for Candida peritonitis (Ca i.p.), C. albicans was injected intraperitoneally (5×10⁷ CFU/animal). 0.9% saline i.p. or i.v. was used for controls. At 6 or 24 h post-infection, animals were anesthetized, organs were harvested and plasma was processed immediately. Tissue and plasma were snap frozen in liquid nitrogen and stored at -80 °C.
RNA isolation and microarray analysis
Frozen liver tissue from the left median lobe was homogenized in lysis buffer from RNeasy Mini Kit (Qiagen, Hilden, Germany) with a pebble mill (QiaShredder, Qiagen) and further processed according to the manufacturer's instructions. RNA integrity was verified on the QIAxcel system (Qiagen). Total RNA was reversely transcribed and amplified using the TargetAmp-Nano Labeling Kit for Illumina Expression BeadChips (Epicentre, Madison, WI) according to the manufacturer's instructions. Samples were purified using the NucleoSpin RNA Clean-up system (Macherey-Nagel, Düren, Germany) and quantified using a NanoDrop spectrophotometer. Samples were hybridized on Illumina MouseRef-8-V2 Expression BeadChips (Illumina, San Diego, CA). For posthybridization data read-out and data preprocessing, iScan Control Software was used. Control probe quality check was performed using Illumina Genome Studio-Software.
Data pre-processing and analysis
Microarray data were background adjusted and normalized; for data analysis self-organizing maps (SOMs) were computed. Miniclusters of co-regulated single genes are represented by metagenes that share functional context. These genes were then processed into an expression cartography that allows easy distinction of global processes. Identification of regulatory modules was performed using ModuleDiscoverer [17], which identifies protein communities in large-scale protein-protein interaction networks. For a detailed description see supplementary information.
Metabolomics
6-fold (w/v) ethanol-phosphate-buffer (15% 0.01 M phosphate buffer solution pH 7.5, 85% ethanol) was added to pre-weighed liver tissue. Samples were homogenized in a pebble mill (QiaShredder) and centrifuged (5 min, 16000 ×g). The supernatant was used for quantification of 188 metabolites with the AbsoluteIDQ kit p180 (Biocrates Life Science AG, Innsbruck, Austria), as described [18]. Metabolite classes of amino acids and biogenic amines were quantified via LC-MS/MS; other metabolite groups were measured via flow injection analysis (FIA) and are considered semi-quantitative because standards were not available. Metabolite concentrations were log2 transformed and normalized to the mean of the control group. Further analysis was performed with the web-based tool MetaboAnalyst 3.0 [19]. Data were normalized by the autoscale method; one-way ANOVA with post-hoc Fisher's LSD test were used for statistical analysis. A heatmap with two-dimensional hierarchical clustering was performed using Euclidean distance and average algorithm.
Quantification of bile acids
Fifteen BA were determined in liver tissue lysates with an in-house assay. After protein precipitation and filtration, homogenized liver samples were loaded on an Agilent 1200 high performance liquid chromatography (LC) system (Agilent Technologies, Waldbronn, Germany) with a CTC-PAL autosampler coupled to an API 4000 Triple Quadrupole mass spectrometer with electrospray ionization source (AB Sciex, Darmstadt, Germany). All chromatographic separations were performed with a reverse-phase analytical column. The mobile phase consisted of water and methanol, both containing formic acid and ammonia acetate, at a total flow rate of 300 μL/min.
Confocal intravital microscopy
Intravital microscopy was performed after injection of amino-terminated DY‑635 (Dyomics, Jena, Germany) (70 pmol/g BW) i.v. and fixing the liver ex situ on the stage of a LSM-780 microscope (Zeiss, Oberkochen, Germany), as described previously [20]. Fluorescence images were acquired every 5 min for 60 min followed by a propidium iodide injection (i.v., 100 pmol). Different wavelength settings are summarized in Table S2. The intensities of DY‑635 and NAD(P)H autofluorescence were quantified by a customized image analysis algorithm as the medians of the corresponding channels in each image computed over the tissue (hepatocytic) area (see Supplementary Material for details). The integrated DY‑635 intensity was computed by averaging each time series.
Multidrug resistance-associated protein 2 (MRP2) staining
Frozen tissue slices were formalin-fixed and stained with a rabbit polyclonal MRP2 antibody (M8316 Sigma Aldrich, 1:500), secondary AlexaFluor 488 donkey anti-rabbit (Thermo Scientific, 1:1000), Alexa Fluor 568 conjugated Phalloidin (Thermo Scientific, 50 U/mL), mounted with VectaShield Mounting Media with DAPI (VectorLabs) and imaged on a confocal microscope (Zeiss LSM 780, see Supplementary Material for details). To quantify the MRP2 signal and its colocalization with F-Actin, the corresponding channels were segmented by a customized image analysis algorithm (see Supplementary Material for details). The areas of F-Actin and MRP2 positive regions were normalized by the total foreground (tissue) area. The overlap area was computed as the number of double positive pixels normalized by the foreground area.
Liver perfusion and transmission electron microscopy
Mice were infected with bacteria or C. albicans as described above. At 6 or 24 h, mice were anesthetized and the liver was perfused via the portal vein with Krebs-Henseleit buffer (2 mL/min for 4 min) followed by perfusion with fixative (4% w/v formaldehyde, 2.5% v/v glutaraldehyde in 100 mM sodium cacodylate buffer, pH 7.4) for 3 min. A slice from the center of the left median lobe was cut and placed in fixative for 24 h, then transferred to 100 mM sodium cacodylate buffer for intermediate storage. Preparation for transmission electron microscopy (TEM) was performed as described previously [21].
Results
To characterize the host response to bacterial and fungal infection, three different mouse models were used: a sepsis model of PCI for polymicrobial infection, and two Candida albicans infection models that differ in kinetics and pathogenesis for fungal infection. C. albicans injected intraperitoneally (Ca i.p.) leads to candida peritonitis whereas injected intravenously (Ca i.v.) leads to bloodstream infection and subsequent disseminated candidiasis [22, 23]. Since different pathogens and routes of infections were used, differences in disease progression and morbidity between groups cannot be completely eliminated. We addressed this by monitoring the hemogram, the phenotypical disease severity, and the pathogen load of each animal.
A decrease in white blood cells was found in nearly all animals (Figure S1); however, mean corpuscular hemoglobin and mean corpuscular hemoglobin concentration increased more with C. albicans infection compared to polymicrobial sepsis. A noticeable variance was seen in platelet count in all groups.
The score used by Gonnert et al. [16] was applied for phenotypical characterization and assessment of disease severity. PCI and Candida peritonitis led to early signs of illness at 6 h post-infection, whereas animals with candidemia still appeared clinically healthy. At 24 h post infection, both PCI and Ca i.v. had progressed to severe illness, while only some animals with Ca i.p. showed disease progression (Figure S2).
Pathogen load assessed at 6 and 24 h (Figure S3) was in accordance with previous results [16]. At both time points, aerobic (Escherichia coli) and anaerobic (Bacteroides spp.) bacteria (for PCI) or C. albicans (for fungal infection models) were present in blood, liver, spleen, kidney, lung, and brain with differing amounts of CFU. After 6 h, bacteria, regardless of their classification, were present in similar concentrations. For Ca i.p., CFU were mainly found in the spleen after 6 and 24 h, followed by liver, kidney and lung. Low levels were found in blood and brain in some animals only. Ca i.v. resulted in equal numbers of CFU in the liver, spleen, kidney and lung at 6 h. CFU levels in blood were similar to Ca i.p. After 24 h, CFU were predominantly found in kidney, followed by liver, spleen, lung and brain. Blood counts of C. albicans were low compared to other organs in all models.
Hepatic transcriptional responses to Candida infection and polymicrobial sepsis show different patterns
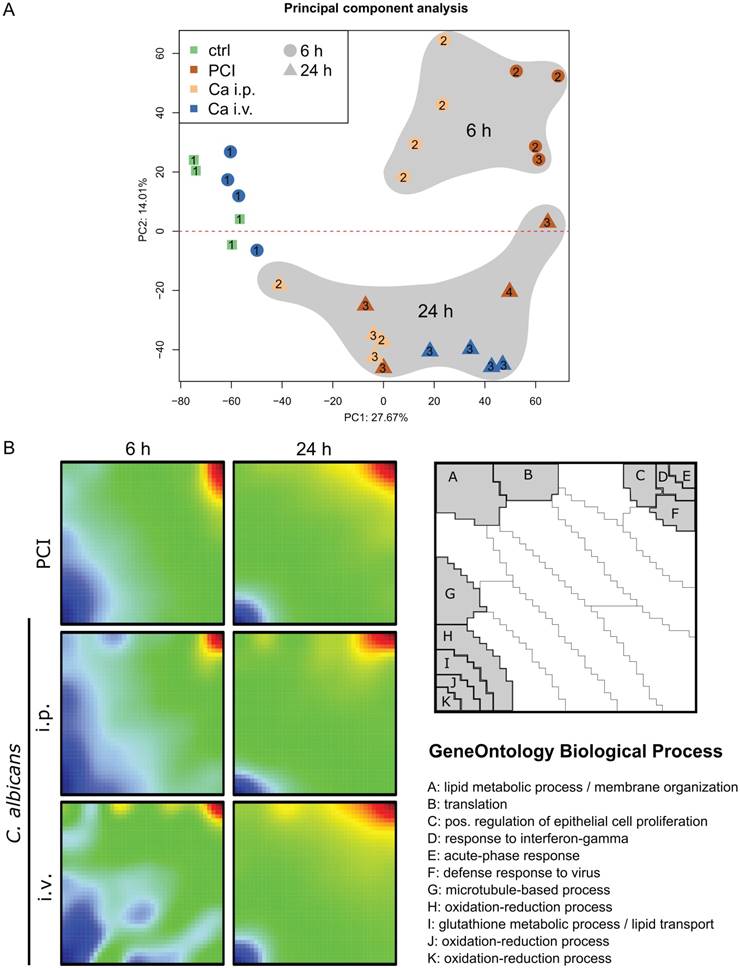
A transcriptomic approach was used to investigate the molecular hepatic host response to fungal and bacterial infection. Principal component analysis was applied to show general expression trends in the data. The first two principal components coincided with the time point of the sample (Figure 1A). The different peritonitis insults at 6 h clustered closely together, whereas Ca i.v. at 6 h was located near the control samples. The corresponding animals did not show any sign of illness and had the lowest clinical severity score of 1 (Figure S2). At 24 h, two distinct subgroups were seen in the PCI animals that correlated with disease severity. Comparative transcriptomic analysis of liver microarrays was performed by SOM-analysis (Figure 1B). The strongest effects in liver tissue were the down-regulation of oxidation-reduction processes and lipid metabolism, both being more pronounced in the early phase. The acute phase response was upregulated in all infection models at both timepoints, as was the cellular response to interferon-gamma, which was more pronounced 24 h after infection. Additionally, intraperitoneal C. albicans infection produced a downregulation of gene clusters associated with protein translation, lipid metabolic processes, and membrane organization, whereas these genes were upregulated in the intravenous Candida infection model at 6 h.
Comparative transcriptomic profiling revealed downregulation of hepatic metabolism regardless of infection type. (A) Principal Component (PC) analysis of expression data. The first PC captures differences between control and treatment groups; Candida i.v. at 6 h is similar to control. The second PC captures differences between 6 and 24 h timepoints. Approximately 42% of the variation in the data was captured by the first two PCs. Numbers indicate the respective Clinical Severity Score (CSS) of the animal. (B) Self-organizing map (SOM) shows a global expression cartography of upregulated (red) and downregulated (blue) metagenes representing miniclusters of co-regulated single genes that share functional context. All groups showed early downregulation of metabolic processes.
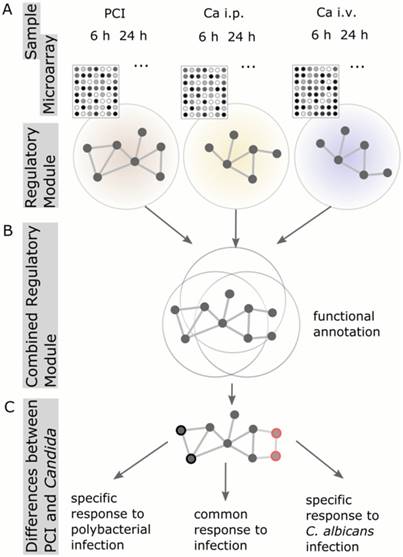
To analyze and characterize the cellular host response to infection on a molecular level, we identified regulatory modules. These modules are derived from known protein-protein-interaction networks, in conjunction with the information about differential expression from the microarray analysis (Figure 2). A regulatory module was computed for every model and route of infection independent of time. To observe infection-specific as well as common biological functions and pathways, we combined modules corresponding to the same type of infection. This generated a comprehensive network of biological processes involved in fungal and bacterial infection (Figure 3A). Small unconnected subnetworks are omitted; the cytoscape session of the entire regulatory module can be found in Supplementary Material.
Schematic workflow of Protein-Protein-Interaction Network analysis. (A) Regulatory modules were computed from microarray data for every model and time point individually. (B) All regulatory modules corresponding to the same model were combined to obtain a comprehensive network of biological processes. (C) Comparison of combined Candida modules to PCI modules resulted in the identification of proteins specific for PCI or Candida infection, respectively.
Identified regulatory network highlighting clusters of proteins with similar function. (A) Combined protein-protein-interaction networks from all treatment groups. The corresponding GO-category biological process is color-coded. Nodes that occur exclusively in PCI are outlined in black, nodes specific for Candida-infection are outlined in red. (B) Enlarged network associated with GO-term “response to ER-stress”. (C) Enlarged network associated with GO-term “serine family amino acid metabolic process”. (D) Enlarged network associated with GO-term “steroid biosynthetic process”. (E) Enlarged network associated with GO-term “small molecule metabolic process”.
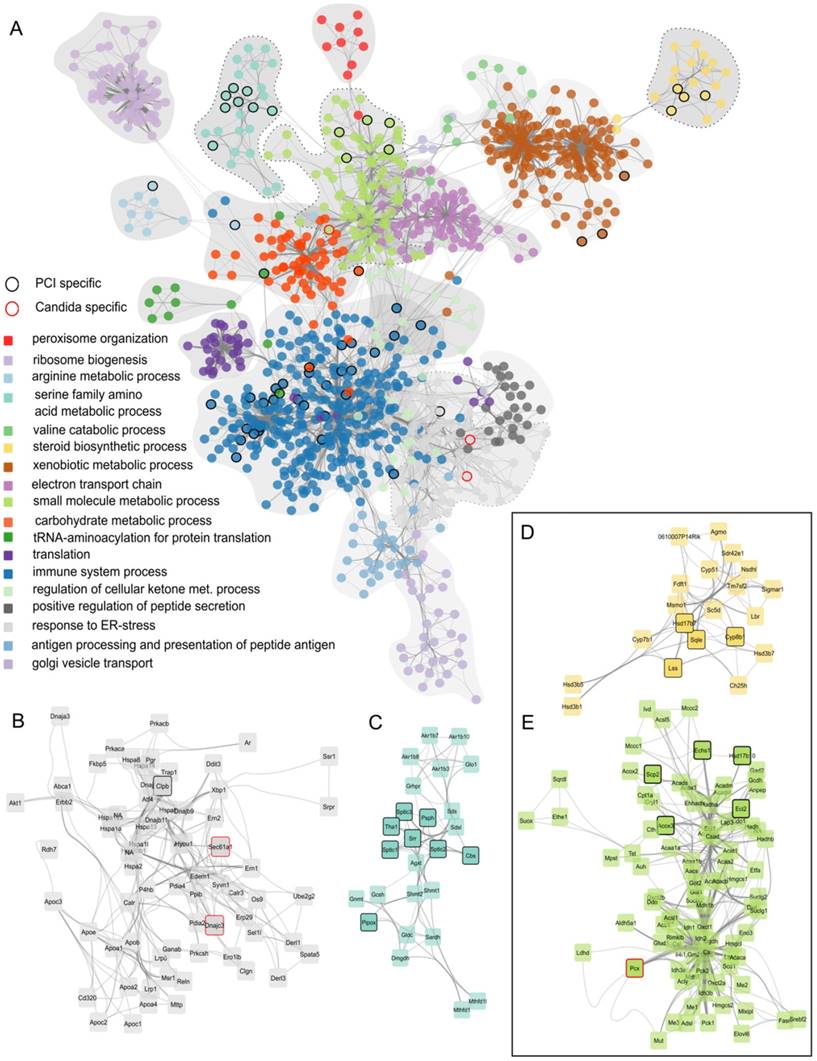
Finally, to identify differences between fungal and polybacterial infection, we compared C. albicans networks to PCI networks. Nodes were selected that were specific for C. albicans, i.e., those present in all C. albicans regulatory modules with the exception of Ca i.v. 6 h due to its similarity to control, but which did not appear in any regulatory module of PCI. Only 3 nodes were specific for C. albicans (enlarged sub-networks in Figure 3B, E). In contrast, 56 nodes were specific for polybacterial infection that did not appear in any C. albicans regulatory module. For example, PCI-specific nodes were found in the sub-networks associated with GeneOntology-category “immune system process” and “serine family amino acid metabolic process” (Figure 3C), “steroid biosynthetic process” (Figure 3D), and “small molecule metabolic processes” (Figure 3E). The latter two were of particular interest as they involve oxoacid metabolic processes, fatty acid beta-oxidation, and sterol- and lipid biosynthetic processes. These sub-networks depict effects in detail that were also seen as being overall down-regulated in the SOM analysis (Figure 1B) and which have a pivotal role for liver function. Since both subnetworks contain PCI-specific nodes, we hypothesized that the respective biological processes would also show differences at a functional level. Thus, we further investigated these biological processes to assess physiological consequences of the alteration in hepatic metabolism.
Hepatic lipid metabolism is dysregulated in C. albicans and polymicrobial infection
Since hypometabolism was very pronounced in transcriptomic data of all infection models, we investigated the metabolic profile from liver tissue lysates. The metabolome was evaluated by simultaneous detection and quantification of 188 metabolites via mass spectrometry. Of these, 180 metabolites were successfully detected and analyzed statistically, with 131 differing significantly from control or other infection groups. The metabolites were grouped into six different classes: acylcarnitines, amino acids, biogenic amines, glycerophospholipids, sphingolipids and sugars. Within these classes, different effects were observed for each infection model and timepoint compared to control (Table 1). In addition to the statistical analysis, an unsupervised hierarchical clustering was performed and visualized in a heat map, with a dendrogram showing the top 100 significant metabolites, including metabolites until p=0.009 (Figure S4). Acylcarnitines, amino acids and glycerophospholipids were dominated by kinetic effects with an increased percentage of differentially regulated metabolites from 6 h to 24 h (Table 1). Ten of the 21 measured amino acids significantly differed in Ca i.v. 24 h compared to control, with most being lower, in particular serine. Protein-protein-interaction network analysis also showed a cluster associated with “serine family amino acid metabolic process”, with several nodes specific for PCI (Figure 3A). However, the statistical significance of amino acids was low compared to other metabolites and expression levels of the corresponding genes were similar for Ca i.v. and PCI at 24 h.
Metabolite groups differ significantly between time and treatment. Metabolites were measured in liver tissue; all infection groups and timepoints were compared to control. Number and percent of significantly different metabolites are displayed for the respective metabolite group (ANOVA, Fisher's LSD, p-value < 0.05).
| PCI 6 h | PCI 24 h | Ca ip 6 h | Ca ip 24 h | Ca iv 6 h | Ca iv 24 h | |
|---|---|---|---|---|---|---|
| acylcarnitines | 13 (32.5%) | 22 (55.0%) | 6 (15.0%) | 21 (52.5%) | 3 (7.5%) | 15 (37.5%) |
| amino acids | 1 (4.8%) | 4 (19.0%) | 1 (4.8%) | 2 (9.5%) | 0 (0.0%) | 10 (47.6%) |
| biogenic amines | 6 (46.2%) | 6 (46.2%) | 8 (61.5%) | 4 (30.8%) | 4 (30.8%) | 8 (61.5%) |
| glycerophospho-lipids | 24 (26.7%) | 45 (50.0%) | 13 (14.4%) | 47 (52.2%) | 16 (17.8%) | 47 (52.2%) |
| sphingolipids | 4 (26.7%) | 6 (40.0%) | 8 (53.3%) | 6 (40.0%) | 5 (33.3%) | 6 (40.0%) |
| sugar/hexose | 1 (100%) | 1 (100%) | 1 (100%) | 1 (100%) | 0 (0.0%) | 1 (100%) |
Profound changes were observed within the acylcarnitine group, particularly at 24 h post-infection. For PCI and Ca i.p., this amounted to 55% and 52.5% of significant metabolites, and 37.5% for Ca i.v. As carnitines and acylcarnitines are essential compounds in fatty acid catabolism, these were studied in more detail in conjunction with the transcriptomic analysis.
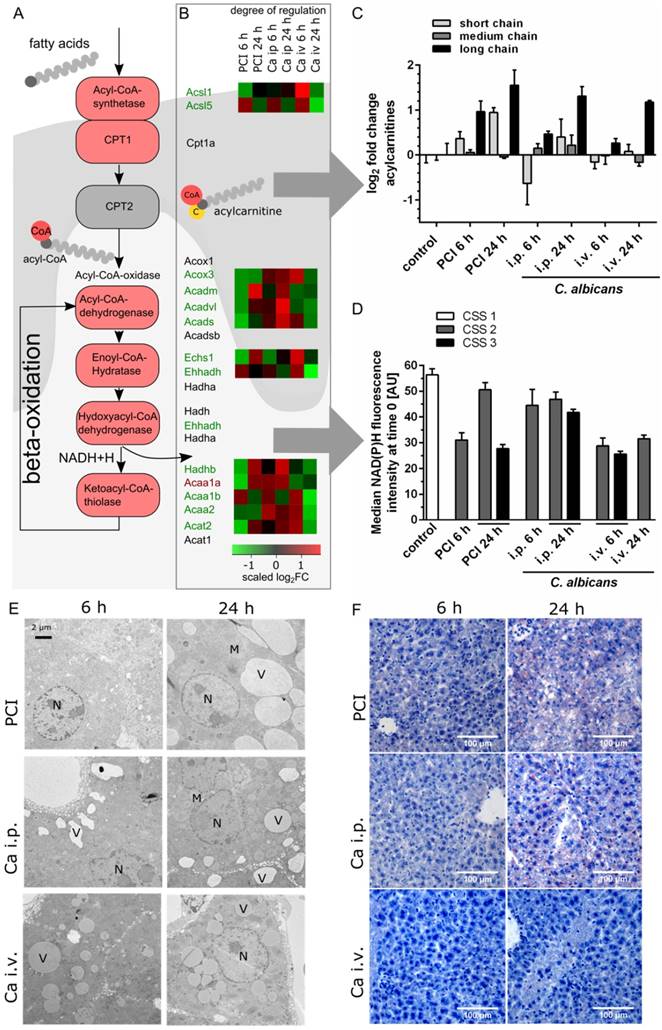
As illustrated in Figure 4A, fatty acids must be activated through acyl-Coenzyme A (CoA) synthase before their entry into the mitochondria. Medium- and long-chain-fatty acids require active transport via the carnitine shuttle. Inside the mitochondria, acyl-CoA is degraded via beta-oxidation and subsequently contributes to adenosine triphosphate production via cleavage of acetyl CoA and production of NADH and FADH2. Transcriptomic data revealed downregulation of the majority of corresponding genes (Figure 4B). A heat map shows the scaled relative changes between groups within this downregulation; most of the downregulation was seen in PCI at 6 h and Ca iv at 24 h. At the protein level, metabolomics showed a pronounced accumulation of different acylcarnitine chain lengths, as classified by Ikeda et al. [24] (Figure 4C). Compared to control, the amount of long-chain acylcarnitines was significantly increased in PCI at 6 h and 24 h, and in Ca i.p. and Ca i.v. at 24 h. While medium-chain acylcarnitines did not show a large effect, the amount of short-chain acylcarnitines was increased in PCI at 24 h, but decreased in Ca i.p. at 6 h. An accumulation of free carnitine was also seen in all groups at 24 h (Figure S4). This suggests an ineffective carnitine shuttle but does not explain why medium-chain acylcarnitines do not accumulate. More likely, the first step of β-oxidation, which is catalyzed by acyl-CoA-dehydrogenases, was affected. Acyl-CoA-dehydrogenases show different specificities for short-, medium- or long-chain fatty acid acyl-CoA substrates; accumulation of long-chain-acylcarnitines hints at defects in the enzyme specific for long and very long acylcarnitines. The effects on energy metabolism were visible by a decrease of NAD(P)H autofluorescence in liver tissue in vivo (Figure 4D).
Transcriptomics, metabolomics and microscopy revealed defects in lipid metabolism. (A) Schematic outline of fatty acid activation, transport and metabolism. Corresponding genes from the interaction network are depicted. (B) Genes involved in fatty acid degradation are overall downregulated; genes that are up- or downregulated in all groups are marked by a red or green gene symbol. A heat map shows the scaled relative changes within the downregulation. (C) Distribution of different acylcarnitine chain-length for all groups and timepoints. Values shown as Log2FC of the sum of short-chain (C2-C8), medium-chain (C6-C10) and long-chain (C14-C22) acylcarnitines, as classified by Ikeda et al. [24] (D) Effects on energy metabolism are depicted by NAD(P)H fluorescence in liver tissue at the first timepoint using time-lapse intravital imaging. Subgroups are separated by the respective clinical severity score (CSS) of the animals. (E) Representative electron micrographs demonstrating a morphologic assessment of liver ultrastructure. Pathogen and route of infection leads to different patterns of lipid accumulation. 3000x magnification (Nucleus (N), mitochondria (M), vesicles (V)). (F) Sudan III-staining of representative histological sections of murine liver depict tissue and lipid accumulation after PCI and C. albicans infection.
The defective lipid degradation had a severe impact on morphology since non-degraded lipids were stored within accumulating vesicles as seen by TEM and Sudan-3 staining (Figure 4E-F). Lipid droplets were observed 6 h post-infection, suggesting impaired degradation but increased shuttling and uptake. Of note, in all models lipids accumulated in vesicles but with very distinct features for the different models. At 6 h, a heterogeneous damage-pattern was seen in liver tissue that differed not only between individuals but also between microanatomical sites and the respective level of oxygenation. While the size of vesicles was comparable between perivenous and periportal zones, the number of vesicles was considerably higher at sites of low oxygen concentrations near the central vein (Figure S5). Perivenous regions of PCI at 6 h showed vesicles that were similar in size to the control, but significantly greater in number.
At 24 h, a more homogeneous and distinct pattern of vesicle accumulation was noted (Figure 4E). Vesicle counts had lower variance and similar numbers at the anatomical sites were observed. An exception was Ca i.p., where the perivenous amount was noticeably higher, though possibly counterbalanced by a greater periportal vesicle perimeter (Figure S5). In PCI livers, cells were filled with large vesicles at 24 h. Cell-cell-junctions were partly disrupted and bile canaliculi had less or no microvilli (data not shown). Ca i.v. at 24 h resulted in medium-sized vesicles that appeared darker under TEM. Ca i.p. also produced medium-sized vesicles that were distinctly located at the cell borders. Canalicular brush borders and cell-cell-connectivity did not appear to be affected by Ca i.p. or i.v. infection.
C. albicans infection leads to early conjugation and excretion failure
Changes in sterol and lipid biosynthetic processes were observed in microarray and protein-protein-interaction network analysis; consequently, we investigated changes in the biotransformation of endobiotics in the liver during fungal and polymicrobial infection. As depicted in Figure 5A, BA are processed in an enterohepatic cycle. They are produced in hepatocytes, and are conjugated to taurine and subsequently secreted into the bile, where they enter the gut.
Bile acid synthesis, conjugation and secretion are distinct for PCI and Candida infection. (A) Schematic outline of bile synthesis, conjugation and export. CA: cholic acid; CDCA: chenodeoxycholic acid; DCA: deoxycholic acid; LCA: lithocholic acid; GCA: glycocholic acid; TCA: taurocholic acid; TCDCA: taurochenodeoxycholic acid; TDCA: taurodeoxycholic acid; TLCA: taurolithocholic acid; TUDCA: tauroursodeoxycholic acid; BAAT: bile acid-CoA:amino acid n-acyltransferase. (B) Genes involved in primary bile synthesis are overall downregulated; genes downregulated in all groups are marked by a green gene symbol. A heat map shows scaled relative changes within the downregulation. (C) Relative change in conjugated and unconjugated bile acids and (D) respective conjugation index of bile acids. (E) Immunostaining of MRP2 in liver tissue (white). MRP2 is localized at the cell membrane and linked to the cytoskeleton (F-actin, purple). (F) Quantification of MRP2-stained areas and overlap areas with F-actin (Figure S6) at 20x magnification depict the loss of membrane-associated MRP2 protein leading to cholestasis.
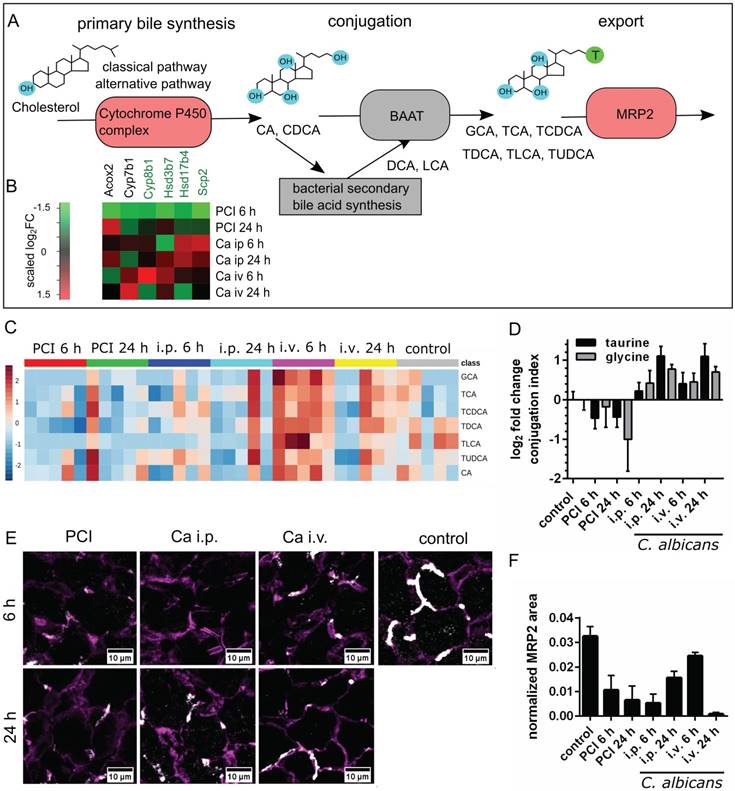
Transcriptomic data showed that the majority of genes associated with primary bile synthesis were downregulated (Figure 5B). The heatmap of the associated genes showed the scaled relative changes between groups within this downregulation. It revealed that the downregulation was most pronounced for PCI 6 h.
Metabolic analysis of unconjugated and conjugated BA via mass spectrometry revealed differences in biotransformation and bile uptake (Figure 5C-D). Bacterial sepsis led to an accumulation of unconjugated BA, as indicated by the negative conjugation index compared to control. In contrast, an increase in conjugated bile acid concentration was observed with fungal infections. Formation of unconjugated BA from sterols are catalyzed by bile acid-CoA thioesterases, while conjugation with taurine or glycine is facilitated by bile acid-CoA:amino acid N-acyltransferases. Both reactions take place in peroxisomes (primary BA) and cytosol (secondary BA). Conjugation facilitates secretion into bile [25], lowers the acid dissociation constant and thereby prevents their precipitation within the upper intestinal environment. This enables BA to act as a detergent for dietary lipids within the intestine and to detoxify hydrophobic BA. Hence, accumulation of unconjugated BA may become hepatotoxic.
Besides impaired conjugation, the uptake and excretion of BA into hepatic canaliculi present further steps in the biotransformation that can lead to cholestasis when impaired. We therefore analyzed the membrane localization of MRP2, a canalicular transporter for BA and bilirubin-conjugates. Although no significant changes were observed at the transcriptional level, MRP2 was reduced (Figure 5E-F).
To elucidate the extent uptake and excretion were impaired, clearance of DY‑635, a dye taken up and secreted by hepatocytes into the bile, was investigated using time-lapse confocal intravital microscopy (Figure 6). The resulting images were assessed by visual interpretation of anatomical structures, and dye accumulation was quantified via automated image analysis by integrating DY-635 intensities over time. Since DY‑635 massively diffuses and accumulates within cells without an intact cell membrane, these areas were excluded as outliers by computing the median of the DY-635 intensity in the tissue in each field of view. The accumulation of DY‑635 in hepatocytes in polymicrobial sepsis at 24 h was evident both from an increase of integrated fluorescence intensity and from visual inspection of images, where no obvious excretion into bile ducts was observed. In both C. albicans infection models, an initial decrease in hepatocyte DY‑635 fluorescence was observed. At the sinusoidal-hepatic interface there was accumulation of dye at the borders of the hepatocytes, indicating decreased dye uptake. However, at 24 h an increase in DY‑635 fluorescence was also observed in C. albicans infection models.
Intravital microscopy shows early pre-hepatic dysfunction for C. albicans infection. Murine liver tissue is depicted by NAD(P)H autofluorescence (blue); DY‑635 accumulation and excretion are depicted 60 min after injection (yellow). Scale bars = 100 µm. Stars indicate dead cells (verified by post-experimental propidium iodide staining); arrowheads indicate pre-hepatic dye accumulation. Intensities of DY‑635 were analyzed by a customized image analysis algorithm. Tissue DY‑635 signal was integrated over 60 min to assess liver function by means of DY‑635 uptake and elimination. Subgroups are separated by their respective clinical severity score (CSS).
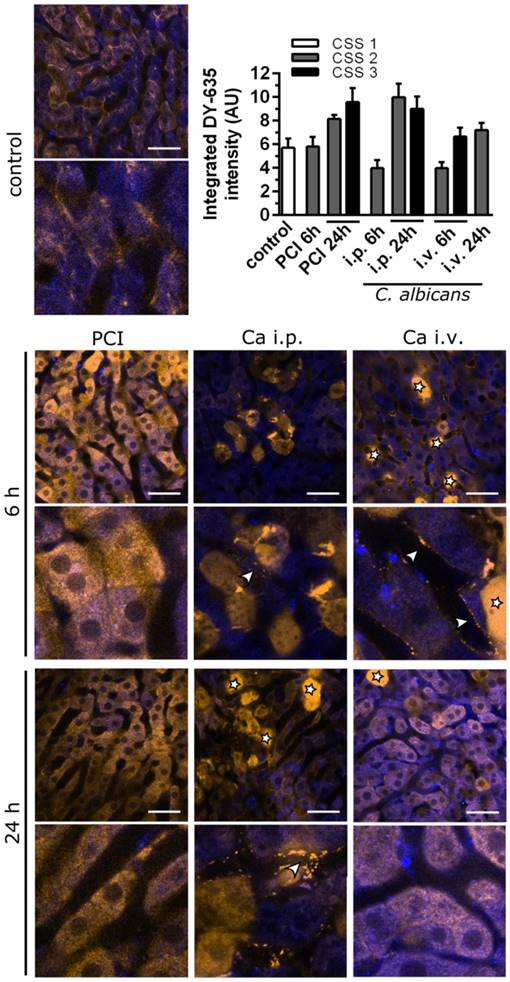
Thus, C. albicans infection resulted in an initial pre-hepatic accumulation of xenobiotics and predominantly, but not exclusively, glycine-conjugated BA. The depicted pattern of the metabolomic profile and intravital microscopic observation during polymicrobial sepsis, by contrast, showed early conjugation and excretion failure in hepatocytes leading to an intrahepatic accumulation of endo- and xenobiotics with subsequent cholestatic manifestations. Within the time course of the study, this initial accumulation of conjugated BA appeared to be overwhelmed by hepatic damage caused by the fungus, with subsequent fulminant hepatic excretory failure.
Discussion
Excretory dysfunction and jaundice reflect poor prognostic events in patients presenting with infection. For liver cirrhosis, differing levels of plasma lipids and lipoproteins can distinguish etiology, e.g., alcoholic or viral origin [26]. Severity of cirrhosis can also be monitored by serum metabolomics [27]. Similarly, different stages of liver fibrosis can be distinguished by their metabolomic fingerprint [28].
Little is known about the metabolomic phenotype of the host response to infection, in particular depending on different pathogens. Previously observed transcriptomic changes in comparable models of invasive Candida infections were dominated by a strong induction of the innate immune response [29]. In our study, we observed similar effects, as well as a significant reduction in overall metabolic activity and downregulation of oxidation-reduction processes with disease progression. Metabolic changes during sepsis have been discussed in recent reviews [30]. For instance, it has been shown in a rat model of sepsis with survivor/non-survivor-discrimination that predicted non-survivors displayed strong downregulation of fatty acid metabolism, amino acid metabolism and bile acid synthesis already after 6 h when compared to naïve or sham-treated animals, whereas predicted survivors showed less or no downregulation. Hence, the severity of the metabolic changes is related to outcome [21]. In these studies phosphatidylinositol 3-kinase-dependent signaling was proposed as crucial mediator of liver dysfunction and metabolic changes between predicted survivors and non-survivors. Regardless of the underlying signaling, many of the altered metabolite classes might affect the course of infection themselves (e.g., fatty acids, bile acids).
In conjunction with the literature, we observed changes in fatty acid metabolism, especially an increase of long chain acylcarnitines, leading to early deficits in energy metabolism and accumulation of lipid vesicles within hepatocytes. Fatty acid metabolism and other metabolic processes follow the oxygen gradient along the porto-central axis. Fatty acid oxidation takes place at higher rates in periportal hepatocytes, where oxygen concentration is higher [31]. Katz et al. [32] reported higher activity of carnitine palmitoyltransferase-1, a key enzyme of the carnitine shuttle. The cytoplasmic fatty-acid-binding protein 1, which is involved in intracellular lipid transport, is also increased in the periportal zones [33, 34]. This suggests a higher uptake and utilization of fatty acids by periportal hepatocytes. In contrast, perivenous hepatocytes show both higher activities and a greater presence of the lipogenic enzymes acetyl-CoA carboxylase and adenosine triphosphate citrate lyase [32], as well as higher rates of very low density lipoprotein synthesis [35]. In the early phase of infection, there was major accumulation of lipid vesicles, predominantly in perivenous areas. Thus, cells that show lower rates of fatty acid oxidation may be easily affected by imbalances in lipid homeostasis with fatty acid synthesis upregulated in turn. Similar patterns of lipid accumulation were described in a rat model of alcoholic fatty liver disease, where ethanol feeding caused a selective deposition of triglycerides and reduced very low density lipoprotein secretion in pericentral hepatocytes [36].
After 24 h, lipid accumulation and damage appeared to be independent from liver zonation and it became a global phenomenon. Different patterns of lipid deposition were seen between C. albicans infection models and the polymicrobial sepsis model. Accumulation of lipid vesicles may have various causes. Increased influx of fatty acid may be due to an increase in free fatty acids related to increased lipolysis. Decreased efflux of fatty acids can also occur if β-oxidation is decreased and/or very low density lipoprotein transport is disturbed. As indicated by the metabolomic and transcriptomic analyses, lipid accumulation is likely driven by defective β-oxidation. Differential deposition pattern of lipid droplets may be influenced by the differing expression of apolipoproteins and phosphatidylcholines. Both enable very low density lipoprotein assembly and secretion and could facilitate compensatory mechanisms in Candida models. The type of accumulating lipids may also play a central role for disease progression, as triglycerides are discussed to be counter protection against lipid induced toxicity, whereas free fatty acids may be important mediators of toxicity [37].
During severe infection, defective β-oxidation, which might occur in oxygen rich zones of the liver, may be a key feature. Due to inadequate oxygen supply to the liver during sepsis, liver zonation is shifted towards low oxygen zones, or even lost completely [38]. A long-term septic model in rats showed an early decline in tissue oxygenation especially in the liver, the degree of which related to poor prognosis [39]. A shift in liver zonation also implicates a shift of metabolic zones, reducing fatty acid oxidation in favor of lipo- and ketogenesis. This may happen due to reduced perfusion or an imbalance of the corresponding signaling pathways of HIF1α and β-catenin, which have been shown to be responsible for maintenance of the complex liver zonation and functional organization [31, 40].
Our data also depict different patterns of liver dysfunction depending on the pathogen, and the route of infection in the case of Candida infection. Unconjugated BA accumulated in polybacterial sepsis whereas C. albicans infection led to an accumulation of conjugated BA. C. albicans infection also caused accumulation of the hepatic-eliminated dye DY‑635 at the basolateral pole of the hepatocytes within the sinusoids, indicating a basolateral liver dysfunction.
BA are increased in plasma of patients with critical illnesses [41]. In contrast to our data, human post-mortem liver biopsies from septic patients showed elevated levels of conjugated BA, although the underlying pathogen was not determined [42]. Besides a differential expression of bile transporters, other mechanisms influence the obstruction of BA. For instance, a loss of contractile activity in actin and myosin microfilaments leads to reduced transport of BA through the canalicular route [43, 44]. This subsequently leads to bile ducts paralysis, distension, and bile secretory failure observed in septic shock patients and after long-term treatment in the intensive care unit, and is associated with severe morbidity [45, 46]. In an animal model, fasting during the course of illness induced a shift from unconjugated to conjugated circulating BA [47].
Bile acids are known to be cytotoxic, they can induce apoptosis and necrosis by damage to mitochondria [48, 49], and they are also danger-associated molecular patterns (DAMPs) that activate inflammatory macrophages [50]. The importance of BA for the control of the intestinal microbiome was recently highlighted [51]. Obstruction of BA due to liver failure and chronic infection may contribute to chronic gut barrier failure and impaired regeneration by the host and, in turn, enable translocation of microorganisms and secondary infections.
The present study elucidates differences and similarities of the hepatic host response to different pathogens. Molecular phenotypes allowed clear differentiation between polymicrobial and fungal infection, already at an early stage. Early differences in metabolites, lipid accumulation and liver failure characterized by heterogeneous liver damage have also been demonstrated in this study, suggesting the need for a broader assessment of hepatic metabolism. Specific metabolites are altered in septic patients and were recently employed to distinguish inflammatory response, route of infection and outcome despite the heterogeneity of this patient group [18, 52]. An Increase in acylcarnitines could be measured in samples of septic non-survivors [53-55], whereas a rise of linoleic acid was associated with effective treatment [56]. Nevertheless, patients with fungal infections were not included in these studies. This is a challenging clinical need but of increasing interest in the light of precision medicine during systemic infections of different origin. Targeted metabolomics are an emerging field and can be used to diagnose or assess stages and severity of different liver diseases such as cirrhosis [26, 27] and fibrosis [28]. We herein demonstrate that liver pathophysiology leads to distinct metabolomic fingerprint in sepsis due to the type and route of the pathogen and could be a useful tool for profiling of patients and subsequent customization and targeting of therapy.
Abbreviations
BA: bile acids; BW: body weight; Ca i.p.: C. albicans injected intraperitoneally, Candida peritonitis; Ca i.v.: C. albicans injected intravenously, Candidemia; CFU: colony forming units; CoA: Coenzyme A; MRP2: Multidrug resistance-associated protein 2; PCI: peritoneal contamination and infection; SOMs: self-organizing maps; TEM: transmission electron microscopy.
Acknowledgements
We gratefully thank Sascha Brunke for providing C. albicans M137 strain, Jacqueline Fischer, Birgit Schikowski and Birgit Weber for their support during animal experiments and Brigitte Specht for experimental assistance with the immunofluorescence stainings.
This study has been supported by DFG-funded Collaborative Research Center/Transregio 124 FungiNet (Project C5 and Project B4) as well as the Federal Ministry of Education and Research in Germany (Project: smart-dye-livery, 13N13416).
Supplementary Material
Supplementary methods, figures and tables.
Competing Interests
The authors have declared that no competing interest exists.
References
1. Vincent JL, Rello J, Marshall J, Silva E, Anzueto A, Martin CD. et al. International study of the prevalence and outcomes of infection in intensive care units. JAMA. 2009;302:2323-9
2. Yapar N. Epidemiology and risk factors for invasive candidiasis. Therapeutics and clinical risk management. 2014;10:95-105
3. Duggan S, Leonhardt I, Hunniger K, Kurzai O. Host response to Candida albicans bloodstream infection and sepsis. Virulence. 2015;6:316-26
4. Otto GP, Sossdorf M, Claus RA, Rodel J, Menge K, Reinhart K. et al. The late phase of sepsis is characterized by an increased microbiological burden and death rate. Critical care (London, England). 2011;15:R183
5. Lopez CA, Kingsbury DD, Velazquez EM, Baumler AJ. Collateral damage: microbiota-derived metabolites and immune function in the antibiotic era. Cell host & microbe. 2014;16:156-63
6. Takeuchi O, Hoshino K, Kawai T, Sanjo H, Takada H, Ogawa T. et al. Differential roles of TLR2 and TLR4 in recognition of gram-negative and gram-positive bacterial cell wall components. Immunity. 1999;11:443-51
7. Ferwerda G, Kramer M, de Jong D, Piccini A, Joosten LA, Devesaginer I. et al. Engagement of NOD2 has a dual effect on proIL-1beta mRNA transcription and secretion of bioactive IL-1beta. European journal of immunology. 2008;38:184-91
8. Romani L, Bistoni F, Puccetti P. Adaptation of Candida albicans to the host environment: the role of morphogenesis in virulence and survival in mammalian hosts. Current opinion in microbiology. 2003;6:338-43
9. Gow NA, van de Veerdonk FL, Brown AJ, Netea MG. Candida albicans morphogenesis and host defence: discriminating invasion from colonization. Nature reviews Microbiology. 2011;10:112-22
10. Netea MG, Brown GD, Kullberg BJ, Gow NA. An integrated model of the recognition of Candida albicans by the innate immune system. Nature reviews Microbiology. 2008;6:67-78
11. Romani L. Immunity to fungal infections. Nature reviews Immunology. 2011;11:275-88
12. Kramer L, Jordan B, Druml W, Bauer P, Metnitz PG. Incidence and prognosis of early hepatic dysfunction in critically ill patients-a prospective multicenter study. Critical care medicine. 2007;35:1099-104
13. Son G, Kremer M, Hines IN. Contribution of gut bacteria to liver pathobiology. Gastroenterology Research and Practice. 2010;2010:13
14. Deitch EA, Sittig K, Li M, Berg R, Specian RD. Obstructive jaundice promotes bacterial translocation from the gut. American journal of surgery. 1990;159:79-84
15. Berg RD. Bacterial translocation from the gastrointestinal tract. Advances in experimental medicine and biology. 1999;473:11-30
16. Gonnert FA, Recknagel P, Seidel M, Jbeily N, Dahlke K, Bockmeyer CL. et al. Characteristics of clinical sepsis reflected in a reliable and reproducible rodent sepsis model. The Journal of surgical research. 2011;170:e123-34
17. Vlaic S, Conrad T, Tokarski-Schnelle C, Gustafsson M, Dahmen U, Guthke R. et al. ModuleDiscoverer: Identification of regulatory modules in protein-protein interaction networks. Sci Rep. 2018;8:433
18. Schmerler D, Neugebauer S, Ludewig K, Bremer-Streck S, Brunkhorst FM, Kiehntopf M. Targeted metabolomics for discrimination of systemic inflammatory disorders in critically ill patients. Journal of lipid research. 2012;53:1369-75
19. Xia J, Wishart DS. Using MetaboAnalyst 3.0 for comprehensive metabolomics data analysis. Current protocols in bioinformatics. 2016;55:14.10.1-10.91
20. Press AT, Traeger A, Pietsch C, Mosig A, Wagner M, Clemens MG. et al. Cell type-specific delivery of short interfering RNAs by dye-functionalised theranostic nanoparticles. Nature communications. 2014;5:5565
21. Recknagel P, Gonnert FA, Westermann M, Lambeck S, Lupp A, Rudiger A. et al. Liver dysfunction and phosphatidylinositol-3-kinase signalling in early sepsis: experimental studies in rodent models of peritonitis. PLoS medicine. 2012;9:e1001338
22. Kretschmar M, Hube B, Bertsch T, Sanglard D, Merker R, Schroder M. et al. Germ tubes and proteinase activity contribute to virulence of Candida albicans in murine peritonitis. Infection and immunity. 1999;67:6637-42
23. Maccallum DM. Hosting infection: experimental models to assay Candida virulence. International journal of microbiology. 2012;2012:363764
24. Ikeda Y, Okamura-Ikeda K, Tanaka K. Purification and characterization of short-chain, medium-chain, and long-chain acyl-CoA dehydrogenases from rat liver mitochondria. Isolation of the holo- and apoenzymes and conversion of the apoenzyme to the holoenzyme. The Journal of biological chemistry. 1985;260:1311-25
25. Vessey DA, Whitney J, Gollan JL. The role of conjugation reactions in enhancing biliary secretion of bile acids. The Biochemical journal. 1983;214:923-7
26. Chrostek L, Supronowicz L, Panasiuk A, Cylwik B, Gruszewska E, Flisiak R. The effect of the severity of liver cirrhosis on the level of lipids and lipoproteins. Clinical and Experimental Medicine. 2014;14:417-21
27. Zheng H, Chen M, Lu S, Zhao L, Ji J, Gao H. Metabolic characterization of hepatitis B virus-related liver cirrhosis using NMR-based serum metabolomics. Metabolomics. 2017;13:121
28. Cano A, Mariño Z, Millet O, Martínez-Arranz I, Navasa M, Falcón-Pérez JM. et al. A metabolomics signature linked to liver fibrosis in the serum of transplanted hepatitis C patients. Scientific Reports. 2017;7:10497
29. Hebecker B, Vlaic S, Conrad T, Bauer M, Brunke S, Kapitan M. et al. Dual-species transcriptional profiling during systemic candidiasis reveals organ-specific host-pathogen interactions. Scientific Reports. 2016;6:36055
30. Eckerle M, Ambroggio L, Puskarich MA, Winston B, Jones AE, Standiford TJ. et al. Metabolomics as a driver in advancing precision medicine in sepsis. Pharmacotherapy. 2017;37:1023-32
31. Birchmeier W. Orchestrating Wnt signalling for metabolic liver zonation. Nat Cell Biol. 2016;18:463-5
32. Katz NR, Fischer W, Giffhorn S. Distribution of enzymes of fatty acid and ketone body metabolism in periportal and perivenous rat-liver tissue. European journal of biochemistry. 1983;135:103-7
33. Bass NM, Barker ME, Manning JA, Jones AL, Ockner RK. Acinar heterogeneity of fatty acid binding protein expression in the livers of male, female and clofibrate-treated rats. Hepatology (Baltimore, Md). 1989;9:12-21
34. Suzuki T, Ono T. Immunohistochemical studies on the distribution and frequency of fatty-acid-binding protein positive cells in human fetal, newborn and adult liver tissues. The Journal of pathology. 1987;153:385-94
35. Guzman M, Castro J. Zonation of fatty acid metabolism in rat liver. The Biochemical journal. 1989;264:107-13
36. Guzman M, Castro J. Zonal heterogeneity of the effects of chronic ethanol feeding on hepatic fatty acid metabolism. Hepatology (Baltimore, Md). 1990;12:1098-105
37. Alkhouri N, Dixon LJ, Feldstein AE. Lipotoxicity in nonalcoholic fatty liver disease: Not all lipids are created equal. Expert review of gastroenterology & hepatology. 2009;3:445-51
38. Ellenberg M, Osserman KE. The role of shock in the production of central liver cell necrosis. The American journal of medicine. 1951;11:170-8
39. Dyson A, Rudiger A, Singer M. Temporal changes in tissue cardiorespiratory function during faecal peritonitis. Intensive Care Medicine. 2011;37:1192-200
40. Kietzmann T. Metabolic zonation of the liver: The oxygen gradient revisited. Redox Biology. 2017;11:622-30
41. Jenniskens M, Langouche L, Vanwijngaerden Y-M, Mesotten D, Van den Berghe G. Cholestatic liver (dys)function during sepsis and other critical illnesses. Intensive Care Medicine. 2016;42:16-27
42. Vanwijngaerden YM, Wauters J, Langouche L, Vander Perre S, Liddle C, Coulter S. et al. Critical illness evokes elevated circulating bile acids related to altered hepatic transporter and nuclear receptor expression. Hepatology (Baltimore, Md). 2011;54:1741-52
43. Koskinas J, Gomatos IP, Tiniakos DG, Memos N, Boutsikou M, Garatzioti A. et al. Liver histology in ICU patients dying from sepsis: A clinico-pathological study. World Journal of Gastroenterology: WJG. 2008;14:1389-93
44. Trauner M, Meier PJ, Boyer JL. Molecular pathogenesis of cholestasis. The New England journal of medicine. 1998;339:1217-27
45. Jaeger C, Mayer G, Henrich R, Gossner L, Rabenstein T, May A. et al. Secondary sclerosing cholangitis after long-term treatment in an intensive care unit: clinical presentation, endoscopic findings, treatment, and follow-up. Endoscopy. 2006;38:730-4
46. Kulaksiz H, Heuberger D, Engler S, Stiehl A. Poor outcome in progressive sclerosing cholangitis after septic shock. Endoscopy. 2008;40:214-8
47. Vanwijngaerden Y-M, Langouche L, Derde S, Liddle C, Coulter S, van den Berghe G. et al. Impact of parenteral nutrition versus fasting on hepatic bile acid production and transport in a rabbit model of prolonged critical illness. Shock. 2014;41:48-54
48. Attili AF, Angelico M, Cantafora A, Alvaro D, Capocaccia L. Bile acid-induced liver toxicity: Relation to the hydrophobic-hydrophilic balance of bile acids. Medical Hypotheses. 1986;19:57-69
49. Palmeira CM, Rolo AP. Mitochondrially-mediated toxicity of bile acids. Toxicology. 2004;203:1-15
50. Hao H, Cao L, Jiang C, Che Y, Zhang S, Takahashi S. et al. Farnesoid X receptor regulation of the NLRP3 inflammasome underlies cholestasis-associated sepsis. Cell Metabolism. 2017;25:856-67.e5
51. Wahlström A, Sayin Sama I, Marschall H-U, Bäckhed F. Intestinal crosstalk between bile acids and microbiota and its impact on host metabolism. Cell Metabolism. 2016;24:41-50
52. Neugebauer S, Giamarellos-Bourboulis EJ, Pelekanou A, Marioli A, Baziaka F, Tsangaris I. et al. Metabolite profiles in sepsis: developing prognostic tools based on the type of infection. Critical care medicine. 2016;44:1649-62
53. Fanos V, Caboni P, Corsello G, Stronati M, Gazzolo D, Noto A. et al. Urinary (1)H-NMR and GC-MS metabolomics predicts early and late onset neonatal sepsis. Early human development. 2014;90(Suppl 1):S78-83
54. Kamisoglu K, Haimovich B, Calvano SE, Coyle SM, Corbett SA, Langley RJ. et al. Human metabolic response to systemic inflammation: assessment of the concordance between experimental endotoxemia and clinical cases of sepsis/SIRS. Critical care (London, England). 2015;19:71
55. Langley RJ, Tsalik EL, van Velkinburgh JC, Glickman SW, Rice BJ, Wang C. et al. An integrated clinico-metabolomic model improves prediction of death in sepsis. Science translational medicine. 2013;5:195ra95
56. Antti H, Fahlgren A, Nasstrom E, Kouremenos K, Sunden-Cullberg J, Guo Y. et al. Metabolic profiling for detection of Staphylococcus aureus infection and antibiotic resistance. PloS one. 2013;8:e56971
Author contact
![]() Corresponding authors: Adrian T. Press, Department of Anesthesiology and Intensive Care Medicine, Jena University Hospital, Am Klinikum 1, 07747 Jena. Phone: +49 3641 9 323139; Fax: +49 3641 932 33 62; adrian.pressuni-jena.de and Michael Bauer, Department of Anesthesiology and Intensive Care Medicine, Jena University Hospital, Am Klinikum 1, 07747 Jena. Phone: +49 3641 9323101; Fax: +49 3641 9323102; michael.baueruni-jena.de
Corresponding authors: Adrian T. Press, Department of Anesthesiology and Intensive Care Medicine, Jena University Hospital, Am Klinikum 1, 07747 Jena. Phone: +49 3641 9 323139; Fax: +49 3641 932 33 62; adrian.pressuni-jena.de and Michael Bauer, Department of Anesthesiology and Intensive Care Medicine, Jena University Hospital, Am Klinikum 1, 07747 Jena. Phone: +49 3641 9323101; Fax: +49 3641 9323102; michael.baueruni-jena.de