Impact Factor
- Issue 14; 2026
- Issue 13; 2026
- Issue 12; 2026
- Issue 11; 2026
- Issue 10; 2026
- Volume 16; 2026
- Advance Articles
- Past Issues
- Cover Images
- Cover Suggestion
- Index & Coverage
- Special Issues
Introduction
Methods
Results
Discussion
Abbreviations
Acknowledgements
Supplementary Material
References
International Journal of Biological Sciences
International Journal of Medical Sciences
 Global reach, higher impact

Theranostics 2018; 8(14):3902-3917. doi:10.7150/thno.24444 This issue Cite
Research Paper
Profiling the circulating miRnome reveals a temporal regulation of the bone injury response
Andreia M. Silva1,2, Maria I. Almeida1, José H. Teixeira1,2, Cristina Ivan3, Joana Oliveira1,2,4, Daniel Vasconcelos1,2, Nuno Neves1,5, Cláudia Ribeiro-Machado1, Carla Cunha1, Mário A. Barbosa1,2, George A. Calin3,6, Susana G. Santos1, ![]()
1. i3S - Instituto de Investigação e Inovação em Saúde, INEB - Instituto de Engenharia Biomédica, Universidade do Porto, Porto, Portugal.
2. ICBAS - Instituto de Ciências Biomédicas Abel Salazar, Universidade do Porto, Porto, Portugal.
3. Department of Experimental Therapeutics, The University of Texas MD Anderson Cancer Center, Houston, Texas, USA.
4. FEUP - Faculdade de Engenharia da Universidade do Porto, Porto, Portugal.
5. FMUP - Faculdade de Medicina da Universidade do Porto, Departamento de Cirurgia, Serviço de Ortopedia, Porto, Portugal.
6. Center for RNA Interference and Non-Coding RNAs, The University of Texas MD Anderson Cancer Center, Houston, Texas, USA.
Received 2017-12-19; Accepted 2018-4-11; Published 2018-6-24
Abstract

Bone injury healing is an orchestrated process that starts with an inflammatory phase followed by repair and remodelling of the bone defect. The initial inflammation is characterized by local changes in immune cell populations and molecular mediators, including microRNAs (miRNAs). However, the systemic response to bone injury remains largely uncharacterized. Thus, this study aimed to profile the changes in the plasma miRnome after bone injury and determine its biological implications.
Methods: A rat model of femoral bone defect was used, and animals were evaluated at days 3 and 14 after injury. Non-operated (NO) and sham operated animals were used as controls. Blood and spleen were collected and peripheral blood mononuclear cells (PBMC) and plasma were separated. Plasma miRnome was determined by RT-qPCR array and bioinformatics Ingenuity pathway analysis (IPA) was performed. Proliferation of bone marrow mesenchymal stem/stromal cells (MSC) was evaluated by Ki67 staining and high-throughput cell imaging. Candidate miRNAs were evaluated in splenocytes by RT-qPCR, and proteins found in the IPA analysis were analysed in splenocytes and PBMC by Western blot.
Results: Bone injury resulted in timely controlled changes to the miRNA expression profile in plasma. At day 3 there was a major down-regulation of miRNA levels, which was partially recovered by day 14 post-injury. Interestingly, bone injury led to a significant up-regulation of let-7a, let-7d and miR-21 in plasma and splenocytes at day 14 relative to day 3 after bone injury, but not in sham operated animals. IPA predicted that most miRNAs temporally affected were involved in cellular development, proliferation and movement. MSC proliferation was analysed and found significantly increased in response to plasma of animals days 3 and 14 post-injury, but not from NO animals. Moreover, IPA predicted that miRNA processing proteins Ago2 and Dicer were specifically inhibited at day 3 post-injury, with Ago2 becoming activated at day 14. Protein levels of Ago2 and Dicer in splenocytes were increased at day 14 relative to day 3 post-bone injury and NO animals, while in PBMC, levels were reduced at day 3 (albeit Dicer was not significant) and remained low at day 14. Ephrin receptor B6 followed the same tendency as Ago2 and Dicer, while Smad2/3 was significantly decreased in splenocytes from day 14 relative to NO and day 3 post-bone injury animals.
Conclusion: Results show a systemic miRNA response to bone injury that is regulated in time and is related to inflammation resolution and the start of bone repair/regeneration, unravelling candidate miRNAs to be used as biomarkers in the monitoring of healthy bone healing and as therapeutic targets for the development of improved bone regeneration therapies.
Keywords: inflammation, bone tissue repair, plasma, microRNA, biomarker
Introduction
Inflammation has been increasingly recognized as an important stage at the onset of tissue repair and regeneration [1,2]. Upon injury, danger signals are released that initiate an inflammatory response characterized by the local secretion of chemokines, cytokines and growth factors, and the recruitment of immune cells (namely, neutrophils and monocytes) to the lesion site, where they contribute to the remodelling of the damaged tissue. Our recent studies on the inflammatory response to biomaterials for bone repair/regeneration suggest that the immune response initiated at the injury site is reflected at the systemic level, leading to alterations on the levels of blood cell populations and circulating cytokines [3,4]. A balanced immune response to injury is crucial for the successful repair/regeneration of damaged tissues; however its temporal regulation is still poorly understood. Indeed, early impairment of immune response compromises bone repair upon injury, whereas a prolonged and exacerbated activity of the immune system may delay or prevent bone healing (e.g., non-union bone fractures) [5,6]. Cytokines and microRNAs (miRNAs) are suggested to be major regulators of this inflammatory phase during tissue repair [7].
miRNAs are non-coding RNAs of small size (~22 nucleotides) responsible for the control of gene expression, mainly at the post-transcriptional level [8]. miRNA genes are physiologically transcribed in cells as long transcripts that are then processed by enzymes such as Drosha and Dicer [9] and loaded into the RNA-induced silencing complex via Ago2, where they target complementary messenger RNA (mRNA), preventing its translation or promoting its degradation [10]. This implies that an alteration in the level of a specific miRNA is usually accompanied by an opposite change in the levels of proteins encoded by their target mRNAs. Importantly, one single miRNA is capable of binding to several mRNAs [11], thus affecting the expression of multiple genes at once. On the other hand, different miRNAs may target the same mRNA [12], potentiating a stronger effect upon the expression of a specific protein. miRNAs have been described as important regulators of cell functions such as proliferation, survival, differentiation and metabolic activity [8], being implicated as well in the onset and progression of different diseases, particularly cancer [13]. Cells secrete miRNAs, which can be found circulating systemically in virtually all body fluids, associated with protein complexes containing Ago proteins or enclosed inside extracellular vesicles that protect them from degradation. For this reason, miRNAs have been extensively explored for their potential as diagnostic and prognostic non-invasive biomarkers in injury and disease [14-16].
Tissue injury has been reported to impact the miRNA expression profile in different organs, namely heart [17], liver [18] and kidney [19]. Furthermore, previous work has demonstrated that these local alterations in miRNA expression are accompanied by changes in the circulating miRnome [20], potentially influencing the response to injury. Changes in miRNA expression at the lesion site were previously described for bone injury, with expression changing with time after injury [21-23]. In addition, a defined set of miRNAs were found to be differently expressed in the serum of osteoporotic fracture patients compared with osteoarthritis or healthy control fracture patients [24-26]. However, a detailed characterization of the systemic alterations occurring in the circulating miRnome over time after bone injury in normal physiological conditions remains to be explored. Thus, this work aimed to dissect the plasma miRNA expression profile over time after bone injury. This is of great importance for monitoring fracture healing and for the development of more efficient bone tissue regeneration strategies.
To achieve this goal, an in vivo rat model of bone injury was used and miRNA expression in plasma was profiled following bone injury at the acute inflammatory phase (3 days) and at the inflammation resolution phase (14 days). A timely controlled miRNA expression pattern was found, with a general down-regulation of miRNA expression at day 3 that started recovering and up-regulating specific miRNAs at day 14. Bioinformatics analysis predicted a regulation of cell development, proliferation and migration over time after injury. Plasma collected at days 3 and 14 post-injury stimulated an increased proliferation of MSC in vitro. A time-dependent regulation of the miRNA processing proteins Ago2 and Dicer was also predicted, and their protein levels were confirmed to be altered in splenocytes and PBMC over time after injury. To the best of our knowledge this is the first study showing a temporal characterization of the systemic miRNA profile upon bone injury.
Methods
Bone injury animal model
A critical size bone defect in vivo model was performed as previously described [3]. Briefly, three-month-old male Wistar-Han rats (N = 6 animals per group) were subjected to a lateral arthrotomy of the right knee, muscles were retracted and a cylindrical defect (with 3 mm diameter and ~4 mm depth) was surgically drilled in the anterolateral wall of the lateral condyle of the femur. For sham operated animals the same procedure was followed, but no cylindrical defect was created (N = 3 animals per timepoint). Surgeries were performed under general anesthesia with volatile isoflurane. After surgery, buprenorphine subcutaneous analgesia (0.05 mg/kg) was provided twice a day to operated animals, for 2 days. Animals were sacrificed at 3 and 14 days after surgery, which correspond to the acute inflammatory phase, triggered by the injury, and to the resolution of inflammation, respectively [27]. Non-operated (NO) animals were used as control.
All procedures were performed in accordance with the ethical requirements on animal welfare and experimentation and were approved by the institutional animal ethics committee and the Portuguese official authority regulating laboratory animal sciences (DGAV).
Blood and organ collection and processing
Animals were maintained under general anesthesia with volatile isoflurane and whole blood was collected by cardiac puncture into tubes containing anticoagulant citrate-phosphate-dextrose solution (Sigma-Aldrich) at a 1:5 ratio (Vol solution: Vol blood). Within 30 min of collection, blood was centrifuged at 1200 ×g (without acceleration/deceleration) for 20 min at room temperature (RT), and plasma and buffy coat layers were collected separately. Plasma was further centrifuged at 2500 ×g for 15 min at 4 ºC, to remove cell debris. Supernatant was collected and preserved at -80 °C until further use. Buffy coat was diluted in phosphate buffered saline, overlaid on an equal volume of Lymphoprep (Axis-Shield), and centrifuged at 800 ×g (without acceleration/deceleration) for 30 min at RT for peripheral blood mononuclear cells (PBMC) isolation.
Animals were then dissected for collection of spleen, liver, and inguinal and popliteal draining lymph nodes. Liver was preserved in neutral buffered formalin 10% (v/v). Spleen was injected with 1 mg/mL collagenase I (Sigma-Aldrich), and crushed on top of a 100 μm cell strainer for single cell isolation. Red blood cells in cell suspension were then lysed by incubation with lysis solution (NH4Cl 150 mM in Tris 10 mM) for 8 min, at 37 °C. Draining lymph nodes were crushed as above for single cell isolation.
RNA isolation
For plasma total RNA isolation, 400 μL of plasma were mixed with TRIzol® in a 1:2 ratio (Vol plasma: Vol TRIzol®), and then samples were spiked with 25 fmol of exogenous C. elegans miRNA-39 mirVana miRNA mimics (Ambion). Chloroform was added, samples were centrifuged and the colourless upper phase containing the RNA was collected. RNA was precipitated with absolute ethanol and then purified using the PureLink kit columns (Life Technologies), following the manufacturer's protocol.
For RNA isolation from splenocytes, at least 1×10⁶ cells were lysed with TRIzol®, followed by spiking with 25 fmol of exogenous C. elegans miRNA-39 mirVana miRNA mimics (Ambion), as above. RNA was then isolated following the manufacturer's protocol.
RT-qPCR analysis of miRNA expression in plasma and splenocytes, and microarray profiling of plasma RNA
The expression of circulating mature miRNAs in rat plasma was analysed with Rat miRBase Profiler HC (Plates 1 and 2) miScript™ miRNA PCR Array, following the manufacturer's protocol. Briefly, total plasma RNA was used to synthetize cDNA using miScript II RT kit with miScript HiSpec Buffer, which includes a mix of forward primers specific for each rat miRNA included on miRBase v.20. RT-qPCR was then performed with synthesized cDNA and miScript SYBR Green PCR kit in a CFX384 Real-Time PCR Detection system (Bio-Rad). RNA quality and efficiency of the reaction were assessed by the positive control wells included in the RT-qPCR arrays. RNA samples analysed showed Cq = 19±2 (Figure S1A), which according to the manufacturer's guidelines indicates good quality of RNA and efficient reactions. Only miRNAs with Cq < 35 cycles that were expressed in at least 75% of the animals of at least one experimental group were considered for the analysis. miRNA expression data was normalized by the ΔCq method using endogenous and spiked miRNAs. Heat maps were generated using Morpheus software (Broad Institute, available online at https://software.broadinstitute.org/morpheus/), a platform designed for visualization and analysis of data in a matrix format. Hierarchical clustering of the fold-change heat map was computed using Euclidean distance and complete linkage method.
Detection of single miRNA (rno-let-7a-5p, rno-let-7d-5p, rno-miR-21-5p and C. elegans miR-39-5p) expression was performed by RT-qPCR using total RNA from plasma and splenocytes and miScript™ Primer assays (Qiagen), following the manufacturer's instructions.
Bioinformatics analysis
The expression pattern of specific miRNA genes at 3 days post-injury versus NO, 14 days post-injury versus NO, and 14 days post-injury versus 3 days was analysed using Venn diagrams generated with Venny 2.1 online software [28]. For the analysis, only miRNAs with an absolute fold-change >1.5 that were expressed in at least 75% of the animals of at least one experimental group were considered.
The miRNA expression patterns obtained were correlated with biological pathways using Ingenuity Pathway Analysis (IPA) software (QIAGEN Inc., https://www.qiagenbio-informatics.com/products/ingenuity-pathway-analysis) [29]. IPA determines miRNA target genes and performs statistical tests for the enrichment of those genes in canonical pathways in its database, which was hand-curated and includes not only gene interactions predicted in silico but also those experimentally demonstrated and previously published in the scientific literature.
MSC isolation and culture
Rat MSC were isolated from rat femur bone marrow, as previously described [30]. Briefly, bone marrow was flushed from bones, filtered through a 100 μm cell strainer, red blood cells were lysed as above, and cells were seeded in minimum essential medium alpha modification (α-MEM) containing 10% MSC-qualified fetal bovine serum (FBS; both from ThermoFisher Scientific). MSC were selected by adhesion and cryopreserved for later use. Resulting cells were CD29+, CD90+ and CD45-, and were able to differentiate into the osteogenic, chondrogenic and adipogenic lineages [30]. For each experiment, a vial of MSC was thawed and cells maintained in MSC media as above in a humidified incubator at 37 °C and 5% CO2. MSC of passage 5 were used for this work.
MSC proliferation assay
Rat MSC were seeded at 3000 cells/cm2 and grown in MSC media until 60-70% confluence. Then, MSC were stimulated with rat total plasma diluted 1:3 (v:v) in α-MEM supplemented with heparin 3 U/mL (B. Braun) to avoid coagulation. Serum-free media and MSC media (with 10% FBS) were used as controls. After 48 h, cells were fixed, immunostained for Ki67 (diluted 1:150; clone SP6, ThermoFisher Scientific) followed by AlexaFluor647-conjugated secondary antibody, and nuclei stained with DAPI 1 μg/mL. Secondary antibody alone was used as negative control. The bottom of the wells where MSC were seeded were imaged in an IN Cell Analyzer 2000 (GE Healthcare) using a Nikon 20x/0.45 NA Plan Fluor objective, capturing 30 sequential, non-overlapping images that mapped mainly the centre of the well, corresponding to a coverage of 60% of the total well area. Acquired images were analysed using IN Cell Developer software. For the analysis, the total number of nuclei in an image was counted, and the Ki67 staining intensity levels inside the nuclei were determined. MSC were considered Ki67-positive for fluorescence levels above the threshold found in cells immunolabelled with secondary antibody only (negative control).
Western blotting
PBMC and spleen cells were lysed with RIPA buffer supplemented with phosphatase and protease inhibitors, and protein was quantified by DC Protein Assay kit (Bio-Rad).
The same amount of protein (20 μg) of each sample was prepared in reducing loading buffer, denatured at 95 °C for 5 min, and loaded in 10% polyacrylamide SDS-PAGE gels. Resolved proteins were wet-transferred to nitrocellulose membranes, and membranes blocked with non-fat dry milk 5% solution. Membranes were probed for 1 h at room temperature, or overnight at 4 °C with the following primary antibodies: anti-Dicer (clone F-10), anti-Ago2 (clone B-3), anti-EphB6 (clone D-7), anti-Smad2/3 (clone C-8) (all from Santa Cruz Biotechnology), and anti-Akt (Cell Signalling Technology). Membranes were probed with HRP-conjugated secondary antibody (GE Healthcare), incubated with ECL substrate, and chemiluminescence signal was detected with autoradiographic films (all from GE Healthcare). Films were scanned on a GS-800 calibrated imaging densitometer (Bio-Rad), protein bands were quantified on Fiji, and relative protein levels were calculated using total Akt bands as normalizer.
Histological analysis
Liver was fixed in formalin 10% (v/v) for 24 h and processed for paraffin embedding. Paraffin sections of 3 μm thickness were sequentially cut, deparaffinized in xylol, and rehydrated in a series of ethanol solutions of decreasing concentration. Sections were stained with haematoxylin and eosin (H&E) by incubation in Gill's Haematoxylin, followed by incubation in alcoholic Eosin Y. Slides were mounted and imaged using an Axiovert 200M microscope (Zeiss).
Statistical analysis
Data analysis was performed using GraphPad Prism v6.0 software. Normal distribution of data was tested by D'Agostino & Pearson omnibus normality test and found to be non-parametric. Presence of outliers was tested by the ROUT method with Q = 0.5%. For comparison of miRNA expression between two groups, the non-parametric Mann-Whitney test was computed, along with the False Discovery Rate for each miRNA, calculated for multiple comparison correction by the Benjamini and Hochberg method. For comparisons between multiple groups, the non-parametric Kruskal-Wallis test was used, followed by uncorrected Dunn's multiple comparison test. Tests were run for a significance level α of 0.05.
Results
Expression profile of circulating miRNAs changes over time upon bone injury
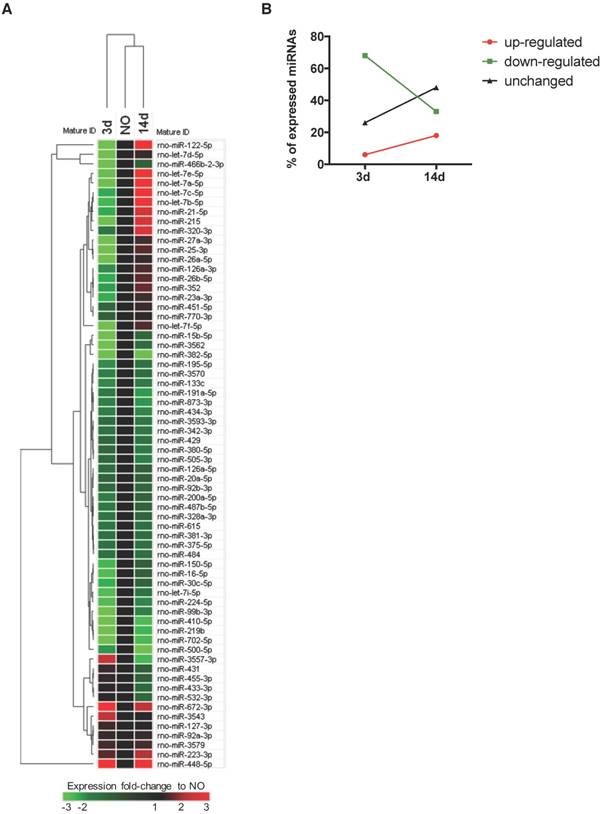
To profile the circulating non-coding RNAs potentially involved in bone injury, the plasma miRnome of animals 3 and 14 days after bone injury was compared to that of NO animals using RT-qPCR array (Figure 1). From 653 rat miRNAs included in the array, 66 miRNAs were successfully detected in 75% of the animals of at least one experimental group, as represented in the Figure S1B heatmap of miRNA expression in plasma of all animals included in the study. Results obtained are illustrated in Figure 1A as the fold-change of miRNA expression levels at each timepoint after injury, relative to basal levels of NO controls (fold-change = 1, black). A trend to lower levels of expression, particularly at day 3, was observed and is denoted by the predominant green colour representation in the heatmap. The hierarchical clustering of the miRNA expression profiles at each timepoint indicates a higher similarity of circulating miRnome between day 14 post-injury and NO animals, which differentiates from day 3 post-injury (Figure 1A). A detailed analysis of the miRNAs detected in each timepoint revealed that 68% of the circulating miRNAs detected at day 3 post-injury were down-regulated relative to NO controls (fold-change <-1.5), whereas only 33% of the miRNAs detected at 14 days after injury were down-regulated (Figure 1B). Simultaneously, at 14 days post-injury there was an increase of the miRNAs up-regulated relative to NO controls (fold-change >1.5), rising from 6% at 3 days post-injury to 18% at day 14 (Figure 1B). Interestingly, nearly 48% of the miRNAs detected at day 14 post-injury were expressed at similar levels to NO controls (unchanged), a percentage that greatly increased from day 3 to day 14 after injury (Figure 1B).
Plasma microRNA expression profile is regulated over time after bone injury. miRNAs circulating in rat plasma were profiled at 3 days (3d) and 14 days (14d) after femur injury, and in normal non-operated animals (NO) by RT-qPCR array (NO, 3d, 14d: 4 animals per group). (A) Heat map and euclidean distance dendrogram of the average expression fold-change of miRNAs detected at 3 and 14 days post-injury relative to NO animals. Fold-change expression of NO animals was normalized to 1 and is represented in black. Light red represents miRNAs with an average fold-change ≥3 and light green represents miRNAs with an average fold-change ≤-3 relative to NO. (B) Percentage of miRNAs up-regulated (with a fold-change ≥1.5), down-regulated (with a fold-change ≤-1.5) or maintained unchanged (-1.5<fold-change<1.5) in rat plasma at each timepoint after injury, relative to normal NO animals.
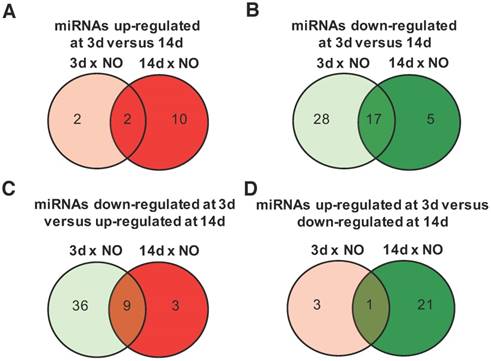
The time-dependent changes in miRNAs expression were further explored for those miRNAs with an absolute fold-change to NO controls >1.5, a threshold considered to be biologically significant [21]. Among the miRNAs with an upregulation >1.5 fold, compared with NO animals, only 2 were exclusively up-regulated at day 3, 10 at day 14, and 2 were maintained from day 3 to day 14 post-injury (Figure 2A and Table S1). Conversely, 28 miRNAs were down-regulated only at day 3, 17 were down-regulated at both timepoints after injury and only 5 were down-regulated exclusively at day 14 (Figure 2B and Table S2). Interestingly, 9 miRNAs down-regulated at day 3 were then up-regulated at day 14 post-injury (Figure 2C and Table S3), including miRNAs that were bellow detection at day 3 and up-regulated at day 14. On the other hand, only 1 miRNA was up-regulated at day 3 and then down-regulated at day 14 post-injury (Figure 2D).
Progress of microRNA expression profile over time after injury. miRNA expression fold-changes at 3 days (3d) and 14 days (14d) after injury were calculated relative to non-operated (NO) control animals, and miRNAs up-regulated (fold-change ≥1.5) and down-regulated (fold-change ≤-1.5) were compared for both timepoints post-injury (NO, 3d and 14d: 4 animals per group). (A) Comparison of miRNAs up-regulated at 3 days post-injury (relative to NO) with miRNAs up-regulated at 14 days (relative to NO). (B) Comparison of miRNAs down-regulated at 3 days post-injury (relative to NO) with miRNAs down-regulated at 14 days (relative to NO). (C) Comparison of miRNAs down-regulated at 3 days post-injury (relative to NO) with miRNAs up-regulated at 14 days (relative to NO). (D) Comparison of miRNAs up-regulated at 3 days post-injury (relative to NO) with miRNAs down-regulated at 14 days (relative to NO). The number of miRNAs found in each category is indicated inside the circles and more information on the exact miRNAs is in Tables S1-S3.
Taken together, these results suggest a temporal regulation of miRNA expression after injury.
Let-7 family of miRNAs is up-regulated at day 14 post-injury
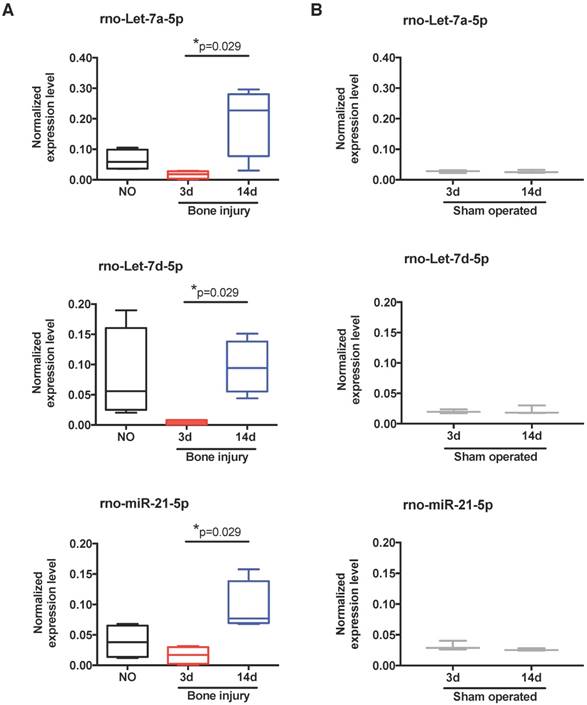
To scrutinize in more detail the systemic regulation of plasma miRNA over time post-injury, we then focused our miRnome analysis on the comparison of day 14 versus day 3 post-injury (Table 1). The most up-regulated miRNA was miR-122, which was 88.89 times more expressed at day 14 than at day 3. Although this up-regulation was not significant (p=0.34), as miR-122 is often considered a biomarker of liver injury [31], we confirmed that this up-regulation was not related to liver lesions in this model. No histological alterations could be detected in the liver of injured animals (Figure S2). Amongst the miRNAs with the highest up-regulation and lowest False Discovery Rate (FDR) at day 14 were several members of the let-7 family, let-7a, let-7b, let-7c, let-7d, let-7e and let-7f; but, only let-7d and let-7a were statistically different (Table 1). Those results are illustrated in more detail in Figure 3A, with let-7a-5p and let-7d-5p being statistically significantly up-regulated at day 14 post-injury compared with day 3. Also, the prototypical oncogene miR-21-5p was significantly up-regulated, with a low FDR at day 14 compared to day 3 after injury (Table 1 and Figure 3A). Importantly, these miRNAs have human homologs, and are not increased in sham operated animals between days 3 and 14 post-surgery (Figure 3B). On the other hand, only 3 miRNAs were markedly down-regulated (fold-change <-1.5) at day 14 post-injury compared to day 3, namely miR-3557-3p, miR-3543 and miR-672-3p (Table 1), with miR-3557-3p being statistically significantly down-regulated. However, this miRNA was not considered for further analysis because it has complete homology with rno-miR-378a-5p, which was detected in our array at very low levels.
Top 10 miRNAs most differently expressed in plasma of animals at 14 days post-injury compared to day 3. Left: plasma miRNAs up-regulated at 14 days relative to 3 days post-injury. Right: plasma miRNAs down-regulated at 14 days relative to 3 days post-injury. Data is represented as fold-change at day 14 relative to day 3 post-injury. p-value was calculated by Mann-Whitney test, and False Discovery Rate (FDR) correction for multiple comparisons is indicated for each miRNA (3d and 14d: 4 animals per group).
| Up-regulated miRNAs | Down-regulated miRNAs | ||||||||
|---|---|---|---|---|---|---|---|---|---|
| miRNA name | Fold-change 14d vs. 3d | P-value | FDR | miRNA name | Fold-change 14d vs. 3d | P-value | FDR | ||
| rno-miR-122-5p | 88.89 | 0.34 | 0.85 | rno-miR-3557-3p | -5.70 | 0.03 | 0.35 | ||
| rno-let-7d-5p | 21.09 | 0.03 | 0.35 | rno-miR-3543 | -2.08 | 0.89 | 0.95 | ||
| rno-let-7a-5p | 11.70 | 0.03 | 0.35 | rno-miR-672-3p | -2.05 | 0.69 | 0.95 | ||
| rno-let-7e-5p | 10.29 | 0.06 | 0.35 | rno-miR-505-3p | -1.48 | 0.49 | 0.86 | ||
| rno-miR-466b-2-3p | 10.00 | 0.34 | 0.85 | rno-miR-500-5p | -1.48 | 0.49 | 0.86 | ||
| rno-let-7f-5p | 8.59 | 0.06 | 0.35 | rno-miR-380-5p | -1.41 | 0.49 | 0.86 | ||
| rno-miR-215 | 7.69 | 0.34 | 0.85 | rno-miR-433-3p | -1.39 | 0.49 | 0.86 | ||
| rno-let-7b-5p | 7.61 | 0.11 | 0.39 | rno-miR-532-3p | -1.38 | 0.49 | 0.86 | ||
| rno-let-7c-5p | 7.20 | 0.11 | 0.39 | rno-miR-429 | -1.27 | 0.49 | 0.86 | ||
| rno-miR-21-5p | 5.72 | 0.03 | 0.35 | rno-miR-3593-3p | -1.23 | 0.69 | 0.95 | ||
Expression of let-7 family members and miR-21 in plasma is altered by bone injury. (A) Detailed expression level (2-ΔCq) variation of the miRNAs significantly up-regulated in plasma at day 14 after bone injury compared to day 3 (NO, 3d, 14d: 4 animals per group). (B) Expression levels of the same miRNAs in the plasma of sham operated animals at day 3 and day 14 after soft tissue surgery (3d, 14d: 3 animals per group). Box plots represent min-to-max distribution, and p-values calculated by Mann-Whitney test are indicated.
Detected miRNAs are predicted to control cellular processes important for bone regeneration
To uncover the biological processes regulated by the detected miRNAs, we then performed a bioinformatics analysis of the miRNAs circulating in the plasma of animals at 14 days post-injury compared with 3 days post-injury. According to the results obtained (Table 2), the changes in circulating miRnome from day 3 to 14 post-injury were predicted to control mainly cell differentiation (cellular development) and proliferation. miRNAs in plasma at day 14 post-injury were also predicted to regulate pathways of cell movement, apoptosis and cell survival, and cell cycle. A more detailed analysis of each biological process identified revealed that the pattern of circulating miRNAs at 14 days post-injury was associated with inhibition of tumour cell proliferation and cell cycle progression, suggesting an inactivation of cell proliferation pathways from day 3 to day 14 post-injury (Figure 4A).
Biological pathways predicted to be regulated by the miRNAs circulating in plasma at 14 days post-injury relative to 3 days post-injury. Specific miRNAs predicted to be involved in each process, and p-value range for the association predicted, as calculated in Ingenuity pathway analysis, are indicated.
| Biological functions regulated by miRNAs expressed at 14d versus 3d post-injury | ||
|---|---|---|
| Molecular and Cellular Functions | miRNAs assigned | P-value range |
| Cellular development | rno-let-7d-5p, rno-miR-122-5p, rno-miR-126a-5p, rno-miR-15b-5p, rno-miR-20a-5p, rno-miR-215, rno-miR-429, rno-miR-21-5p, rno-miR-223-3p, rno-miR-224-5p, rno-miR-23a-3p, rno-miR-26a-5p, rno-miR-27a-3p, rno-miR-30c-5p, rno-miR-320-3p, rno-miR-451-5p | 4.55×10⁻² to 1.08×10⁻⁵ |
| Cellular growth and proliferation | rno-let-7d-5p, rno-miR-122-5p, rno-miR-126a-5p, rno-miR-15b-5p, rno-miR-20a-5p, rno-miR-21-5p, rno-miR-215, rno-miR-223-3p, rno-miR-224-5p, rno-miR-23a-3p, rno-miR-26a-5p, rno-miR-27a-3p, rno-miR-320-3p, rno-miR-429, rno-miR-451-5p | 4.55×10⁻² to 1.08×10⁻⁵ |
| Cellular movement | rno-let-7d-5p, rno-miR-122-5p, rno-miR-126a-5p, rno-miR-15b-5p, rno-miR-20a-5p, rno-miR-21-5p, rno-miR-224-5p, rno-miR-23a-3p, rno-miR-26a-5p, rno-miR-27a-3p, rno-miR-320-3p, rno-miR-429, rno-miR-451-5p | 4.49×10⁻² to 6.20×10⁻⁷ |
| Cell death and survival | rno-let-7d-5p, rno-miR-122-5p, rno-miR-15b-5p, rno-miR-20a-5p, rno-miR-21-5p, rno-miR-224-5p, rno-miR-30c-5p, rno-miR-320-3p, rno-miR-429, rno-miR-451-5p | 4.63×10⁻² to 1.16×10⁻⁴ |
| Cell cycle | rno-let-7d-5p, rno-miR-15b-5p, rno-miR-20a-5p, rno-miR-21-5p, rno-miR-23a-3p, rno-miR-25-3p, rno-miR-26a-5p, rno-miR-27a-3p, rno-miR-451-5p | 4.80×10⁻² to 1.84×10⁻⁷ |
MiRnome circulating in plasma upon bone injury is predicted to control cell proliferation. (A) Diagram of the main biological processes associated by Ingenuity pathway analysis with the miRNA expression profile detected in plasma of animals at 14 days (14d) post-injury compared to day 3 (3d) (3d, 14d: 4 animals per group). The colour scheme represents the z-score for the activation status of each biological function, with dark blue representing inhibited functions and dark orange representing activated functions. The colour distribution in the diagram predicts an inhibition of cell proliferation processes at 14 days post-injury. (B) Representative micrographs of Ki67 immunostaining of rat bone marrow-derived mesenchymal stem/stromal cells (MSC) after 48 h of stimulation with plasma (diluted 1:3) from NO rats or animals at day 3 and day 14 after bone injury, or maintained in serum-free media (SFM; negative control) or media with FBS 10% v/v (FBS; positive control). Ki67 (AlexaFluor647) is depicted in magenta and nuclei (DAPI) in blue. White arrows indicate representative Ki67-positive nuclei. Scale bar: 200 μm. (C) Quantification of Ki67 immunostaining across multiple experiments, represented in the graph as the percentage of Ki67+ MSC. Box plots represent min-to-max distribution (NO: 5 animals; 3d and 14d: 6 animals per group). P-values relative to SFM are indicated, as calculated by Kruskal-Wallis test, followed by uncorrected Dunn's multiple comparison test. None of the comparisons for the other conditions tested were statistically significant.
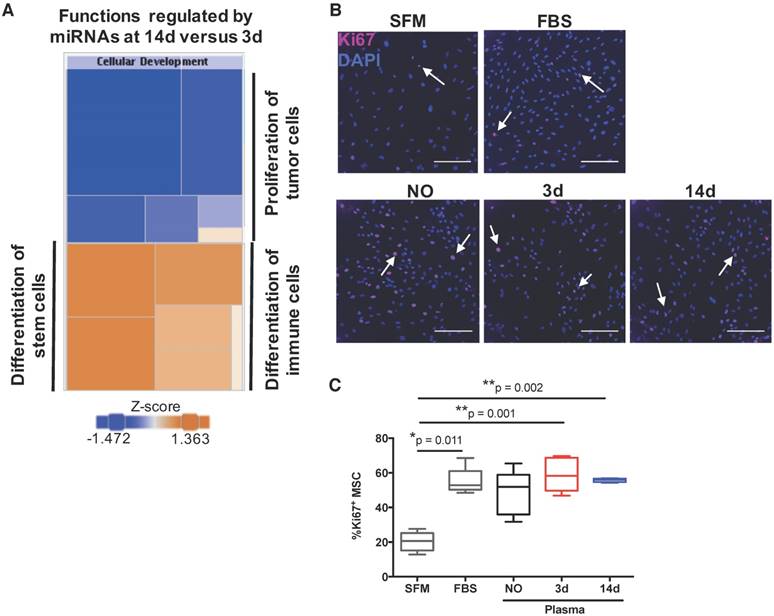
Next, to functionally validate these predictions, we analysed the potential of plasma from animals at the different timepoints to promote proliferation of bone marrow-derived mesenchymal stem/stromal cells (MSC), which are important for bone regeneration [32]. Results are illustrated in Figure 4B, and quantified across different animals in Figure 4C. Plasma from animals at days 3 and 14 post-injury, but not from NO animals, promoted significant MSC proliferation when compared to negative control, and to similar levels as FBS positive control. These results do not agree completely with the bioinformatics prediction, as MSC proliferation in response to plasma from day 14 was not statistically different to that obtained with plasma from animals at day 3 (Figure 4C). We also analysed the number of cells in draining lymph nodes, and it increased as expected at initial stages of inflammation (day 3), reducing to levels close to or below control by day 14, with inflammation resolution. However, similar results were observed for sham and bone defect animal groups and so should not be related to the miRNA profile (data not shown).
Detected miRNA profile suggests changes in miRNA biogenesis pathways
At the molecular level, the bioinformatics analysis indicated that the expression profile of miRNAs over time after injury was caused by alterations in the activation status of the miRNA-related proteins Dicer and Argonaute 2 (Ago2), and of the ephrin receptor B6 (EphB6) (Table 3). These proteins were predicted to be inhibited at day 3 post-injury compared with NO controls, while Ago2 and EphB6 were predicted to become activated at day 14 relative to day 3 after injury. Furthermore, the miRnome profile at day 14 post-injury compared with day 3 could be overlapped into the networks of the signalling pathways of IGFR1, MAPK1/2, Smad2/3, Dicer and Drosha (Figure 5), which were predicted to be activated.
Main canonical pathways predicted to regulate the miRNA expression profile found at day 14 compared to day 3 after bone injury. Status of activation and p-value range for the association predicted, as calculated by Ingenuity pathway analysis, are indicated.
| Pathways regulating miRNAs expressed at 3d versus NO | ||
|---|---|---|
| Causal networks | Predicted status | P-value |
| Ago2 | Inhibited | 2.83×10⁻³⁰ |
| Dicer | Inhibited | 2.51×10⁻¹⁸ |
| Ephrin receptor B6 | Inhibited | 1.32×10⁻¹⁷ |
| Pathways regulating miRNAs expressed at 14d versus NO | ||
| Causal networks | Predicted status | P-value |
| Ago2 | Not determined | 4.12×10-41 |
| Dicer | Not determined | 2.81×10⁻²² |
| Ephrin receptor B6 | Not determined | 6.58×10⁻¹⁹ |
| Pathways regulating miRNAs expressed at 14d versus 3d | ||
| Causal networks | Predicted status | P-value |
| Ago2 | Activated | 3.47×10-40 |
| Dicer | Not determined | 1.06×10⁻²¹ |
| Ephrin receptor B6 | Activated | 1.67×10⁻²⁰ |
MiRnome circulating in plasma after injury is predicted to be controlled by miRNA processing enzymes and to affect different signalling pathways. Exemplificative diagram of a network of interaction of miRNAs detected in plasma at day 14 post-injury relative to day 3 (3d, 14d: 4 animals per group), with the canonical signalling pathways predicted to affect their expression (e.g., Dicer), and that they were predicted to regulate (e.g., Smad2/3) by Ingenuity pathway analysis.
In order to functionally explore these in silico predictions, we tested the expression profile of candidate miRNAs in splenocytes. These cells were chosen due to their involvement in the inflammatory response and reported contribution to the circulating miRNome [33]. Following the expression in plasma, let-7a, let-7d and miR-21 were significantly up-regulated in splenocytes at day 14 post-bone injury relative to 3 days (Figure 6A). In splenocytes from sham operated animals, the expression levels of these miRNAs were not different between days 3 and 14 post-surgery (Figure 6B). Next, candidate proteins were selected from the signalling pathways predicted to be altered by the bioinformatics analysis, and their protein levels were analysed by Western blot in cell lysates of splenocytes and PBMC from different animals. Results are illustrated in Figure 7A, C, and quantified across different animals in Figure 7B, D, respectively. When splenocytes of bone injury and sham operated animals were probed for the expression of these proteins (Figure 7B), we found that levels of Dicer and Ago2 were significantly higher at 14 days post-injury compared to 3 days and NO animals. Dicer levels were also higher at 14 days post-bone injury than in sham operated animals at the same timepoint, albeit not reaching statistical significance (p=0.066). EphB6 levels followed a similar trend and were significantly higher at 14 days post-bone injury when compared to sham operated and NO animals. On the other hand, Smad2/3 levels were significantly lower at 14 days after bone injury compared to 3 days and NO animals. In PBMC (Figure 7D), levels of Ago2 and EphB6 were significantly lower at day 3 and remained low at day 14 post-injury compared to NO animals. There was also a reduction in the level of Dicer at 3 and 14 days compared to NO animals, albeit not statistically significant (p=0.062 and p=0.052, respectively).
Temporal changes in miRNA expression in splenocytes. Normalized expression levels of rno-let-7a-5p, rno-let-7d-5p, and rno-miR-21-5p in splenocytes of animals from: (A) non-operated (NO), 3 days (3d) and 14 days (14d) after bone injury; and (B) 3 days and 14 days after sham surgeries. N = 3 animals per group. Box plots represent min-to-max distribution, and p-values are indicated, as determined by Kruskal-Wallis test followed by uncorrected Dunn's multiple comparison test (A), or Mann-Whitney test (B).
Protein levels of target proteins were altered in splenocytes and PBMC. Dicer (218 kDa), Ago2 (94 kDa), EphB6 (110 kDa), Smad2/3 (55-60 kDa) and total Akt (60 kDa) were analysed by Western blot: (A) Representative images in splenocytes isolated from non-operated (NO), 3 days (3d) and 14 days (14d) after sham or bone injury surgeries. Different lanes represent different animals. (B) Relative quantification of Western blot bands illustrated in (A) across different animals (NO, Sham 3d and 14d: 3 animals per group, and Bone injury 3d and 14d: 4 animals per group). (C) Representative images in PBMC of NO, 3 days and 14 days post-injury animals. Different lanes represent different animals. (D) Relative quantification of Western blot bands illustrated in (C) across different animals (NO: 5 animals; 3d: 4 animals; 14d: 6 animals). Total Akt protein bands were used as normalizer for (B) and (D). Mw: molecular weight. Box plots represent min-to-max distribution, and p-values are indicated, as determined by Kruskal-Wallis test followed by uncorrected Dunn's multiple comparison test.
Discussion
The response to bone injury is influenced by systemic factors, such as comorbidities or the co-existence of other injuries [5,34,35]. Also, our previous work shows that the inflammatory response to biomaterial implantation in bone impacts systemic immune cell proportions in blood, draining lymph nodes and spleen [3,4]. Moreover, the systemic response to injury may hold the key for biomarkers that can predict non-union and other bone repair complications [36]. This is particularly important considering that the criteria currently employed in the clinic to diagnose delayed or non-union fractures are often ambiguous and difficult to apply to all types of fractures [37]. Circulating miRNAs, measured in body fluids, are being greatly explored as biomarkers for the diagnosis and prognosis of several diseases [38], namely cancer, cardiovascular conditions, neurodegenerative diseases and infection [13]. Thus, the current work explores the changes in systemic miRNA profile upon bone injury. The response was analysed at day 3, the acute inflammatory phase in the bone defect animal model, and at day 14, the inflammation resolution phase [27]. Our findings show an initial overall down-regulation of miRNAs compared with NO controls. This is in agreement with the local response, as an extensive down-regulation of miRNA expression in mouse bone tissue after fracture has also been reported [21]. At day 14, miRNA expression in plasma started to recover, with several miRNAs returning to the levels found in NO animals, or even being up-regulated. Similarly, it was previously reported in a rat model of liver injury that a genome-wide down-regulation of miRNAs in the liver occurred at 24 h after the lesion [39], being related with the recovery of liver cell mass. A gradual increase in overall miRNA expression in the liver was then observed up to 72 h after injury, becoming closer to the basal expression pattern of control sham-operated animals. Moreover, this initial reduction of miRNA levels was accompanied by a decreased expression of Dicer1 and other enzymes of the miRNA-processing pathway. Interestingly, Dicer was recently implicated in the regulation of inflammatory responses in rheumatoid arthritis [40], being down-regulated in synovial fibroblasts from rheumatoid arthritis patients compared to osteoarthritis patients or healthy subjects. Furthermore, Dicer1 knockdown in healthy synovial fibroblasts increases IL-6 secretion, a key cytokine in the early stages of the bone repair/regeneration process. Recently, this enzyme was also reported to be up-regulated during osteogenic differentiation [41]. Importantly, our bioinformatics analysis predicted that the observed expression pattern was correlated with inhibition of Dicer and Ago2 at day 3 after injury, two key enzymes in the maturation and function of miRNAs [9]. In terms of protein expression pattern, in PBMC we found significant reductions in Ago2 and EphB6 at 3 and 14 days post-injury compared to NO animals, while the reduction for Dicer was not statistically significant. On the other hand, in spleen these reductions at 3 days were not observed, but Dicer, Ago2 and EphB6 levels were significantly higher at 14 days compared to NO animals, and Dicer and Ago2 were also higher compared to 3 days. Altogether, these results show some resemblance, but do not completely overlap, with the pathways predicted to be activated and inhibited by the bioinformatics analysis of the miRNA profile observed in plasma.
In our study, we were able to identify several specific miRNAs circulating in plasma following bone injury that were also previously reported to be differently expressed in the plasma of human patients with bone-related conditions. Five miRNAs — miR-223-3p, miR-21-5p, miR-122-5p, miR-23a and miR-25-3p — were consistently up-regulated in plasma of injured animals at 14 days post-injury and have also been reported as up-regulated in the serum of osteoporotic fracture patients [24]. miR-122-5p and miR-21-5p were also found up-regulated in the serum of osteoporotic fracture patients by Panach et al. [25]. Kocijan et al. found an up-regulation of miR-320a in the serum of idiopathic osteoporosis patients with low impact traumatic fractures, and a down-regulation of miR-16-5p, miR-215-5p and let-7b-5p [26]. In our model, we found the same expression pattern for miR-320-3p (homologous to human miR-320a) and miR-16-5p at day 14 after injury. Moreover, miR-215-5p was not detected at day 3 post-injury, and, interestingly, it was up-regulated at day 14 compared to control animals. Similarly, let-7b-5p was down-regulated at day 3 post-injury, and up-regulated at day 14 post-injury.
From the miRNAs detected in plasma over time after bone injury, several members of the let-7 family were down-regulated at day 3 and specifically up-regulated at day 14 post-injury relative to NO control animals (as highlighted in bold in Tables S1-S3). This up-regulation of individual miRNAs belonging to the let-7 family is in agreement with the local expression pattern observed in murine union and non-union fractures over time after injury [21,22]. Thus, the current work demonstrates that the systemic response to bone injury also occurs at the miRNA level and reflects, at least in part, the local response that takes place upon bone injury. This is further supported by the up-regulation of several miRNAs (let-7a, let-7d and miR-21) in splenocytes in response to bone injury.
miRNAs of the let-7 family are classically considered as tumour suppressors, targeting mRNAs of genes such as RAS, cyclin D1/2, IGFR1 and AKT2 in different cancer models [42]. However, their role in tissue repair remains vastly uncharacterized. In the context of immune response, let-7 family members have been reported both as pro-inflammatory and anti-inflammatory miRNAs, depending on the cell type where they are being expressed and the inflammatory context. For instance, let-7c is reported to regulate murine bone marrow-derived macrophage polarization towards the M2 pro-regenerative phenotype [43]. On the other hand, let-7c is implicated in enhancing dendritic cell activation, with its overexpression in murine bone marrow-derived dendritic cells leading to an increase in the secretion of IL-6 upon LPS stimulation [44]. This dual role of let-7 miRNAs is also extended to other biological processes that may impact later stages of bone tissue repair, such as cell proliferation. In general, let-7 miRNAs are considered inhibitors of cell proliferation and, in accordance with this, the bioinformatics analysis performed predicted an anti-proliferative role for the miRNA expression profile at day 14 versus day 3 post-injury. Previous studies have shown that let-7a inhibited proliferation of murine MSC [45]; but, in the work of Wang et al., the overexpression of let-7c in human MSC did not significantly alter their proliferative capacity [46]. Additionally, different members of the let-7 family have been shown to regulate MSC differentiation. In the work of Wei et al., let-7c was demonstrated to promote MSC osteogenic differentiation [47]. On the other hand, let-7a, let-7b, let-7c, let-7d, let-7i, let-7f and let-7g were reported to be down-regulated in murine pre-osteoblasts stimulated to differentiate into osteocytes [48], further supporting the concept that miRNA expression regulation in time is needed for the successful regeneration of injured bone. Thus, it is possible that up-regulation of let-7 at 14 days post-injury is related with the initiation of MSC differentiation processes at the beginning of the repair phase, towards bone tissue regeneration [5]. From our results and those of others, reported in the literature, it is clear that the role of the let-7 family in bone tissue repair is complex and needs to be further studied. It is likely that different members of the let-7 family have different, but complementary, biological roles depending on the cell population where they are expressed, which overall can benefit tissue repair/regeneration at different stages of the process. Furthermore, our results may also be explained by the levels of expression of let-7 achieved in response to injury. Indeed, a recent study demonstrated that a tight regulation of the levels of the let-7 family members is necessary to allow regenerative processes to occur, maintaining the balance between promotion of regeneration and prevention of tumorigenesis [49].
From circulating miRNA expression profile, we found that miR-21, classically recognized as an oncomir, was up-regulated at day 14 after injury in comparison to day 3 (highlighted in bold in Tables S1-S3). However, miR-21 has also been reported as a mediator of angiogenesis and wound healing [50], and this expression pattern was also previously described in bone tissue of union and non-union fracture animal models [21,22]. Also, rat MSC overexpressing miR-21 induced better fracture healing, with a recent review suggesting that the pro-osteogenic role of miR-21 may be through the indirect regulation of Col1a1, and that it is induced by the TGF-β and BMP pathways [51]. Moreover, as mentioned above, a clinical study comparing circulating miRNAs in serum of patients with osteoporotic fractures with non-osteoporotic fracture patients revealed a significant up-regulation of miR-21 [24]; however, this study did not focus on the comparison with the plasma miRNA profile upon fracture in healthy subjects. Later, the work of Panach et al. confirmed this result, showing a significant increase in miR-21 levels in serum of osteoporotic fracture patients compared with osteoarthritis patients [25]. Interestingly, miR-21 is one of the most described immunomodulatory miRNAs, having a major anti-inflammatory role. Expression of miR-21 can be triggered by pro-inflammatory stimuli, such as LPS and IL-6, and also by TGF-β, as demonstrated for murine bone marrow myeloid-derived suppressor cells [52]. In turn, the high levels of miR-21 initiate a negative feedback loop that controls inflammation and promotes its resolution. Indeed, transfection of a murine macrophage cell line with miR-21 decreased the levels of NF-κB and PDCD4, while increasing secretion of IL-10 [53]. Nonetheless, a study by Fabbri and colleagues showed that miR-21 can be recognized by Toll-like receptors and also pointed out a pro-inflammatory role for this miRNA in myeloid cells [54]. Proliferation is another biological process regulated by miR-21. Different studies have been suggesting that the effect of miR-21 on MSC proliferation may vary depending on cell origin, inhibiting proliferation of adipose tissue-derived MSC and of specific populations of amniotic fluid-derived MSC, but promoting proliferation of bone marrow-derived MSC [55,56]. Nevertheless, considering the simultaneous up-regulation of circulating let-7 and mR-21 that we found at day 14 post-injury, it is likely that the pro-proliferative action of miR-21 upon MSC is balanced by the inhibitory action of let-7, and thus the final outcome will depend on the strength of both signals in target cells. Interestingly, miR-21 has been identified both in vitro and in vivo as a strong promoter of osteogenesis [57,58], and could be involved in the initiation of MSC differentiation at day 14 post-injury.
In addition to these miRNAs, miR-122, found up-regulated at 14 days in the current study, has also been related to bone fractures, being highly up-regulated in the serum of patients with osteoporotic fractures [24,25]. Interestingly, the expression of miR-122 was reported to be dependent on inflammation in other injury models. In a rat model of chronic chemically-induced toxic hepatitis, higher levels of IL-6 and TNF-α were correlated with decreased levels of miR-122 in the affected liver tissue [59], which suggests that, in our study, the expected resolution of inflammation at day 14 after bone injury likely allowed miR-122 expression. Considering that miR-122 is a biomarker of liver injury and stress, it is unclear what causes its up-regulation in the plasma in our injury model (since no major alteration of liver tissue was detected) and in the serum of osteoporotic fracture patients, and further studies are needed in the field, namely exploring possible systemic metabolic changes caused by the dysfunctional bone in both situations [60]. On the other hand, miR-122 has been reported as a tumour suppressor miRNA in different tumour types, including osteosarcoma, inhibiting processes such as cell proliferation [61,62]. Thus, its overexpression in the plasma of injured animals at day 14 further supports an anti-proliferative role for the circulating miRNA expression profile over time after injury. In our previous works we demonstrated that miR-195 inhibits MSC proliferation, osteogenic differentiation, and angiogenic activity [63]. Interestingly, in this work, the levels of miR-195 were decreased in plasma at day 14 post-injury, compared to NO animals (highlighted in Table S2), which is in accordance with the biological processes expected to occur at this stage of response to bone injury.
Considering the pleiotropic action of miRNAs, the ultimate biological effect they mediate in a target cell will depend on the balanced integration of signals induced by different miRNAs. This is only partially supported by our results on the effect of total plasma in MSC proliferation. Despite the prediction for a profile of miRNAs that reduced cell proliferation from day 3 to 14 post-injury, there was increased MSC proliferation in response to plasma from both time points. Of note, we cannot exclude the role of other mediators present in plasma on the observed effect on MSC proliferation. Other studies also demonstrated the capacity of plasma or serum to affect MSC proliferation. In the work by Kim et al., serum from a rat stroke model was able to promote MSC proliferation via miRNA-20a up-regulation [64]. More interestingly, serum from bone trauma patients was also shown to enhance the proliferation of healthy bone marrow-derived MSC, although the timepoint after trauma for sample collection was not clear from this study, and comparison with the effects of stimulation with serum from healthy donors was not performed [65].
Our results also show that protein levels of Dicer and Ago2, predicted to be down-regulated at day 3 and to recover by day 14, were down-regulated, but remained low in PBMC, while no reduction was observed at 3 days in splenocytes, but there was an increase at day 14. Activation of T cells is reported to lead to a general miRNA depletion and the down-regulation of miRNA processing proteins like Ago2 [66], similar to what was observed in the plasma and blood cells of our animals, respectively. The EphB6 showed a similar pattern of expression, with down-regulation in PBMC at both time points and up-regulation in splenocytes at day 14. Interestingly, EphB6 was demonstrated to be important for eliciting an effective and strong T cell activation [67]. In addition, this receptor was previously implicated in the regulation of miRNA expression in breast carcinoma cells [68]. Together, our results support a systemic role for circulating mediators in plasma in the activation of different cell processes at target cells.
In conclusion, the current work provides a detailed profile of plasma miRNAs upon bone injury. The profile obtained and the similarities with the previously reported local miRNA expression indicates that the local response is mirrored at the systemic level and supports the future use of liquid biopsies for monitoring the regenerative process. The temporally regulated expression of the let-7 family, miR-21 and miR-122, supports their important role in the resolution of inflammation and start of the repair/regenerative stage, rendering them as attractive candidate biomarkers for such monitoring. Moreover, this work contributes to a better understanding of healthy bone healing, which can be explored for the design of new therapies for bone repair and regeneration.
Abbreviations
Ago2: argonaute 2; DGAV: Direção-Geral de Alimentação e Veterinária; EphB6: ephrin receptor B6; FBS: fetal bovine serum; FDR: false discovery rate; H&E: haematoxylin and eosin; IPA: Ingenuity pathway analysis; miRNA: microRNA; mRNA: messenger RNA; MSC: mesenchymal stem/stromal cells; NO: non-operated; PBMC: peripheral blood mononuclear cells; RNA: ribonucleic acid; RT: room temperature; RT-qPCR: reverse transcription-quantitative polymerase chain reaction; SDS-PAGE: sodium dodecyl sulphate-polyacrylamide gel electrophoresis; SFM: serum-free media; α-MEM: minimum essential medium alpha modification.
Acknowledgements
This work was funded by project NORTE-01-0145-FEDER-000012, supported by Norte Portugal Regional Operational Programme (NORTE 2020), under the PORTUGAL 2020 Partnership Agreement, through the European Regional Development Fund (ERDF), and AO Foundation-Switzerland (project S-15-83S). AMS, MIA, CC and JHT were supported by FCT-Fundação para a Ciência e a Tecnologia, through fellowships SFRH/BD/85968/2012, SFRH/BPD/91011/2012, SFRH/BDP/87071/2012 and SFRH/BD/112832/2015, respecttively. Work in Dr. Calin's laboratory is supported by National Institutes of Health (NIH/NCATS) grant UH3TR00943-01 through the NIH Common Fund, Office of Strategic Coordination (OSC), the NIH/NCI grant 1 R01 CA182905-01, a U54 grant - UPR/MDACC Partnership for Excellence in Cancer Research 2016 Pilot Project, a Team DOD (CA160445P1) grant, a Ladies Leukemia League grant, a CLL Moonshot Flagship project, a SINF 2017 grant, and the Estate of C. G. Johnson, Jr.
Supplementary Material
Supplementary figures and tables.
Competing Interests
The authors have declared that no competing interest exists.
References
1. Karin M, Clevers H. Reparative inflammation takes charge of tissue regeneration. Nature. 2016;529(7586):307-15
2. Eming SA, Wynn TA, Martin P. Inflammation and metabolism in tissue repair and regeneration. Science. 2017;356(6342):1026-30
3. Santos SG, Lamghari M, Almeida CR, Oliveira MI, Neves N, Ribeiro AC. et al. Adsorbed fibrinogen leads to improved bone regeneration and correlates with differences in the systemic immune response. Acta Biomater. 2013;9(7):7209-17
4. Vasconcelos DM, Gonçalves RM, Almeida CR, Pereira IO, Oliveira MI, Neves N. et al. Fibrinogen scaffolds with immunomodulatory properties promote in vivo bone regeneration. Biomaterials. 2016;111:163-78
5. Loi F, Córdova LA, Pajarinen J, Lin T, Yao Z, Goodman SB. Inflammation, fracture and bone repair. Bone. 2016;86:119-30
6. Claes L, Recknagel S, Ignatius A. Fracture healing under healthy and inflammatory conditions. Nat Rev Rheumatol. 2012;8(3):133-43
7. Sen CK. MicroRNAs as new maestro conducting the expanding symphony orchestra of regenerative and reparative medicine. Physiol Genomics. 2011;43(10):517-20
8. Bartel DP. MicroRNAs: Genomics, Biogenesis, Mechanism, and Function. Cell. 2004;116(2):281-97
9. Ha M, Kim VN. Regulation of microRNA biogenesis. Nat Rev Mol Cell Biol. 2014;15(8):509-24
10. Valinezhad Orang A, Safaralizadeh R, Kazemzadeh-Bavili M. Mechanisms of miRNA-Mediated Gene Regulation from Common Downregulation to mRNA-Specific Upregulation. Int J Genomics. 2014;2014:970607
11. Lewis BP, Shih I, Jones-Rhoades MW, Bartel DP, Burge CB. Prediction of Mammalian MicroRNA Targets. Cell. 2003;115(7):787-98
12. Wu S, Huang S, Ding J, Zhao Y, Liang L, Liu T. et al. Multiple microRNAs modulate p21Cip1/Waf1 expression by directly targeting its 3' untranslated region. Oncogene. 2010;29(15):2302-8
13. Van Roosbroeck K, Pollet J, Calin GA. miRNAs and long noncoding RNAs as biomarkers in human diseases. Expert Rev Mol Diagn. 2013;13(2):183-204
14. Yan IK, Wang X, Asmann YW, Haga H, Patel T. Circulating Extracellular RNA Markers of Liver Regeneration. PloS One. 2016;11(7):e0155888
15. Mobasheri A, Henrotin Y. Biomarkers of (osteo)arthritis. Biomarkers. 2015;20(8):513-8
16. Schwarzenbach H, Nishida N, Calin GA, Pantel K. Clinical relevance of circulating cell-free microRNAs in cancer. Nat Rev Clin Oncol. 2014;11(3):145-56
17. Viereck J, Thum T. Circulating Noncoding RNAs as Biomarkers of Cardiovascular Disease and Injury. Circ Res. 2017;120(2):381-99
18. Chen X, Zhao Y, Wang F, Bei Y, Xiao J, Yang C. MicroRNAs in Liver Regeneration. Cell Physiol Biochem. 2015;37(2):615-28
19. Zhou P, Chen Z, Zou Y, Wan X. Roles of Non-Coding RNAs in Acute Kidney Injury. Kidney Blood Press Res. 2016;41(6):757-69
20. Gerlach CV, Vaidya VS. MicroRNAs in injury and repair. Arch Toxicol. 2017;91(8):2781-97
21. Hadjiargyrou M, Zhi J, Komatsu DE. Identification of the microRNA transcriptome during the early phases of mammalian fracture repair. Bone. 2016;87:78-88
22. Waki T, Lee SY, Niikura T, Iwakura T, Dogaki Y, Okumachi E. et al. Profiling microRNA expression during fracture healing. BMC Musculoskelet Disord. 2016:17 (83)
23. Garmilla-Ezquerra P, Sañudo C, Delgado-Calle J, Pérez-Nuñez MI, Sumillera M, Riancho JA. Analysis of the bone microRNome in osteoporotic fractures. Calcif Tissue Int. 2015;96(1):30-7
24. Seeliger C, Karpinski K, Haug AT, Vester H, Schmitt A, Bauer JS. et al. Five freely circulating miRNAs and bone tissue miRNAs are associated with osteoporotic fractures. J Bone Miner Res. 2014;29(8):1718-28
25. Panach L, Mifsut D, Tarín JJ, Cano A, García-Pérez MÁ. Serum Circulating MicroRNAs as Biomarkers of Osteoporotic Fracture. Calcif Tissue Int. 2015;97(5):495-505
26. Kocijan R, Muschitz C, Geiger E, Skalicky S, Baierl A, Dormann R. et al. Circulating microRNA Signatures in Patients With Idiopathic and Postmenopausal Osteoporosis and Fragility Fractures. J Clin Endocrinol Metab. 2016;101(11):4125-34
27. Einhorn TA, Gerstenfeld LC. Fracture healing: mechanisms and interventions. Nat Rev Rheumatol. 2015;11(1):45-54
28. Oliveros JC. Venny. An interactive tool for comparing lists with Venn's diagrams. [Internet]. 2007 Available from: http://bioinfogp.cnb.csic.es/tools/venny/index.html
29. Krämer A, Green J, Pollard J, Tugendreich S. Causal analysis approaches in Ingenuity Pathway Analysis. Bioinformatics. 2014;30(4):523-30
30. Cunha C, Almeida CR, Almeida MI, Silva AM, Molinos M, Lamas S. et al. Systemic Delivery of Bone Marrow Mesenchymal Stem Cells for In Situ Intervertebral Disc Regeneration. Stem Cells Transl Med. 2017;6(3):1029-1039
31. Roderburg C, Benz F, Vargas Cardenas D, Koch A, Janssen J, Vucur M. et al. Elevated miR-122 serum levels are an independent marker of liver injury in inflammatory diseases. Liver Int. 2015;35(4):1172-84
32. Scotti C, Tonnarelli B, Papadimitropoulos A, Scherberich A, Schaeren S, Schauerte A. et al. Recapitulation of endochondral bone formation using human adult mesenchymal stem cells as a paradigm for developmental engineering. Proc Natl Acad Sci. 2010;107(16):7251-6
33. de Candia P, Torri A, Fedeli M, Viganò V, Carpi D, Gorletta T. et al. The circulating microRNome demonstrates distinct lymphocyte subset-dependent signatures. Eur J Immunol. 2016;46(3):725-31
34. Recknagel S, Bindl R, Kurz J, Wehner T, Ehrnthaller C, Knöferl MW. et al. Experimental blunt chest trauma impairs fracture healing in rats. J Orthop Res. 2011;29(5):734-9
35. Hernandez RK, Do TP, Critchlow CW, Dent RE, Jick SS. Patient-related risk factors for fracture-healing complications in the United Kingdom General Practice Research Database. Acta Orthop. 2012;83(6):653-60
36. Sears BW, Stover MD, Callaci J. Pathoanatomy and Clinical Correlates of the Immunoinflammatory Response Following Orthopaedic Trauma. J Am Acad Orthop Surg. 2009;17(4):255-65
37. Hak DJ, Fitzpatrick D, Bishop JA, Marsh JL, Tilp S, Schnettler R. et al. Delayed union and nonunions: epidemiology, clinical issues, and financial aspects. Injury. 2014;45(Suppl 2):S3-7
38. Almeida MI, Reis RM, Calin GA. MicroRNA history: discovery, recent applications, and next frontiers. Mutat Res. 2011;717(1-2):1-8
39. Shu J, Kren BT, Xia Z, Wong PY-P, Li L, Hanse EA. et al. Genomewide microRNA down-regulation as a negative feedback mechanism in the early phases of liver regeneration. Hepatology. 2011;54(2):609-19
40. Alsaleh G, Nehmar R, Blüml S, Schleiss C, Ostermann E, Dillenseger J-P. et al. Reduced DICER1 Expression Bestows Rheumatoid Arthritis Synoviocytes Proinflammatory Properties and Resistance to Apoptotic Stimuli. Arthritis Rheumatol. 2016;68(8):1839-48
41. Zheng L, Tu Q, Meng S, Zhang L, Yu L, Song J. et al. Runx2/DICER/miRNA Pathway in Regulating Osteogenesis. J Cell Physiol. 2017;232(1):182-91
42. Wang T, Wang G, Hao D, Liu X, Wang D, Ning N. et al. Aberrant regulation of the LIN28A/LIN28B and let-7 loop in human malignant tumors and its effects on the hallmarks of cancer. Mol Cancer. 2015;14:125
43. Banerjee S, Xie N, Cui H, Tan Z, Yang S, Icyuz M. et al. MicroRNA let-7c Regulates Macrophage Polarization. J Immunol. 2013;190(12):6542-9
44. Kim SJ, Gregersen PK, Diamond B. Regulation of dendritic cell activation by microRNA let-7c and BLIMP1. J Clin Invest. 2013;123(2):823-33
45. Yu Y, Liao L, Shao B, Su X, Shuai Y, Wang H. et al. Knockdown of MicroRNA Let-7a Improves the Functionality of Bone Marrow-Derived Mesenchymal Stem Cells in Immunotherapy. Mol Ther. 2017;25(2):480-93
46. Wang B, Yao K, Huuskes BM, Shen H-H, Zhuang J, Godson C. et al. Mesenchymal Stem Cells Deliver Exogenous MicroRNA-let7c via Exosomes to Attenuate Renal Fibrosis. Mol Ther. 2016;24(7):1290-301
47. Wei J, Li H, Wang S, Li T, Fan J, Liang X. et al. let-7 Enhances Osteogenesis and Bone Formation While Repressing Adipogenesis of Human Stromal/Mesenchymal Stem Cells by Regulating HMGA2. Stem Cells Dev. 2014;23(13):1452-63
48. Eguchi T, Watanabe K, Hara ES, Ono M, Kuboki T, Calderwood SK. OstemiR: a novel panel of microRNA biomarkers in osteoblastic and osteocytic differentiation from mesencymal stem cells. PloS One. 2013;8(3):e58796
49. Wu L, Nguyen LH, Zhou K, Soysa TY de, Li L, Miller JB. et al. Precise let-7 expression levels balance organ regeneration against tumor suppression. eLife. 2015;4:e09431
50. Hu Y, Rao S-S, Wang Z-X, Cao J, Tan Y-J, Luo J. et al. Exosomes from human umbilical cord blood accelerate cutaneous wound healing through miR-21-3p-mediated promotion of angiogenesis and fibroblast function. Theranostics. 2018;8(1):169-84
51. Sera SR, Zur Nieden NI. microRNA Regulation of Skeletal Development. Curr Osteoporos Rep. 2017;15(4):353-66
52. Li L, Zhang J, Diao W, Wang D, Wei Y, Zhang C-Y. et al. MicroRNA-155 and MicroRNA-21 promote the expansion of functional myeloid-derived suppressor cells. J Immunol. 2014;192(3):1034-43
53. Sheedy FJ, Palsson-McDermott E, Hennessy EJ, Martin C, O'Leary JJ, Ruan Q. et al. Negative regulation of TLR4 via targeting of the proinflammatory tumor suppressor PDCD4 by the microRNA miR-21. Nat Immunol. 2010;11(2):141-7
54. Fabbri M, Paone A, Calore F, Galli R, Gaudio E, Santhanam R. et al. MicroRNAs bind to Toll-like receptors to induce prometastatic inflammatory response. Proc Natl Acad Sci. 2012;109(31):12278-9
55. Kim YJ, Hwang SH, Cho HH, Shin KK, Bae YC, Jung JS. MicroRNA 21 regulates the proliferation of human adipose tissue-derived mesenchymal stem cells and high-fat diet-induced obesity alters microRNA 21 expression in white adipose tissues. J Cell Physiol. 2012;227(1):183-93
56. Trohatou O, Zagoura D, Bitsika V, Pappa KI, Antsaklis A, Anagnou NP. et al. Sox2 suppression by miR-21 governs human mesenchymal stem cell properties. Stem Cells Transl Med. 2014;3(1):54-68
57. Meng Y-B, Li X, Li Z-Y, Zhao J, Yuan X-B, Ren Y. et al. microRNA-21 promotes osteogenic differentiation of mesenchymal stem cells by the PI3K/β-catenin pathway. J Orthop Res. 2015;33(7):957-64
58. Sun Y, Xu L, Huang S, Hou Y, Liu Y, Chan K-M. et al. mir-21 overexpressing mesenchymal stem cells accelerate fracture healing in a rat closed femur fracture model. BioMed Res Int. 2015;2015:412327
59. Li C, Deng M, Hu J, Li X, Chen L, Ju Y. et al. Chronic inflammation contributes to the development of hepatocellular carcinoma by decreasing miR-122 levels. Oncotarget. 2016;7(13):17021-34
60. Suchacki KJ, Roberts F, Lovdel A, Farquharson C, Morton NM, MacRae VE. et al. Skeletal energy homeostasis: a paradigm of endocrine discovery. J Endocrinol. 2017;234(1):R67-79
61. Rao M, Zhu Y, Zhou Y, Cong X, Feng L. MicroRNA-122 inhibits proliferation and invasion in gastric cancer by targeting CREB1. Am J Cancer Res. 2017;7(2):323-33
62. Ma J, Ma J, Wu Q, Wu Q, Zhang Y, Zhang Y. et al. microRNA sponge blocks the tumor-suppressing functions of microRNA-122 in human hepatoma and osteosarcoma cells. Oncol Rep. 2014;32(6):2744-52
63. Almeida MI, Silva AM, Vasconcelos DM, Almeida CR, Caires H, Pinto MT. et al. miR-195 in human primary mesenchymal stromal/stem cells regulates proliferation, osteogenesis and paracrine effect on angiogenesis. Oncotarget. 2015;7(1):7-22
64. Kim EH, Kim DH, Kim HR, Kim SY, Kim HH, Bang OY. Stroke Serum Priming Modulates Characteristics of Mesenchymal Stromal Cells by Controlling the Expression miRNA-20a. Cell Transplant. 2016;25(8):1489-99
65. Tan HB, Giannoudis PV, Boxall SA, McGonagle D, Jones E. The systemic influence of platelet-derived growth factors on bone marrow mesenchymal stem cells in fracture patients. BMC Med. 2015;13:6
66. Bronevetsky Y, Villarino AV, Eisley CJ, Barbeau R, Barczak AJ, Heinz GA. et al. T cell activation induces proteasomal degradation of Argonaute and rapid remodeling of the microRNA repertoire. J Exp Med. 2013;210(2):417-32
67. Wu J, Luo H. Recent advances on T-cell regulation by receptor tyrosine kinases. Curr Opin Hematol. 2005;12(4):292-7
68. Bhushan L, Kandpal RP. EphB6 Receptor Modulates Micro RNA Profile of Breast Carcinoma Cells. PloS One. 2011;6(7):e22484
Author contact
![]() Corresponding author: Susana G. Santos, INEB - Instituto de Engenharia Biomédica, Rua Alfredo Allen, 208, 4200-135 Porto, Portugal. E-mail: susana.santosup.pt; Phone: +351 220 408 800; ext: 6075
Corresponding author: Susana G. Santos, INEB - Instituto de Engenharia Biomédica, Rua Alfredo Allen, 208, 4200-135 Porto, Portugal. E-mail: susana.santosup.pt; Phone: +351 220 408 800; ext: 6075