Impact Factor
- Issue 14; 2026
- Issue 13; 2026
- Issue 12; 2026
- Issue 11; 2026
- Issue 10; 2026
- Volume 16; 2026
- Advance Articles
- Past Issues
- Cover Images
- Cover Suggestion
- Index & Coverage
- Special Issues
Introduction
Results
Discussion
Methods
Abbreviations
Supplementary Material
Acknowledgements
References
International Journal of Biological Sciences
International Journal of Medical Sciences
 Global reach, higher impact

Theranostics 2018; 8(14):3991-4002. doi:10.7150/thno.23709 This issue Cite
Research Paper
[18F]fluoroethyltyrosine-induced Cerenkov Luminescence Improves Image-Guided Surgical Resection of Glioma
David Y. Lewis1,4 ![]() *, Richard Mair1,2*, Alan Wright1, Kieren Allinson3, Scott K. Lyons1, Tom Booth1, Julia Jones1, Robert Bielik1, Dmitry Soloviev1,4, Kevin M. Brindle1,2
*, Richard Mair1,2*, Alan Wright1, Kieren Allinson3, Scott K. Lyons1, Tom Booth1, Julia Jones1, Robert Bielik1, Dmitry Soloviev1,4, Kevin M. Brindle1,2
1. Cancer Research UK - Cambridge Institute, University of Cambridge, Li Ka Shing Centre, Cambridge, UK
2. Department of Biochemistry, University of Cambridge, Cambridge, UK
3. Department of Pathology, Cambridge University Hospitals NHS Foundation Trust, Cambridge, UK
4. Current address: Cancer Research UK - Beatson Institute, Garscube Estate, Switchback Road, Bearsden, Glasgow, UK
* These authors contributed equally to this work
Received 2017-11-7; Accepted 2018-4-26; Published 2018-7-1
Abstract

The extent of surgical resection is significantly correlated with outcome in glioma; however, current intraoperative navigational tools are useful only in a subset of patients. We show here that a new optical intraoperative technique, Cerenkov luminescence imaging (CLI) following intravenous injection of O‑(2-[18F]fluoroethyl)-L-tyrosine (FET), can be used to accurately delineate glioma margins, performing better than the current standard of fluorescence imaging with 5-aminolevulinic acid (5-ALA).
Methods: Rats implanted orthotopically with U87, F98 and C6 glioblastoma cells were injected with FET and 5-aminolevulinic acid (5-ALA). Positive and negative tumor regions on histopathology were compared with CL and fluorescence images. The capability of FET CLI and 5-ALA fluorescence imaging to detect tumor was assessed using receptor operator characteristic curves and optimal thresholds (CLIOptROC and 5-ALAOptROC) separating tumor from healthy brain tissue were determined. These thresholds were used to guide prospective tumor resections, where the presence of tumor cells in the resected material and in the remaining brain were assessed by Ki-67 staining.
Results: FET CLI signal was correlated with signal in preoperative PET images (y = 1.06x - 0.01; p < 0.0001) and with expression of the amino acid transporter SLC7A5 (LAT1). FET CLI (AUC = 97%) discriminated between glioblastoma and normal brain in human and rat orthografts more accurately than 5-ALA fluorescence (AUC = 91%), with a sensitivity >92% and specificity >91%, and resulted in a more complete tumor resection.
Conclusion: FET CLI can be used to accurately delineate glioblastoma tumor margins, performing better than the current standard of fluorescence imaging following 5-ALA administration, and is therefore a promising technique for clinical translation.
Keywords: Cerenkov luminescence imaging, FET, glioblastoma, 5-ALA, intraoperative
Introduction
Brain tumors are the leading cause of cancer-related deaths in children and adults under the age of forty, accounting for an average of twenty years of life lost per person [1]. Glioma is the most common brain malignancy, occurring as both low (diffuse) and high grade (glioblastoma) subtypes [2]. Surgery is performed in the majority of patients and the extent of resection is correlated with survival [3]. The frequent proximity of glioma to eloquent brain regions and the close resemblance of tumor to normal tissue requires accurate delineation of tumor tissue [3]. This has resulted in the development of several intraoperative adjuncts to tumor identification; however, these all have limitations [4]. Neuro-navigation uses pre-registered magnetic resonance images (MRI) and stereotactic coordinates, but can become unreliable as the brain shifts during surgery [5]. Intraoperative MRI is gaining in popularity although the high cost, surgical delay and surgically induced contrast enhancement detract from its utility [6, 7]. Oral administration of 5-ALA, which leads to the synthesis and accumulation of fluorescent protoporphyrin IX (PPIX), has been used with fluorescence-guided surgery to directly visualize gliomatous tissues. However, 62% of infiltrated tumor tissues do not display 5-ALA fluorescence and 35% of 5-ALA fluorescent regions do not contain tumor cells [8]. The latter is likely due to uptake in white matter and peritumoral regions associated with infiltrating inflammatory cells [8-10]. 5-ALA is also not useful for visualizing low-grade disease as accumulation requires, at least in part, breakdown of the blood-brain barrier [11, 12].
Ninety-six percent of high-grade and 79% of low-grade gliomas can be detected by PET using the radiolabeled amino acid analogue, O-(2-[18F]fluoroethyl)-L-tyrosine (FET) [13]. FET is transported into glial cells by the LAT1 transporter, independent of blood brain barrier disruption [14]. FET has superior sensitivity and specificity in distinguishing glioma from normal brain tissue and is better at isolating the extent of infiltration than MRI [15-17]. A biopsy-validated study, in which 5‑ALA and FET were co-administered, demonstrated that FET PET was better at identifying tumor tissue [12]. The use of FET for diagnosis and surgical planning of glioma surgery has been advocated but its use in an intraoperative setting has yet to be investigated.
Cerenkov luminescence imaging (CLI) is a bedside, optical technology that allows real-time imaging of β radiation in vivo [18, 19]. Cerenkov light is generated when a charged particle, such as a positron, exceeds the speed of light in a dielectric medium [19]. The emitted short wavelength light is easily scattered and absorbed by a few millimeters of overlying tissue and therefore the detected CLI signal originates predominately from the surface of the tissue. This provides higher spatial resolution, at the expense of poor depth penetration, thus making it suited to detection in the surgical environment. Charge-coupled devices also detect light at higher spatial resolution than scintillation crystals and photomultiplier tubes for PET detection. The clinical feasibility of CLI has been demonstrated recently, although the advantages of this technology over conventional intraoperative techniques remains to be established [20-27]. We show here FET-CLI can be used to guide glioma resection and demonstrate improved performance over 5‑ALA fluorescence imaging [28]. We propose a novel imaging paradigm for glioma, in which pre-operative FET PET/MRI is used for surgical planning and FET-induced Cerenkov luminescence for guiding subsequent intraoperative resection.
Results
LAT1 expression allows tumor detection in Cerenkov luminescence and PET images of [18F]-fluoroethyltyrosine
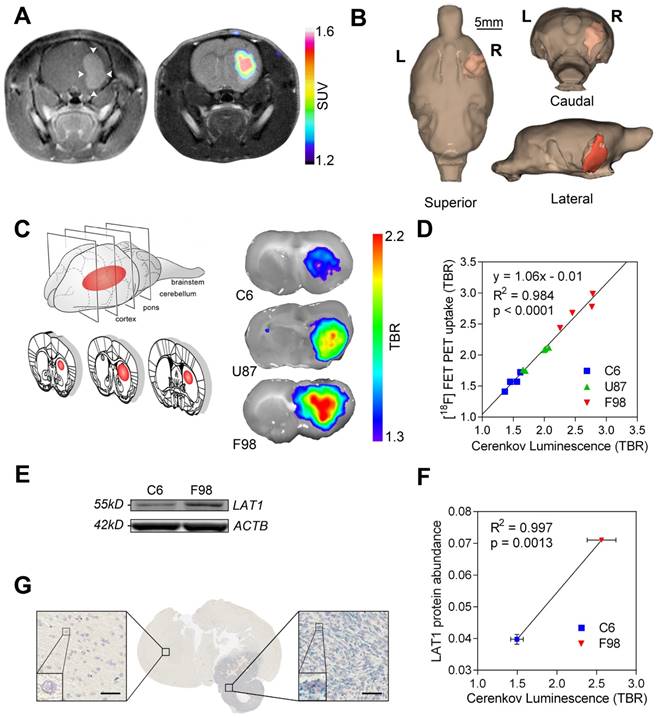
Orthotopic brain tumors were obtained by stereotactic implantation of human U87, and rat F98 and C6 glioblastoma cells into the forebrains of rats. FET uptake was observed in all tumor models and was localized to areas of contrast agent enhancement in T1-weighted MR images, indicating the presence of blood brain barrier (BBB)-disrupting glioblastomas in the right hemisphere (Figure 1A and Figure S1A). Tumor extent was determined by FET PET measurements and this volume was then superimposed on an MR image of brain anatomy. In the clinic this three-dimensional image co-registration could aid patient selection and surgical planning (Figure 1B and Figure S1B). At 60 min after FET injection, when PET contrast between tumor and normal brain in the U87 and F98 glioma models had plateaued (Figure S1C-D), brains were removed, the tumors exposed by cutting 2 mm coronal slices through the brain and FET-induced Cerenkov luminescence was imaged. Signal was localized to the glioblastoma and distinguished tumor from healthy contralateral brain (Figure 1C). The background-corrected Cerenkov signal measured in slices of individual tumors was directly proportional to the signal detected in vivo in the corresponding background-corrected FET PET scans (y = 1.06x - 0.01; R2 = 0.984; p < 0.0001) (Figure 1D). Subsequent autoradiography also indicated equivalence in signal quantification between the two imaging modalities (Figure S2). The background-corrected CLI intensity was proportional to LAT1 protein expression (Figure 1E-F and Figure S4) and LAT1 mRNA was highly expressed in the glioblastoma and co-localized with the CLI signal (Figure 1C, G). LAT1 is a promising target for glioma detection as it is overexpressed in clinical low and high-grade gliomas, when compared to normal glia (Figure S3A), and to a higher level than in a number of other common cancer types (Figure S3B).
LAT1-dependent [18F]-fluoroethyltyrosine uptake allows tumor detection using PET and Cerenkov luminescence imaging. (A) Contrast agent-enhanced T1-weighted MR image of an enhanced U87 human glioblastoma (left) and the co-registered FET PET image, rendered in false color, overlaid on a T2-weighted MR image (right). Tumor location is arrowed. (B) 3D segmentation and visualization of the tumor using FET PET and normal brain tissue using MRI. (C) FET CLI in C6, U87 and F98 glioblastoma tumor slices. (D) Linear regression of PET and CLI FET tumor-to-background ratios (TBR) in C6 (n=4), U87 (n=4) and F98 (n=4) glioblastoma tumors. (E) Western blot of LAT1 protein expression in C6 and F98 cell lines. (F) Correlation between LAT1 protein expression in the cell lines and Cerenkov luminescence from the corresponding tumor slices (n=2 for LAT1 and n=4 for CLI for each cell type). LAT1 protein abundance represents the intensity of the LAT1 band on the Western blot relative to the band for β-actin. (G) Distribution of rat LAT1 mRNA in the tumor and surrounding brain; bars represent 50 µm.
Cerenkov luminescence imaging of [18F]-fluoroethyltyrosine (FET) more accurately delineates tumor margins than 5-aminolevulinic acid (5-ALA)-induced fluorescence
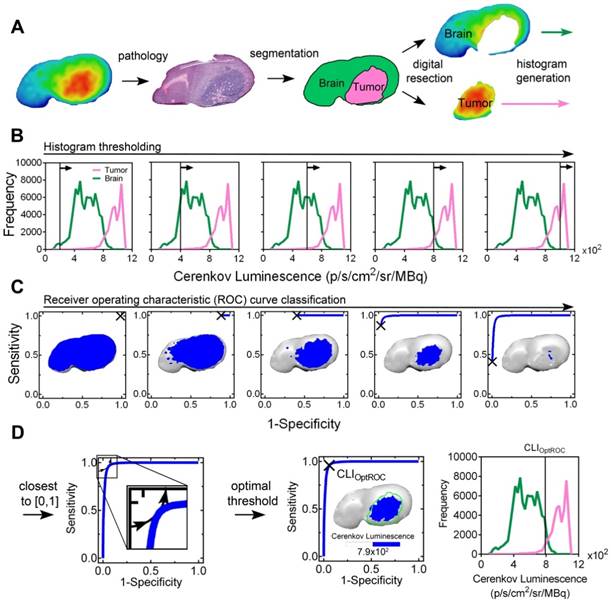
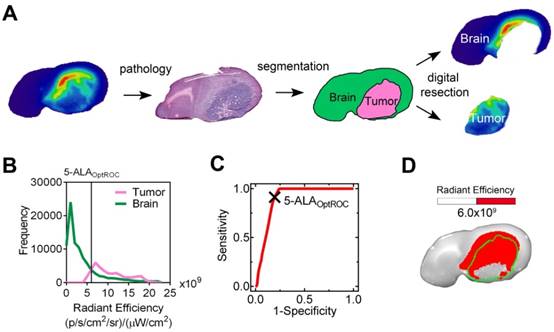
To compare tumor localization of FET Cerenkov luminescence with 5-ALA-induced fluorescence, human U87 and rat F98 glioblastoma cells were implanted orthotopically and 5-ALA and FET were administered 6 h and 1 h respectively prior to brain excision. The timing of administration was based on previous data (Figure S1C-D and [9]). The workflow for image processing and analysis of a FET CLI is shown in (Figure 2); the workflow for imaging PPIX fluorescence was identical (Figure 3). The brains were cut into sequential 2 mm coronal slices and the FET Cerenkov luminescence and PPIX fluorescence signals were imaged (Figure 2A and Figure 3A). The slices were then frozen, cryosectioned into 10 μm slices from the top surface before staining with H&E. An experienced neuropathologist (K.A.), blinded to the FET and PPIX distributions, identified the tumor margins on the H&E stained sections, which were then co-registered with the Cerenkov luminescence and PPIX fluorescence images. The pixel intensity histograms (Figure 2B, Figure 3B and Figure S5) were used to construct individual ROC curves for each image set and for each imaging modality (Figure 2C and Figure 3C). The optimal threshold values (CLIOptROC and 5-ALAOptROC) that separated tumor from normal brain were calculated geometrically as the point closest to the top left hand corner (0, 1) of the ROC curves [29] (Figure 2D and Figure 3C). We then applied these optimal threshold values to the original CLI and PPIX fluorescence images. At CLIOptROC, the FET Cerenkov signal was almost exclusively within the tumor margin whereas at 5-ALAOptROC, there was PPIX fluorescence signal in normal peritumoral brain tissue (Figure 2D and Figure 3D).
[18F]-fluoroethyltyrosine (FET) Cerenkov luminescence image (CLI) segmentation, receiver operating characteristic (ROC) curve and optimal threshold determination. (A) Image segmentation showing pseudocolor FET CLI (far left), H&E staining (left), neuropathology annotation (right) and digital resection (far right) of a F98 rat glioblastoma. (B) Corresponding histogram of FET Cerenkov luminescence; signal from normal brain is shown in green and from tumor in magenta. Vertical lines are indicative of an iterative threshold for ROC curve determination; only five thresholds are shown for clarity. (C) Iterative drawing of ROC curves, corresponding to the thresholds in the histograms shown in (B). FET CL images thresholded to the same level are shown. (D) The optimal threshold (CLIOptROC) was determined as the point of the ROC curve closest to the top left-hand corner [0, 1] (left) and is shown on the ROC curve (middle), with the corresponding thresholded FET CLI (inset) and image histogram (right).
5-ALA (PPIX) fluorescence image segmentation and receiver operating characteristic (ROC) curve. (A) Image segmentation showing pseudocolor 5-ALA fluorescence image (far left), H&E staining (left), neuropathology annotation (right) and digital resection (far right) of a F98 rat glioblastoma. The tumor region was removed digitally according to the margin identified on the H&E stained section. (B) Corresponding histogram of 5-ALA (PPIX) radiant efficiency. Signal from normal brain is shown in green and from tumor in magenta. (C) Corresponding ROC curve; the cross indicates 5-ALAOptROC. (D) White light image of a rat brain slice containing a F98 glioblastoma overlaid with a 5-ALA fluorescence image that has been thresholded at 5-ALAOptROC. The tumor margin, which was identified from the H&E stained section, is indicated by the green line.
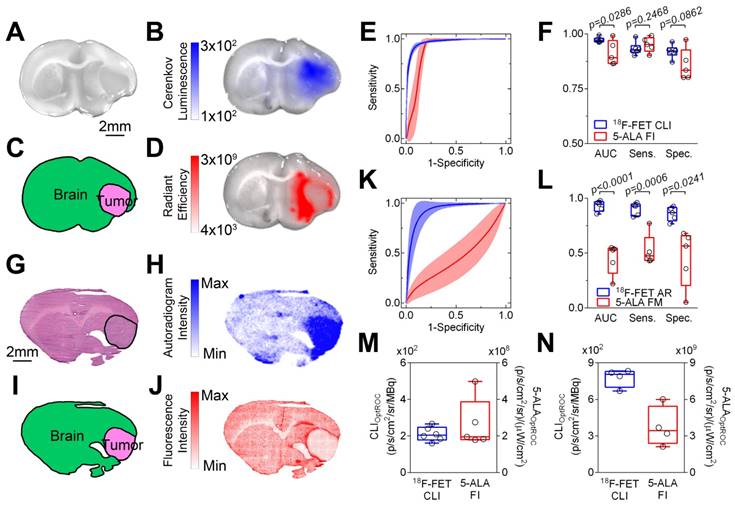
CLI of FET was better able to discriminate tumor from healthy brain tissue than 5‑ALA-induced fluorescence (Figure 4A-D and Figure S6A-D), as indicated by a greater area under the ROC curve in human xenograft (97.3% ± 0.5% vs. 91.2% ± 2.4%; p = 0.0286; Figure 4E-F) and rat tumor models (97.0% ± 1.0% vs. 77.4% ± 4.6%; p = 0.0286; Figure S6E-F). At CLIOptROC and 5-ALAOptROC, the specificity for glioma detection was better with FET CLI than 5‑ALA fluorescence imaging (U87; 92.0% ± 1.2% vs. 85.8% ± 3.2%; p = 0.0862 and F98; 91.1% ± 2.7% vs. 67.2% ± 5.2%; p = 0.0286) with similar sensitivity (U87; 93.3% ± 1.2% vs. 95.2% ± 1.5%; p = 0.2468 and F98; 92.8% ± 1.0% vs. 90.6% ± 1.0%; p = 0.3429) (Figure 4F and Figure S6F). We confirmed these findings at higher spatial resolution on cryosections using autoradiography and confocal microscopy for FET and 5-ALA respectively (Figure 4G-J and Figure S6G-J). Using these higher resolution imaging methods, FET again performed much better than 5‑ALA at distinguishing human (92.9% ± 2.2% vs. 45.0% ± 6.3%; p < 0.0001) and rat glioblastoma (96.2% ± 1.0% vs. 54.8% ± 4.8%; p < 0.0001) from normal rat brain tissue. The sensitivity and specificity of FET was better than 5-ALA (Figure 4K-L and Figure S6K-L). Non-specific 5-ALA signal was localized to peritumoral regions, in particular white matter tracts ipsilateral to the tumor (Figure S7). We then calculated the mean optimal thresholds for each tumor type. The coefficients of variation of CLIOptROC were smaller (9% and 10% for U87 and F98 respectively) than for 5-ALAOptROC (51% and 44% for U87 and F98 respectively), indicating reproducible quantification when using FET CLI as the discriminator (Figure 4M-N).
Cerenkov luminescence imaging (CLI) with [18F]-fluoroethyltyrosine (FET) more accurately delineates human U87 glioblastoma from surrounding brain tissue than imaging 5-aminolevulinic acid (5-ALA)-induced fluorescence. Representative white light image of a rat brain slice containing a U87 human glioblastoma (A) overlaid with the corresponding FET CL (B) and 5-ALA fluorescence images (D). Annotated segmentation (C) obtained by co-registration of the white light image (A) with the corresponding H&E stained section. The tumor margin is delineated by a black line (G). FET autoradiography (H), 5-ALA confocal microscopy (J) and annotated segmentation (I) obtained from an H&E stained section (G). (E) Receiver operating characteristic (ROC) curves for FET CLI (blue) and 5-ALA-induced fluorescence (red). Data are the mean ± s.d. (n≥5). (F) Areas under the ROC curves (AUC), sensitivity and specificity for detection of tumor using FET CLI and 5-ALA-induced fluorescence imaging (n≥5) at CLIOptROC and 5-ALAOptROC. (K) ROC curves obtained from FET autoradiography (blue) and confocal microscopy of 5-ALA-induced fluorescence (red). Data are the mean ± s.d. (n=5). (L) Areas under the ROC curves (AUC), sensitivity and specificity for detection of tumor using FET autoradiography and confocal microscopy of 5-ALA-induced fluorescence (n=5). CLIOptROC and 5-ALAOptROC values for U87 (m) (n≥5) and F98 (n) (n=4) glioblastomas. Box and whisker plots represent the range, interquartile range and the median; crosses indicate means. Data were compared using 2-tailed Mann-Whitney and unpaired t-tests as appropriate.
Surgical resection of GBM is better when guided by FET CLI when compared to imaging of 5-ALA-induced fluorescence
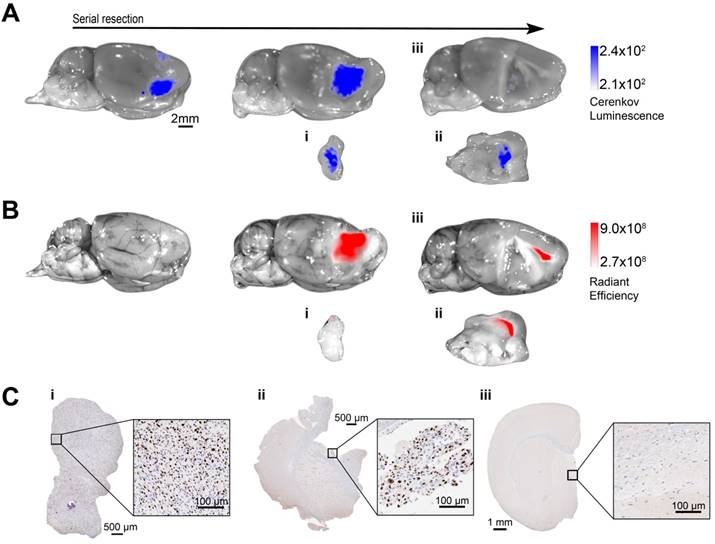
Orthotopic U87 human glioblastoma xenografts were established and whole brains excised 1 h following FET and 6 h following 5-ALA administration (n=3). We then performed FET Cerenkov luminescence (Figure 5A and Figure S9) and 5-ALA-induced fluorescence (Figure 5B and Figure S9) imaging. CLI was then used to guide serial tumor resections by an experienced neurosurgeon (R.M.), with re‑imaging using both modalities after each resection. The image was considered positive for the presence of U87 tumor cells if signal exceeded the optimized mean thresholds of 2.1×10² p‑1 s‑1 cm‑2 sr‑1 MBq‑1 for CLIOptROC and 2.66×10⁸ p‑1 s‑1 cm‑2 sr‑1 mW‑1 cm‑2 for 5-ALAOptROC (Figure 4M). Considerably more Cerenkov luminescence than 5‑ALA fluorescence was identified over the tumor region. Following the initial resection there were no macroscopic tumor remnants visible by white light illumination; however, both Cerenkov luminescence and 5-ALA-induced fluorescence indicated the presence of remaining tumor cells (Figure 5A-B). A further CLI-guided resection was performed and the brain and excised tumor tissue were imaged. Cerenkov luminescence was now at the same level as the surrounding brain (Figure 5Aiii), while fluorescence signal overlying the corpus callosum remained (Figure 5Biii). We confirmed the presence of tumor cells in the Cerenkov luminescence-positive tumor specimens using Ki-67 immunohistochemistry (Figure 5Ci-ii and Figure S9A) and H&E staining (Figure S8). Conversely the Cerenkov luminescence-negative brain contained no detectable tumor cells on histopathology (Figure 5Ciii and Figure S9B). 5-ALA-induced fluorescence was less accurate in detecting tumor cells with a lack of signal in tumor cell-positive specimens (Figure 5Bi, Figure 5Ci and Figure S9A) and positive signal remaining in the healthy normal brain (Figure 5Biii, Figure 5Ciii and Figure S9B).
Image-guided surgical resection is improved using Cerenkov luminescence imaging (CLI) of [18F]-fluoroethyltyrosine (FET) when compared to fluorescence imaging with 5-aminolevulinic acid. Excised U87 tumor-bearing brains were imaged before and after each round of tumor resection. Serial FET CL images (A) and 5-ALA-induced fluorescence images (B) overlaid on the white light images of a brain, where these images were acquired before and after two limited iterative surgical resections of the tumor. The resected specimens (i), (ii) and the remaining brain (ii) were imaged separately. (C) Ki-67 staining of the resected tumor specimens (i) and (ii), showing positive staining for tumor cells. No Ki-67 positive nuclei were found in the brain following the last resection (iii). This figure is representative of three experiments.
Discussion
We have shown that CLI of FET aids glioma resection by accurately identifying glioblastoma cells and distinguishing tumor from surrounding normal tissue (Figures 4-5 and Figures S6, 9). FET-induced Cerenkov luminescence performed significantly better than the current approach for visualizing gliomas in situ, which involves detection of protoporphyrin IX (PPIX) fluorescence following administration of 5-ALA. The high sensitivity (>92%) of FET CLI helped ensure maximal resection while the high specificity (>91 %) allowed preservation of normal brain tissue, which are key to improving survival without increasing neurosurgical morbidity following surgery [3, 30].
5-ALA detected more than 90% of the glioblastomas used here (Figure 4F and Figure S6F) but also accumulated in peritumoral regions and the corpus callosum (Figures 3-5 and Figures S6-7). The exact mechanism of 5-ALA-induced PPIX accumulation in malignant gliomas is not fully understood [31]. The PPIX accumulation in peritumoral regions and the corpus callosum we observed may reflect propagation by cerebral edema and non-specific uptake by white matter [8, 9, 32, 33]. 5-ALA-guided surgery can lead to increased neurological deficits and it is possible that 5‑ALA accumulation in non-tumor tissue and consequent excision may account for this [34].
There are few effective intraoperative navigational tools aiding glioma detection. Intraoperative contrast-enhanced MRI, fluorescent dyes such as fluorescein, and nanoparticles rely on combinations of non-specific blood brain barrier (BBB) disruption and enhanced permeability and retention mechanisms; features that are not present in all gliomas [35-37]. Intraoperative agents can be targeted to specific receptors but these tend to be overexpressed only in a subset of gliomas [38, 39]. 5-ALA induces visible fluorescence in 57-80% of high grade but in only 6-16% of low-grade gliomas, probably reflecting the hydrophilicity of 5‑ALA, which reduces blood brain barrier permeability [8, 12, 40]. The advantage of FET CLI for guiding surgical resection is that, due to high expression of the LAT1 amino acid transporters in both low and high-grade glioma (Figure S3B), FET accumulates in the majority of patient gliomas [13, 14, 41]. FET uptake is associated with the metabolic reprogramming and high rates of biosynthesis that occur during tumorigenesis [42, 43]. Uptake is specific and independent of BBB disruption as LAT1 is expressed on both luminal and abluminal sides of the cerebral endothelium [44]. The broad detectability of FET in glioma means that FET CLI luminescence-guided resection may be effective in 7 times more low grade and 1.5 times more high grade glioma patients than 5‑ALA-guided resection [12].
We have shown, to our knowledge for the first time, the feasibility of prospectively defining an objective CLI threshold, CLIOptROC, for distinguishing glioma and normal tissue. Cerenkov luminescence imaging has fewer issues with quantification compared to fluorescence detection (e.g., reflection of incident light, photobleaching or autofluorescence [45]). An excellent correlation between CLI and PET signal has been demonstrated here and by others [20]. An objective CL threshold would aid surgical decision-making, something that is challenging with current intraoperative fluorescence imaging, which relies on subjective discrimination [46, 47]. The CLI tumor threshold CLIOptROC was dependent on tumor type (Figure 2E); however, due to the high level of congruity between PET and CLI, it is likely that a clinical intraoperative CLI threshold could be determined on the basis of a preoperative PET image. Preoperative PET could also be used to select patients for intraoperative CLI, an improvement over the current situation where no single factor, or combination of factors, precisely predicts 5-ALA accumulation [40].
Future studies should investigate whether FET CLI-guided resection improves outcome as no survival studies were performed here and all of the tumor models we used had minimally invasive tumor margins. Detecting and resecting disseminated disease will be more challenging. CLI also has lower photon yield and longer imaging times (300 s here compared to 1 s for 5-ALA) compared to fluorescence. The variable distance of the imaging device to the patient, tumor positioning, extraneous light and optically heterogeneous tissue are all challenges that need to be addressed for the clinical implementation of quantitative CLI. In determining CLIOptROC, we gave equal weighting to the risks of over and under-resection, whereas in practice, neurosurgeons make decisions subjectively based upon experience, the location of eloquent brain regions and the clinical status of the patient. Therefore absolute CLI quantification may not be essential for the clinical implementation intraoperative CLI.
The extensive clinical experience with FET should enable the rapid clinical translation of this technique with less regulatory issues compared with clinically untested compounds. For example, regulatory approval has hindered translation of fluorescent agents and nanoparticles [37, 48, 49]. In contrast, clinical translation of CLI has been rapid, with less than 4 years between the first preclinical description and initial clinical studies, exploiting imaging probes validated previously in nuclear medicine applications [20, 25, 50]. There have also been rapid hardware developments, which have supported the initial clinical studies [20, 25]. One of the main challenges with clinical CLI is interference from ambient light and the relatively low photon yield. These problems can be addressed for glioma resection through several strategies including the use of neuroendoscopy and probes for detecting β particles, which would allow real-time “lights on” surgical imaging, and by the use of higher energy positron-emitting radionuclides such as 11C-methionine. This shows similar glioma targeting via LAT1 as FET, but produces over a five times greater photon yield than 18F for CLI [21, 51-54]. FET-induced CLI would also complement emerging interventional PET imaging, allowing intraoperative CLI of residual tumor in the surgical field and tomographic imaging of residual tumor in the whole brain, respectively [55].
In summary, we have shown that FET-induced Cerenkov luminescence can be used to delineate tumor extent in three animal models of glioblastoma and have demonstrated improved detection and quantification of glioblastoma when compared with 5-ALA-derived fluorescence. We have shown that FET-induced Cerenkov luminescence may be useful to accurately guide tumor resection and identify tumor remnants not visible with white light or 5-ALA fluorescence whilst sparing normal brain tissue.
Methods
Cell culture
Established GB cell lines (F98 (rat; ATCC-CRL-2397), U87 (human; ATCC-HTB-14) (American Tissue Culture Collection, Manassas, US) and C6 (rat; ECACC 92090409) (Public Health England, Salisbury, UK) were cultured at 37 °C in 5% CO2 in Dulbecco's modified Eagle's medium (DMEM) supplemented with 2 mM L-glutamine (Gibco, UK) and 10% fetal bovine serum (Gibco, UK). Cells were passaged twice weekly at confluence and assessed for both viability and number using a Trypan blue dye exclusion method (Vi-CELL XR, Beckman Coulter, Brea, US). Cells passed regular mycoplasma contamination testing.
Orthotopic glioblastoma cell implantation
Glioblastoma cells were implanted orthotopically in 6-week-old (150-190 g) female Fisher 344 rats (F98, C6) or (200-250 g) rnu/rnu athymic nude rats (U87) (Charles River, Germany; Harlan, UK). Cells were dissociated from monolayer culture on the morning of implantation, counted and assessed for viability (Vi-CELL XR, Beckman Coulter, Brea, US) before re-suspending in media (2×10⁴ cells μL-1 (F98) and 2×10⁵ cells μL-1 (U87)). Animals were anaesthetized by inhalation of 1‑2% isoflurane (Isoflo, Abbotts Laboratories Ltd., UK) in 100% oxygen and then transferred to a stereotactic surgical frame (Kopf, Tujunga, US) and a 1 mm burr hole was drilled 2 mm anterior and 3 mm lateral to the bregma (right-side). A 23-gauge full displacement syringe (SGE Analytical Science, Melbourne, Australia) was then filled with 5 μL of cell suspension before being maneuvered through the hole and 6 mm intracranially. All procedures were performed in compliance with project and personal licenses issued under the United Kingdom Animals (Scientific Procedures) Act, 1986 and were designed according to the UK Coordinating Committee on Cancer Research guidelines for the welfare of animals in experimental neoplasia. The Cancer Research UK Cambridge Institute Animal Welfare and Ethical Review Body approved the work.
Radiosynthesis of O-(2-[18F]fluoroethyl)-L-tyrosine (FET)
[18F]FET production was based on a published method [56]. Briefly, [18F]FET was synthesized by one-step nucleophilic substitution of the tolysate-leaving group by [18F]fluoride on O-(2-tosyloxyethyl)-N-trityl-L-tyrosine tert-butyl ester precursor followed by hydrolysis of the protecting groups using the automated GE TracerLab FX-FN synthesis module. [18F]Fluoride was generated in a GE PETTrace (16.5 MeV) cyclotron. Typical radiochemical yield was 35% (non-decay corrected), radiochemical purity was greater than 99.5%, typical specific activity was 90 GBq/µmol and enantiomeric purity of [18F]L-FET was 100%.
PET/CT/MR imaging
Animals were enrolled for imaging when the tumors reached a volume of 0.1 cm3. Rats were anaesthetized with 1-2% isoflurane in 100% oxygen for the duration of the imaging exam and were monitored for respiration and rectal temperature. Body temperature was maintained at 37 °C using external heating. All MR images were acquired at 7 T (Agilent, Palo Alto, US) with a 72 mm volume coil (RAPID Biomedical, Rimpar, Germany). T2-weighted images were acquired with a multi-slice fast spin echo sequence (TR 1.8 s, effective echo time 36 ms, 40 mm × 40 mm × 2 mm slices 256 × 256 points). T1-weighted images were acquired for contrast-enhanced MRI with a 2D spoiled gradient echo sequence (TR 43 ms, TE 4.6 ms, flip angle 27°, 40 mm × 40 mm × 1.5 mm slices, 256 × 256 points). A T1-weighted image was acquired prior to and 60 s after administration of 200 μmol/kg DOTAREM [Gd3+2-(4, 7, 10-tris(carboxymethyl)-1,4,7,10-tetrazacyclododec-1-yl)acetate] (Guerbet, Paris, France) administered by intravenous tail vein injection. Animals were transferred in a rigid holder to a NanoScan PET/CT (Mediso, Hungary, UK) for 18F-fluoro-ethyl-tyrosine (FET) PET/CT imaging. FET was administered by intravenous tail vein injection. The mean decay corrected radioactivity at injection was 68.06 ± 18.13 MBq (mean ± s.d.). Following FET administration, rats were imaged dynamically for 1 h. Images were reconstructed into 19 time frames using a 3D Tera-Tomo iterative reconstruction with attenuation and scatter correction using manufacturer recommended parameters of 4 iterations and 6 subsets producing a 0.4 mm3 isotropic voxel dataset (matrix size 105 × 105 × 236). CT scanning was performed on the same inline stage as PET imaging with 360 projections, tube voltage of 65 kVp, 1100 ms exposure time, into 213 µm3 isotropic voxels. PET/CT/MRI datasets were fused rigidly and analyzed using landmarks from the CT/MRI datasets in Vivoquant v2.5 (InviCRO, Boston, MA).
Cerenkov luminescence and 5-ALA fluorescence imaging
Rats were injected with 100 mg/kg of 5-ALA i.p. at 20 mg/mL, which had been adjusted to pH 6.5 with NaOH. Five hours after 5-ALA administration, animals were anaesthetized and injected with FET as described above. Six hours after 5-ALA and 1 h after FET administration, rats were decapitated, brains removed and a brain matrix (Kopf, US) was used to cut sequential 2 mm slices through the region containing the tumor. Slices were imaged using a Xenogen IVIS 200 camera (Perkin Elmer, MA, US). A white light image was acquired alongside the luminescence images (open emission filter; bin 16, f stop 1, 300 s) and fluorescence images were collected with a GFP background excitation filter; Cy5.5 emission filter; bin 4; f stop 4, 1 s. FET CL images were decay corrected to the start of the CLI scan and normalized to the FET injected dose. Upon completion of this imaging protocol the brain slices were snap frozen at approximately -70 °C using isopentane and dry ice before sectioning into 10 μm slices in a cryostat. Sections were allowed to air dry for up to 1 h before being apposed to a storage phosphor screen overnight for autoradiography (AR). Sections were then imaged using a confocal microscope (SP5, Leica) using a 405 nm excitation laser and a 600-785 nm emission filter. Finally, sections were stained using hematoxylin and eosin (H&E) and the tumor was annotated by a neuropathologist (K.A.).
Resection study
A further group of 6 rats was administered 5-ALA i.p. and FET i.v. 6 and 1 h respectively prior to decapitation and brain removal. Images were acquired from the excised brains in the sagittal plane, using the same settings as described previously. The mean Cerenkov luminescence and 5-ALA fluorescence threshold values determined in the previous experiment were used to differentiate tumor and normal tissue. FET CL images were decay corrected to the start of the CLI scan and normalized to the FET injected dose. Ex vivo image-guided resection of the U87 tumor was conducted by a neurosurgeon (R.M.). Once complete, the resected specimens and cavity underwent further Cerenkov luminescence and 5-ALA fluorescence imaging to check for residual disease. Subsequently, further debulking surgery was performed with a final scan confirming removal of all Cerenkov luminescence positive tissue. The resected specimens were then formalin fixed and paraffin embedded before serial sectioning and staining with H&E and Ki-67.
Western blot
Cell samples were processed using a standard protocol and imaged using the Odyssey Licor system (Licor biotechnology, Lincoln, NE, US). Anti-SLC7A5 antibody was used at a concentration of 1:500 (Abcam; ab111106, Cambridge, UK; http://www.abcam.com/ab111106.pdf) as per the manufacturer's instructions. Blot was produced as 2 technical replicates (from which a mean was taken) and two biological replicates (n=2). See Figure S4 for uncropped blot.
In situ hybridisation of Lat1
Simultaneous detection of human Lat1 and rat Lat1 was performed on FFPE sections using Advanced Cell Diagnostics (ACD) RNAscope® 2.5 LS Duplex Reagent Kit (Cat No. 322440), RNAscope® 2.5 LS Probe- Hs-SLC7A5 (Cat No. 472778) and RNAscope® 2.5 LS Probe- Rn-Slc7a5-C2 (Cat No. 487828-C2) (ACD, Hayward, CA, USA). Briefly, 5 μm sections were cut, baked for 1 h at 60 °C before loading onto a Bond RX instrument (Leica Biosystems). Slides were deparaffinized and rehydrated on board before pre-treatments using Epitope Retrieval Solution 2 (Cat No. AR9640, Leica Biosystems) at 95 °C for 10 min, and ACD Enzyme from the Duplex Reagent kit at 40 °C for 15 min. Probe hybridization and signal amplification were performed according to the manufacturer's instructions. Fast red detection of human Lat1 was performed on the Bond Rx using the Bond Polymer Refine Red Detection Kit (Leica Biosystems, Cat No. DS9390) according to the ACD protocol. Slides were then removed from the Bond Rx and detection of the rat Lat1 signal was performed using the RNAscope® 2.5 LS Green Accessory Pack (ACD, Cat No. 322550) according to the kit instructions. Slides were heated at 60 °C for 1 h, dipped in Xylene and mounted using VectaMount Permanent Mounting Medium (Vector Laboratories Burlingame, CA. Cat No. H-5000). The slides were imaged on an Aperio AT2 (Leica Biosystems) to create whole slide images. Images were captured at 40x magnification, with a resolution of 0.25 μm per pixel.
Image analysis
Regions of interest were drawn around the tumor and contralateral normal hemisphere in the PET, CL and autoradiograpic images. Target-to-brain ratios were corrected by subtracting the background activity and modalities were compared using linear regression. The tumor on each H&E stained section was demarcated by an experienced neuropathologist (K.A.). The annotated H&E stained section was then coregistered with FET autoradiography, 5-ALA fluorescence (IVIS and confocal microscopy) and Cerenkov luminescence images. The H&E annotation was used to segment the other images into tumor and brain regions (Figure 2A). The non-background corrected pixel quantifications were plotted as a histogram and used to construct receiver operating characteristic (ROC) curves using Matlab (Figure 2B-C; Supplementary Methods). The optimal threshold was determined geometrically as the point closest to the top left corner (0, 1) (Figure 2D) [29].
Statistical analysis
Data are expressed as mean ± s.e.m. unless otherwise indicated. Box-plots are the median and interquartile range, with whiskers representing the full range and, where indicated, a cross represents the mean. Graphical representation and statistical comparisons were made using Prism (v6, GraphPad Software, USA). Normality was tested using the Kolmogorov-Smirnov test with Dallal-Wilkinson-Lillie for P value where n≥5. Non-normally distributed data and data of n<5 were then compared using non-parametric Mann-Whitney tests. Normality distributed data were compared using an unpaired t test with or without Welch's correction for unequal variance as appropriate determined by an F test. All statistical tests were 2-tailed. Power analysis for samples size determination was not used; however, sample sizes were consistent with our previous publications in this field [57-60]. Randomization was not performed. No signal could be detected from one 5-ALA animal so this dataset was excluded. For tumor segmentation, the neuropathologist was blinded to the CLI and 5-ALA distributions. Animals experiments were not otherwise blinded as both FET and 5-ALA were administered to all animals.
Data availability
The data supporting the findings of this study are available within the article and its Supplementary Material, or are available from the corresponding author upon reasonable request.
Code availability
The Matlab code used for ROC analysis is available in Supplementary Material.
Abbreviations
5-ALA: 5-aminolevulinic acid (5-ALA); 5-ALAOptROC: optimal threshold for 5-aminolevulinic acid; BBB: blood brain barrier; CLI: Cerenkov luminescence imaging; CLIOptROC: optimal threshold for Cerenkov luminescence imaging; FET: O-(2-[18F] fluoroethyl)-L-tyrosine; LAT1: L-type amino acid transporter 1; MRI: magnetic resonance imaging; PET: positron emission tomography; PPIX: protoporphyrin IX; ROC: Receiver operating characteristic.
Supplementary Material
Supplementary Matlab code and figures.
Acknowledgements
Financial support: The work was supported by a Cancer Research UK Programme grant (17242) to KMB and by the CRUK-EPSRC Imaging Centre in Cambridge and Manchester (16465). RM was supported by Addenbrooke's Charitable Trust and a CRUK Cambridge Centre Fellowship.
Author contributions
D.Y.L., R.M., T.B. and K.M.B conceived the study. D.Y.L. and R.M. designed the experiments. D.Y.L., R.M., A.W., K.A., S.K.L, J.J., R.B and D.S acquired the data. D.Y.L., R.M. and A.W. analyzed and interpreted the data. D.Y.L., R.M. and K.M.B drafted the manuscript.
Competing Interests
The authors have declared that no competing interest exists.
References
1. Siegel RL, Miller KD, Jemal A. Cancer statistics, 2016. CA Cancer J Clin. 2016;66:7-30
2. McNeill KA. Epidemiology of brain tumors. Neurol Clin. 2016;34:981-98
3. Hervey-Jumper SL, Berger MS. Maximizing safe resection of low- and high-grade glioma. J Neurooncol. 2016;130:269-82
4. Barone DG, Lawrie TA, Hart MG. Image guided surgery for the resection of brain tumours. Cochrane Database Syst Rev. 2014 CD009685
5. Gerard IJ, Kersten-Oertel M, Petrecca K. et al. Brain shift in neuronavigation of brain tumors: A review. Med Image Anal. 2017;35:403-20
6. Ginat DT, Swearingen B, Curry W. et al. 3 Tesla intraoperative MRI for brain tumor surgery. J Magn Reson Imaging. 2014;39:1357-65
7. Knauth M, Aras N, Wirtz CR. et al. Surgically induced intracranial contrast enhancement: potential source of diagnostic error in intraoperative MR imaging. AJNR Am J Neuroradiol. 1999;20:1547-53
8. Lau D, Hervey-Jumper SL, Chang S. et al. A prospective Phase II clinical trial of 5-aminolevulinic acid to assess the correlation of intraoperative fluorescence intensity and degree of histologic cellularity during resection of high-grade gliomas. J Neurosurg. 2016;124:1300-9
9. Stummer W, Stocker S, Novotny A. et al. In vitro and in vivo porphyrin accumulation by C6 glioma cells after exposure to 5-aminolevulinic acid. J Photochem Photobiol B. 1998;45:160-9
10. Stummer W, Tonn JC, Goetz C. et al. 5-Aminolevulinic acid-derived tumor fluorescence: the diagnostic accuracy of visible fluorescence qualities as corroborated by spectrometry and histology and postoperative imaging. Neurosurgery. 2014;74:310-9 discussion 9-20
11. Li Y, Rey-Dios R, Roberts DW. et al. Intraoperative fluorescence-guided resection of high-grade gliomas: a comparison of the present techniques and evolution of future strategies. World Neurosurg. 2014;82:175-85
12. Floeth FW, Sabel M, Ewelt C. et al. Comparison of 18F-FET PET and 5-ALA fluorescence in cerebral gliomas. Eur J Nucl Med Mol Imaging. 2011;38:731-41
13. Hutterer M, Nowosielski M, Putzer D. et al. [18F]-fluoro-ethyl-l-tyrosine PET: a valuable diagnostic tool in neuro-oncology, but not all that glitters is glioma. Neuro Oncol. 2013;15:341-51
14. Habermeier A, Graf J, Sandhofer BF. et al. System L amino acid transporter LAT1 accumulates O-(2-fluoroethyl)-L-tyrosine (FET). Amino Acids. 2015;47:335-44
15. Albert NL, Weller M, Suchorska B. et al. Response Assessment in Neuro-Oncology working group and European Association for Neuro-Oncology recommendations for the clinical use of PET imaging in gliomas. Neuro Oncol. 2016;18:1199-208
16. Filss CP, Galldiks N, Stoffels G. et al. Comparison of 18F-FET PET and perfusion-weighted MR imaging: a PET/MR imaging hybrid study in patients with brain tumors. J Nucl Med. 2014;55:540-5
17. Suchorska B, Jansen NL, Linn J. et al. Biological tumor volume in 18FET-PET before radiochemotherapy correlates with survival in GBM. Neurology. 2015;84:710-9
18. Beattie BJ, Thorek DL, Schmidtlein CR. et al. Quantitative modeling of Cerenkov light production efficiency from medical radionuclides. PLoS One. 2012;7:e31402
19. Ruggiero A, Holland JP, Lewis JS. et al. Cerenkov luminescence imaging of medical isotopes. J Nucl Med. 2010;51:1123-30
20. Grootendorst MR, Cariati M, Kothari A. et al. Cerenkov luminescence imaging (CLI) for image-guided cancer surgery. Clin Transl Imaging. 2016;4:353-66
21. Hu H, Cao X, Kang F. et al. Feasibility study of novel endoscopic Cerenkov luminescence imaging system in detecting and quantifying gastrointestinal disease: first human results. Eur Radiol. 2015;25:1814-22
22. Spinelli AE, Ferdeghini M, Cavedon C. et al. First human Cerenkography. J Biomed Opt. 2013;18:20502
23. Spinelli AE, Schiariti MP, Grana CM. et al. Cerenkov and radioluminescence imaging of brain tumor specimens during neurosurgery. J Biomed Opt. 2016;21:50502
24. Thorek DL, Riedl CC, Grimm J. Clinical Cerenkov luminescence imaging of 18F-FDG. J Nucl Med. 2014;55:95-8
25. Grootendorst MR, Cariati M, Pinder SE. et al. Intraoperative assessment of tumor resection margins in breast-conserving surgery using 18F-FDG Cerenkov luminescence imaging: a first-in-human feasibility study. J Nucl Med. 2017;58:891-8
26. Zhang R, Andreozzi JM, Gladstone DJ. et al. Cherenkoscopy based patient positioning validation and movement tracking during post-lumpectomy whole breast radiation therapy. Phys Med Biol. 2015;60:L1-14
27. Andreozzi JM, Zhang R, Gladstone DJ. et al. Cherenkov imaging method for rapid optimization of clinical treatment geometry in total skin electron beam therapy. Med Phys. 2016;43:993-1002
28. Stummer W, Pichlmeier U, Meinel T. et al. Fluorescence-guided surgery with 5-aminolevulinic acid for resection of malignant glioma: a randomised controlled multicentre phase III trial. Lancet Oncol. 2006;7:392-401
29. Rota M, Antolini L, Valsecchi MG. Optimal cut-point definition in biomarkers: the case of censored failure time outcome. BMC Med Res Methodol. 2015;15:24
30. Stummer W, Tonn JC, Mehdorn HM. et al. Counterbalancing risks and gains from extended resections in malignant glioma surgery: a supplemental analysis from the randomized 5-aminolevulinic acid glioma resection study. Clinical article. J Neurosurg. 2011;114:613-23
31. Yang X, Palasuberniam P, Kraus D. et al. Aminolevulinic acid-based tumor detection and therapy: molecular mechanisms and strategies for enhancement. Int J Mol Sci. 2015;16:25865-80
32. Tetard MC, Vermandel M, Mordon S. et al. Experimental use of photodynamic therapy in high grade gliomas: a review focused on 5-aminolevulinic acid. Photodiagnosis Photodyn Ther. 2014;11:319-30
33. Utsuki S, Oka H, Sato S. et al. Histological examination of false positive tissue resection using 5-aminolevulinic acid-induced fluorescence guidance. Neurol Med Chir (Tokyo). 2007;47:210-3 discussion 3-4
34. Zhao S, Wu J, Wang C. et al. Intraoperative fluorescence-guided resection of high-grade malignant gliomas using 5-aminolevulinic acid-induced porphyrins: a systematic review and meta-analysis of prospective studies. PLoS One. 2013;8:e63682
35. Rutka JT, Kim B, Etame A. et al. Nanosurgical resection of malignant brain tumors: beyond the cutting edge. ACS Nano. 2014;8:9716-22
36. Parrish-Novak J, Holland EC, Olson JM. Image-guided tumor resection. Cancer J. 2015;21:206-12
37. Kiessling F, Mertens ME, Grimm J. et al. Nanoparticles for imaging: top or flop? Radiology. 2014;273:10-28
38. Taylor TE, Furnari FB, Cavenee WK. Targeting EGFR for treatment of glioblastoma: molecular basis to overcome resistance. Curr Cancer Drug Targets. 2012;12:197-209
39. Diaz RJ, McVeigh PZ, O'Reilly MA. et al. Focused ultrasound delivery of Raman nanoparticles across the blood-brain barrier: potential for targeting experimental brain tumors. Nanomedicine. 2014;10:1075-87
40. Jaber M, Wolfer J, Ewelt C. et al. The value of 5-aminolevulinic acid in low-grade gliomas and high-grade gliomas lacking glioblastoma imaging features: an analysis based on fluorescence, magnetic resonance imaging, 18F-fluoroethyl tyrosine positron emission tomography, and tumor molecular factors. Neurosurgery. 2016;78:401-11
41. Haining Z, Kawai N, Miyake K. et al. Relation of LAT1/4F2hc expression with pathological grade, proliferation and angiogenesis in human gliomas. BMC Clin Pathol. 2012;12:4
42. Bhutia YD, Babu E, Ramachandran S. et al. Amino Acid transporters in cancer and their relevance to "glutamine addiction": novel targets for the design of a new class of anticancer drugs. Cancer Res. 2015;75:1782-8
43. Pavlova NN, Thompson CB. The emerging hallmarks of cancer metabolism. Cell Metab. 2016;23:27-47
44. Hawkins RA, Viña JR, Peterson DR. et al. Amino acid transport across each side of the blood-brain barrier. In: (ed.) D'Mello JPF. Amino acids in human nutrition and health. Oxfordshire, UK: CABI Publishing. 2012 191-214
45. Thorek DL, Ogirala A, Beattie BJ. et al. Quantitative imaging of disease signatures through radioactive decay signal conversion. Nat Med. 2013;19:1345-50
46. Weissleder R, Pittet MJ. Imaging in the era of molecular oncology. Nature. 2008;452:580-9
47. Liu JT, Meza D, Sanai N. Trends in fluorescence image-guided surgery for gliomas. Neurosurgery. 2014;75:61-71
48. Baetke SC, Lammers T, Kiessling F. Applications of nanoparticles for diagnosis and therapy of cancer. Br J Radiol. 2015;88:20150207
49. Keereweer S, Van Driel PB, Snoeks TJ. et al. Optical image-guided cancer surgery: challenges and limitations. Clin Cancer Res. 2013;19:3745-54
50. Das S, Thorek DL, Grimm J. Cerenkov imaging. Adv Cancer Res. 2014;124:213-34
51. Gill RK, Mitchell GS, Cherry SR. Computed Cerenkov luminescence yields for radionuclides used in biology and medicine. Phys Med Biol. 2015;60:4263-80
52. King MT, Carpenter CM, Sun C. et al. b-Radioluminescence imaging: a comparative evaluation with Cerenkov luminescence imaging. J Nucl Med. 2015;56:1458-64
53. Song T, Liu X, Qu Y. et al. A novel endoscopic Cerenkov luminescence imaging system for intraoperative surgical navigation. Mol Imaging. 2015;14:443-9
54. Turkcan S, Naczynski DJ, Nolley R. et al. Endoscopic detection of cancer with lensless radioluminescence imaging and machine vision. Sci Rep. 2016;6:30737
55. Solomon SB, Cornelis F. Interventional molecular imaging. J Nucl Med. 2016;57:493-6
56. Bourdier T, Greguric I, Roselt P. et al. Fully automated one-pot radiosynthesis of O-(2-[18F]fluoroethyl)-L-tyrosine on the TracerLab FX(FN) module. Nucl Med Biol. 2011;38:645-51
57. Heinzmann K, Honess DJ, Lewis DY. et al. The relationship between endogenous thymidine concentrations and [18F]FLT uptake in a range of preclinical tumour models. EJNMMI Res. 2016;6:63
58. Lewis DY, Boren J, Shaw GL. et al. Late imaging with [1-11C]acetate improves detection of tumor fatty acid synthesis with PET. J Nucl Med. 2014;55:1144-9
59. Lewis DY, Champion S, Wyper D. et al. Assessment of [125I]WYE-230949 as a novel histamine H3 receptor radiopharmaceutical. PLoS One. 2014;9:e115876
60. Neves AA, Xie B, Fawcett S. et al. Rapid imaging of tumor cell death in vivo using the C2A domain of synaptotagmin-I. J Nucl Med. 2017;58:881-7
Author contact
![]() Corresponding author: David Lewis (Tel: +441413308161; Email: d.lewisgla.ac.uk)
Corresponding author: David Lewis (Tel: +441413308161; Email: d.lewisgla.ac.uk)