Impact Factor
- Issue 14; 2026
- Issue 13; 2026
- Issue 12; 2026
- Issue 11; 2026
- Issue 10; 2026
- Volume 16; 2026
- Advance Articles
- Past Issues
- Cover Images
- Cover Suggestion
- Index & Coverage
- Special Issues
Introduction
Results
Discussion
Methods
Abbreviations
Supplementary Material
Acknowledgements
References
International Journal of Biological Sciences
International Journal of Medical Sciences
 Global reach, higher impact

Theranostics 2018; 8(16):4520-4534. doi:10.7150/thno.25130 This issue Cite
Research Paper
Rewiring of cisplatin-resistant bladder cancer cells through epigenetic regulation of genes involved in amino acid metabolism
Austin Yeon1, Sungyong You1,6, Minhyung Kim1, Amit Gupta1, Myung Hee Park2, Daniel J. Weisenberger3, Gangning Liang4, Jayoung Kim1,5,6,7,8 ![]()
1. Departments of Surgery, Cedars-Sinai Medical Center, Los Angeles, CA, USA
2. National Institute of Dental and Craniofacial Research, National Institutes of Health Bethesda, MD, USA
3. Department of Biochemistry and Molecular Medicine, USC Norris Comprehensive Cancer Center, University of Southern California
4. Department of Urology, Keck School of Medicine, University of Southern California, Los Angeles, CA, USA
5. Departments of Biomedical Sciences, Cedars-Sinai Medical Center, Los Angeles, CA, USA
6. Samuel Oschin Comprehensive Cancer Institute, Cedars-Sinai Medical Center, Los Angeles, CA, USA
7. Department of Medicine, University of California Los Angeles, CA, USA
8. Department of Urology, Ga Cheon University College of Medicine, Incheon, Republic of Korea
Received 2018-1-24; Accepted 2018-7-23; Published 2018-8-10
Abstract

Alterations in DNA methylation are important epigenetic markers in bladder cancer (BC). These epigenome modifications may drive the mechanisms of aggressive chemo-resistant BC. Clinicopathological biomarkers that indicate chemotherapeutic resistance are critical for better assessing treatment strategies for individual patients. Thus, in this study, we aimed to determine whether DNA methylation of certain metabolic enzymes is significantly altered in cisplatin-resistant BC cells.
Methods: To characterize CpG methylation and nucleosome accessibility in cisplatin-resistant BC cells, the Illumina Infinium HM450 DNA methylation assay was performed. Perturbed gene expression was found to be associated with cisplatin resistance, and the biological roles of spermidine/spermine N1-acetyltransferase (SAT1) and argininosuccinate synthase 1 (ASS1) were further studied using qRT-PCR analysis and various cell biology assays, including western blot.
Results: ASS1 and SAT1, genes for amino acid and polyamine metabolism catalysts, respectively, were found to be vastly hypermethylated, resulting in greatly downregulated expression. ASS1 expression is of particular interest because prior studies have demonstrated its potential association with BC stage and recurrence. In regard to chemoresistance, we found that aberrant expression or induced stimulation of SAT1 restored cisplatin sensitivity in the cell culture system. We also found that the addition of exogenous arginine deiminase through administration of ADI-PEG 20 (pegylated arginine deiminase) increased ASS1 expression and enhanced cisplatin's apoptotic effects.
Conclusions: Our study demonstrates a novel mechanistic link between the epigenetic perturbation of SAT1 and ASS1 and cancer metabolism in cisplatin-resistant bladder cancer cells. These findings suggest potential utility of SAT1 and ASS1 as predictive biomarkers in re-sensitizing bladder cancer to chemotherapy and personalizing therapy.
Keywords: SAT1, ASS1, cancer metabolism, metabolomics, DNA methylation, chromatin accessibility, cisplatin resistance
Introduction
Bladder cancer (BC) is the second most common genitourinary malignancy worldwide and the fourth most common cancer in the U.S. [1-3]. Most patients are diagnosed with treatable cell carcinoma or non-muscle invasive bladder cancer (NMIBC) [4, 5]. However, approximately 20-30% of all NMIBC cases eventually progress to become muscle-invasive bladder cancer (MIBC). From there, about 50% of these patients develop metastases within two years, even after radical cystectomy [6, 7]. In addition, MIBC patients who do not respond to adjuvant chemotherapy have a worse prognosis [8]. Unfortunately, there are currently no well-defined and available prognostic marker(s) that can identify these higher-risk patients [9-11]. Therefore, in order to develop new diagnostic technologies, a comprehensive molecular understanding of the patient subsets who will acquire chemoresistance is required. The identification of markers capable of predicting the response in patients treated with platinum-based drugs is urgently needed in order to improve the outcomes for those BC patients who are at higher risk of developing resistance.
Epigenetic regulation has been demonstrated to play an important role in bladder tumorigenesis [12-14]. Recently, three separate subtypes of BC patients have been identified through analysis of DNA methylation profiles [14]. Epigenetic dysregulation occurs via cytosine methylation-dependent gene silencing, which is also considered a characteristic of therapeutic-resistance [15]. Cancer-specific DNA methylation mostly occurs on the CpG islands located in the promoter regions of genes and causes silencing of downstream genes [16, 17]. Currently, two DNA methyltransferase (DNMT) inhibitors (5-azacytidine and its variant, 5-aza-CdR) have been approved by the FDA for the treatment of high-risk myelodysplastic syndrome [18] and are also in clinical trials for solid forms of human cancers [19]. In addition to DNA methylation, there are other relevant epigenetic mechanisms that affect gene expression levels, including histone modification and nucleosome positioning. These processes work together to create the epigenetic landscape that directs the process of gene expression. Chromatin structure, which is based on DNA methylation and nucleosome accessibility (occupancy), plays a critical role in the regulation of gene expression at the transcriptional start sites of genes. Recent computational modeling using molecular dynamics simulations revealed the potential effects of epigenetic DNA methylation on nucleosome stability [20] and demonstrated that CpG methylation that contributes to nucleosome positioning can also be DNMT1 independent [21]. These findings suggest that monitoring chromatin accessibility, DNA methylation, and histone modification is crucial for better understanding therapeutic responses in BC [22-24].
Since first observed 90 years ago by Dr. Otto Warburg, metabolic reprogramming has been accepted as a hallmark of cancer [25-28]. Considering this, targeting cancer-associated amino acid metabolism has been tested as a potential treatment option [29, 30]. Amino acids, such as arginine, proline, and glutamine, play a variety of functional roles in the cell. However, most importantly, they act as essential precursors for the biosynthesis of proteins. Therefore, depletion therapies, such as arginine deiminase (ADI) treatment, are being extensively tested against several cancer types, including ovarian cancer, mesothelioma, and hepatocellular carcinoma [31-35].
In this study, we sought to understand the epigenetic alterations underlying the metabolic reprogramming in cisplatin-resistant BC cells. Our experimental results suggest that cancer-specific epigenetic silencing of two genes encoding for metabolic enzymes, spermidine/spermine N1-acetyltransferase (SAT1) and argininosuccinate synthase 1 (ASS1), is closely associated with cisplatin resistance and is epigenetically regulated in T24 BC cells. Both enzymes are related to arginine metabolism: ASS1 catalyzes the final step in arginine biosynthesis. SAT1, on the other hand, catabolizes spermidine and spermine that are derived from arginine in sequential enzymatic steps that involve the conversion of arginine to ornithine, ornithine to putrescine, putrescine to spermidine, and spermidine to spermine [36, 37].
Results
Characterization of CpG methylation and nucleosome accessibility in cisplatin-resistant BC cells
In order to investigate the epigenetic modulation linked to cisplatin resistance in BC, we used two isogenic T24 BC cell lines—one that is cisplatin sensitive (T24S) and one cisplatin resistant (T24R). T24 cells were utilized because the characteristics of these cells have been previously reported by our group [38]. The T24R cell line exhibited much less responsiveness to cisplatin-induced apoptosis compared to T24S cells (Figure 1A). In order to understand the epigenetic reprogramming associated with cisplatin resistance, three independent sets of data profiles, namely (1) DNA methylation, (2) nucleosome accessibility, and (3) gene expression, were generated in T24R and T24S cells (Figure 1B).
Determination of the epigenetic rewiring in cisplatin-resistant bladder cancer. (A) Cell viability was measured at the indicated times after 10 μM cisplatin treatment. (B) Overall experimental workflow of the investigation of epigenetic regulation associated with cisplatin resistance in this study. (C) Bar graph showing increased and decreased chromatin accessibility in T24R and T24S cells. Selection of the accessible CpG sites was based on delta beta at a threshold value 0.2. The percentage indicates the changes in accessible chromatin upon cisplatin resistance for individual genome features. (D) Chromatin accessibility visualized by Kernel density scatter plot of delta-methylation versus delta-accessibility. Circle depicts the region showing a loss of chromatin accessibility accompanied by DNA hyper-methylation. (E) Venn diagram depicting 14,801 genes with DNA hypermethylation and 1,449 genes with decreased accessibility. (F) Venn diagram showing 2,378 genes with DNA hypomethylation and 1,123 genes with increased accessibility. (G) Bar graph depicting enriched KEGG pathways of 1,328 hypermethylated genes with reduced chromatin accessibility.
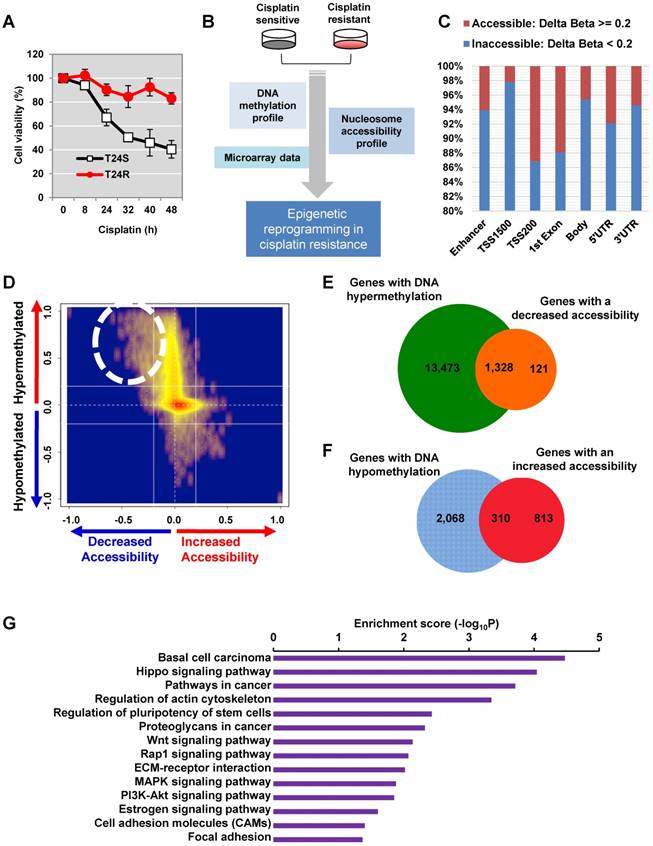
We first performed DNA methylation analysis using the Illumina HumanMethylation450 BeadChip, in which >482,421 CpG sites are queried across the human genome. We identified 118,465 CpG sites as being differentially methylated in T24R cells compared to T24S cells, with a fold change of M-value ≥ 1.0. Of these 118,465 differentially methylated CpG sites, we identified decreased methylation of 9,014 sites in 4,052 genes and increased methylation of 109,451 sites in 93,068 genes in T24R cells compared to T24S. (Figure S1 and Table S1). These findings suggest that DNA methylation profiles are radically altered in T24R cells and that hypermethylation may be correlated to cisplatin resistance in T24 BC cells.
Given the predominant global DNA hypermethylation pattern in T24R cells, we speculated that T24R cells also have distinctive chromatin modifications and accessibility alterations that affect gene expression. Chromatin structure, which is organized through DNA methylation and nucleosome accessibility (or occupancy), plays a critical role in regulating gene expression at the transcription start site [39]. Thus, monitoring of chromatin accessibility, DNA methylation, and histone modification is crucial for understanding disease progression and responses to therapy. Due to its importance in chromatin structuring, we hypothesized that nucleosome accessibility is altered in cisplatin-resistant BC cells, leading to altered DNA methylation.
To test this hypothesis, we used the AcceSssIble assay [39] to determine nucleosome occupancy and positioning in T24R and T24S cells by probing CpGs using the Illumina HM450 BeadChip [39]. We identified a digital footprint of nucleosome occupancy and positioning in both the CpG-rich islands and CpG-poor regions of T24R and T24S cells. Methylation of nuclei treated with or without M.SssI, a CpG methyltransferase enzyme that methylates CpG sites on nucleosome-depleted unbound DNA, was compared using the Illumina HM450 BeadChip. We then stratified CpG sites with altered nucleosome accessibility (Figure 1C). Many genomic regions displayed decreased accessibility, except TSS 200 and the first exon.
Differential DNA methylation plotted against differential chromatin accessibility is shown in the Kernel density scatter plot (Figure 1D) with the circle depicting genes with decreased chromatin accessibility and DNA hypermethylation. Interestingly, we observed that nucleosome occupancy was greatly altered in T24R cells compared to the control T24S cells (Figure S1). In particular, we identified 1,328 genes with DNA hypermethylation and decreased chromatin accessibility in T24R cells compared to T24S cells (Figure 1D-E and Table S2). We also identified 310 genes with DNA hypomethylation and increased chromatin accessibility in T24R versus T24S cells (Figure 1D, F and Table S3). The top 10 genes with hypermethylation and decreased chromatin accessibility and the top 10 genes with hypomethylation and increased accessibility are listed in Table S4 and Table S5. To understand the biological function of these genes, we performed functional enrichment analysis on the 1,328 hypermethylated genes, which revealed significant advancement of cancer-related pathways in T24R cells (Figure 1G). These findings provide a finer resolution on the nature of epigenetic mechanisms and broaden our understanding of nucleosome occupancy and DNA methylation changes in cisplatin-resistant BC cells.
Perturbed epigenetic signatures in cisplatin-resistant BC cells may lead to changes in gene expression
The DNA methylation data was integrated with our previously reported gene expression data [40]. According to the gene expression and DNA methylation pattern, we grouped the genes into 6 clusters (Figure 2A). Among these, clusters 1 (up-hypo) and 2 (down-hyper) showed opposite patterns of gene expression and DNA methylation between T24R and T24S cells (Figure 2A). Cluster 1 contained genes in T24R cells whose expression was upregulated and DNA methylation was decreased. Cluster 2 consisted of genes in T24R cells whose expression was downregulated and DNA methylation was increased (Figure 2A). Follow-up gene ontology bioinformatic analyses of the experimental data further suggested that there is significant epigenetic silencing of genes that regulate arginine and proline metabolism, as well as extracellular matrix receptor interaction, PPAR signaling, adherens junction and focal adhesion, in cisplatin-resistant BC cells [40] (Figure 2B). In contrast, genes related to DNA replication were found to be epigenetically upregulated (hypomethylated) (Figure 2B).
Metabolic pathways directed by differentially expressed and methylated genes. (A) Heatmap depicting differential gene expression and DNA methylation patterns of T24R cells compared to T24S cells. (B) The enriched biological processes associated with the upregulated genes with DNA hypomethylation vs. the downregulated genes with DNA hypermethylation. (C) Metabolic pathway map displaying the changes seen in cisplatin-resistant BC. The KEGG metabolic map was overlaid with gene expression data. The nodes represent metabolic compounds and edges represent genes involved in the reactions (red lines: upregulated and hypomethylated genes; green lines: downregulated and hypermethylated genes). The boxes with dotted lines indicate significantly altered pathways, including those for arginine and proline metabolism.
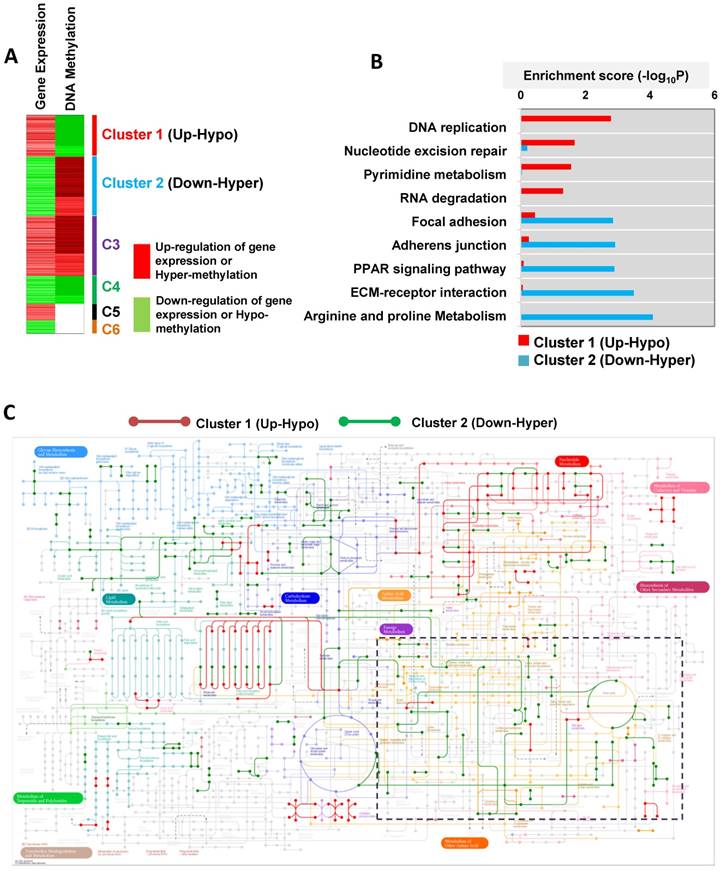
As a result of this hypomethylation, transcription of genes associated with DNA replication, repair, and pyrimidine metabolism was upregulated. This suggests that there may possibly be a metabolic relationship between amino acid metabolism and DNA repair mechanisms. In an independent effort to explore metabolic perturbation of cisplatin resistance, a Kyoto Encyclopedia of Genes and Genomes (KEGG) metabolic map was constructed that displayed the differential regulation of metabolic pathways between cisplatin-resistant BC cells and controls. This also supported the idea that transcripts for the metabolism of amino acids, such as arginine and proline (down-hyper), and of purine and pyrimidine (up-hypo), are significantly altered in T24R cells (Figure 2C). In particular, promoters of genes associated with amino acid metabolism, such as arginine and proline metabolism, were hypermethylated, leading to decreased gene expression levels, as shown in the dotted box in Figure 2C and Figure S2.
Cisplatin-resistant T24 cells displayed epigenetic silencing (hypermethylation and decreased mRNA expression) of genes associated with arginine and proline metabolism, such as GLUD2 (glutamate dehydrogenase 2), ARG2 (arginase 2), ALDH2 (aldehyde dehydrogenase 2), P4HA1 (prolyl 4-hydroxylase subunit alpha 1), ALDH7A1, (aldehyde dehydrogenase 7 family member A1), GLUD1 (glutamate dehydrogenase 1), PYCR1 (pyrroline-5-carboxylate reductase 1), ASS1 (argininosuccinate synthase 1), ALDH18A1 (aldehyde dehydrogenase 18 family member A1), P4HA2 (prolyl 4-hydroxylase subunit alpha 2), NAGS (N-acetylglutamate synthase), as well as SAT1 (spermidine/spermine N1-acetyltransferase), and CKB (creatine kinase B) (fold change≥2 and FDR<0.05; Table 1). We identified SAT1 and ASS1 as the two most prominently hypermethylated and downregulated genes in T24R cells. The fold change of SAT1 expression was -6.09 (FDR<0.001), while that of ASS1 was -5.27 (FDR=0.017). Given that SAT1 and ASS1 have not yet been studied in the context of cisplatin resistance in BC, our results suggest new gene targets.
Comparison of genes in cisplatin-resistant (T24R) and cisplatin-sensitive (T24S) cells. The genes are listed in two categories, DNA replication (pink) or arginine, proline, and polyamine metabolism (blue). The most downregulated (and hypermethylated) genes in cisplatin-resistant cells are those regulating arginine and proline metabolism, which include ASS1 and SAT1.
| Pathways | Symbol | Full name | mRNA Fold change | Accessibility |
|---|---|---|---|---|
| DNA replication | MCM7 | minichromosome maintenance complex component 7 | 2.35 | No change |
| POLD1 | polymerase (DNA directed), delta 1, catalytic subunit | 1.54 | No change | |
| POLE4 | polymerase (DNA-directed), epsilon 4, accessory subunit | 1.52 | No change | |
| POLE | polymerase (DNA directed), epsilon, catalytic subunit | 1.48 | No change | |
| RFC3 | replication factor C (activator 1) 3, 38kDa | 1.36 | No change | |
| RNASEH2C | Ribonuclease H2, subunit C | 1.28 | No change | |
| Arginine and proline metabolism | GLUD2 | glutamate dehydrogenase 2 | -1.12 | No change |
| ARG2 | arginase 2 | -3.15 | No change | |
| ALDH2 | aldehyde dehydrogenase 2 family (mitochondrial) | -5.09 | Decreased | |
| P4HA1 | prolyl 4-hydroxylase, alpha polypeptide I | -1.67 | No change | |
| ALDH7A1 | aldehyde dehydrogenase 7 family, member A1 | -1.27 | Decreased | |
| GLUD1 | glutamate dehydrogenase 1 | -1.09 | No change | |
| GLS | glutaminase | -1.88 | No change | |
| PYCR1 | pyrroline-5-carboxylate reductase 1 | -1.14 | No change | |
| ASS1 | argininosuccinate synthase 1 | -5.27 | Decreased | |
| ALDH18A1 | aldehyde dehydrogenase 18 family, member A1 | -1.21 | No change | |
| SAT1 | spermidine/spermine N1-acetyltransferase 1 | -6.09 | Increased | |
| P4HA2 | prolyl 4-hydroxylase, alpha polypeptide II | -1.31 | Decreased | |
| NAGS | N-acetylglutamate synthase | -1.91 | No change | |
| CKB | creatine kinase, brain | -1.22 | No change |
Expression levels of epigenetically regulated genes are associated with clinical outcomes in BC patients
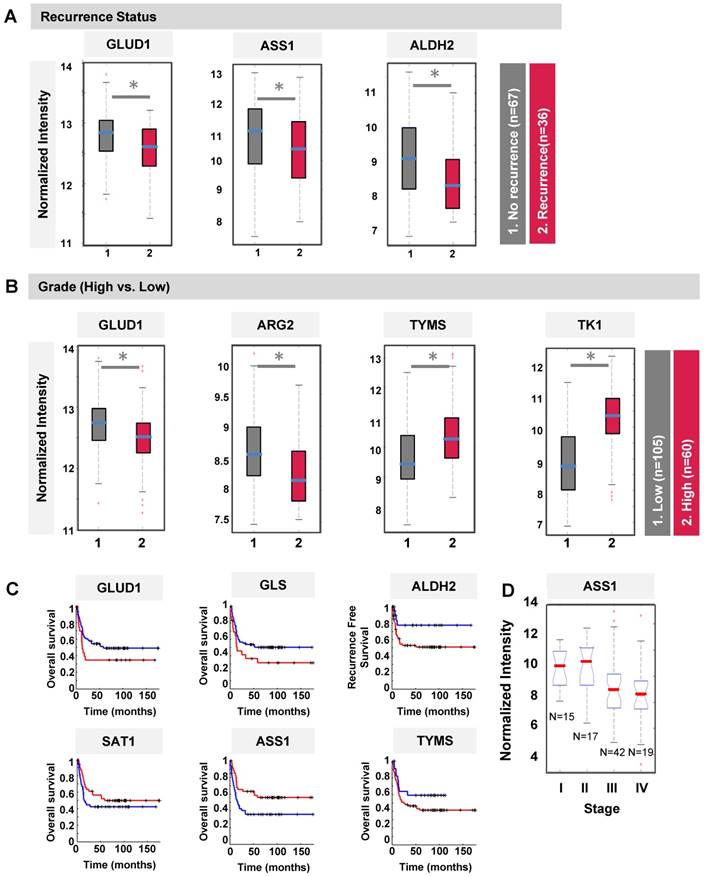
We next speculated if the differentially methylated genes (DMGs) identified in T24R cells could be clinically predictive indicators for recurrence, tumor grade, overall survival, and/or stage. To test this, we performed a series of analyses on the association of the DMGs with clinical outcomes using publicly available gene expression microarray data derived from 103 BC patients [41]. GLUD1, ASS1, and ALDH2 were found to be associated with recurrence in BC patients who had already undergone chemotherapy (Figure 3A). ASS1 was downregulated in BC patients who had recurrence (n=36) compared to those without (n=67) (Figure 3A). BC tumor grades were positively or negatively associated with gene expression levels of our protein panel, which included GLUD1, ARG2, TYMS (thymidylate synthase), and TK1 (thymidine kinase 1) (Figure 3B). TYMS and TK1 are proteins associated with pyrimidine metabolism and their gene levels were more upregulated and hypomethylated in T24R cells (Figure 2B). Furthermore, gene expression patterns of GLUD1, GLS, ALDH2, SAT1, ASS1, and TYMS distinguished patients who had worse overall survival from those with recurrence-free survival (Figure 3C). Of note, ASS1 expression was also negatively correlated with BC stage: lower ASS1 expression was a feature of higher tumor stage (Figure 3D). Collectively, these results suggest that SAT1 and ASS1 are hypermethylated in cisplatin-resistant BC cells, thereby resulting in aberrant loss of expression. These defects may be what causes the decrease in recovery efficiency after DNA damage.
Clinical association of DMGs with differential expression in T24R and T24S cells. (A) Box plot showing recurrence predictability of GLUD1, ASS1, and ALDH2. (B) Box plot showing grade predictability of GLUD1, ARG2, TYMS, and TK1. (C) Overall survival rate graph showing survival predictability of GLID1, GLS, and ALDH2. (D) Box plot showing tumor stage predictability of ASS1.
Epigenetic landscapes of SAT1 and ASS1 in cisplatin-resistant BC cells
We next sought to determine the DNA methylation landscape of ASS1, which is located on chromosome 9 and has several CpG islands. The difference in DNA methylation of ASS1 between T24R and T24S cells was 4.35-fold (log2) and the gene expression difference was -5.27-fold (log2) (Figure 4A). SAT1 and TYMS are localized on chromosomes X and 18, respectively. SAT1 showed 1.33-fold (log2) increased DNA methylation and 6.09-fold (log2) decreased gene expression in T24R cells. Individual DNA methylation levels at specific CpG sites in ASS1, SAT1, and TYMS are shown in Figure 4B.
Alteration of DNA methylation landscapes in cisplatin-resistant BC cells. (A) Table showing promoter CpG methylation sites identified by HM450 array, and fold changes in DNA methylation and gene expression of ASS1, SAT1, and TYMS. Fold changes of DNA methylation (orange bars) and gene expression (green bars) of ASS1, SAT1, and TYMS in T24R compared to T24S, are shown. (B) Methylation sites on ASS1, SAT1, and TYMS (red circle, hypermethylated sites; green circle, hypomethylated sites; white circle, no changes). (C) Downregulation of SAT1 and ASS1 protein expression levels in T24R cells compared to T24S. (D) Increased protein expression of SAT1 and ASS1 in T24R cells upon treatment with decitabine, an inhibitor of DNA methylation. (E) Increased protein expression of SAT1 and ASS1 in J82R or RT4R cells upon treatment with decitabine.
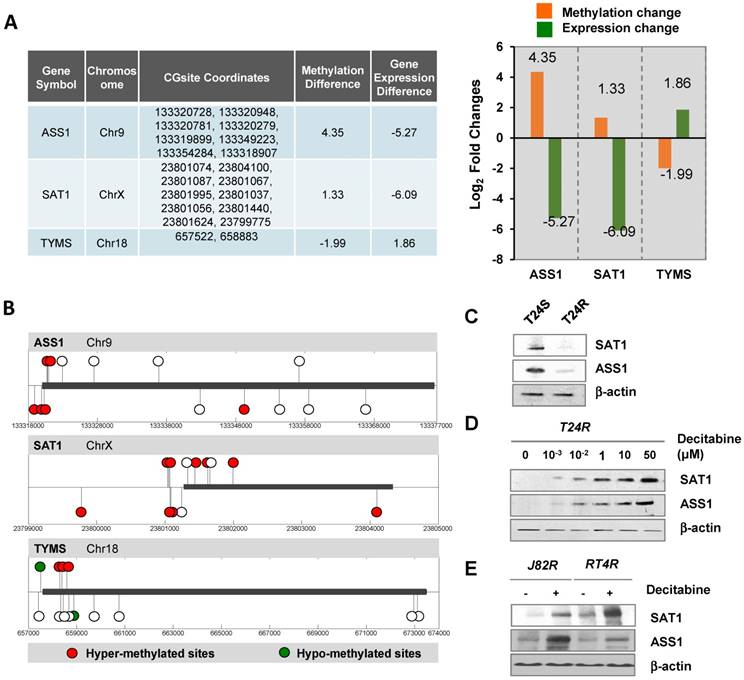
To further assess the causative relationship of ASS1 and SAT1 to cisplatin resistance, protein expression levels were compared between T24R and T24S cells (Figure 4C). We also found that in vitro addition of decitabin, a DNMT inhibitor, increased protein expression of both SAT1 and ASS1 in T24R cells (Figure 4D). Furthermore, two additional cisplatin-resistant BC cells lines, J82R and RT4R, were used to test whether decitabine treatment increases SAT1 and ASS1 expression. Experimental results showed that protein expression of both SAT1 and ASS1 were significantly enhanced in the presence of decitabine, which was consistent with data from T24R cells (Figure 5E). Collectively, these findings indicate that downregulation of SAT1 and ASS1 may most likely be due to changes in epigenetic regulation (DNA hypermethylation of CpG promoter regions).
Sensitization of T24R cells to cisplatin-induced apoptosis by overexpression of SAT1 or BENSpm treatment. (A) Overexpression of SAT1 protein in T24R cells transfected with pCMV7.1 3XFLAG-hSAT1 was confirmed by western blot analysis using an anti-flag antibody. (B) Sensitization of T24R cells to cisplatin-induced cell apoptosis upon overexpression of SAT1. (C) Increase in ROS production through overexpression of SAT1 in T24R cells and reduction of ROS by N-acetylcysteine (NAC). The levels of ROS produced in control cells are set at 100%. Each bar represents the mean ± SD of three independent experiments (*, P<0.05). (D) Suppression of survival of cisplatin-treated T24R cells by BENSpm treatment. (E-F) Treatment with BENSpm sensitized cisplatin-resistant BC cells, J82R (E) and RT4R (F). (G) Restoration of ASS1 expression in T24S cells by API-PEG 20 in a dose-dependent manner. Cells were harvested 72 h after treatment. (H-J) Enhancement of apoptosis through the combination of cisplatin and ADI-PEG 20 in cisplatin-resistant T24R, but not T24S, cells. Cell survival was determined used (H) MTS assay and (I) crystal violet assay 72 h after treatment with cisplatin with or without ADI-PEG 20. (J) T24R cells were treated with cisplatin alone, ADI-PEG 20 alone, or with cisplatin plus ADI-PEG 20 for 0, 24, or 72 h. Crystal violet assay was performed. (K) T24R cells were treated with cisplatin alone, ADI-PEG 20 alone, or with cisplatin plus ADI-PEG 20 for 0, 8, 24, 30, 48, or 72 h. (Blue circle: ADI-PEG 20 plus cisplatin; white circle: cisplatin alone; gray circle: ADI-PEG 20 alone). Cell survival rates were measured using MTS assay. (L-M) Cell survival rates increased in J82R or RT4R cells upon treatment with cisplatin and ADI-PEG 20.
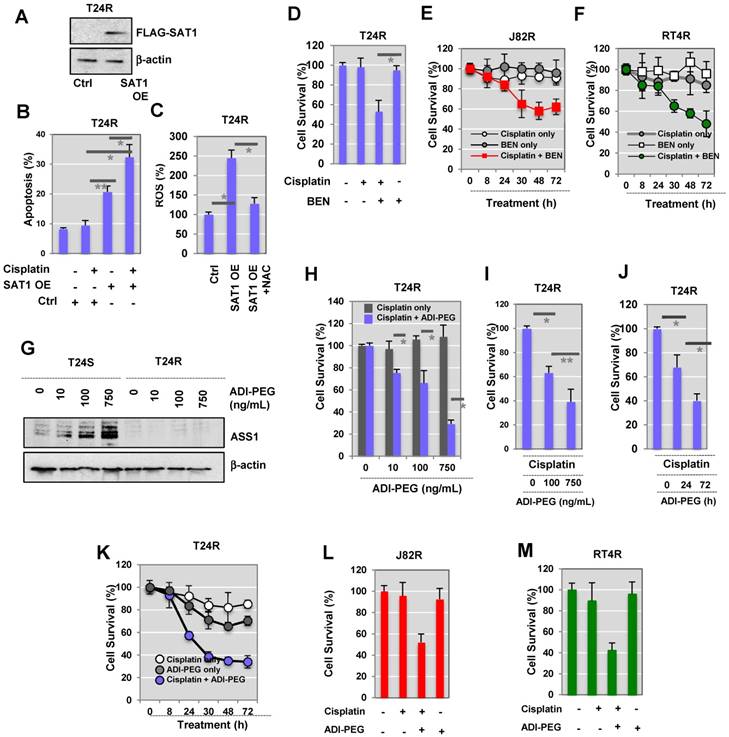
SAT1 and ASS1 play critical roles in cisplatin resistance
Western blot analysis data demonstrated that cisplatin-resistant BC cells express little SAT1, while cisplatin-sensitive cells exhibit clearly detectable expression. Based on this, we hypothesized that activation or induced expression of SAT1 could re-sensitize T24R cells. T24R cells were transfected with a FLAG-SAT1 vector (Figure 5A). We found that induced SAT1 expression in T24R cells enhanced apoptosis in both the absence and presence of cisplatin (Figure 5B). Upon cisplatin treatment, SAT1-overexpressing T24R cells displayed a significant increase in apoptosis, an approximate 3.5-fold of untreated basal levels (Figure 5B). SAT1 overexpression also led to an estimated 2.3-fold increase in the production of reactive oxygen species (ROS), which may contribute to the re-sensitization of T24R cells to cisplatin (Figure 5C).
Next, to evaluate the potential interdependence of SAT1 activation and drug sensitivity, we treated T24R cells with a combination of cisplatin and BENSpm (a SAT1 inducing reagent) (Figure 5D). This resulted in a significant synergistic reduction of cell survival that was greater than treatment with cisplatin or BENSpm alone. Consistent with the findings in T24R cells, additional experiments conducted on J82R (Figure 5E) and RT4R (Figure 5F) cells showed that BENSpm sensitized cisplatin-resistant BC cells.
Our experimental data provided evidence that DNA methylation of ASS1 is increased and gene expression is decreased in T24R cells (Figure 4A). In addition, arginine metabolism is also shown to be defective in T24R cells. This opens the possibility that this may also hold true for other cisplatin-resistant cancers. During analysis of publicly available human BC data collections, we found that ASS1 expression is negatively correlated with BC recurrence and grade. Currently, pegylated arginine deiminase (ADI-PEG 20), an arginine-depleting therapy, is under evaluation in clinical trials for many types of cancers, including BC. We found that similar treatment with ADI-PEG 20 increased ASS1 expression in T24S cells (Figure 5G). In T24R cells, ASS1 was not expressed up to 72 h following treatment with ADI-PEG 20 (Figure 5G). We also found that ASS1 was not re-expressed when T24R cells were treated for 96 h. Given that T24S cells exhibit ASS1 expression, ASS1 deficiency will likely be a key factor in selecting patients for clinical trials involving ADI-PEG 20 therapy, which is consistent with previous observations in other cancer types [42].
Next, we determined whether arginine depletion via ADI-PEG 20 could induce apoptosis in T24R cells that do not express ASS1. T24R cells were treated under various conditions: (1) cisplatin alone, or (2) combination of cisplatin and ADI-PEG 20 in a dose-dependent manner (1, 10, 100, and 750 ng/mL). Cell survival rates were measured using two independent assays, the MTS (Figure 5H) and crystal violet assay (Figure 5I). The following time-dependent experiments showed consistent results (Figures 5J (crystal violet assay) and Figure 5K (MTS assay)). In addition, J82R and RT4R cells were tested with ADI-PEG 20 treatment as well. The results suggested that a combination of cisplatin and ADI-PEG 20 greatly enhances responsiveness to cisplatin in resistant BC cell lines and resulted in approximately 50% and 40% reduction in cell survival rates in J82R and RT4R cells, respectively (Figures 5L-M).
To further supplement evidence for the association of ASS1 and SAT1 with BC, immunohistochemistry (IHC) analysis was performed using commercial BC tumor microarrays (TMAs). We found that 80% of the tumors (32/40 cores) were negative for SAT1 and ASS1 protein expression (data not shown). These results imply that SAT1 and/or ASS1 silencing are potential indicators of disease. In this regard, patients with little to no expression of SAT1 and ASS1 may be good candidates for combination treatments with ADI-PEG 20 and cisplatin. This is because SAT1 and ASS1 expression may be indicators of clinical benefit from cisplatin chemotherapy and/or arginine deprivation therapy.
Discussion
In this study, we sought to determine if epigenetically regulated metabolic reprogramming is associated with cisplatin resistance in BC, and if SAT1 and ASS1 are potential predictive biomarkers for cisplatin resistance. Generally, treatment for recurrent BC involves systemic cisplatin chemotherapy [43]. Although this current standard has decreased morbidity and mortality, failure of treatment frequently occurs due to acquired chemoresistance. This has resulted in a 5-year survival rate of only 5-15% following recurrence [44-46]. Therefore, concerted efforts are necessary to identify markers associated with cisplatin resistance in BC patients. Moreover, identification of markers is key to comprehending the mechanisms of cisplatin resistance that is critically needed in order to develop novel treatment strategies.
In our study, decitabine reestablished cisplatin susceptibility in resistant BC cells by increasing ASS1 expression. Our experimental results demonstrate the epigenetic regulatory mechanisms of ASS1 and SAT1 and their potential contributions to metabolic perturbations that are apparent in the context of drug resistance. This study also provides evidence that therapeutic targeting of metabolic pathways through the use of BENSpm or ADI-PEG 20 may help overcome cisplatin resistance. Furthermore, analysis of tumor tissue samples from BC patients showed that approximately 80% had little to no expression of ASS1 and SAT1, an indication that these genes have profound roles in BC tumorigenesis and development. Although this is out of the scope of this current study, it would be of great interest to evaluate if ASS1 and/or SAT1 are predictive indicators of response to adjuvant chemotherapy among assembled BC patient populations.
Global reprogramming of DNA methylation has been linked to the onset and progression of cancer [23, 47]. DNA hypermethylation at promoter regions of tumor suppressor genes often leads to silencing of expression. In contrast, DNA hypomethylation has been reported to induce genome instability and can activate proto-oncogenes [48, 49]. DNA-demethylating agents, such as 2′-deoxy-5-azacitidine/decitabine (DAC) and 5-azacitidine/azacitine (AZA), can induce global DNA demethylation in tumor cells when they are transiently given at low doses [50, 51]. DAC and AZA can also reverse epigenetic silencing and reactivate tumor suppressor gene expression, which might contribute to antitumor effects. In non-cancer diseases, such as myelodysplastic syndrome (MDS), the FDA has approved AZA and DAC as treatment options. Next-generation DNMT inhibitors and oral formulations are also currently under development. However, epigenetic therapies alone may not be effective in treating human cancers. They are likely best when combined with other modalities, such as chemotherapies or immunotherapies. Thus, there are a series of ongoing clinical trials using DNMT inhibitors in combination with conventional regimens for many cancer types [52].
Our current study further investigated the epigenetic landscape of cisplatin-resistant BC and found that resistance may be associated with modifications in the arginine metabolome via ASS1, the rate-limiting enzyme in arginine synthesis. Loss of ASS1 drives cancer cells to become dependent on extracellular arginine, effectively converting these cells into arginine auxotrophs. ASS1 deficiency has been observed in various other cancer types, including hepatocellular carcinoma, melanoma, myxofibrosarcoma, mesothelioma, prostate cancer, and renal cancer [53-57]. In terms of BC, ASS1 deficiency is particularly common in urothelial carcinoma, small cell, and squamous cell carcinoma subtypes [57, 58]. Based on this, ADI-PEG 20 is currently being tested in clinical trials for many cancer types (https://clinicaltrials.gov, identifiers NCT01497925, NCT02029690, and NCT02101593, etc.). Given previous findings demonstrating that ASS1 expression is negatively correlated with the anti-cancer effects of ADI-PEG 20 treatment, loss off or reduced ASS1 may be a predictive factor that can determine which patients will benefit from treatment.
Our results also showed that SAT1 overexpression promotes the sensitivity of T24R cells to cisplatin-induced apoptosis. This is consistent with a previous report showing that SAT1 overexpression can lead to the depletion of spermidine and spermine, while simultaneously increasing polyamine oxidation [59]. This depletion of spermidine and spermine causes apoptosis through a mitochondria-mediated pathway [59]. Since mitochondrial dysfunction and redox imbalance are known to contribute to cancer, it would be interesting to investigate the connection between polyamine metabolism and cisplatin resistance in the context of mitochondrial function, metabolic pathways, and cell signaling. Although we did not delve into this area in our study, we believe that a better understanding of the potential link between nitrogen metabolism and cisplatin resistance in BC may provide supplemental information on epigenetic regulation of metabolism.
In summary, our present study suggests that the epigenetic regulation of certain amino acids and polyamine metabolic enzymes is significantly altered in BC and that this change may play a critical role in BC chemoresistance. The main results from our study are expected to lead to a novel molecular signature that could potentially be applied in clinical tests for guiding treatment decisions. Thereby, these results could pave a path towards identification of novel drugs that can decrease chemoresistance. Our data also suggests the involvement of polyamine and arginine pathways in BC chemoresistance. The experimental results from this study contribute to a better understanding of the dependence of BC on exogenous polyamine or arginine, which may potentially lead to the capability of accurately distinguishing MIBC patients who will not develop cisplatin resistance. The status of SAT1 or ASS1 expression may be a reliable method of identifying which MIBC patients will or will not develop cisplatin resistance after chemotherapy. Furthermore, this study has significant clinical relevance to public health; it provides pre-clinical evidence that enhancing polyamine catabolism or arginine biosynthesis may overcome cisplatin resistance in aggressive BC.
Methods
Reagents
ADI-PEG 20 was generously provided by Polaris Pharmaceuticals (San Diego, CA). A vector construct encoding FLAG-tagged human SAT1 (pCMV7.1 3XFLAG-hSAT1) was provided by Dr. MH Park [60]. BENSpm, a SAT1 agonist, was a gift from Dr. David Oupicky at the University of Nebraska Medical Center. Decitabine, a DNMT inhibitor, was obtained from Selleckchem (Cat. No. S1200). The following antibodies were purchased, as indicated: β-actin (Sigma, USA), SAT1 (Thermo Fisher Scientific, USA), ASS1 (Cell Signaling Technology, USA), PARP, and cleaved-PARP (Cell Signaling Technology, USA).
Tissue culture
Three human BC cell lines (T24, J82, and RT4) were procured from the American Type Culture Collection (Manassas, VA). Cisplatin-sensitive (T24S, J82S, and RT4S) or resistant (T24R, J82R, and RT4R) cells were constructed and characterized in our laboratory [38]. Experiments were carried out in accordance with approved protocols and all methods adhered to institutional guidelines.
Accessibility assay
The principle of this assay has been described and published prior [39, 61]. Cell pellets were washed twice with ice-cold PBS buffer then resuspended in 1 mL PBS. Lysis buffer (10 mM Tris (pH 7.4), 10 mM NaCl, 3 mM MgCl2, 0.1 mM EDTA, 0.5% NP-40) was then added and the lysates were centrifuged at 1006 rcf for 5 min at 4 °C. The supernatant was removed and the pellets were suspended in 2 mL of wash buffer (10 mM Tris (pH 7.4), 10 mM NaCl, 3 mM MgCl2, 0.1 mM EDTA). This suspension was then divided into two microcentrifuge tubes (no enzyme and M.Sssl reactions) and centrifuged again at 1006 rcf for 5 min at 4 °C. The supernatant was removed and the following was added to each tube: 84.25 µL 1X NEBuffer 2, 7.5 µL 10X NEBuffer 2, 45 µL 1 M sucrose, 1.5 µL 32 mM S-adenosylmethionine (SAM), and 12.5 µL 4 U/µL M.Sssl (or H2O for the no enzyme tube). The reaction mixtures were incubated at 37 °C for 15 min. Pre-warmed (37 °C) 300 µL stop solution (10 mM Tris-HCl (pH 7.9), 600 mM NaCl, 1% SDS, 0.1 mM EDTA) and 6 µL of Proteinase K were added to each tube, and the reaction mixtures were incubated at 55 °C for 16 h. DNA was then purified via phenol/chloroform extraction and ethanol precipitation, and then redissolved in 20 µL of ddH2O for subsequent analyses.
Quality control M.SssI treatment
In total, 1 µg of no enzyme or M.Sssl-treated DNA was subjected to bisulfite conversion using the Zymo EZ DNA Methylation Kit (using the Illumina Infinium® Methylation Assay alternative incubation conditions). Bisulfite (BS)-converted DNA was then analyzed by the high-resolution melt (HRM) method using the Bio-Rad Precision Melt Supermix (Catalog #172-5110) (reaction mix: 10 µL Precision Melt Supermix, 0.8 µL of 5 µM primer mix, 1 µL BS-converted DNA, 8.2 µL ddH2O) (PCR protocol: 95 °C for 00:02:00, [95 °C for 00:00:10, 58 °C for 00:00:30, plate read, 72 °C for 00:00:30] × 60 cycles, 95 °C for 00:00:30, 60 °C for 00:01:00, melt curve 65 °C to 90 °C [00:00:10 and plate read at each degree]). Primer sequences: ACTB: 5'-AGAGGGGGTAAAAAAATGTTGTAT-3', 5'-TCGAACCATAAAAAACAACTTTC-3'; GADPH: 5'-TTTTAAGATTTTGGGTTGGGT-3', 5'-CTATCGAACAAAAAAAACAAAAAAC-3'; C1D: 5'-TTTTTGGAGAAGAGTTAAGGAGTAGG-3'; 5'-ACTCCAATCTCCCGAAAAAC-3'; RPLP0: 5'-AGGTGGTAGTAGTTTAGAGTAAGTTTT-3', 5'-CGAATACAAACAACCATTAAATA-3'. Proper M.SssI treatment was verified by a shift in melting curves upon methylation. For HM450 analysis, >0.5 µg of BS-treated DNA samples with verified M.Sssl treatment were submitted.
Infinium® HumanMethylation450 BeadChip assay and data processing
The amount of bisulfite-converted DNA and the completion of bisulfite conversion were determined using a panel of MethyLight-based quality control (QC) tests, as described previously [62]. All the samples that passed the QC tests were subjected to the HM450 assay data production [49].
The HM450 probes interrogate the methylation statuses of ~485,000 CpG sites, which covers 99% of RefSeq genes, 96% of CpG islands, and spans promoters 5' UTRs, first exons, gene bodies, and 3' UTRs. The probe list was then filtered to remove probes with a detection p-value > 0.05 and those located within 15 base pairs of a single-nucleotide polymorphism, mapped to multiple locations, or are on sex chromosomes. The end result is a dataset of corrected beta-values for 385,826 probes that cover ~19,500 genes. The intensities of methylation-specific probes over the signals of unmethylated-specific probes were computed as M values [63]. The M values from the arrays were normalized using the quantile method [64].
Chromatin accessibility analysis
The beta value method with methylation data was used to analyze bisulfite-treated DNA as described in a previous study [39]. Briefly, The accessibility scale was defined as the beta value of M.SssI-treated cells minus the beta value of the no-enzyme control (delta-beta), defined on a 0-1 scale, after removing the probes with delta-beta <0. Accessible probes were defined as delta-beta >0.2.
Identification of differentially expressed genes
To identify differentially expressed genes (DEGs) between T24S and T24R cells, we performed the integrated hypothesis testing method [65, 66]. Briefly, the T value, log2-median ratios, and Z values for rank-sum differences were computed for each gene. Empirical distributions of the null hypothesis were estimates for the T values, log2-median ratios, and Z values of the genes after permuting the samples. For each gene, adjusted P-values of its observed T-values, log2-median ratios, and rank-sum ratios were computed using their corresponding empirical distributions in a two-tailed test. The individual P-values from the two tests were then combined and the false discovery rate (FDR) was computed using the Stouffer's method [65, 66]. The DEGs were chosen based on their FDR and fold change (FDR<0.05 and log2-fold-change≥1.0).
Functional enrichment analysis
Enrichment analysis of gene ontology biological processes (GOBPs) and KEGG pathways for the genes listed as DMGs and DEGs was performed using the DAVID software [67].
Construction of a network model
To construct a network model describing cisplatin resistance in BC cells, we first selected the subsets of genes from Clusters 1 and 2 that were involved in metabolic processes. We then collected the interaction data regarding these genes from the STRING database (Ver. 10.5) and used this information to reconstruct a network model [68]. Finally, the network model was visualized using Cytoscape [69]. The nodes in the network model represent the genes distributed according to the metabolic pathway in which they are involved.
Quantitative RT-PCR analysis
Total RNA was purified using the MagNA Pure Compact RNA Isolation Kit (Roche), according to the manufacturer's instructions. The cDNA was then synthesized using the iScript cDNA Synthesis Kit (Bio-Rad), which was followed by qPCR using iTaq Universal SYBR Green Supermix (Bio-Rad) on an ABI 7500 Fast Real-Time PCR System (Life Technologies). The annealing temperature for qPCR was set to 60 °C and actin-beta (ACTB) was used as an internal control for normalization of gene expression.
Western blot analysis
The collected cells were washed twice with ice-cold PBS and lysed with a whole-cell extract lysis buffer (Bio-Rad) with a protease inhibitor cocktail (Thermo Fisher). Protein levels were measured and cell lysates containing 25 μg of proteins were used for SDS-PAGE. Proteins were then electrophorectically transferred onto nitrocellulose membranes for further processing. After blocking for 30 min with 5% milk in tris-buffered saline with tween 20 (TBST), the membranes were incubated with a specific primary antibody overnight at 4 °C. Following this step, the membranes were washed and incubated with secondary, species-specific horseradish peroxidase-conjugated antibodies. Immunoreactive proteins were detected via chemiluminescence (Pierce Laboratories) and band intensities were quantified using ImageJ.
Cell survival assay
T24 cell lines were incubated with cisplatin, BENSpm, and/or ADI-PEG 20, as indicated. Cell survival after treatment was determined by measuring cell viability using MTS reagents (Promega Corporation, Madison, WI), according to the company's protocols.
Reactive oxygen species (ROS) measurement
To determine intracellular ROS levels, cells were stained using dischlorofluorescein diacetate (DCF-DA) (Sigma-Aldrich). Cells were seeded into 6-well plates at a density of 2×10⁵ cells/well. At 24 h post seeding, DCF-DA was added to the wells under low-light conditions and the plates were incubated in the dark at room temperature for 20 min. The cells were then washed twice with PBS and fluorescence intensities were determined using the FACS Calibur Flow Cytometer. Data was analyzed using FlowJo software.
Statistical analysis
Statistical analyses were conducted using MATLAB (Ver. 9.2). Data was expressed as mean ± standard deviation (SD). For most of the biochemical data analyses, Student's t-test was used. Differences were considered statistically significant when *p < 0.05, or **p < 0.01.
Abbreviations
ADI: arginine deiminase; ALDH18A1: aldehyde dehydrogenase 18 family member A1; ALDH2: aldehyde dehydrogenase 2; ALDH7A1: aldehyde dehydrogenase 7 family member A1; ARG2: arginase 2; ASS1: argininosuccinate synthase 1; AZA: 5-azacitidine/azacitine; BC: bladder cancer; CKB: creatine kinase B; DAC: 2'-deoxy-5-azacitidine/decitabine DCF-DA: dichlorofluorescein diacetate; DEGs: differentially expressed genes; DMGs: differentially methylated genes; DNMT: DNA methyltransferase; FD: fold-change; FDR: false discovery rate; GLUD1: glutamate dehydrogenase 1; GLUD2: glutamate dehydrogenase 2; GOBPs: gene ontology biological processes; MDS: myelodysplastic syndrome; MIBC: muscle invasive bladder cancer; NAGS: N-acetylglutamate synthase; NMIBC: non-muscle invasive bladder cancer; PARP: poly-(ADP-ribose)-polymerase; PBS: phosphate-buffered saline; P4HA1: prolyl-4-hydroxylase subunit alpha 1; P4HA2: prolyl-4-hydroxylase subunit alpha 2; PYCR1: pyrroline-5-carboxylate reductase 1; ROS: reactive oxygen species; SD: standard deviation; SAT1: spermidine/spermine N1-acetyltransferase; T24R: cisplatin-resistant T24R cells; T24S: cisplatin-sensitive T24R cells.
Supplementary Material
Supplementary figure and table legends, supplementary figures, supplementary tables 4-5.
Supplementary table 1.
Supplementary table 2.
Supplementary table 3.
Acknowledgements
The authors acknowledge support from National Institutes of Health (1U01DK103260, 1R01DK100974, U24 DK097154, NIH NCATS UCLA CTSI UL1TR000124), Department of Defense (W81XWH-15-1-0415), Centers for Disease Controls and Prevention (1U01DP006079), IMAGINE NO IC Research Grant, the Steven Spielberg Discovery Fund in Prostate Cancer Research Career Development Award, the U.S.-Egypt Science and Technology Development Fund by the National Academies of Sciences, Engineering, and Medicine (to J.K.), the Vicky Joseph Cancer Research Foundation, and Kure it for Cancer Research (to G.L.). J.K. is former recipient of Interstitial Cystitis Association Pilot Grant, a Fishbein Family IC Research Grant, New York Academy of Medicine, and Boston Children's Hospital Faculty Development. The funders had no role in the design, data collection and analysis, decision to publish or preparation of the manuscript.
Authors' Contributions
JK conceptualized and designed the study, led the fund acquisition process, and overviewed the literature analysis and drafting of the manuscript. AY and DJW performed HM450 analysis and nucleosome accessibility analysis. AY contributed to pre-processing of samples. MP, DJW, and GL provided scientific insights to data analyses. SY and MK performed full data analysis and visualization of the data. AG, DJW, and MP assisted in the preparation of the manuscript. All authors read and approved the final manuscript.
Competing Interests
The authors have declared that no competing interest exists.
References
1. Kiemeney LA, Witjes JA, Verbeek AL, Heijbroek RP, Debruyne FM. The clinical epidemiology of superficial bladder cancer. Dutch South-East Cooperative Urological Group. British journal of cancer. 1993;67:806-12
2. Borden LS Jr, Clark PE, Hall MC. Bladder cancer. Current opinion in oncology. 2003;15:227-33
3. Hall MC, Chang SS, Dalbagni G, Pruthi RS, Seigne JD, Skinner EC. et al. Guideline for the management of nonmuscle invasive bladder cancer (stages Ta, T1, and Tis): 2007 update. The Journal of urology. 2007;178:2314-30
4. Kamat AM. Commentary on "Surveillance guidelines based on recurrence patterns after radical cystectomy for bladder cancer: the Canadian Bladder Cancer Network experience." Yafi FA, Aprikian AG, Fradet Y, Chin JL, Izawa J, Rendon R, Estey E, Fairey A, Cagiannos I, Lacombe L, Lattouf JB, Bell D, Saad F, Drachenberg D, Kassouf W. Department of Surgery (Urology), McGill University, Quebec, Canada: BJU Int 2012;110(9):1317-23 [Epub 2012 Apr 13]. Urologic oncology. 2013;31:717-8
5. Large MC, Cohn JA, Steinberg GD. Optimal risk-adapted surveillance strategies for NMIBC, including upper tract imaging. The Urologic clinics of North America. 2013;40:305-15
6. Babjuk M, Oosterlinck W, Sylvester R, Kaasinen E, Bohle A, Palou-Redorta J. EAU guidelines on non-muscle-invasive urothelial carcinoma of the bladder. European urology. 2008;54:303-14
7. Stenzl A, Cowan NC, De Santis M, Kuczyk MA, Merseburger AS, Ribal MJ. et al. Treatment of muscle-invasive and metastatic bladder cancer: update of the EAU guidelines. European urology. 2011;59:1009-18
8. Black PC, Dinney CP. Growth factors and receptors as prognostic markers in urothelial carcinoma. Current urology reports. 2008;9:55-61
9. Apolo AB, Grossman HB, Bajorin D, Steinberg G, Kamat AM. Practical use of perioperative chemotherapy for muscle-invasive bladder cancer: summary of session at the Society of Urologic Oncology annual meeting. Urologic oncology. 2012;30:772-80
10. Schwentner C, Stenzl A, Gakis G. Monitoring high-risk bladder cancer. Current opinion in urology. 2012;22:421-6
11. Sonpavde G, Sternberg CN. Neoadjuvant chemotherapy for invasive bladder cancer. Current urology reports. 2012;13:136-46
12. Feber A, Dhami P, Dong L, de Winter P, Tan WS, Martinez-Fernandez M. et al. UroMark-a urinary biomarker assay for the detection of bladder cancer. Clinical epigenetics. 2017;9:8
13. Li HT, Duymich CE, Weisenberger DJ, Liang G. Genetic and Epigenetic Alterations in Bladder Cancer. International neurourology journal. 2016;20:S84-94
14. Lopez JI, Angulo JC, Martin A, Sanchez-Chapado M, Gonzalez-Corpas A, Colas B. et al. A DNA hypermethylation profile reveals new potential biomarkers for the evaluation of prognosis in urothelial bladder cancer. APMIS: acta pathologica, microbiologica, et immunologica Scandinavica. 2017;125:787-96
15. Hesson LB, Patil V, Sloane MA, Nunez AC, Liu J, Pimanda JE. et al. Reassembly of nucleosomes at the MLH1 promoter initiates resilencing following decitabine exposure. PLoS genetics. 2013;9:e1003636
16. Jimenez-Useche I, Ke J, Tian Y, Shim D, Howell SC, Qiu X. et al. DNA methylation regulated nucleosome dynamics. Scientific reports. 2013;3:2121
17. You JS, Jones PA. Cancer genetics and epigenetics: two sides of the same coin? Cancer cell. 2012;22:9-20
18. Silverman LR, Greenberg P, Raza A, Olnes MJ, Holland JF, Reddy P. et al. Clinical activity and safety of the dual pathway inhibitor rigosertib for higher risk myelodysplastic syndromes following DNA methyltransferase inhibitor therapy. Hematological oncology. 2015;33:57-66
19. Treppendahl MB, Kristensen LS, Gronbaek K. Predicting response to epigenetic therapy. The Journal of clinical investigation. 2014;124:47-55
20. Portella G, Battistini F, Orozco M. Understanding the connection between epigenetic DNA methylation and nucleosome positioning from computer simulations. PLoS computational biology. 2013;9:e1003354
21. Huff JT, Zilberman D. Dnmt1-independent CG methylation contributes to nucleosome positioning in diverse eukaryotes. Cell. 2014;156:1286-97
22. Yoo CB, Jones PA. Epigenetic therapy of cancer: past, present and future. Nature reviews Drug discovery. 2006;5:37-50
23. Jones PA. Functions of DNA methylation: islands, start sites, gene bodies and beyond. Nature reviews Genetics. 2012;13:484-92
24. Kelly TK, Liu Y, Lay FD, Liang G, Berman BP, Jones PA. Genome-wide mapping of nucleosome positioning and DNA methylation within individual DNA molecules. Genome research. 2012;22:2497-506
25. Masui K, Cavenee WK, Mischel PS. mTORC2 in the center of cancer metabolic reprogramming. Trends in endocrinology and metabolism: TEM. 2014;25:364-73
26. Masui K, Cavenee WK, Mischel PS. mTORC2 dictates Warburg effect and drug resistance. Cell Cycle. 2014;13:1053-4
27. Phan LM, Yeung SC, Lee MH. Cancer metabolic reprogramming: importance, main features, and potentials for precise targeted anti-cancer therapies. Cancer biology & medicine. 2014;11:1-19
28. Kroemer G, Pouyssegur J. Tumor cell metabolism: cancer's Achilles' heel. Cancer cell. 2008;13:472-82
29. Soga T. Cancer metabolism: key players in metabolic reprogramming. Cancer science. 2013;104:275-81
30. Ferreira LM, Hebrant A, Dumont JE. Metabolic reprogramming of the tumor. Oncogene. 2012;31:3999-4011
31. Phillips MM, Sheaff MT, Szlosarek PW. Targeting Arginine-Dependent Cancers with Arginine-Degrading Enzymes: Opportunities and Challenges. Cancer research and treatment: official journal of Korean Cancer Association. 2013;45:251-62
32. Maze I, Noh KM, Soshnev AA, Allis CD. Every amino acid matters: essential contributions of histone variants to mammalian development and disease. Nature reviews Genetics. 2014;15:259-71
33. Cheon DJ, Walts AE, Beach JA, Lester J, Bomalaski JS, Walsh CS. et al. Differential expression of argininosuccinate synthetase in serous and non-serous ovarian carcinomas. The journal of pathology Clinical research. 2015;1:41-53
34. McAlpine JA, Lu HT, Wu KC, Knowles SK, Thomson JA. Down-regulation of argininosuccinate synthetase is associated with cisplatin resistance in hepatocellular carcinoma cell lines: implications for PEGylated arginine deiminase combination therapy. BMC cancer. 2014;14:621
35. Szlosarek PW, Luong P, Phillips MM, Baccarini M, Stephen E, Szyszko T. et al. Metabolic response to pegylated arginine deiminase in mesothelioma with promoter methylation of argininosuccinate synthetase. Journal of clinical oncology: official journal of the American Society of Clinical Oncology. 2013;31:e111-3
36. Chang X, Monitto CL, Demokan S, Kim MS, Chang SS, Zhong X. et al. Identification of hypermethylated genes associated with cisplatin resistance in human cancers. Cancer research. 2010;70:2870-9
37. Pegg AE, Casero RA Jr. Current status of the polyamine research field. Methods in molecular biology. 2011;720:3-35
38. Kim WT, Kim J, Yan C, Jeong P, Choi SY, Lee OJ. et al. S100A9 and EGFR gene signatures predict disease progression in muscle invasive bladder cancer patients after chemotherapy. Annals of oncology: official journal of the European Society for Medical Oncology. 2014;25:974-9
39. Pandiyan K, You JS, Yang X, Dai C, Zhou XJ, Baylin SB. et al. Functional DNA demethylation is accompanied by chromatin accessibility. Nucleic acids research. 2013;41:3973-85
40. Lee S, Yoon CY, Byun SS, Lee E, Lee SE. The role of c-FLIP in cisplatin resistance of human bladder cancer cells. The Journal of urology. 2013;189:2327-34
41. Kim WJ, Kim EJ, Kim SK, Kim YJ, Ha YS, Jeong P. et al. Predictive value of progression-related gene classifier in primary non-muscle invasive bladder cancer. Molecular cancer. 2010;9:3
42. Synakiewicz A, Stachowicz-Stencel T, Adamkiewicz-Drozynska E. The role of arginine and the modified arginine deiminase enzyme ADI-PEG 20 in cancer therapy with special emphasis on Phase I/II clinical trials. Expert opinion on investigational drugs. 2014;23:1517-29
43. Noon AP, Catto JW. Bladder cancer in 2012: Challenging current paradigms. Nature reviews Urology. 2013;10:67-8
44. Kamat AM, Hegarty PK, Gee JR, Clark PE, Svatek RS, Hegarty N. et al. ICUD-EAU International Consultation on Bladder Cancer 2012: Screening, diagnosis, and molecular markers. European urology. 2013;63:4-15
45. Gakis G, Efstathiou J, Lerner SP, Cookson MS, Keegan KA, Guru KA. et al. ICUD-EAU International Consultation on Bladder Cancer 2012: Radical cystectomy and bladder preservation for muscle-invasive urothelial carcinoma of the bladder. European urology. 2013;63:45-57
46. Sternberg CN, Bellmunt J, Sonpavde G, Siefker-Radtke AO, Stadler WM, Bajorin DF. et al. ICUD-EAU International Consultation on Bladder Cancer 2012: Chemotherapy for urothelial carcinoma-neoadjuvant and adjuvant settings. European urology. 2013;63:58-66
47. Baylin SB, Jones PA. A decade of exploring the cancer epigenome - biological and translational implications. Nature reviews Cancer. 2011;11:726-34
48. Jones PA, Baylin SB. The epigenomics of cancer. Cell. 2007;128:683-92
49. Yang X, Han H, De Carvalho DD, Lay FD, Jones PA, Liang G. Gene body methylation can alter gene expression and is a therapeutic target in cancer. Cancer cell. 2014;26:577-90
50. Shen H, Laird PW. In epigenetic therapy, less is more. Cell stem cell. 2012;10:353-4
51. Tsai HC, Li H, Van Neste L, Cai Y, Robert C, Rassool FV. et al. Transient low doses of DNA-demethylating agents exert durable antitumor effects on hematological and epithelial tumor cells. Cancer cell. 2012;21:430-46
52. Juergens RA, Wrangle J, Vendetti FP, Murphy SC, Zhao M, Coleman B. et al. Combination epigenetic therapy has efficacy in patients with refractory advanced non-small cell lung cancer. Cancer discovery. 2011;1:598-607
53. Khadeir R, Szyszko T, Szlosarek PW. Optimizing arginine deprivation for hard-to-treat cancers. Oncotarget. 2017;8:96468-9
54. Kremer JC, Prudner BC, Lange SES, Bean GR, Schultze MB, Brashears CB. et al. Arginine deprivation inhibits the Warburg effect and upregulates glutamine anaplerosis and serine biosynthesis in ASS1-deficient cancers. Cell reports. 2017;18:991-1004
55. Ohshima K, Nojima S, Tahara S, Kurashige M, Hori Y, Hagiwara K. et al. Argininosuccinate synthase 1-deficiency enhances the cell sensitivity to arginine through decreased DEPTOR expression in endometrial cancer. Scientific reports. 2017;7:45504
56. Panosyan EH, Lin HJ, Koster J, Lasky JL 3rd. In search of druggable targets for GBM amino acid metabolism. BMC cancer. 2017;17:162
57. Sahu D, Gupta S, Hau AM, Nakashima K, Leivo MZ, Searles SC. et al. Argininosuccinate synthetase 1 loss in invasive bladder cancer regulates survival through general control nonderepressible 2 kinase-mediated eukaryotic initiation factor 2 alpha activity and is targetable by pegylated arginine deiminase. The American journal of pathology. 2016
58. Allen MD, Luong P, Hudson C, Leyton J, Delage B, Ghazaly E. et al. Prognostic and therapeutic impact of argininosuccinate synthetase 1 control in bladder cancer as monitored longitudinally by PET imaging. Cancer research. 2014;74:896-907
59. Mandal S, Mandal A, Park MH. Depletion of the polyamines spermidine and spermine by overexpression of spermidine/spermine N(1)-acetyltransferase 1 (SAT1) leads to mitochondria-mediated apoptosis in mammalian cells. The Biochemical journal. 2015;468:435-47
60. Lee SB, Park JH, Woster PM, Casero RA Jr, Park MH. Suppression of exogenous gene expression by spermidine/spermine N1-acetyltransferase 1 (SSAT1) cotransfection. The Journal of biological chemistry. 2010;285:15548-56
61. Becket E, Chopra S, Duymich CE, Lin JJ, You JS, Pandiyan K. et al. Identification of DNA methylation-independent epigenetic events underlying clear cell renal cell carcinoma. Cancer research. 2016;76:1954-64
62. Campan M, Weisenberger DJ, Trinh B, Laird PW. MethyLight. Methods in molecular biology. 2009;507:325-37
63. Irizarry RA, Ladd-Acosta C, Carvalho B, Wu H, Brandenburg SA, Jeddeloh JA. et al. Comprehensive high-throughput arrays for relative methylation (CHARM). Genome research. 2008;18:780-90
64. Bolstad BM, Irizarry RA, Astrand M, Speed TP. A comparison of normalization methods for high density oligonucleotide array data based on variance and bias. Bioinformatics. 2003;19:185-93
65. Hwang D, Rust AG, Ramsey S, Smith JJ, Leslie DM, Weston AD. et al. A data integration methodology for systems biology. Proceedings of the National Academy of Sciences of the United States of America. 2005;102:17296-301
66. Hwang D, Smith JJ, Leslie DM, Weston AD, Rust AG, Ramsey S. et al. A data integration methodology for systems biology: experimental verification. Proceedings of the National Academy of Sciences of the United States of America. 2005;102:17302-7
67. Huang da W, Sherman BT, Lempicki RA. Systematic and integrative analysis of large gene lists using DAVID bioinformatics resources. Nature protocols. 2009;4:44-57
68. Szklarczyk D, Morris JH, Cook H, Kuhn M, Wyder S, Simonovic M. et al. The STRING database in 2017: quality-controlled protein-protein association networks, made broadly accessible. Nucleic acids research. 2017;45:D362-D8
69. Shannon P, Markiel A, Ozier O, Baliga NS, Wang JT, Ramage D. et al. Cytoscape: a software environment for integrated models of biomolecular interaction networks. Genome research. 2003;13:2498-504
Author contact
![]() Corresponding author: Jayoung Kim, PhD., Departments of Surgery and Biomedical Sciences, Cedars-Sinai Medical Center, 8700 Beverly Blvd., Los Angeles, CA 90048. Tel: +1-310-423-7168; Fax: +1-310-967-3809; E-mail: Jayoung.Kimorg
Corresponding author: Jayoung Kim, PhD., Departments of Surgery and Biomedical Sciences, Cedars-Sinai Medical Center, 8700 Beverly Blvd., Los Angeles, CA 90048. Tel: +1-310-423-7168; Fax: +1-310-967-3809; E-mail: Jayoung.Kimorg