Impact Factor
- Issue 14; 2026
- Issue 13; 2026
- Issue 12; 2026
- Issue 11; 2026
- Issue 10; 2026
- Volume 16; 2026
- Advance Articles
- Past Issues
- Cover Images
- Cover Suggestion
- Index & Coverage
- Special Issues
Introduction
Methods
Results
Discussion
Conclusion
Abbreviations
Supplementary Material
Acknowledgements
References
International Journal of Biological Sciences
International Journal of Medical Sciences
 Global reach, higher impact

Theranostics 2018; 8(16):4563-4573. doi:10.7150/thno.26754 This issue Cite
Research Paper
[18F]Fludarabine-PET as a promising tool for differentiating CNS lymphoma and glioblastoma: Comparative analysis with [18F]FDG in human xenograft models
Narinée Hovhannisyan1, Fabien Fillesoye1, Stéphane Guillouet1, Méziane Ibazizene1, Jérôme Toutain2, Fabienne Gourand1, Samuel Valable2, Benoit Plancoulaine3, Louisa Barré1 ![]()
1. Normandie Univ, UNICAEN, CEA, CNRS, CHU Caen, ISTCT/LDM-TEP group, GIP Cyceron, Caen, France
2. Normandie Univ, UNICAEN, CEA, CNRS, CHU Caen, ISTCT/CERVOxy group, GIP Cyceron, Caen, France
3. Normandie Univ, UNICAEN, INSERM, ANTICIPE, Caen, France
Received 2018-4-18; Accepted 2018-7-30; Published 2018-8-10
Abstract

This paper investigated whether positron emission tomography (PET) imaging with [18F]fludarabine ([18F]FDB) can help to differentiate central nervous system lymphoma (CNSL) from glioblastoma (GBM), which is a crucial issue in the diagnosis and management of patients with these aggressive brain tumors. Multimodal analyses with [18F]fluorodeoxyglucose ([18F]FDG), magnetic resonance imaging (MRI) and histology have also been considered to address the specificity of [18F]FDB for CNSL.
Methods: Nude rats were implanted with human MC116 lymphoma-cells (n = 9) or U87 glioma-cells (n = 4). Tumor growth was monitored by MRI, with T2-weighted sequence for anatomical features and T1-weighted with gadolinium (Gd) enhancement for blood brain barrier (BBB) permeability assessment. For PET investigation, [18F]FDB or [18F]FDG (~11 MBq) were injected via tail vein and dynamic PET images were acquired up to 90 min after radiotracer injection. Paired scans of the same rat with the two [18F]-labelled radiotracers were investigated. Initial volumes of interest were manually delineated on T2w images and set on co-registered PET images and tumor-to-background ratio (TBR) was calculated to semi-quantitatively assess the tracer accumulation in the tumor. A tile-based method for image analysis was developed in order to make comparative analysis between radiotracer uptake and values extracted from immunohistochemistry staining.
Results: In the lymphoma model, PET time-activity curves (TACs) revealed a differential response of [18F]FDB between tumoral and healthy tissues with average TBR varying from 2.45 to 3.16 between 5 to 90 min post-injection. In contrast, [18F]FDG demonstrated similar uptake profiles for tumoral and normal regions with TBR varying from 0.84 to 1.06 between these two time points. In the glioblastoma (GBM) model, the average TBRs were from 2.14 to 1.01 for [18F]FDB and from 0.95 to 1.65 for [18F]FDG. Therefore, inter-model comparisons showed significantly divergent responses (p < 0.01) of [18F]FDB between lymphoma and GBM, while [18F]FDG demonstrated overlap (p = 0.04) between the groups. Tumor characterization with histology (based mainly on Hoechst and CD79), as well as with MRI was overall in better agreement with [18F]FDB-PET than [18F]FDG with regard to tumor selectivity.
Conclusions: [18F]FDB-PET demonstrated considerably greater specificity for CNSL when compared to [18F]FDG. It also permitted a more precise definition of target volume compared to contrast-enhanced MRI. Therefore, the potential of [18F]FDB-PET to distinguish CNSL from GBM is quite evident and will be further investigated in humans.
Keywords: [18F]fludarabine-PET, [18F]FDG, CNS lymphoma, glioblastoma, differential diagnosis
Introduction
Primary CNSL is a rare type of non-Hodgkin lymphoma that accounts for 3-5% of all brain tumors [1]. Primary CNSL presents both single or multifocal lesions and its most frequent pathological type is diffuse large B-cell lymphoma (DLBCL) [2]. It is an aggressive disease; thus, early diagnosis is crucial. MRI with contrast agent injection is mandatory for an initial evaluation because of its high soft-tissue resolution and contrast; if MRI is contraindicated, then contrast-enhanced computed tomography (CT) can be performed [3]. However, a major issue is to distinguish CNSL from other brain lesions, particularly from high grade gliomas, which are the most common primary brain tumors and often display similar aspects to that of CNSL on contrast-enhanced CT and MRI [4-6]. Chemotherapy and/or radiation therapy is the treatment of choice for CNSL [2], whereas for GBM, surgical resection is the primary solution before treatment, thus the importance of accurate differentiation of tumors. The diagnosis of CNSL still requires histopathological confirmation before therapeutic decision-making. However, the infiltrative and multifocal nature of the disease may make the biopsy procedure unfeasible when lesions are inaccessible or adjacent to critical brain structures [2,3]. Although contrast-enhanced MRI is the modality of choice, negative findings, as well as underestimation of tumor burden are well known outcomes [4,7,8].
In contrast to anatomical imaging, PET modality permits the detection of abnormal metabolic areas and to image tumor heterogeneity [9]. In general, the bulk of the literature concerns the use of [18F]FDG, which is the most extensively used tracer for PET imaging of brain tumors [10]. Although [18F]FDG-PET imaging provides high specificity and sensitivity in several types of cancer and was reported as a valuable approach for differentiation between brain tumors [11,12], it is important to recognize that [18F]FDG is not a specific radiotracer for imaging malignant disease. A number of factors can affect the [18F]FDG uptake and may explain the causes of false-positive and false-negative imaging data. Indeed, increased [18F]FDG uptake indicates increased glucose consumption and it is taken up by a wide range of brain malignancies and inflammatory disorders. Non-tumor-related uptake of [18F]FDG is frequently identified in post-surgery inflammatory sites [13], as well as in inflammatory conditions after therapy [14]. Moreover, [18F]FDG-PET was reported useless particularly for diagnosis of disseminated, hemorrhagic or non-enhancing CNSL regarded as atypical findings [15]. To circumvent these limitations, several amino acid analogues are proposed in order to characterize the tumor biology more appropriately. The role of [11C]methionine (MET), in distinguishing CNSL and GBM is, however, unclear despite its results equal to or more accurate than those of [18F]FDG [16-19]. Several clinical trials refer to [18F]fluoroethyltyrosine ([18F]FET), [18F]fluorothymidine ([18F]FLT) and [18F]fluorodopa ([18F]FDOPA) to assess the diagnosis of patients for whom brain tumors are suspected [20-22]. These radiotracers are suggested to be more precise in determining the extent of disease, facilitating biopsy guidance and surgery. To our knowledge, no studies have been conducted to date in patients with CNSL to test the performance of 18F-amino acid- vs [18F]FDG-PET. Therefore, pretreatment differentiation between CNSL and GBM remains a challenge for non-invasive imaging techniques and needs multimodal imaging for reliable differential diagnosis.
[18F]Fludarabine ([18F]FDB), a PET-radiotracer version of fludarabine drug, is a radiolabeled adenine nucleoside analogue that was reported as a valuable tool for imaging lymphoma. This probe is a substrate for the equilibrative nucleoside transporters, ENT1 and ENT2. After transport into the cell and initial phosphorylation by deoxycytidine kinase (dCK), an enzyme expressed at relatively high levels in lymphoid malignancies, [18F]fludarabine is trapped [23,24]. Indeed, similar to dCK-specific probes such as 2'-deoxy-2'-[18F]fluoro-β-D-arabinofuranosylcytosine ([18F]FAC) and [18F]clofarabine ([18F]CFA) [25], [18F]fludarabine targets the lymphoid cells a priori due to the increased levels of dCK [26]. [18F]FAC or [18F]CFA showed higher affinity for T-cells, and were considered pertinent for surveilling immune cell infiltration in tumors [27,28]. Being a PET-tracer version of fludarabine drug, which is highly effective for B-cell malignancies [29], [18F]fludarabine uptake should well be elevated for B-lymphoproliferative disorders.
The specificity of this radiotracer has been studied in several lymphoma models (follicular RL7, DOHH2; multiple myeloma RPMI-8226) and under various conditions such as cancerous tissue following therapy and inflammation [30-33]. In summary, the radiotracer demonstrated specific uptake in explored xenograft models of human lymphomas, marked contrast between tumoral and normal tissues, and no uptake in normal brain tissue or in cardiac muscle. Moreover, its consumption level in inflammatory tissue was negligible compared to [18F]FDG [34]. We assumed that this tracer may allow a correct surveillance of lymphoma, enabling the detection of residual cancerous tissues with differentiation of tumoral and inflammatory masses. The first-in-human study in two types of lymphoid malignancies (DLBCL and chronic lymphocytic leukemia) has consolidated the great potential of this innovative tool for extra-cerebral lymphoma imaging [35].
The purpose of this preclinical study was to investigate whether [18F]FDB-PET can help to differentiate between CNSL and GBM in murine models relevant to the human diseases, considering also multimodal analyses with [18F]FDG, MRI and histology involving quantitative characterization of tumors.
Methods
Ethics of experimentation and committee approval
Experiments were conducted in accordance with the recommendations of the European commission (2010/63/EU) and the French national committee for the care and the use of laboratory animals. Experiments were approved by the regional committee on animal ethics (#2758). Rats were housed under constant environmental conditions with 12/12h light-dark cycles (ONCOModels/Centre Universitaire de Ressources Biologiques (CURB), approval n°A14118015) according to ARRIVE guidelines [36] and γ-irradiated chow/water were provided ad libitum. Rats were maintained under isoflurane anesthesia (induction 5%, maintenance 2%, with 70% N2O/30% O2; Minerve system, Bioscan) throughout experimentations including imaging procedures. Body temperature was maintained at 37.5 °C by a rectal probe connected to an electric blanket, or using a feedback-controlled system (Minerve, Bioscan) integrated in the animal bed during the imaging sessions.
Cell culture and animal model
Human MC116 cells (B-cell lymphoma; ATCC, CRL-1649) were cultured in suspension in RPMI-1640 supplemented with 20% fetal bovine serum, 2 mM L-glutamine and antibiotics. Human U87-MG cells (malignant glioma; ATCC, HTB-14) were grown in Dulbecco's modified Eagle's medium with 1 g/L of glucose supplemented with 2 mM L-glutamine and 10% fetal calf serum. Cells were harvested and counted (viability > 80%) immediately before intracerebral implantation. Nude rats (8-10 weeks old, 200 ± 16 g body weight) were placed on a stereotactic head holder, and a scalp incision was performed along the sagittal suture. A 1 mm diameter burr hole was drilled in the skull, 3 mm lateral to the bregma [37]. MC116 cells (1.5×10⁶ cells in 15 µL of phosphate-buffered saline (PBS), at 1 µL/min flow rate) or U87-MG cells (5×10⁴ cells in 3 µL of 2 mM glutamine/PBS, at 1 µL/min flow rate) were injected in the right caudate-putamen at a depth of 6 mm. The needle was removed slowly 5 min after the end of the injection and the skin was sutured before the animal was awaken. For the lymphoma model, rats were intraperitoneally injected with cyclophosphamide treatment (100 mg/kg, Sigma-Aldrich) 24 h before and 2 weeks after MC116 cell inoculation to improve the consistency of tumor growth [38]. Additionally, two sham-operated rats were investigated by injection of physiological saline. The animals were examined daily for 2 to 3 weeks for behavioral signs of pain and were sacrificed with onset of suffering signs or weight loss of more than 20%.
Imaging sessions
In the CNSL model (n=9), the tumor growth was assessed by MRI at days 7, 13 and 20 (Figure 1A). For the GBM model (n=4), the tumor growth was previously described [37] and experience-based information was provided for this study; therefore, the MRI was performed only once (day 13) (Figure 1B). The PET(/CT) sessions with [18F]FDB and [18F]FDG were performed on two consecutive days, respectively, both in lymphoma (days 21 and 22) and GBM (days 15 and 16) models.
Experimental paradigm of imaging sessions. The tumor growth was assessed by MRI at (A) days 7, 13 and 20 for the CNSL and (B) day 13 for the GBM model (laboratory-based experience). In both models, the PET(/CT) sessions with [18F]FDB and [18F]FDG were performed on two consecutive days. D0: inoculation day; euth: euthanasia.
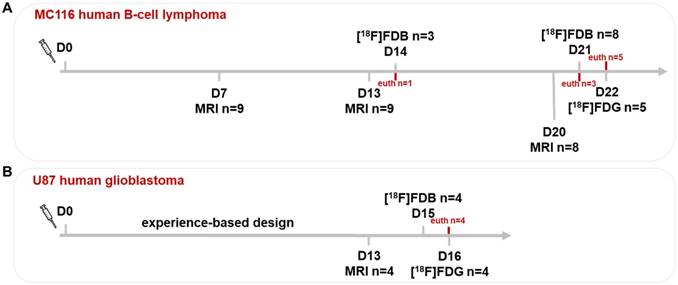
Of note: 3/9 CNSL rats were first imaged with [18F]FDB-PET at day 14, where 1 rat was sacrificed for brain ex-vivo autoradiography. Another 3/8 rats were sacrificed after [18F]FDB-PET scan at day 21, due to ethical reasons. The additional two sham-operated rats were imaged with [18F]FDB-PET at day 21.
Magnetic resonance imaging
MRI examinations were performed on a 7 T horizontal magnet (Pharmascan, Bruker, Germany). A cross coil (volume/surface) configuration was used. After scout imaging, an anatomical exploration of the brain was performed using a T2-weighted sequence (RARE: rapid acquisition with refocused echoes, referred as T2w) where the following parameters were applied: acceleration factor = 8, TR/TE (repetition time/echo time) = 5000/62.5 ms, number of experiments (NEX) = 1, number of contiguous slices = 20, resolution of 0.15 × 0.15 × 0.75 mm3, acquisition time = 2 min. Dynamic T1-weighted sequence (FLASH: fast low angle shot, referred as T1w-Gd) was used for the investigation of BBB permeability. A catheter (BD Insyte-N Autoguard, Becton Dickinson, USA) was inserted through the skin into the caudal vein for the injection of the gadolinium (Gd) contrast agent. The sequence was acquired prior to, during and after the intravenous injection of Gd (Dotarem, 200 µmol/kg, Guerbet) and the following parameters were applied: number of repetitions = 15, TR/TE = 100/4 ms, flip angle = 30°, number of contiguous slices = 10, resolution of 0.2 × 0.2 × 1.0 mm3, acquisition time/repetition = 19.2 s.
Positron emission tomography/computed tomography
Images were acquired on a microPET/CT scanner (Inveon, Siemens, USA). A Minerve imaging chamber was used for reproducible positioning of rats. The CT scan was performed for PET attenuation correction and for multimodal co-registration. Default settings of attenuation correction scan were applied (x-ray tube setup = 80 keV and 500 mA, acquisition time = 5 min) and the data were reconstructed into 0.022 × 0.022 × 0.022 mm3 resolution images.
[18F]FDB (11.32 ± 0.74 MBq, in-house radiosynthesis [30]) or [18F]FDG (11.49 ± 0.59 MBq, purchased from Cyclopharma S.A) were injected via the caudal vein. Simultaneous injection of radiotracer and initiation of PET acquisition were performed to obtain TACs for 90 min (n=5 for CNSL and n=4 for GBM models). Based on the TAC profiles, static scans were acquired 40-60 min post-injection for the rest of the animals. PET scans were performed in list-mode with default acquisition settings (coincidence timing window = 3.4 ns, energy window = 350-650 keV). All data corrections were applied and images were reconstructed with iterative OSEM3D/MAP algorithm [39] (iterations = 18, requested resolution = 2.26 mm, uniform variance, fastMAP) into 0.776 × 0.776 × 0.796 mm3 resolution images.
Immunohistochemistry
After the last PET scan, CNSL rats were transcardially perfused with phosphate buffer (0.2 M, pH 7.4) followed by 4% paraformaldehyde (PFA, Sigma-Aldrich). The excised brains were placed in a 4% PFA solution at 4 °C for several days. Fixed brains were then cryoprotected by immersion in a 30% sucrose solution during 72 h, then cut with a freezing microtome (HM-450, Microm international GmbH, Germany) in 30 µm-thick coronal slices with a 750 µm inter-slice distance equal to the T2w-MRI axial resolution. Histological slides were kept at -20 °C in a cryoprotectant mixture (30% glycerol, 20% ethylene glycol and 50% PBS). For immunolabeling, after blocking the non-specific binding (0.5% Triton, 0.1% Tween and 3% bovine serum albumin (BSA) in PBS for 2 h at room temperature), slices were incubated overnight with primary CD79 antibody (rabbit anti-human CD79b, 0.1 µg/mL, Abcam; for characterization of lymphoid B-cells) and RECA antibody (mouse anti-rat RECA-1 HIS52, 10 μg/mL, Bio-Rad; to stain the tumor vasculature) or CD68 antibody (mouse anti-rat CD68 ED1, 2.5 µg/mL, Bio-Rad; to stain inflammatory cells) with 0.5% Triton, 0.1% Tween and 1% BSA in PBS at 4 °C, followed by incubation at room temperature for 1 h with fluorophore-labeled secondary antibodies—donkey anti-rabbit IgG (conjugated with Alexa-Fluor 488, 10 µg/mL, Invitrogen) and donkey anti-mouse IgG (conjugated with Alexa 555, 10 μg/mL, Invitrogen)—with the cell nuclei counterstained with Hoechst (33342, 10 µg/mL, Sigma-Aldrich). High resolution and x100 magnification histological images were acquired using an inverted Leica DMi8 fluorescence microscope (Leica Microsystems CMS GmbH, Germany), generating paired data from Hoechst, CD79, RECA and CD68 stainings. These virtual slices were then pre-processed with ImageJ 1.51 software (http://imagej.nih.gov/ij/) for brain section orientation, cropping and artifact exclusion (note: the stained images with severe artifacts were not selected in this study). The resulted images were then saved in tiff file format with 0.65 × 0.65 µm² final resolution. The histological characterization of the GBM model is available elsewhere [40].
Ex-vivo autoradiography
One rat was sacrificed at day 14 (Figure 1A) and the excised brain was frozen by immersion in -40 °C isopentane (Sigma-Aldrich) and embedded in optimal-cutting-temperature compound (Tissue-Tek). The frozen samples were sectioned with a Leica CM3050 cryostat (Leica Microsystemes SAS) at -20 °C; 30 µm thick slices were cut and mounted on glass slides (SuperFrost Plus Slides). The sections were dried on a hot plate at 60 °C and apposed overnight on a storage phosphor screen (Multipurpose, Perkin Elmer). Imaging plates were then scanned by a Cyclone Phosphor Imager (Perkin Elmer). After radioactivity decay, the slides were stained with Mayer's haematoxylin and eosin (Sigma-Aldrich) and images were acquired with a microscope (Leica DMi8).
Multimodal data fusion and analysis
Image co-registration
For each rat, all images were co-registered (Pmod 3.7, PMOD Technologies, Switzerland) to the reference image: T2w-MRI. For this, the CT from the PET-CT study was manually matched to the T2w-MRI by a rigid transformation (R1: translation, rotation) preceded by a rough manual initialization of the position and orientation (reflection, rotation) of both scans in order to set the correct orientation of the rat. The PET image has the origin at the same anatomical position as its paired CT; however, in exceptional cases (e.g., animal movement) the PET image was manually matched (R2: translation, rotation) to CT. Then, the PET was matched to the T2w-MRI by applying the combination of the transforms (Rc = R1 ○ R2) (Figure S1). When working with dynamic PET scans, an average image of several frames was created in order to easily manipulate the matching transformations; the calculated transforms were then applied on the dynamic image. Furthermore, to keep only the brain tissue, the co-registered scans were processed to mask the pixels (set to 0) of peripheral tissues outside the brain contours delineated on the reference image.
Tumor volume assessment
The tumor was manually delineated on the T2w scan. Tumor volume was calculated automatically with Pmod 3.7 by multiplication of the sum of contiguous tumor surface areas by the slice thickness. The T1w-Gd scan was used to define the tumor portion with BBB permeability.
Data quantification
In the present work, four methods of PET quantification were investigated (see Supplementary Material) to consider the results across modalities, including volume of interest (VOI) / region of interest (ROI)-based global and local analysis and, specific analysis using a tile-based approach [41]. The radiotracer uptake was expressed as a maximum standardized uptake value (SUVmax) or tumor-to-background ratio (TBR) where the cerebellum was taken as reference tissue.
Statistical analyses
Values reported in the text are expressed as mean ± SD. Inter-tracer group differences were examined using Student's t- or Mann Whitney tests for independent samples and paired t-test for pairwise comparisons. Differences between two or more groups were assessed by one-way ANOVA, followed by a Bonferroni correction. P values < 0.05 were considered significant. Pearson's correlation was determined to evaluate the relationship between radiotracer uptake and histologically derived data. Statistical calculations and graphical displays were performed with Prism 4.03 (GraphPad Software, USA).
Results
Tumor growth was assessed on T2w-MRI scans. In the CNSL model (n=9), the tumor volume was 22.6 ± 3.0 mm3, 89.2 ± 8.5 mm3 and 368.4 ± 38.6 mm3 at days 7, 13 and 20, respectively, after inoculation. In accordance with previous reports [42-44], the resulted large-size tumors showed also diffusion of tumoral cells along the needle entry track, the corpus callosum into the contralateral hemisphere, as well as common infiltration into the subdural space and in the lining of ventricles, making it difficult to correctly define tumor edges on MRI scans. Clinical signs of suffering such as reduction of mobility and weight loss (up to 20%) began to be visible in 3/9 rats at the end of the study, requiring immediate euthanasia at day 21. The growth of the GBM model was assessed once at day 13 (34.6 ± 10.1 mm3), since experience-based information was provided from a former study [37]. In contrast to the lymphoma model, U87-MG cells grew to form a compact well-defined tumor mass, easily delineable on MRI from surrounding tissue.
PET TACs revealed a differential response of [18F]FDB in the lymphoma model (n=5) between tumoral and reference (cerebellum) tissues with average TBR varying from 2.45 ± 0.39 to 3.16 ± 0.57 between 2 to 90 min post-injection (Figure S2A). In contrast, [18F]FDG demonstrated similar uptake profiles for tumoral and normal regions with TBR varying from 0.84 ± 0.17 to 1.06 ± 0.48 over the same period (Figure S2B). In the GBM model (n=4), the average TBRs were from 2.14 ± 0.39 to 1.10 ± 0.25 for [18F]FDB and from 0.95 ± 0.10 to 1.65 ± 0.50 for [18F]FDG (Figure S2). Therefore, inter-model comparisons performed for a fixed period of acquisition time (40-60 min) showed significantly divergent responses (p < 0.01) of [18F]FDB between CNSL (TBR 3.05 ± 0.80, n = 9 rats, total n = 11 scans, where n=3 are early scans (day 14)) and GBM (TBR 1.07 ± 0.19, n = 4), while [18F]FDG demonstrated overlap (p=0.04) between the groups (CNSL 0.99 ± 0.18, n = 5 and GBM 1.41 ± 0.15, n = 4) (Figure 2A-B). The pairwise comparisons performed within the CNSL model (n=5) revealed that, considering the absolute quantification with SUVmax, [18F]FDG (3.36 ± 0.90) has a considerably higher uptake than [18F]FDB (1.13 ± 0.40). However, the TBR was significantly greater (p < 0.01) with [18F]FDB (3.25 ± 1.17) when compared to glucose analogue (0.98 ± 0.18) (Figure 2C). These results can also be observed qualitatively (Figure 3). Note: cerebellum was CD79 negative and taken as reference tissue in the TBR calculation.
Quantitative PET data of inter- and intra-model analysis. Radiotracer uptake (average 40-60 min) expressed as tumor-to-background ratio (TBR) for (A) [18F]FDB (combined results from two examinations: days 14 and 21) and (B) [18F]FDG. Horizontal lines indicate the median. Mean ± SD of TBR is indicated for each group and per radiotracer. ** p < 0.01, * p < 0.05 Mann Whitney test. (C) Comparative inter-tracer analysis in the CNSL model; the paired samples are connected with lines. ** p < 0.01 paired t-test. See Method 1 in Supplementary Material for data quantification.
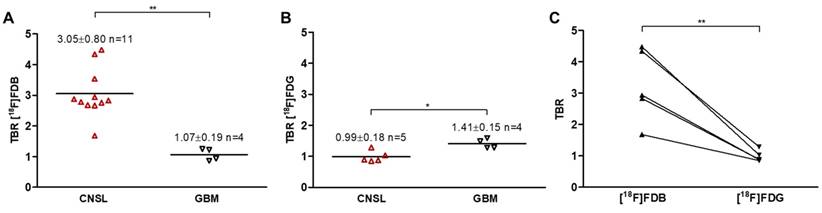
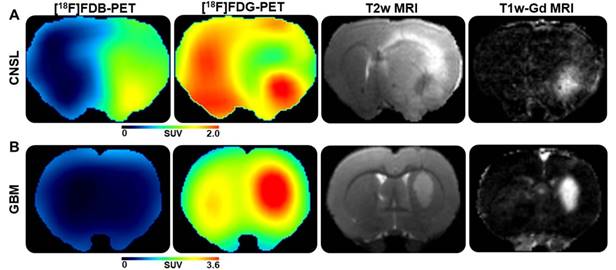
Illustrations of representative PET and MRI scans. From left to right, corresponding planes of [18F]FDB-, [18F]FDG-PET (acquisition time 40-60 min), T2w- and T1w(Gd)-MRI (subtracted image resulting from post- minus pre-contrast frame) scans for the (A) CNSL and (B) GBM models.
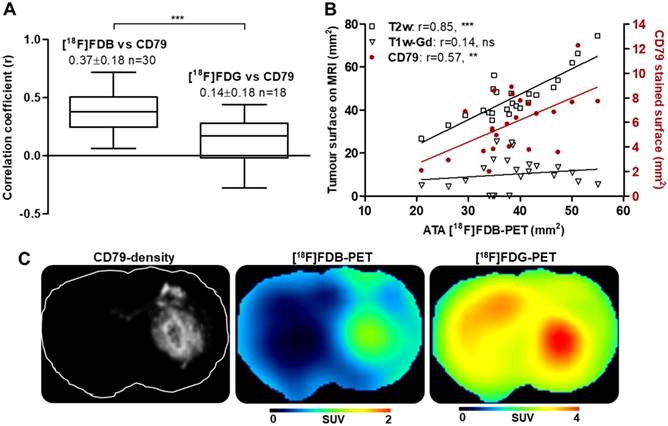
To address the issue of radiotracer specificity for CNSL, we determined the relationship between PET activity and quantitative values (CD79 staining density) extracted from corresponding histological images (Figure S3). The correlation coefficients obtained with entire-section analysis were significantly greater with [18F]FDB (0.37 ± 0.18, n=30) when compared to [18F]FDG (0.14 ± 0.18, n = 18) (Figure 4A, C) for both unpaired (p < 0.001) and paired (p < 0.0001, n = 17) samples. When considering the analysis in a restricted zone of the same sections including only the dense tumoral area, the correlation coefficients were also in favor of [18F]FDB (0.37 ± 0.16) compared to [18F]FDG (0.13 ± 0.30) with both unpaired (p < 0.01) and paired (p < 0.001) tests (data not shown). We have also investigated the relationship between the active tumoral area (ATA) defined on [18F]FDB-PET and the tumoral surface stained with CD79, which revealed a statistically significant positive correlation (r = 0.57, p < 0.01) (Figure 4B). Additionally, the ATA defined on [18F]FDB-PET correlated well with the tumoral area delineated on the corresponding planes of T2w-MRI (r = 0.85, p < 0.0001); no correlation was observed with the Gd-positive area on T1w-MRI (r = 0.14, p = 0.5). Finally, the supplemental analysis with regard to [18F]FDB uptake and Gd incorporation into the CD79-positive zones revealed that [18F]FDB demonstrated differential uptake (p<0.01) as a function of the CD79 density level (central tumor, peripheral tumor and normal tissue, Figure S4A, D), whereas the Gd accumulated mainly in the core of the tumor (Figure S4E). The inflammatory cell density, evaluated with CD68 staining, was significantly elevated in the tumor core when compared to surrounding tumoral and normal areas, whereas the vascular density, evaluated with RECA staining, was comparable in central and peripheral areas of tumor while being increased compared to normal regions (Figure S4B-C).
PET and histological data. (A) Correlation of static analysis of the PET radiotracer uptake (average 40-60 min) and the density of CD79 staining; *** p < 0.001 t-test. (B) Relationship (Pearson's correlation r) between [18F]FDB-avid surface (active tumor area, ATA), MRI measurements and CD79-stained surface. *** p < 0.001, ** p < 0.01, ns p > 0.05. See Method 2 for (A) and Method 3 for (B) in Supplementary Material for data quantification. (C) From left to right, CD79-density image and the corresponding planes of [18F]FDB, [18F]FDG (acquisition time 40-60 min).
Discussion
CNSL represents a rare disease with a poor and heterogeneous diagnosis. Neuroimaging plays a key role in brain tumor detection, in particular cranial MRI with gadolinium contrast enhancement and [18F]FDG-PET. Nevertheless, all these techniques are not specific enough and could lead to misinterpretation of findings. The differentiation between CNSL and high-grade glioma (e.g., GBM) with MRI can be sometimes equivocal due to their similar imaging appearances. [18F]FDG-PET, which is considered as a reference radiopharmaceutical in several CNS disorders for staging and therapeutic monitoring, has a major disadvantage of having strong uptake in healthy brain tissue and in some cases does not have the ability to discriminate normal tissue and tumoral lesion. Moreover, in atypical imaging findings of CNS tumors, neither contrast-enhanced MRI nor [18F]FDG-PET are sufficiently sensitive. In all cases, brain biopsy is required before treatment for confirmation of diagnosis given that each CNS disorder has a specific treatment. However, it may sometimes be clinically impossible to reach the lesion due to its location (e.g., near critical areas of the brain).
In the present study, we hypothesized that [18F]FDB-PET, which was reported to show great potential for extra-cerebral lymphoma imaging [31-35], could ensure an uncritical diagnosis of CNSL according to our former findings: high specificity for lymphoma, marked contrast between tumoral and healthy tissues, lack of physiological uptake in normal cerebral tissue. Here, multimodal comparative analyses were performed to address the specificity of [18F]FDB uptake in a lymphoma model and to demonstrate its superiority (if so) over [18F]FDG in detecting/differentiating brain tumors. MRI and histology were also considered for tumor visualization and characterization.
Nude rats were intracerebrally injected with MC116 human B-cells for the lymphoma model or with U87 human glioma cells for the malignant GBM model. The CNSL model was adapted from a former study where the rats were intraperitoneally injected with cyclophosphamide treatment prior to and two weeks after MC116 cell inoculation to ensure reproducible tumor growth throughout the study period [38,43]. This model of CNSL results in tumors of infiltrative phenotype [42-44], which closely imitates disseminated lesions often referred as atypical CNSL in clinical studies. The GBM model, based on local knowledge for reproducible growth, forms compact tumors [37,40].
PET imaging days were determined by considering the tumor growth defined by MRI, mainly based on T1w-Gd tumor volumetric, which is supposed to represent the active part of the tumor with BBB damage. 3/9 rats were scanned with [18F]FDB-PET at day 14 for a feasibility test and revealed small tumors with sufficiently high TBR values. The tumors continued to grow and were imaged one week later where the scanned lesions had diameters larger than about 2-3 times the resolution of the system, considered the smallest volume to obtain full radioactivity recovery [45]. Histological examinations were conducted ex-vivo immediately after the last PET scan and confirmed the infiltrative aspect of the CNSL model, indicating also the presence of cancerous cells in the contralateral side. Therefore, cerebellar tissue (CD79 negative) was set as reference in TBR calculations on PET scans.
The PET and MRI scans were acquired with minimum intervals, set as short as technically possible (Figure 1). The resulting multimodal dataset, including PET, MRI and histology, was used for comparative analyses. For this, several approaches to PET quantification were investigated to consider the results across modalities. The most complex was the tile-based method (Figure S3), which allows pixel-wise analysis and needs sufficient spatial co-registration and optimal image quality [41]; this approach enabled enumeration of cells of interest on immunohistochemistry images and comparison of the data obtained at the cellular level with macroscopic features extracted from PET.
[18F]FDB TACs (presented as tumor to cerebellum ratio) revealed a divergent response between the CNSL and GBM models—the radiotracer showed marked retention in lymphoma whereas a rapid clearance from GBM—with up to 5-fold increased TBRs for the lymphoma model (Figure 2A-B); in contrast, [18F]FDG TBR curves overlapped along 90 min of acquisition. Therefore, the better inter-model differentiation with [18F]FDB-PET was quite evident. Indeed, the mechanism of incorporation of [18F]FDB into CNSL and GBM should well be similar, as both cells are known to express ENT proteins [46,47]. The selective uptake of this radiotracer for CNSL is due to its dCK-related retention mechanism, as the activity of this enzyme is elevated in lymphoid malignancies [23,24]. It is also worth noting that the lack of [18F]FDB uptake in GBM, whose growth is associated with marked inflammation [40], confirms the results of our former study suggesting that [18F]FDB uptake is not biased by activated macrophages and other inflammatory cells leading generally to false positive PET interpretations, which are often the case with [18F]FDG [34]. Moreover, in two investigated sham-operated rats, [18F]FDB did not show signal in post-surgery/injury tissues, thus emphasizing its specific lymphoma-restricted uptake. Finally, it is arguable that the uptake of [18F]FDG in the CNSL model, where the histology revealed elevated expression of CD68 in the tumor core (Figure S4B), could well be impacted by the presence of inflammatory cells.
Although the absolute SUV value was considerably higher for [18F]FDG in the CNSL model, the target to background ratio was significantly elevated for [18F]FDB (p < 0.01), permitting specific imaging of lymphoma (Figure 2C and Figure 3). For 2/5 MC116 model rats, [18F]FDG showed focal uptake in the tumor core (which was however not substantially different from that of the brain normal tissue) surrounded by tumoral zones (CD79 positive) with an uptake inferior to physiological tissue (Figure 3A). The reduced [18F]FDG uptake is a known issue in oncology [48,49]. This phenomenon has been explained by inactivation in neuronal tissue, including suppression of glucose uptake in gray-matter adjacent to tumor, which may generate false-negative PET results [50,51]. In the rest of the CNSL rats, the [18F]FDG signal was not or hardly detectable with regard to tumor edge definition. Moreover, to delineate the [18F]FDB-avid ATA in CNSL tumors, an isocontouring based on a fixed threshold of 41% of the maximum activity was used, producing satisfactory results of segmentation for all [18F]FDB-PET images, as a result of sufficiently high tumor to background (brain normal tissue) contrast. This automatic segmentation was not applicable for [18F]FDG.
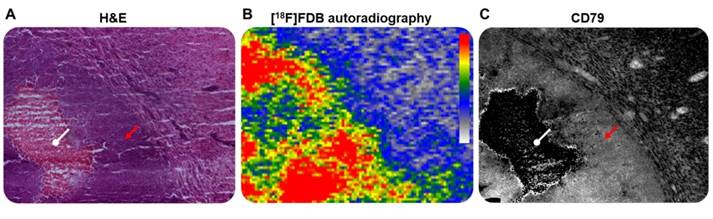
The correlation between PET activity and histological observations, obtained by tile-based analysis, permitted us to establish a considerably stronger relationship (p < 0.01) between [18F]FDB uptake and CD79 expression density, when compared to [18F]FDG (Figure 4A); this emphasizes the highly specific uptake of [18F]FDB for lymphoid cells. [18F]FDB-autoradiographic signal showed relatively overlapping features with CD79-stained regions (Figure 5). Furthermore, the tumor [18F]FDB-avid area (ATA) well correlated with the CD79-marked surface of malignant cells and the tumor size measurement obtained on T2w-MRI (Figure 4B). In contrast, no relationship was observed between the ATA and the area of gadolinium enhancement on T1w-MRI, the [18F]FDB signal being visible in regions with no gadolinium incorporation. Indeed, contrast-enhanced MRI is considered to underestimate the tumor burden, especially in areas with microscopic tumor infiltration [19,52].
Representative microscopic (x 100 magnification) and macroscopic illustrations of CNSL. (A) H&E staining and (B) ex-vivo [18F]FDB autoradiography of the same tumor section and (C) CD79b staining of an adjacent section. Red arrow: lymphoid cells; white arrow: necrotic area.
It is worthy to note that malignant brain tumors are mostly diagnosed when the tumors have reached a certain size with breakdown of the BBB; indeed, the early stages are not easily detectable on contrast-enhanced MRI due to lack of contrast agent incorporation. However, it is considered that the BBB permeability is proportional to gadolinium concentration or its efflux rate measured in the tumoral zone. In this study, [18F]FDB uptake showed differential responses within different CD79-density levels, categorized into high (99%), intermediate (27%) and low (1.5%, background normal tissue) groups, whereas the gadolinium concentrated predominantly in the core (high density zone) of the tumor (Figure S4). Therefore, an assumption was made that [18F]FDB might be less sensitive to the degree of BBB permeability and could probably detect the tumoral regions with low BBB leakage. However, it should be noted that our observations are from basic analysis and could be criticized for their elementary approach. The potential relationship between [18F]FDB uptake and BBB permeability should be further explored to confirm the hypothesis formulated above.
Conclusion
The potential of [18F]FDB-PET to distinguish CNSL from GBM is quite evident and will be further investigated. Moreover, these encouraging findings allow us to introduce [18F]FDB-PET as a possible approach for accurate imaging of CNSL and thus avoid delayed diagnosis and treatment. Nevertheless, more investigations are required to extend this conclusion to humans. The clinical use of [18F]FDB could therefore be focused on issues such as detection and differentiation of disease, as well as target volume delineation in radiation therapy. Finally, its ability to differentiate responder and non-responder CNSL patients to a nucleoside analogue chemotherapy and its utility in evaluating response to therapy are worth being investigated in future studies.
Abbreviations
ATA: active tumor area; ATCC: american type culture collection; BSA: bovine serum albumin; CNSL: central nervous system lymphoma; [18F]CFA: [18F]clofarabine; CT: computed tomography; dCK: deoxycytidine kinase; [18F]FAC: 2'-deoxy-2'-[18F]fluoro-β-D-arabinofuranosylcytosine; DLBCL: diffuse large B-cell lymphoma; ENT: equilibrative nucleoside transporters; FLASH: fast low angle shot; [18F]FDB: [18F]fludarabine; [18F]FDG: [18F]fluorodeoxyglucose; Gd: gadolinium; GBM: glioblastoma; MRI: magnetic resonance imaging; PBS: phosphate-buffered saline; PET: positron emission tomography; RARE: rapid acquisition with refocused echoes; SUV: standardized uptake value; TAC: time-activity curve; TBR: tumor-to-background ratio.
Supplementary Material
Supplementary methods and figures.
Acknowledgements
The authors gratefully acknowledge Martine Dhilly for valuable contribution to this study, Brigitte Sola for MC116 cell culture and Olivier Tirel for providing fluorine-18.
Source of funding
This study was supported by a grant from Commissariat à l'Energie Atomique et aux Energies Alternatives (CEA), the French National Agency for Research (ANR-11 LABEX-0018-01) and the Region Basse-Normandie.
Competing Interests
The authors have declared that no competing interest exists.
References
1. Rubenstein J, Ferreri AJM, Pittaluga S. Primary lymphoma of the central nervous system: epidemiology, pathology and current approaches to diagnosis, prognosis and treatment. Leuk Lymphoma. 2008;49(Suppl 1):S43-51
2. Hoang-Xuan K, Bessell E, Bromberg J, Hottinger AF, Preusser M, Rudà R. et al. Diagnosis and treatment of primary CNS lymphoma in immunocompetent patients: guidelines from the european association for neuro-oncology. Lancet Oncol. 2015;16:e322-32
3. Baraniskin A, Deckert M, Schulte-Altedorneburg G, Schlegel U, Schroers R. Current strategies in the diagnosis of diffuse large B-cell lymphoma of the central nervous system. Br J Haematol. 2012;156:421-32
4. Haldorsen IS, Krakenes J, Krossnes BK, Mella O, Espeland A. CT and MR imaging features of primary central nervous system lymphoma in norway, 1989-2003. Am J Neuroradiol. 2009;30:744-51
5. Ma JH, Kim HS, Rim N-J, Kim S-H, Cho K-G. Differentiation among glioblastoma multiforme, solitary metastatic tumor, and lymphoma using whole-tumor histogram analysis of the normalized cerebral blood volume in enhancing and perienhancing lesions. Am J Neuroradiol. 2010;31:1699-706
6. Zou Y, Tong J, Leng H, Jiang J, Pan M, Chen Z. Diagnostic value of using 18F-FDG PET and PET/CT in immunocompetent patients with primary central nervous system lymphoma: a systematic review and meta-analysis. Oncotarget. 2017;8:41518-28
7. Partovi S, Karimi S, Lyo JK, Esmaeili A, Tan J, Deangelis LM. Multimodality imaging of primary CNS lymphoma in immunocompetent patients. Br J Radiol. 2014;87:20130684
8. Küker W, Nägele T, Korfel A, Heckl S, Thiel E, Bamberg M. et al. Primary central nervous system lymphomas (PCNSL): MRI features at presentation in 100 patients. J Neurooncol. 2005;72:169-77
9. Barrington S, Blower P, Cook G. New horizons in multimodality molecular imaging and novel radiotracers. Clin Med. 2017;17:444-8
10. Hustinx R, Fosse P. PET in brain tumors. PET Clin. 2010;5:185-97
11. Yamashita K, Yoshiura T, Hiwatashi A, Togao O, Yoshimoto K, Suzuki SO. et al. Differentiating primary CNS lymphoma from glioblastoma multiforme: assessment using arterial spin labeling, diffusion-weighted imaging, and 18F-fluorodeoxyglucose positron emission tomography. Neuroradiology. 2013;55:135-43
12. Yamashita K, Hiwatashi A, Togao O, Kikuchi K, Kitamura Y, Mizoguchi M. et al. Diagnostic utility of intravoxel incoherent motion mr imaging in differentiating primary central nervous system lymphoma from glioblastoma multiforme: intravoxel incoherent motion MRI. J Magn Reson Imaging. 2016;44:1256-61
13. Long NM, Smith CS. Causes and imaging features of false positives and false negatives on 18F-PET/CT in oncologic imaging. Insights imaging. 2011;2:679-98
14. Adams HJA, Kwee TC. Fact sheet about interim and end-of-treatment 18F-FDG PET/CT in lymphoma. J Nucl Med. 2017;58:1178-9
15. Kawai N, Miyake K, Okada M, Yamamoto Y, Nishiyama Y, Tamiya T. Usefulness and limitation of FDG-PET in the diagnosis of primary central nervous system lymphoma. No Shinkei Geka. 2013;41:117-26
16. Okada Y, Nihashi T, Fujii M, Kato K, Okochi Y, Ando Y. et al. Differentiation of newly diagnosed glioblastoma multiforme and intracranial diffuse large B-cell lymphoma using 11C-methionine and 18F-FDG PET. Clin Nucl Med. 2012;37:843-9
17. Kawase Y, Yamamoto Y, Kameyama R, Kawai N, Kudomi N, Nishiyama Y. Comparison of 11C-methionine PET and 18F-FDG PET in patients with primary central nervous system lymphoma. Mol Imaging Biol. 2011;13:1284-9
18. Kawai N, Okubo S, Miyake K, Maeda Y, Yamamoto Y, Nishiyama Y. et al. Use of PET in the diagnosis of primary CNS lymphoma in patients with atypical MR findings. Ann Nucl Med. 2010;24:335-43
19. Haldorsen IS, Espeland A, Larsson E-M. Central nervous system lymphoma: characteristic findings on traditional and advanced imaging. Am J Neuroradiol. 2011;32:984-92
20. Dunet V, Pomoni A, Hottinger A, Nicod-Lalonde M, Prior JO. Performance of 18F-FET versus 18F-FDG-PET for the diagnosis and grading of brain tumors: systematic review and meta-analysis. Neuro-Oncol. 2016;18:426-34
21. Collet S, Valable S, Constans JM, Lechapt-Zalcman E, Roussel S, Delcroix N. et al. [(18)F]-fluoro-L-thymidine PET and advanced MRI for preoperative grading of gliomas. NeuroImage Clin. 2015;8:448-54
22. Filss CP, Cicone F, Shah NJ, Galldiks N, Langen K-J. Amino acid PET and MR perfusion imaging in brain tumours. Clin Transl Imaging. 2017;5:209-23
23. Gandhi V, Plunkett W. Cellular and clinical pharmacology of fludarabine. Clin Pharmacokinet. 2002;41:93-103
24. Fidias P, Chabner BA, Grossbard ML. Purine analogs for the treatment of low-grade lymphoproliferative disorders. The Oncologist. 1996;1:125-39
25. Shu CJ, Campbell DO, Lee JT, Tran AQ, Wengrod JC, Witte ON. et al. Novel PET probes specific for deoxycytidine kinase. J Nucl Med. 2010;51:1092-8
26. Eriksson S, Arnér E, Spasokoukotskaja T, Wang L, Karlsson A, Brosjö O. et al. Properties and levels of deoxynucleoside kinases in normal and tumor cells; implications for chemotherapy. Adv Enzyme Regul. 1994;34:13-25
27. Nair-Gill E, Wiltzius SM, Wei XX, Cheng D, Riedinger M, Radu CG. et al. PET probes for distinct metabolic pathways have different cell specificities during immune responses in mice. J Clin Invest. 2010;120:2005-15
28. Antonios JP, Soto H, Everson RG, Moughon DL, Wang AC, Orpilla J. et al. Detection of immune responses after immunotherapy in glioblastoma using PET and MRI. Proc Natl Acad Sci. 2017;114:10220-5
29. Lenz G, Hiddemann W, Dreyling M. The role of fludarabine in the treatment of follicular and mantle cell lymphoma. Cancer. 2004;101:883-93
30. Guillouet S, Patin D, Tirel O, Delamare J, Gourand F, Deloye JB. et al. Fully automated radiosynthesis of 2-[18F]fludarabine for PET imaging of low-grade lymphoma. Mol Imaging Biol. 2014;16:28-35
31. Dhilly M, Guillouet S, Patin D, Fillesoye F, Abbas A, Gourand F. et al. 2-[18F]fludarabine, a novel positron emission tomography (PET) tracer for imaging lymphoma: a micro-PET study in murine models. Mol Imaging Biol. 2014;16:118-26
32. Hovhannisyan N, Guillouet S, Fillesoye F, Dhilly M, Patin D, Galateau F. et al. Evaluation of the specificity of [18F]fludarabine PET/CT in a xenograft model of follicular lymphoma: comparison with [18F]FDG and impact of rituximab therapy. EJNMMI Res. 2015;5:23
33. Hovhannisyan N, Dhilly M, Fidalgo M, Fillesoye F, Guillouet S, Sola B. et al. [18F]Fludarabine-PET in a murine model of multiple myeloma. PloS One. 2017;12:e0177125
34. Hovhannisyan N, Dhilly M, Guillouet S, Leporrier M, Barré L. Comparative analysis between [18F]fludarabine-PET and [18F]FDG-PET in a murine model of inflammation. Mol Pharm. 2016;13:2136-9
35. Chantepie S, Hovhannisyan N, Guillouet S, Pelage J-P, Ibazizene M, Bodet-Milin C. et al. 18 F-Fludarabine-PET for lymphoma imaging: first-in-man study in DLBCL and CLL patients. J Nucl Med. 2018 [Epub ahead of print]
36. Kilkenny C, Browne W, Cuthill IC, Emerson M, Altman DG. Animal research: reporting in vivo experiments: the ARRIVE guidelines. Br J Pharmacol. 2010;160:1577-9
37. Corroyer-Dulmont A, Pérès EA, Petit E, Guillamo J-S, Varoqueaux N, Roussel S. et al. Detection of glioblastoma response to temozolomide combined with bevacizumab based on µMRI and µPET imaging reveals [18F]-fluoro-l-thymidine as an early and robust predictive marker for treatment efficacy. Neuro-Oncol. 2013;15:41-56
38. Wu YJ, Muldoon LL, Dickey DT, Lewin SJ, Varallyay CG, Neuwelt EA. Cyclophosphamide enhances human tumor growth in nude rat xenografted tumor Models. Neoplasia N Y N. 2009;11:187-95
39. Lasnon C, Dugue AE, Briand M, Blanc-Fournier C, Dutoit S, Louis M. et al. NEMA NU 4-optimized reconstructions for therapy assessment in cancer research with the Inveon small animal PET/CT System. Mol Imaging Biol. 2015;17:403-12
40. Leblond MM, Gérault AN, Corroyer-Dulmont A, MacKenzie ET, Petit E, Bernaudin M. et al. Hypoxia induces macrophage polarization and re-education toward an M2 phenotype in U87 and U251 glioblastoma models. OncoImmunology. 2016;5:e1056442
41. Plancoulaine B, Laurinaviciene A, Herlin P, Besusparis J, Meskauskas R, Baltrusaityte I. et al. A methodology for comprehensive breast cancer Ki67 labeling index with intra-tumor heterogeneity appraisal based on hexagonal tiling of digital image analysis data. Virchows Arch. 2015;467:711-22
42. Soussain C, Muldoon LL, Varallyay C, Jahnke K, DePaula L, Neuwelt EA. Characterization and magnetic resonance imaging of a rat model of human B-cell central nervous system lymphoma. Clin Cancer Res. 2007;13:2504-11
43. Muldoon LL, Lewin SJ, Dosa E, Kraemer DF, Pagel MA, Doolittle ND. et al. Imaging and therapy with rituximab anti-CD20 immunotherapy in an animal model of central nervous system lymphoma. Clin Cancer Res. 2011;17:2207-15
44. Jahnke K, Muldoon LL, Varallyay CG, Lewin SJ, Brown RD, Kraemer DF. et al. Efficacy and MRI of rituximab and methotrexate treatment in a nude rat model of CNS lymphoma. Neuro-Oncol. 2009;11:503-13
45. Soret M, Bacharach SL, Buvat I. Partial-volume effect in PET tumor imaging. J Nucl Med. 2007;48:932-45
46. Pastor-Anglada M, Pérez-Torras S. Nucleoside transporter proteins as biomarkers of drug responsiveness and drug targets. Front Pharmacol. 2015;6:13
47. Sinclair CJ, LaRivière CG, Young JD, Cass CE, Baldwin SA, Parkinson FE. Purine uptake and release in rat C6 glioma cells: nucleoside transport and purine metabolism under ATP-depleting conditions. J Neurochem. 2000;75:1528-38
48. Derlon JM, Chapon F, Noel MH, Khouri S, Benali K, Petit-Taboue MC. et al. Non-invasive grading of oligodendrogliomas: correlations between in vivo metabolic pattern and histopathology. Eur J Nucl Med. 2000;27:778-87
49. Adams HJA, Kwee TC. The need for prudence when using 18 F-FDG PET as a reference standard for lymphoma detection. J Nucl Med. 2017;58:1354-5
50. Viel T, Talasila KM, Monfared P, Wang J, Jikeli JF, Waerzeggers Y. et al. Analysis of the growth dynamics of angiogenesis-dependent and -independent experimental glioblastomas by multimodal small-animal PET and MRI. J Nucl Med. 2012;53:1135-45
51. DeLaPaz RL, Patronas NJ, Brooks RA, Smith BH, Kornblith PL, Milam H. et al. Positron emission tomographic study of suppression of gray-matter glucose utilization by brain tumors. Am J Neuroradiol. 1983;4:826-9
52. Lai R, Rosenblum MK, DeAngelis LM. Primary CNS lymphoma: a whole-brain disease? Neurology. 2002;59:1557-62
Author contact
![]() Corresponding author: Louisa Barré, ISTCT, LDM-TEP group, GIP Cyceron, Bd Henri Becquerel, BP 5229, 14074 Caen Cedex 5, France. Phone: (33)231470224; fax: (33)231470275; e-mail address: barrefr
Corresponding author: Louisa Barré, ISTCT, LDM-TEP group, GIP Cyceron, Bd Henri Becquerel, BP 5229, 14074 Caen Cedex 5, France. Phone: (33)231470224; fax: (33)231470275; e-mail address: barrefr