Impact Factor
- Issue 14; 2026
- Issue 13; 2026
- Issue 12; 2026
- Issue 11; 2026
- Issue 10; 2026
- Volume 16; 2026
- Advance Articles
- Past Issues
- Cover Images
- Cover Suggestion
- Index & Coverage
- Special Issues
Introduction
Materials and Methods
Results
Discussion
Supplementary Material
Acknowledgements
References
International Journal of Biological Sciences
International Journal of Medical Sciences
 Global reach, higher impact

Theranostics 2019; 9(4):986-1000. doi:10.7150/thno.30199 This issue Cite
Research Paper
Collaborative ISL1/GATA3 interaction in controlling neuroblastoma oncogenic pathways overlapping with but distinct from MYCN
Qitong Zhang1*, Qingquan Zhang1*, Xue Jiang1, Youqiong Ye2, Huimin Liao1, Fugui Zhu2, Jie Yan1, Lina Luo1, Li Tian3, Cizhong Jiang2, Yihan Chen1, Xingqun Liang1, ![]() , Yunfu Sun1,
, Yunfu Sun1, ![]()
1. Key Laboratory of Arrhythmia, Ministry of Education, East Hospital, Tongji University School of Medicine, Shanghai, China.
2. School of Life Sciences and Technology, Tongji University, Shanghai, China.
3. Institute of Biomedicine and Translational Medicine, Department of Physiology, University of Tartu, Tartu 50411, ESTONIA
* These authors contributed equally to this work
Received 2018-9-25; Accepted 2019-1-14; Published 2019-1-30
Abstract

Background: Transcription factor ISL1 plays a critical role in sympathetic neurogenesis. Expression of ISL1 has been associated with neuroblastoma, a pediatric tumor derived from sympatho-adrenal progenitors, however the role of ISL1 in neuroblastoma remains unexplored.
Method: Here, we knocked down ISL1 (KD) in SH-SY5Y neuroblastoma cells and performed RNA-seq and ISL1 ChIP-seq analyses.
Results: Analyses of these data revealed that ISL1 acts upstream of multiple oncogenic genes and pathways essential for neuroblastoma proliferation and differentiation, including LMO1 and LIN28B. ISL1 promotes expression of a number of cell cycle associated genes, but represses differentiation associated genes including RA receptors and the downstream target genes EPAS1 and CDKN1A. Consequently, Knockdown of ISL1 inhibits neuroblastoma cell proliferation and migration in vitro and impedes tumor growth in vivo, and enhances neuronal differentiation by RA treatment. Furthermore, genome-wide mapping revealed a substantial co-occupancy of binding regions by ISL1 and GATA3, and ISL1 physically interacts with GATA3, and together they synergistically regulate the aforementioned oncogenic pathways. In addition, analyses of the roles of ISL1 and MYCN in MYCN-amplified and MYCN non-amplified neuroblastoma cells revealed an epistatic relationship between ISL1 and MYCN. ISL1 and MYCN function in parallel to regulate common yet distinct oncogenic pathways in neuroblastoma.
Conclusion: Our study has demonstrated that ISL1 plays an essential role in neuroblastoma regulatory networks and may serve as a potential therapeutic target in neuroblastoma.
Keywords: neuroblastoma, ISL1, GATA3, RA signaling, genetic pathways
Introduction
Neuroblastoma is the most common childhood malignancy, accounting for 15% of pediatric tumor-related deaths [1, 2]. Neuroblastoma presents variable clinical outcomes from fatal progression to spontaneous differentiation and regression, however, underlying molecular mechanisms remain unclear. Despite tailored treatment approaches have been used for decades, long-term survival in high-risk patients is lower than 50% [3]. Thus, a better understanding of the mechanisms underlying neuroblastoma pathogenesis is essential to development of effective and novel therapies.
Neuroblastoma is highly heterogeneous and its etiology remains largely unknown. When compared to adult solid tumors, only a paucity of somatic gene mutations in neuroblastoma have been identified [1]. MYCN amplification is present in ~20% human neuroblastoma and is associated with a poor prognosis [2]. Overexpression of MYCN in neural crest is sufficient to cause neuroblastoma in transgenic mice, while knockdown of MYCN in neuroblastoma cells induces differentiation and apoptosis [4-7]. ALK mutations have been identified in familial and sporadic neuroblastoma, leading to increased or constitutively active ALK and increased neuroblastoma proliferation [8-11]. Activated ALK collaborates with MYCN in neuroblastoma pathogenesis by inhibiting sympatho-adrenal progenitor cell death [12]. Recent genome-wide association studies (GWAS) have identified a number of neuroblastoma susceptibility genes, including LIN28B, LMO1 and BARD1 [4, 13]. Overexpression of the RNA binding protein LIN28B has been observed in high-risk neuroblastoma [14]. LIN28B acts through repression of let-7 miRNAs, resulting in increased MYCN and AURKA protein expression in neuroblastoma cells [14]. AURKA was a direct let-7 target and AURKA stabilizes MYCN at the protein level [15]. Overexpression of LIN28B in transgenic mouse model induces neuroblastoma [14]. LMO1 is an oncogene associated with high-risk neuroblastoma and it is required for neuroblastoma proliferation [16]. Overexpression of LMO1 in zebrafish synergizes with MYCN to promote neuroblastoma development and metastasis [17].
Neuroblastoma is derived from sympatho-adrenal progenitors. Dysregulation of sympathetic developmental program has been implicated in neuroblastoma tumorigenesis [1, 18]. Early sympathetic neurogenesis is regulated by a network of transcription factors, such as PHOX2B, MASH1, HAND2, GATA2/3, INSM1 and ISL1 [19]. Mutations of PHOX2B have been found in ~80% hereditary neuroblastoma [1, 13, 19-21]. GATA3 is overexpressed in neuroblastoma and plays an important role in neuroblastoma proliferation and differentiation [22]. Recently, a polymorphism within a LMO1 superenhancer that preserves a consensus GATA factor binding site predisposes the individual to neuroblastoma [23]. GATA3 knockdown leads to decreased LMO1 expression and reduced neuroblastoma growth [23]. INSM1 is expressed in sympatho-adrenal precursors and required for sympathetic proliferation and differentiation [24]. In MYCN amplified neuroblastoma cells, MYCN induces aberrant expression of INSM1, which in turn suppresses MYCN phosphorylation and degradation and facilitates oncogenesis of neuroblastoma [25]. Analysis of neuroblastoma superenhancers and associated regulatory factors has uncovered core transcriptional circuitries that define three types of neuroblastoma cell identity. Of these, a sympathetic noradrenergic identity is defined by a core transcriptional module including the PHOX2B, GATA3 and HAND2 [26].
LIM-homeodomain transcription factor ISL1 is expressed in sympathetic neurons immediately after their differentiation and plays a crucial role in sympathetic neuron development [27]. ISL1 directly or indirectly regulates distinct temporal gene expression programs required for sympathetic neuronal proliferation and differentiation [28, 29]. Notably, a number of genes modulated by ISL1 during early sympathetic neurogenesis are involved in neuroblastoma tumorigenesis, such as ALK, LIN28B, LMO1, GATA3 and PROX1 [28]. Expression of ISL1 has been associated with neuroblastoma, especially undifferentiated neuroblastoma [21, 30], however, the role of ISL1 in neuroblastoma remains unexplored. Here, we found ISL1 plays a critical role in neuroblastoma pathogenesis, acting upstream of multiple neuroblastoma oncogenic pathways. ISL1 physically interacts with GATA3, and together they bind to and synergistically regulate genes essential for neuroblastoma proliferation and differentiation. In addition, ISL1 and MYCN function in parallel to control common yet distinct gene regulatory programs in neuroblastoma.
Materials and Methods
Cell culture and treatment
SH-SY5Y and SK-N-BE(2) cell lines were gifted by Dr. Zhen Zhang's lab (Shanghai Pediatric Congenital Heart Disease Institute, Shanghai Children's Medical Center, School of Medicine, Shanghai Jiaotong University) [31], and authenticated by Cell Bank/Stem Cell Bank, The Committee of Type Culture Collection of Chinese Academy of Sciences. Cells cultured as described [32] in RPMI 1640 medium (GIBCO, ThermoFisher, MA, USA) with 10% heat-inactivated Fetal Bovine Serum (FBS) (GIBCO) and 100 U/ml of penicillin/streptomycin (GIBCO). To induce differentiation, cells were cultured in DMEM (GIBCO) with 1% FBS and retinoic acid (RA, Sigma-Aldrich, Merck, Darmstadt, Germany) at a final concentration of 1µm (SH-SY5Y) to 10µm (SK-N-BE(2)).
To assess cell proliferation, Click-iT™ EdU Alexa Fluor™ 594 Imaging Kit (C10339, Invitrogen, ThermoFisher, MA, USA) was used for EdU staining following manufactory's instruction. Percentage of EdU+ cells were counted and normalized to total DAPI+ cells. Results were obtained from five independent replicates, and representative figures were presented. For cell counting, cells from triplicate wells were counted six field per well, and six independent replicates were performed.
Colony formation assay was carried out as described [33]. Briefly, SH-SY5Y cells were added to the 6-well plates at 200 cells per well with 2 ml medium and cultured at 37°C for 2 weeks. Cells were fixed in 4% Paraformaldehyde (PFA), and stained with 0.1% Crystal Violet (C8470, Solarbio, Beijing, China). Total number of colonies per well were counted. Four independent replicates were performed.
To assess neurite outgrowth, cells were cultured with RA or DMSO for 3 days and fixed in 4% PFA. SH-SY5Y cells were stained with TUJ1 (ab18207, Abcam, MA, USA). Images were taken with Leica Microscopy and the length of longest neurite of individual cells was measured by Photoshop (three replicates, and around 100 cells (n) per group were analyzed).
Gene knockdown and overexpression
For gene knockdown by shRNAs, the corresponding short hairpin RNAs (shRNAs) were cloned into pLKO.1 vector (Plasmid # 10878, Addgene, MA, USA). Scramble shRNAs were used as control. For gene overexpression, the respective cDNAs were inserted into pcDNA3.1 (Invitrogen, ThermoFisher, MA, USA) or Fugw plasmids (Plasmid # 14883, Addgene). For lentivirus packaging, HEK293FT cells were co-transfected with constructed shRNA plasmids and packaging plasmids using the Fugene HD transfection reagent (Roche, Basel, Switzerland) according to manufacturer's recommendations. Culture supernatants were collected 48 hours later and used to infect the target cells. 48 hours after infection, Puromycin (2.0 μg /ml) was added for selection. For MYCN and EPAS1 knockdown with siRNAs, Lipofectamine RNAiMAX Transfection Reagent (3778030, Invitrogen) was used following the protocol. Sequence sets used for RNAi are listed in Table S6.
Transwell assay
Cells (2 × 10⁴cells) were starved in serum-free medium for 12 hours, and then placed on top chambers of 8 µm pore cell culture inserts (353097, FALCON, Corning, NY, USA) with serum-free medium. Lower chamber was filled with normal serum culture medium. After 24 hours, cells in the upper chamber were cleared with cotton swabs and remaining migrating cells were fixed and stained with 0.1% Crystal Violet (C8470, Solarbio, Beijing, China). Images were taken, and cells were counted. Data was presented as percentage of ISL1 KD versus control migrating cells (migration index). Five repeats were performed.
In vivo tumorigenicity
In vivo tumorigenic assays were performed using female NOD/SCID mice (NOD.CB17-Prkdc/NCrHsd, 8 weeks old purchased from SHANGHAI SLAC LABORATORY ANIMAL CO. LTD, Shanghai, China). Four mice per group were subcutaneously injected with 2× 10⁷ SH-SY5Y cells resuspended in 200 μl PBS into the left and right groin flank and injected mice were sacrificed at indicated time points. Tumor volume size was measured and calculated using the following equation: Volume = 0.5x length x width2. All animal experiments were performed according to the guidelines for the Care and Use of Laboratory Animals (Ministry of Health, China, 1998), and monitored by the Institutional Animal Care and Use Committee of Tongji University School of Medicine. Three independent repeats were performed.
Luciferase assay
Luciferase assay was performed with Dual-Luciferase® Reporter Assay System (Promega, WI, USA) following manufactory's instruction. Briefly, a 553 bp super enhancer fragment of LMO1 (hg19, chr11:8255155-8255707) [23] was cloned into the upstream of the promoter-Luc+ transcriptional unit of pGL3-promoter Vector (E1761, Promega). HEK293T cells were grown in 24-well plates and transfected with 0.2 μg pGL3-LMO1-luc and 0.01 μg Renilla luciferase vector (pRL-TK; Promega), together with amount of pcDNA3.1-ISL1 or -GATA3 or empty pcDNA3.1 plasmid (control) as indicated. 48 hours after transfection, transfected HEK293T cells were harvest and lysed for luciferase assays. Three independent experiments were performed.
Western blot and immunoprecipitation (IP)
For IP, HEK293T cells were transfected with plasmids encoding HA-ISL1 or Myc-GATA3. Neuroblastoma or transfected HEK293T cells were lysed with RIPA (10mM Tris-HCL, pH7.6, 1mM EGTA and EDTA, 0.1% SDS, 1% Triton X-100, 0.1% NA-Deoxycholate, 1× protease inhibitor cocktail (Roche Applied Science, IN, USA) and 1mM PMSF), cell lysates were subjected to immunoprecipitation using antibodies as indicated, and analyzed by Western Blot.
The following antibodies were used: anti-GATA3 (ab199428, Abcam), anti-ISL1 (ab109517, Abcam, MA, USA), anti-HA (ab9110, Abcam), rabbit normal IgG (Millipore, 12-370, Merck, Darmstadt, Germany), anti-Myc tag (ab32, Abcam) and anti-GAPDH (60004-1-Ig, Proteintech, IL, USA).
RNA-seq and q-PCR analyses
RNA-seq analysis was carried out as previously described [34]. All RNA-seq datasets were deposited into SRA database (http://www.ncbi.nlm.nih.gov/SRA/) under the accession code SRP159301. Briefly, cultured cells were collected, and total RNA was prepared using the RNeasy Mini kit (QIAGEN). RNA-seq libraries were constructed using SMARTer cDNA library construction kit (Clontech, Takara Bio, CA, USA) and sequenced on the BGISEQ-500 (BGI, Beijing, China). Significant expression of a transcript was considered if RPKM ≥ 1 in either one of the two conditions. Differentially expressed genes were identified with DEseq2, with a cutoff at a p-value < 0.05 and | log2 fold change ISL1 KD mutant vs ctrl | ≥ 0.5. GSEA (Gene Set Enrichment Analysis) and GO enrichment analysis were performed with GSEA software and DAVID Functional Annotation Tools, respectively.
RNAs were reverse-transcribed with SuperScript II First-Strand Synthesis System (Invitrogen, ThermoFisher, MA, USA). qPCR analyses were performed using SYBR green detection (ABI, ThermoFisher, MA, USA) with primers listed in Table S7.
ChIP-seq, data analysis and ChIP-qPCR
ChIP was carried out following protocol as described [34]. All ChIP-seq datasets were deposited into SRA database under the accession code SRP159115. Briefly, 2x10⁶ cultured cells were cross-linked with 1% formaldehyde and lysed with RIPA buffer (see in western blot). Chromatin was sheared with sonication to 100-400 bp DNA fragments. ISL1-bound DNA was immunoprecipitated by anti-ISL1 antibody (ab109517, Abcam, MA, USA). After reverse cross-linking, the DNA was purified using the Qiagen PCR purification kit (Qiagen). ChIP sequencing libraries were generated and amplified for 15 cycles. 225-375 bp DNA fragments were gel-purified and sequenced with HI-seq 2500 (Illumina). Reads alignment to human genome assembly (NCBI38/hg19) was performed with Bowtie2. Binding peaks were called using HOMER with findPeaks and annotated using annotatePeaks.pl. Genome-wide distribution of ISL1 ChIP-Seq peaks were mapped according to their nearest downstream genes using cis-regulatory element annotation system, promoter areas include 1 kb upstream and 100 bp downstream of the transcription start site (TSS). Motif analysis for ISL1 was performed using findGenomeMotif.pl. For the visualization of ChIP-seq data, the Integrative Genome Viewer IGV 2.3 was used (http://www.broadinstitute.org/igv/). GO analysis was performed with DAVID Functional Annotation software.
ChIP-qPCR was performed using ISL1 ChIP-DNA and IgG ChIP-DNA as templets and primers listed in Table S7. Data were normalized to the negative controls with primers to sequences that are adjacent (>1-5 kb) to ISL1 binding regions but do not contain ISL1 binding motifs. At least three independent samples were analyzed.
In silico analysis, referenced data and data accessibility
Neale Multi-cancer study [35] and Albino Neuroblastic-Tumor study [36] were obtained from Oncomine.org. Datasets of ISL1 expression and DNA methylation in 1457 cancer cell lines were obtained from Cancer Cell Line Encyclopedia (https://portals.broadinstitute.org/ccle). Datasets of ISL1 expression in poorly differentiated neuroblastomas and more differentiated neuroblastomas were obtained from Bourdeaut's study [30]. The ChIP-seq datasets for H3K4me1 and H3K27ac in SH-SY5Y cells can be accessed from GEO database under accession number GSM2120705 and GSM 2120706, respectively [37]. The ChIP-seq datasets for GATA3 in SH-SY5Y cells can be accessed from GSM1602667 [23]. RNA-seq and ChIP-seq datasets of this study can be accessed from the SRA database under the accession number SRP159301 (RNA-seq) and SRP159115 (ChIP-seq).
Statistical analysis
Data are expressed as mean ± SD. For 2-group comparisons, data were analyzed with 2-tailed t-test Statistical significances is considered if a p-value < 0.05. Experiments were repeated independently three times or more.
Results
Inverse correlation of ISL1 expression and the differentiation grade of neuroblastoma
ISL1 is one of the most sensitive markers overexpressed in neuroblastoma, especially in poorly differentiated ones [21, 30], however its role in neuroblastoma oncogenesis remains unexplored. We first analyzed ISL1 expression in various cancer types using previously published datasets. Neale Multi-cancer study [35] obtained through Oncomine.org revealed that among human tumors analyzed, ISL1 was most highly expressed in neuroblastoma (Figure S1A). Data from CCLE database (https://portals.broadinstitute.org/ccle) also demonstrated that, among 1457 neoplasm cell lines, the highest level of ISL1 expression was observed in neuroblastoma (Figure S1B). Consistent with its higher level of expression, whole-genome DNA methylation profiling revealed the lowest methylation levels in the gene body of ISL1 in neuroblastoma (Figure S1C). The dataset of Albino Neuroblastic-Tumor study [36] from Oncomine.org showed that, among 19 neuroblastic tumors expression of ISL1 was significantly elevated in neuroblastoma compared with other two differentiated neuroblastic tumors (ganglioneuroblastoma and ganglioneuroma) (Figure S1D). Furthermore, analysis of another published neuroblastomas gene expression microarray dataset [30] revealed that ISL1 expression was markedly increased in poorly differentiated neuroblastomas compared to more differentiated neuroblastomas (Figure S1E). Together, there data demonstrated that ISL1 is upregulated in neuroblastoma and its expression level is inversely correlated with the differentiation grade of neuroblastoma.
Knockdown of ISL1 results in inhibition of neuroblastoma growth
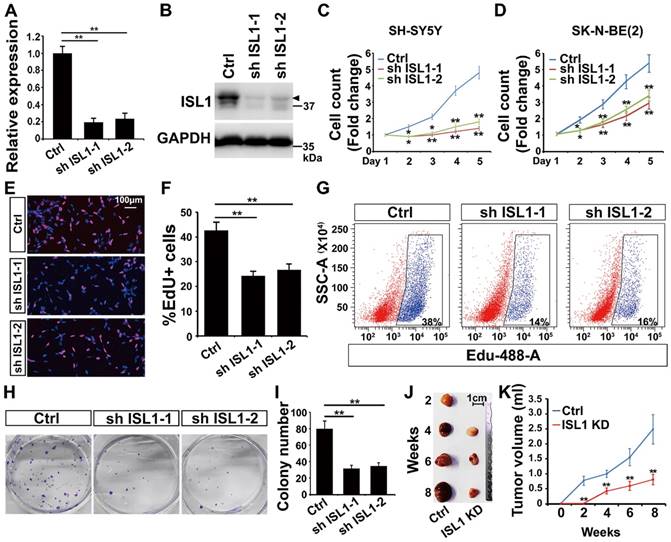
To study the role of ISL1 in neuroblastoma, we silenced ISL1 expression in neuroblastoma cells using two different shRNAs against ISL1 (sh ISL1-1 and sh ISL1-2). Effective knockdown (KD) of ISL1 expression was similarly observed in both SH-SY5Y (MYCN non-amplified) and SK-N-BE(2) (MYCN-amplified) neuroblastoma cell lines as confirmed by qRT-PCR and Western blot analyses (Figure 1A, B, Figure S2A-S2C). Knockdown of ISL1 resulted in significant inhibition of cell expansion in both SH-SY5Y and SK-N-BE(2) neuroblastoma cell culture (Figure 1C, D). EdU staining and flow cytometric cell counting showed that the percentage of EdU-labeled cells was significantly decreased in ISL1 KD neuroblastoma cells compared to controls (Figure 1E-G). In addition, ISL1 downregulation suppressed colony formation of SH-SY5Y neuroblastoma cells (Figure 1H, I). To further assess whether ISL1 knockdown could suppress tumor growth in vivo, we did tumor formation assays with ISL1 KD and control SH-SY5Y neuroblastoma cells using a SCID mouse xenograft model. ISL1 knockdown significantly inhibited tumor growth rate and reduced the volumes of ISL1 KD tumors compared to controls (Figure 1J, K).
Knockdown of ISL1 results in inhibition of neuroblastoma growth. (A, B) Validation of shRNA-mediated knockdown ISL1 by qPCR and Western blot (Arrow head) in SH-SY5Y cells. Error bars represent standard deviation (±SD), n=3, *p<0.05, **p<0.01, 2-tailed t-test. (C, D) Knockdown of ISL1 with sh ISL1-1 and sh ISL1-2 results in inhibition of cell expansion in both SH-SY5Y and SK-N-BE(2) neuroblastoma cells. Error bars represent ±SD, n=6, *p<0.05, **p<0.01, 2-tailed t-test). (E) EdU staining of ISL1 KD and control SH-SY5Y cells. (F) Quantification of EdU-positive cell percentage. Error bars represent ±SD; ** p<0.01, n=5, 2-tailed t-test. (G) Flow cytometric analysis of EdU-positive cells in ISL1 KD and control SH-SY5Y cells. (H, I) Colony formation of ISL1 KD and control SH-SY5Y cells. Quantification of the total number of colonies in ISL1 KD and control cultures. Error bars represent ±SD; n=4, ** p<0.01, 2-tailed t-test. (J, K) Tumor formation following subcutaneous injection of ISL1 KD and control SH-SY5Y cells. Images of SH-SY5Y-derived tumors presented (J), and tumor volume size monitored at indicated days post-injection (K). Error bars represent ±SD; n=3; *p<0.05, **p<0.01, 2-tailed t-test.
RNA-seq analysis revealed an important role of ISL1 in promoting cell cycle-associated gene expression but repressing differentiation-associated gene expression in neuroblastoma
To investigate potential downstream genes of ISL1 in neuroblastoma, we performed RNA-seq analysis on ISL1 KD (sh ISL1-1) and control SH-SY5Y cells. Of 16,563 genes expressed at significant level in SH-SY5Y cells, transcripts for 935 genes were downregulated, and 673 were upregulated in ISL1 KD SH-SY5Y cells (|log2 Fold Change (ISL1 KD vs. Ctrl) | ≥ 0.5, p < 0.05) (Figure 2A, Table S1). Gene ontology (GO) analysis revealed that the top GO terms for downregulated genes in ISL1 KD SH-SY5Y cells were highly enriched in the cell cycle (Figure 2B).
Essential role of ISL1 in regulating genes required for neuroblastoma pathogenesis. (A) Scatterplot of RNA-seq showing relative gene expression of mRNA in ISL1 KD and control SH-SY5Y cells. Red and blue represent genes upregulated or downregulated, respectively. (B, C) Gene Ontology (GO) functional clustering of genes down- and upregulated in ISL1 KD SH-SY5Y cells, highlighting pathways most significantly affected in ISL1 KD neuroblastoma cells (top 10 categories are shown). (D-F) Gene Set Enrichment Analysis (GSEA) showing downregulation of genesets involved in cell proliferation, DNA replication and mitotic nuclear division in ISL1 KD SH-SY5Y cells. (G. H) qPCR validation of selected downregulated and upregulated genes in ISL1 KD neuroblastoma, respectively Error bars represent ±SD, n=3 per group, *p<0.05; **p<0.01; 2-tailed t-test). (I-K) Increased RA-induced neurite outgrowth in ISL1 KD neuroblastoma cells. All images were taken at 72 hours after RA or DMSO treatment. The extended neurites were stained with TUJ1. (M) Quantification of the length of neurites. The images from three biological replicates were pooled, and the length of longest neurite of individual cells was measured. The number of measured cells (n) per treatment group is 100. (*p<0.05; **p<0.01; 2-tailed t-test). (N-P) Transwell migration assay showing significantly reduced invasion and migration of ISL1 KD cells compared to control cells. The cells that have migrated through the membrane are stained and counted (P). Error bars represent ±SD, n=5 per group, *p<0.05; **p<0.01; 2-tailed t-test).
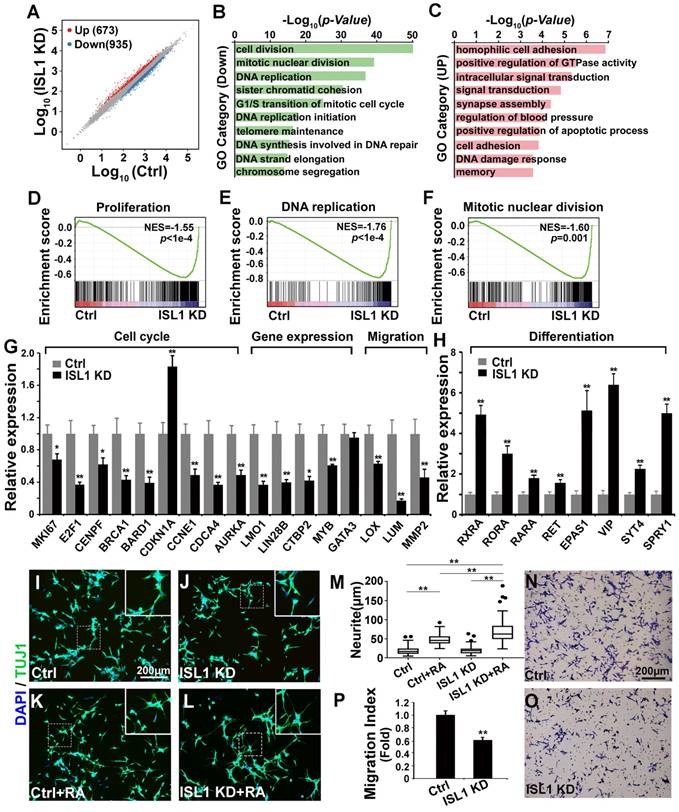
For upregulated genes, categories including cell adhesion, signal transduction, synapse assembly, apoptosis and DNA damage response were overrepresented (Figure 2C). Gene Set Enrichment Analysis (GSEA) showed significantly downregulated gene sets enriched in the proliferation, DNA replication and mitotic nuclear division (Figure 2D-F). We confirmed by qRT-PCR alterations in expression of selected genes that could contribute to the observed phenotypes and have been shown to be involved in neuroblastoma oncogenesis. Those included genes involved in the cell cycle (MKI67, E2F1, CENPF, BRCA1, BARD1, CDKN1A, CCNE1, CDCA4, AURKA), gene expression regulation (LMO1, LIN28B, CTBP2, MYB) and extracellular matrix (ECM) and adhesion (LOX, LUM, MMP2) (Figure 2G). Expression of GATA3, a direct target of ISL1 downregulated in Isl1-deficient sympathetic neurons [28], was not altered in ISL1 KD SH-SY5Y cells (Figure 2G, Table S1). Retinoic acid (RA) can repress proliferation but induce differentiation of neuroblastoma cells and is widely used in neuroblastoma therapy. In ISL1 KD neuroblastoma we observed increased expression of genes involved in RA signaling pathway (RXRA, RORA, RARA and EPAS1 [38, 39]) and sympathetic neuronal differentiation (RET, VIP, SYT4, SPRY1) (Figure 2H), suggesting an increased neuronal differentiation and responsiveness of ISL1 KD neuroblastoma cells to RA signaling. Consistent with this observation, we found significantly enhanced neurite outgrowth in ISL1 KD SH-SY5Y cells compared with control cells in the presence of RA, although no significant difference was observed between ISL1 KD and control SH-SY5Y cells in the absence of RA (Figure 2I-M). Furthermore, we observed significantly reduced migration of ISL1 KD neuroblastoma cells compared to controls, consistent with reduced expression of genes involved in tumor cell microenvironment and metastasis (MYB, LOX, LUM, CTBP2 and MMP2) in ISL1 KD neuroblastoma cells (Figure 2N-P).
ISL1 directly regulates genes essential for neuroblastoma pathogenesis
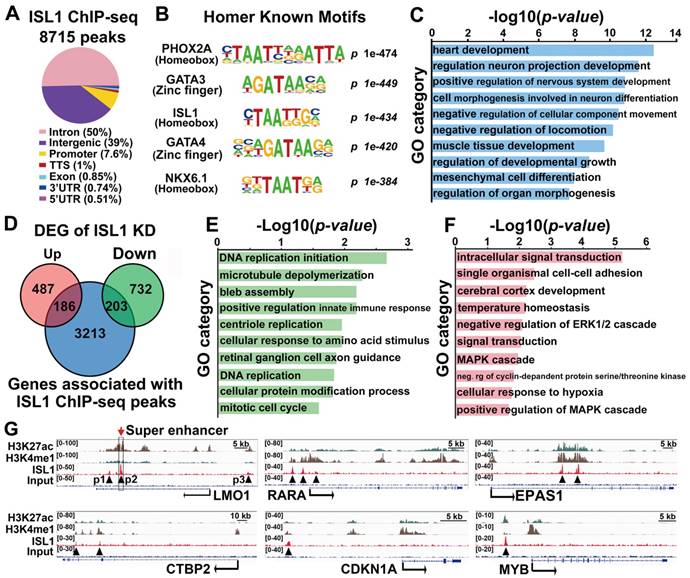
To uncover direct targets of ISL1 that could account for its role in neuroblastoma, we performed ChIP-seq analysis on SH-SY5Y cells using ISL1 antibody. Our analyses uncovered 8715 significant binding peaks for ISL1, mainly (89%) located at intergenic or intronic regions (Figure 3A, Table S2). HOMER motif analysis revealed that, besides ISL1 binding site, ISL1-bound regions also harbored conserved binding motifs for PHOX2A, GATA3, and other GATA and homeobox factors, suggesting that transcription factors from homeodomain and GATA families may collaborate with ISL1 to regulate neuroblastoma gene expression programs (Figure 3B, Table S3). Functional annotation according to the nearest TSS revealed 3602 ISL1 targets, including those related to heart and neuron development, consistent with the role of ISL1 in heart and nervous system morphogenesis (Figure 3C). Intersection of ChIP-seq and RNA-seq datasets for ISL1 KD and control SH-SY5Y cells uncovered 389 direct targets of ISL1 downregulated (203) or upregulated (186) in ISL1 KD neuroblastoma (Figure 3D). GO analysis showed that the downregulated targets of ISL1 were highly enriched in categories, including DNA replication, microtubule, centriole replication and mitotic cell cycle (Figure 3E). Categories of upregulated genes included intracellular signal transduction, cell adhesion and cerebral cortex development (Figure 3F). In addition, we used published ChIP-seq histone modification datasets [37] to examine the chromatin state of ISL1-bound enhancers of selected genes involved in neuroblastoma pathogenesis, including LMO1, RARA, EPAS1, CTBP2, CDKN1A and MYB (Figure 3G). Integrative Genomics Viewer (IGV) showed that these ISL1 bound regions were co-modified by H3K27ac and H3K4me1, markers of active enhancer [40], suggesting these ISL1-bound enhancers are transcriptionally active in neuroblastoma.
ISL1 directly regulates genes involved in neuroblastoma proliferation and differentiation. (A) Genome-wide distribution of ISL1 ChIP-Seq peaks mapped relative to their nearest TSS (transcription start site). Annotation indicates the positions of peaks are in TTS (transcription termination site, defined as from -100bp to +1Kb), exon, 5'UTR, 3'UTR, intronic or intergenic. (B) Top motifs enriched in ISL1-bound regions. (C) GO analysis of genes associated with ISL1 ChIP-seq peaks (top 10 categories are shown). (D) Intersection of ISL1 ChIP-seq and ISL1 KD RNA-seq datasets revealed 389 direct downstream targets of ISL1 (186 upregulated and 203 downregulated) in neuroblastoma (DEG: differentially expressed genes). (E, F) Enriched GO terms of direct targets of ISL1 downregulated (E) and upregulated (F) in neuroblastoma (top 10 categories are shown). (G) Integrative Genomics Viewer (IGV) showing ChIP-seq tracks for H3K4me1, H3K27ac, and ISL1 at the loci of representative ISL1 target genes in neuroblastoma (arrowhead showing binding peaks).
LMO1 is a direct downstream target of ISL1, partially accounting for the reduced proliferation in ISL1 KD neuroblastoma
Notably, LMO1 is a neuroblastoma oncogene required for neuroblastoma proliferation and metastasis [16, 17, 23]. Previous study has showed that ISL1 can bind to the LMO1 super-enhancer in mouse sympathetic neurons and is required for LMO1 expression [28]. Our ISL1 ChIP-seq data in SH-SY5Y cells revealed three ISL1-bound, active enhancer regions marked by H3K27ac and H3K4me1 (P1, P2 and P3) (Figure 3G). Of these enhancers, P2 region was at the first intron of LMO1 across rs2168101, which is the LMO1 superenhancer in human neuroblastoma (Figure 3G). ChIP-qPCR analysis confirmed binding of ISL1 at these enhancer regions, with the highest affinity of ISL1 binding observed at P2 region (Figure 4A). We carried out dual luciferase assay to measure the effect of ISL1 binding on LMO1 enhancer activity. Luciferase activity of reporter constructs with the P2 enhancer of LMO1 was significantly increased when co-transfected with increased concentration of construct expressing ISL1 protein (Figure 4B).
LMO1 is a direct downstream target of ISL1 in neuroblastoma. (A) ChIP-qPCR showing binding of ISL1 at P1, P2 and P3 enhancer regions of LMO1. Error bars represent ±SD; n=3, **p<0.01, 2-tailed t-test. (B) Luciferase assay showing LMO1 superenhancer activity in the presence of ISL1. Error bars represent ±SD; n=3, **p<0.01, 2-tailed t-test. (C) Re-expression of LMO1 partially restores cell growth of ISL1 KD neuroblastoma cells. Error bars represent ±SD, n=6, *p<0.05; **p<0.01; 2-tailed t-test). (D) EdU staining showing re-expression of LMO1 partially restores proliferation of ISL1 KD neuroblastoma cells. (E) Quantification of EdU-positive cells. Error bars represent ±SD, n=5, *p<0.05; **p<0.01. (G) qPCR showing restored proliferation gene expression. Error bars represent ±SD, n=3, *p<0.05; **p<0.01, 2-tailed t-test).
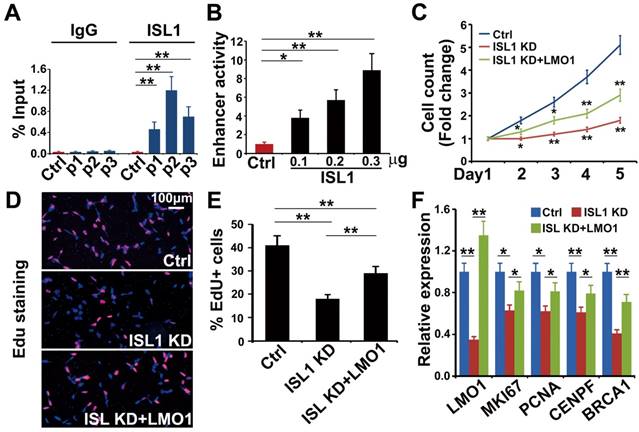
To test whether ISL1 regulates LMO1 to promote cell proliferation, we knocked down ISL1 in SH-SY5Y cells and co-transfected with the plasmid expressing LMO1 (sh ISL1 + LMO1) or mock plasmid (sh ISL1). The transfected cells were cultured for 5 days and counted every day. EdU was added 3 hours before harvesting. We observed that the total number of cells and the percentage of EdU-positive cells were significantly increased in sh ISL1 + LMO1 transfected cells compared to sh ISL1 + mock cells, although not to the extent of control cells (control shRNA and mock transfected) (Figure 4C-E). In addition, Q-PCR analysis revealed that LMO1 re-expression significantly restored expression of the cell-cycle genes that were downregulated by ISL1 knockdown, such as MKI67, PCNA, CENPF and BRCA1 (Figure 4F). These data suggested that ISL1 regulated neuroblastoma proliferation in part by directly controlling LMO1 expression.
Studies have revealed conflicting roles of EPAS1 in regulating neuroblastoma growth. RA plus 5-AZA treatment induced EPAS1 upregulation and neuroblastoma differentiation, and inhibition of EPAS1 diminished this differentiation effect [38]. On the other hand, inhibition of EPAS1 combined with RA treatment has been also shown to enhance differentiation of neuroblastoma cells into glial cells [39]. We found that concomitant knockdown of EPAS1 in ISL1 KD neuroblastoma is insufficient to reverse phenotypes and changes in gene expression caused by ISL1 KD (Figure S3).
ISL1 and GATA3 synergistically regulate downstream genes in neuroblastoma
Previous studies have shown that GATA3 directly binds to the super enhancer of LMO1 driving its expression and plays an essential role in sympathetic neurogenesis and neuroblastoma tumorigenesis [23, 28]. HOMER motif analyses of our ISL1 ChIP-seq datasets in both sympathetic neurons [28] and neuroblastoma cells (Figure 3B) suggested that GATA3 may act as a collaborative factor with ISL1 to regulate downstream genes. Comparison of ChIP-seq datasets for GATA3 [23] and ISL1 revealed substantial genome-wide co-occupancy of GATA3 and ISL1 at their binding regions (Figure 5A, B). A total of 2398 ISL1 target genes, approximately two thirds of ISL1 target genes, are potentially co-regulated by GATA3 and ISL1 (Figure 5C, Table S4). Overlay of the common target genes of ISL1 and GATA3 with genes differentially expressed in ISL1 KD neuroblastoma cells revealed 213 common target genes down (111) or up (102) regulated in ISL1 KD neuroblastoma (Figure 5C). GO analysis of these common target genes dysregulated in ISL1 KD neuroblastoma revealed that the upregulated target genes were mainly associated with cell signaling, while the downregulated target genes were associated with neurite outgrowth, DNA replication and centriole assembly (Figure 5D). Integrative Genomics Viewer showed that co-occupancy of enhancers of selected genes (CTBP2, EPAS1, CDKN1A and LMO1) by ISL1 and GATA3 (Figure 5E). Furthermore, Q-PCR analysis revealed that knockdown of GATA3 in SH-SY5Y cells led to altered expression of ISL1 target genes, although expression of ISL1 itself was unchanged (Figure 5F).
ISL1 and Gata3 synergistically activate downstream genes in neuroblastoma. (A. B) Heatmap (A) and aggregation plot (B) of ChIP-Seq mapped reads of Gata3 and ISL1 at all ISL1 binding sites. (C) Overlay of ISL1 ChIP-seq and GATA3 ChIP-seq datasets in SH-SY5Y (left). Overlay of the common target genes of ISL1 and GATA3 with genes differentially expressed in ISL1 KD neuroblastoma cells. (right). (D) GO terms enriched in common direct targets of ISL1 and GATA3 upregulated or downregulated in ISL1 KD neuroblastoma (top 5 not redundant categories are shown). (E) Integrative Genomics Viewer (IGV) showing ChIP-seq tracks for ISL1 and GATA3 at the loci of representative common target genes in neuroblastoma (arrowhead showing binding peaks). (F) qPCR analysis of GATA3 KD SH-SY5Y cells, showing similar alterations in expression of selected ISL1 target genes, noting that ISL1 expression is not altered. Error bars represent ±SD, n=3, *p<0.05; **p<0.01, 2-tailed t-test. (G) LMO1 enhancer Luciferase analysis in the presence of ISL1 and/or GATA3. Error bars represent ±SD, n=3, **p<0.01, 2-tailed t-test). (H) LMO1 mRNA expression in 293T cells transfected with ISL1 and/or GATA3. Error bars represent ±SD; n=3; *p<0.05, **p<0.01, 2-tailed t-test. (I, J) GATA3 ChIP-qPCR analysis of ISL1 KD neuroblastoma cells (I) and ISL1 ChIP-qPCR of GATA3 KD neuroblastoma cells (J) on selected common targets of ISL1 and GATA3. Error bars represent ±SD; n=3; *p<0.05, **p<0.01, 2-tailed t-test.
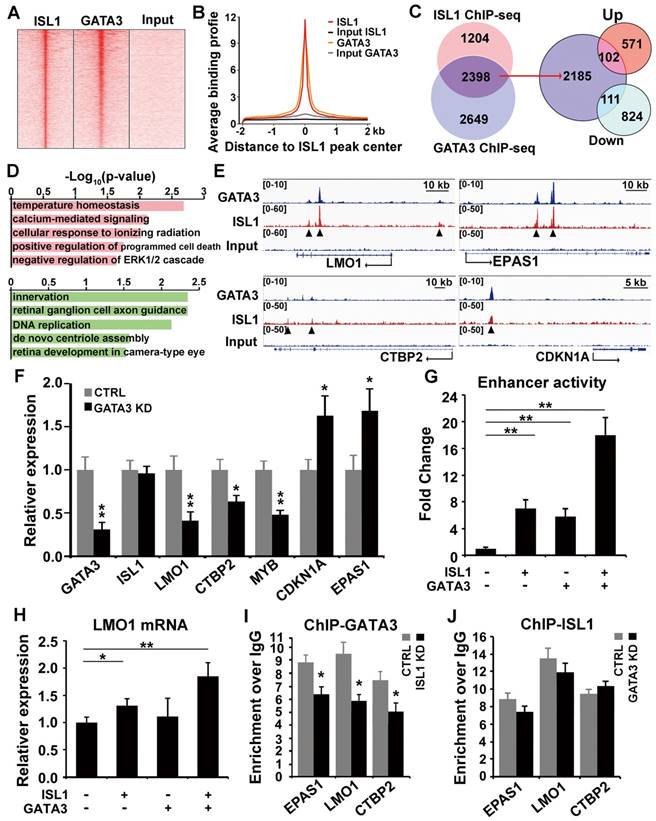
To test whether ISL1 and GATA3 synergistically regulate their target gene expression, we performed LMO1 super enhancer luciferase assay in 293T cells in the presence of ISL1 and/or GATA3. Compared to mock transfected cells, significantly increased luciferase activity was observed in cells transfected with ISL1 or GATA3. A further significantly enhanced luciferase activity was observed in cells co-transfected with ISL1 and GATA3, compared to ISL1 and GATA3 alone (Figure 5G). To test whether ISL1 and GATA3 are sufficient to induce ectopic LMO1 expression in 293T cells, in which the expression of ISL1, GATA3 and LMO1 is barely detectable. Transfection of 293T cells with ISL1 slightly but significantly induced endogenous LMO1 mRNA expression compared to mock transfected cells (Figure 5H). Although GATA3 alone couldn't induce LMO1 expression, co-transfection of ISL1 and GATA3 further significantly induced LMO1 expression compared to ISL1 alone (Figure 5H).
To further examine whether ISL1 and GATA3 are mutually dependent in their binding and activation of their target genes, we knocked down ISL1 in SH-SY5Y cells and examined GATA3 binding to enhancers of selected genes (EPAS1, LMO1 and CTBP2), and vice versa. ChIP-qPCR revealed that knockdown of ISL1 resulted in significantly reduced GATA3 binding at those enhancers (Figure 5I). Interestingly however, binding of ISL1 at those enhancers was not significantly compromised by GATA3 knockdown (Figure 5J), consistent with the inability of GATA3 alone to promote LMO1 expression in 293T cells. Although binding of ISL1 to the common target genes might be less dependent on GATA3, yet robust target gene activation requires both GATA3 and ISL1 (Figure 5G, H).
To examine whether ISL1 and GATA3 physically interact with each other to regulate target gene expression, we co-transfected 293T cells with HA-tagged ISL1 and Myc-tagged GATA3 expressing plasmids and performed co-immunoprecipitation using anti-HA antibody. We observed specific binding of ISL1 and GATA3 in HA-ISL1 and Myc-GATA3 co-transfected cells, but not in cells transfected with HA-ISL1 alone (Figure S4A, and arrow). To detect the interaction of endogenous ISL1 and GATA3, SH-SY5Y cell lysates were immunoprecipitated with anti-ISL1 antibody and Western blot using anti-GATA3 antibody was performed. Results revealed that ISL1 physically binds to GATA3 in neuroblastoma cells (Figure S4B, arrow).
ISL1 and MYCN act in parallel to regulate common yet distinct oncogenic pathways in neuroblastoma
MYCN amplification is common in human neuroblastoma that confers resistance to RA therapy [41]. To investigate the effect of MYCN-amplification on ISL1's function and possible epistatic interaction between ISL1 and MYCN, we used a MYCN-amplified neuroblastoma cell line SK-N-BE(2) that, upon MYCN knockdown or RA treatment, will efficiently differentiate into neuron-like cells with extensive neurite outgrowth [42-45]. We found that expression of MYCN and its known target genes [41, 46-48] involved in neuronal and neuroblastoma differentiation, such as p53, ASCL1 and LMO4, was not altered by ISL1 knockdown in SK-N-BE(2) and SH-SY5Y neuroblastoma cells (Figure 6A, Table S1). Conversely, expression of ISL1 and its key downstream genes LMO1 and LIN28B was not significantly altered by MYCN knockdown (Figure 6B) (FC ≥ 1.5, p-value < 0.05). Similar to that observed in SH-SY5Y cells, knockdown of ISL1 in MYCN-amplified SK-N-BE(2) cells led to downregulation of LMO1 and LIN28B, but unaltered GATA3 expression (Figure 6A, Figure 2G). However, expression of some of cell cycle-related genes (e.g. PCNA, BARD1 and CDKN1A) and genes of RA pathway was not altered, or altered to a lesser extent by ISL1 knockdown in SK-N-BE(2) cells compared to SH-SY5Y cells (FC ≥ 1.5, p-value < 0.05) (Figure 6A). On the other hand, knockdown of MYCN in SK-N-BE(2) cells resulted in altered expression of cell cycle-related genes (CCNE1, AURKA, PCNA, BARD1 and CDKN1A), comparable to that observed in ISL1 KD SH-SY5Y cells (Figure 6B). However, expression of genes of RA pathway in MYCN KD SK-N-BE(2) cells was not significantly increased (RORA, RARA and EPAS1) or was significantly decreased (RXRA) (Figure 6B).
ISL1 and MYCN act in parallel to regulate common yet distinct oncogenic pathways in neuroblastoma. (A, B) Relative mRNA expression of ISL1, MYCN, GATA3 and selected ISL1 or MYCN downstream genes in ISL1 KD and MYCN KD SK-N-BE(2) neuroblastoma cells. Error bars represent ±SD; n=3; *p<0.05, **p<0.01, 2-tailed t-test. (C-G) EdU staining of control, ISL1 KD, MYCN KD and MYCN/ISL1 double-KD SK-N-BE(2) cells, and quantification of EdU-positive cells. Error bars represent ±SD; ** p<0.01, n=5, 2-tailed t-test. (H-P) neurite outgrowth of ISL1 KD, MYCN KD, ISL1/MYCN-double KD and control SK-N-BE(2) cells with or without RA. All images were taken at 72 hours after RA or DMSO treatment. The images from three biological replicates were pooled, and the length of longest neurite of individual cells was measured (P). In RA untreated groups, the number of measured cells (n) in Ctrl, ISL1 KD, MYCN KD and ISL1/MYCN double-KD group is 100, 98, 95 and 95, respectively. In RA treated groups, the number of measured cells (n) in Ctrl, ISL1 KD, MYCN KD and ISL1/MYCN double-KD group is 105, 121, 96 and 95, respectively. (*p<0.05; **p<0.01; 2-tailed t-test). (Q) The regulatory network controlling neuroblastoma pathogenesis. ISL1, together with GATA3, acts upstream of multiple oncogenic pathway essential for neuroblastoma proliferation and differentiation. In MYCN-amplified SK-N-BE(2) neuroblastoma cells, MYCN acts in parallel with ISL1 to control the cell cycle and RA-mediated differentiation. In addition, MYCN can suppress differentiation (neurite outgrowth) independent of RA pathways.
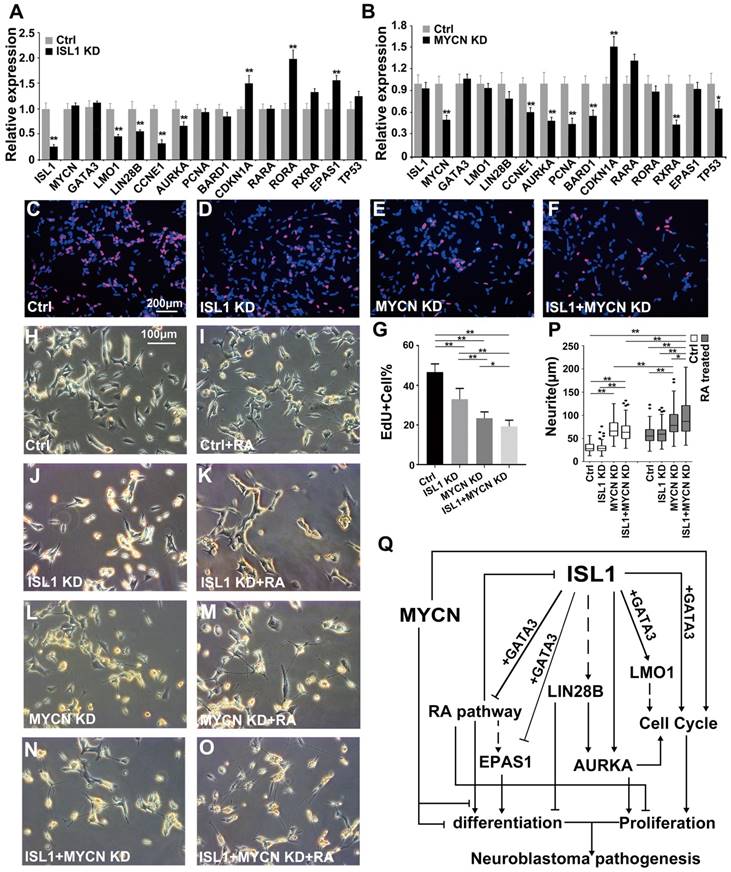
Consistent with these findings, we observed significantly decreased proliferation in ISL1 KD SK-N-BE(2) cells and a more pronounced decrease in proliferation in MYCN KD cells (Figure 6C-E, G). Double knockdown of MYCN and ISL1 in SK-N-BE(2) cells led to a further significant decrease in cell proliferation, compared to single ISL1 or MYCN knockdown (Figure 6C-G).
Similar to those in SH-SY5Y cells, knockdown of ISL1 was unable to induce spontaneous neurite outgrowth in SK-N-BE(2) cells in the absence of RA. In contrast, ISL1 KD failed to enhance RA treatment-induced neurite outgrowth (Figure 6H-K, P). We observed significantly increased neurite outgrowth in MYCN KD SK-N-BE(2) cells that was further enhanced by RA treatment (Figure 6L, M, P). This observation is consistent with previous studies [42-44], but in contrast to the rather subtle changes in mRNA expression of RA receptors in MYCN KD SK-N-BE(2) cells. Concomitant knockdown of ISL1 and MYCN resulted in increased neurite outgrowth comparable to the single MYCN knockdown without RA treatment (Figure 6H, L, N, P). However, neurite outgrowth of SK-N-BE(2) cells with ISL1/MYCN double knockdown was further enhanced by RA treatment compared to RA untreated cells, or MYCN KD cells treated with RA (Figure 6M-P). These results suggested that neurite outgrowth is redundantly controlled by MYCN and ISL1, and MYCN control neurite outgrowth by RA-dependent and -independent pathways (Figure 6Q).
Consistent with our observation, intersection of 1608 differentially expressed genes (DEGs) in ISL1 KD neuroblastoma and 2124 MYCN correlated genes from Hsu's study [48] identified 309 commonly regulated genes by ISL1 and MYCN (Figure S5A, Table S5). GO analysis of these common genes revealed that top 10 overrepresented categories were all cell cycle related (Figure S5B, Table S5). By intersection of 389 ISL1 direct targets identified in this study and 874 MYCN direct targets from Hsu's study [48], we found only 29 common direct targets, mainly associated signal transduction and cell division (Figure S5A, C, Table S5).
Discussion
Here we reported a critical role for ISL1 in neuroblastoma, and knockdown of ISL1 in neuroblastoma results in reduced proliferation, but enhanced differentiation in response to RA treatment. ISL1 and GATA3 synergistically regulate multiple neuroblastoma oncogenic genes and pathways. In addition, our study revealed an epistatic relationship between ISL1 and MYCN in the control of neuroblastoma pathogenesis, and ISL1 and MYCN act in parallel to regulate common yet distinct pathways driving neuroblastoma pathogenesis (Figure 6Q).
Neuroblastoma arises from transformation of sympatho-adrenal progenitors due to impaired progenitor terminal differentiation. Dysfunction of early sympathetic developmental gene program has been shown to cause sympathetic neurogenesis defects and neuroblastoma [1, 18]. Our previous studies have uncovered a critical role of ISL1 in sympathetic neurogenesis and implicated ISL1 as a potential candidate gene involved in neuroblastoma [28, 29]. ISL1 is overexpressed in all human neuroblastoma tumors and cell lines, and its expression is inversely correlated to neuroblastoma differentiation state.
Our ChIP-seq and RNA-seq analyses of ISL1 KD SH-SY5Y neuroblastoma cells revealed a complex regulatory network downstream of ISL1 that orchestrates neuroblastoma oncogenesis. Similar to its role in sympathetic neurogenesis, ISL1 regulates a large number of cell cycle-associated genes and genes of distinct oncogenic pathways required for neuroblastoma proliferation (LMO1, LIN28B, AURKA, BARD1, CTBP2 and MYB). Consistent with this, knockdown of ISL1 in neuroblastoma cells results in impaired proliferation and tumor growth. Furthermore, ISL1 promotes neuroblastoma migration by directly regulating expression of genes involved in ECM assembly and metastasis, such as LOX, LUM, MMP2 and LMO1. LMO1 has been shown to promote neuroblastoma migration and metastasis by regulating expression of LOXL3, a member of the lysyl oxidase (LOX) family required for ECM formation and tumor metastasis [17, 49].
It is worth noting that, despite functional similarities in its role in sympathetic neuron and neuroblastoma, genes downstream of ISL1 vary between different cell types. For instance, in sympathetic neurons, ISL1 controls the cell cycle in part by regulating expression of D-type cyclins (early G1/S), whereas in neuroblastoma, by targeting members of E- and B- cyclins (late G1/S and M phase), MYC and CDKN1A [28]. Notably, ISL1 is expressed in multiple tissues and cell types during development, e.g. cardiac cells, central neurons and pancreatic beta-cells, wherein it plays distinct roles in each of the cell types by regulating distinct genes and pathways [34, 50-55]. In addition, involvement of ISL1 in several other cancer types has been reported, in which ISL1 is required for proliferation via distinct mechanisms. These data have suggested context-dependent roles for ISL1 during development and tumorigenesis.
GATA3 is a key component of the gene regulatory program controlling early sympathetic neurogenesis [19]. Expression of GATA3 is downregulated in ISL1 knockout sympathetic neurons where GATA3 is a direct target of ISL1 [28]. However in neuroblastoma cells, expression of GATA3 is not altered by ISL1 knockdown, and vice versa. GATA3 is overexpressed in neuroblastoma and is required for neuroblastoma proliferation and tumor growth [22]. Previous study has shown that GATA3 binds to LMO1 super-enhancer driving its expression and neuroblastoma tumorigenesis [23]. Motif analyses of ISL1 ChIP-seq datasets from sympathetic neuron [28] and neuroblastoma suggest that ISL1 and GATA3 may collaborate to regulate common gene expression. Comparison of ChIP-seq datasets for ISL1 and GATA3 [23] in neuroblastoma cells has revealed a substantial overlap of the enhancers bound by ISL1 and GATA3. ISL1 and GATA3 synergistically bind to and regulate expression of genes essential for neuroblastoma tumorigenesis, such as LMO1, CTBP2, RA receptors and CDKN1A. Although DNA binding and transcriptional function of ISL1 is less dependent on the presence of GATA3, robust gene activation requires both ISL1 and GATA3.
Retinoic acids are widely used in neuroblastoma therapy, acting by promoting differentiation but repressing proliferation of neuroblastoma cells [56]. We found that ISL1 represses RA signaling pathway by directly binding to and repressing expression of RA receptors (RARA, RXRA and RORA). Therefore, knockdown of ISL1 in SH-SY5Y cells may de-repress RA receptors and sensitize neuroblastoma cells to RA signaling and enhance RA-induced differentiation. On the other hand, RA treatment has shown to repress expression of ISL1 and GATA3 and induces neuroblastoma differentiation [22, 41]. Together, these studies suggest that RA may modulate neuroblastoma proliferation and differentiation through a RA-triggered de-repression mechanism involving ISL1/GATA3 complex.
MYCN amplification is the most common genetic alteration in human neuroblastoma and a major cause of RA-resistance. During sympathetic neurogenesis, MYCN plays crucial roles in maintaining pluripotency and expansion of sympathetic progenitor cells, but blocking their differentiation [57]. Overexpression of MYCN leads to increased number of sympathetic progenitors and is sufficient to drive neuroblastoma tumorigenesis. Consistent with its role in sympathetic progenitors, expression of MYCN is largely confine to sympathetic progenitor cells and it is downregulated with sympathetic differentiation [58, 59]. In contrast, ISL1 is expressed in sympathetic neurons immediately after their differentiation, but not in neural crest or sympathetic progenitor cells [28], suggesting that MYCN and ISL1 may acts as temporal factors in distinct regulatory networks required for sequential events of sympathetic neurogenesis.
Similarly, in SK-N-BE(2) and SH-SY5Y neuroblastoma, MYCN expression is not altered by ISL1 knockdown and vice versa. Expression of LMO1 and LIN28B, the key genes downstream of ISL1, is not altered by MYCN knockdown in SK-N-BE(2) cells, suggesting distinct pathways regulated by ISL1 and MYCN in MYCN-amplified neuroblastoma. Consistent with this, comparison of our ISL1 ChIP-seq and published MYCN ChIP-seq datasets in neuroblastoma [48] has revealed substantial divergences in the key downstream targets between ISL1 and MYCN.
ISL1 and MYCN play redundant roles in control of neuroblastoma proliferation and differentiation, at least in part, by regulating genes involved in the cell cycle and RA pathway. Similar to that observed in ISL1 KD SH-SY5Y cells, knockdown of MYCN in SK-N-BE(2) cells leads to alterations in expression of cell cycle-related genes (e.g. CCNE1, AURKA, PCNA, BARD1 and CDKN1A). However, MYCN amplification in SK-N-BE(2) cells prevents alterations in some of these cell cycle gene expression caused by ISL1 knockdown. Furthermore, ISL1 knockdown causes de-repression of RA receptors and their downstream genes in SH-SY5Y cells that, however, is significantly compromised by MYCN amplification in SK-N-BE(2) cells. Consequently, knockdown of ISL1 in MYCN amplified SK-N-BE(2) cells failed to enhance neurite outgrowth by RA treatment. In contrast to the rather subtle changes in mRNA expression of RA receptors in MYCN KD SK-N-BE(2) cells, neurite outgrowth without RA treatment is significantly increased and that is further enhanced by RA treatment. Concomitant knockdown of ISL1 and MYCN leads to a significant increase in RA-induced neurite outgrowth. These data suggest that MYCN suppresses neuroblastoma differentiation (neurite outgrowth) by RA-dependent and independent mechanisms.
In conclusion, our studies have revealed a complex gene regulatory network underlying neuroblastoma pathogenesis, in which ISL1, complexed with GATA3, acts as a key upstream regulator. ISL1 and MYCN function in parallel to control common yet distinct oncogenic pathways required for neuroblastoma proliferation and differentiation. Other genetic and epigenetic factors, such as ALK, LMO1, TGFβ signaling and H3K27 demethylation may collaborate with MYCN-amplification to confer high-risk and presumably RA-resistance phenotypes [17, 41, 60, 61]. Thus Combination therapies co-targeting these factors may provide a new therapeutic strategy for MYCN amplified and RA-resistant neuroblastoma.
Supplementary Material
Supplementary figures and tables 3, 6, and 7.
Supplementary table 1.
Supplementary table 2.
Supplementary table 4.
Supplementary table 5.
Acknowledgements
We thank Dr. Zhen Zhang (Shanghai Pediatric Congenital Heart Disease Institute, Shanghai Children's Medical Center, School of Medicine, Shanghai Jiaotong University) for sharing neuroblastoma cell lines. This work was supported by grants from the National Natural Science Foundation of China (81870168, 81570285, 81670448, 81700285, and 81521061).
Competing Interests
The authors have declared that no competing interest exists.
References
1. Cheung NKV, Dyer MA. Neuroblastoma: developmental biology, cancer genomics and immunotherapy. Nat Rev Cancer. 2013;13:397-411
2. Maris JM. Recent advances in neuroblastoma. N Engl J Med. 2010;362:2202-11
3. Pinto NR, Applebaum MA, Volchenboum SL, Matthay KK, London WB, Ambros PF. et al. Advances in Risk Classification and Treatment Strategies for Neuroblastoma. J Clin Oncol. 2015;33:3008-U105
4. Schleiermacher G, Janoueix-Lerosey I, Delattre O. Recent insights into the biology of neuroblastoma. International journal of cancer. 2014;135:2249-61
5. Olsen RR, Otero JH, Garcia-Lopez J, Wallace K, Finkelstein D, Rehg JE. et al. MYCN induces neuroblastoma in primary neural crest cells. Oncogene. 2017;36:5075-82
6. Althoff K, Beckers A, Bell E, Nortmeyer M, Thor T, Sprussel A. et al. A Cre-conditional MYCN-driven neuroblastoma mouse model as an improved tool for preclinical studies. Oncogene. 2015;34:3357-68
7. Kang JH, Rychahou PG, Ishola TA, Qiao J, Evers BM, Chung DH. MYCN silencing induces differentiation and apoptosis in human neuroblastoma cells. Biochemical and biophysical research communications. 2006;351:192-7
8. Janoueix-Lerosey I, Lopez-Delisle L, Delattre O, Rohrer H. The ALK receptor in sympathetic neuron development and neuroblastoma. Cell Tissue Res. 2018
9. Mosse YP, Laudenslager M, Longo L, Cole KA, Wood A, Attiyeh EF. et al. Identification of ALK as a major familial neuroblastoma predisposition gene. Nature. 2008;455:930-U22
10. Chen Y, Takita J, Choi YL, Kato M, Ohira M, Sanada M. et al. Oncogenic mutations of ALK kinase in neuroblastoma. Nature. 2008;455:971-4
11. George RE, Sanda T, Hanna M, Frohling S, Luther W 2nd, Zhang J. et al. Activating mutations in ALK provide a therapeutic target in neuroblastoma. Nature. 2008;455:975-8
12. Zhu S, Lee JS, Guo F, Shin J, Perez-Atayde AR, Kutok JL. et al. Activated ALK collaborates with MYCN in neuroblastoma pathogenesis. Cancer Cell. 2012;21:362-73
13. Tolbert VP, Coggins GE, Maris JM. Genetic susceptibility to neuroblastoma. Current opinion in genetics & development. 2017;42:81-90
14. Molenaar JJ, Domingo-Fernandez R, Ebus ME, Lindner S, Koster J, Drabek K. et al. LIN28B induces neuroblastoma and enhances MYCN levels via let-7 suppression. Nat Genet. 2012;44:1199-206
15. Otto T, Horn S, Brockmann M, Eilers U, Schuttrumpf L, Popov N. et al. Stabilization of N-Myc is a critical function of Aurora A in human neuroblastoma. Cancer Cell. 2009;15:67-78
16. Wang K, Diskin SJ, Zhang HT, Attiyeh EF, Winter C, Hou CP. et al. Integrative genomics identifies LMO1 as a neuroblastoma oncogene. Nature. 2011;469:216-20
17. Zhu S, Zhang X, Weichert-Leahey N, Dong Z, Zhang C, Lopez G. et al. LMO1 Synergizes with MYCN to Promote Neuroblastoma Initiation and Metastasis. Cancer Cell. 2017;32:310-23 e5
18. Tomolonis JA, Agarwal S, Shohet JM. Neuroblastoma pathogenesis: deregulation of embryonic neural crest development. Cell Tissue Res. 2017
19. Kameda Y. Signaling molecules and transcription factors involved in the development of the sympathetic nervous system, with special emphasis on the superior cervical ganglion. Cell Tissue Res. 2014;357:527-48
20. Cheung NKV, Ostrovnaya I, Kuk D, Cheung IY. Bone Marrow Minimal Residual Disease Was an Early Response Marker and a Consistent Independent Predictor of Survival After Anti-GD2 Immunotherapy. J Clin Oncol. 2015;33:755-63
21. Cheung IY, Feng Y, Gerald W, Cheung NKV. Exploiting Gene Expression Profiling to Identify Novel Minimal Residual Disease Markers of Neuroblastoma. Clin Cancer Res. 2008;14:7020-7
22. Peng HW, Ke XX, Hu RJ, Yang LQ, Cui HJ, Wei YQ. Essential role of GATA3 in regulation of differentiation and cell proliferation in SK-N-SH neuroblastoma cells. Mol Med Rep. 2015;11:881-6
23. Oldridge DA, Wood AC, Weichert-Leahey N, Crimmins I, Sussman R, Winter C. et al. Genetic predisposition to neuroblastoma mediated by a LMO1 super-enhancer polymorphism. Nature. 2015;528:418-21
24. Wildner H, Gierl MS, Strehle M, Pla P, Birchmeier C. Insm1 (IA-1) is a crucial component of the transcriptional network that controls differentiation of the sympatho-adrenal lineage. Development. 2008;135:473-81
25. Chen CC, Breslin MB, Lan MS. INSM1 increases N-myc stability and oncogenesis via a positive-feedback loop in neuroblastoma. Oncotarget. 2015;6:36700-12
26. Boeva V, Louis-Brennetot C, Peltier A, Durand S, Pierre-Eugene C, Raynal V. et al. Heterogeneity of neuroblastoma cell identity defined by transcriptional circuitries. Nat Genet. 2017;49:1408-13
27. Sun YF, Dykes IM, Liang XQ, Eng SR, Evans SM, Turner EE. A central role for Islet1 in sensory neuron development linking sensory and spinal gene regulatory programs. Nat Neurosci. 2008;11:1283-93
28. Zhang Q, Huang R, Ye Y, Guo X, Lu J, Zhu F. et al. Temporal requirements for ISL1 in sympathetic neuron proliferation, differentiation, and diversification. Cell Death Dis. 2018;9:247
29. Huber K, Narasimhan P, Shtukmaster S, Pfeifer D, Evans SM, Sun Y. The LIM-Homeodomain transcription factor Islet-1 is required for the development of sympathetic neurons and adrenal chromaffin cells. Dev Biol. 2013;380:286-98
30. Bourdeaut F, Janoueix-Lerosey I, Lucchesi C, Parls R, Ribeiro A, de Pontual L. et al. Cholinergic switch associated with morphological differentiation in neuroblastoma. J Pathol. 2009;219:463-72
31. Wang J, Gu S, Huang J, Chen S, Zhang Z, Xu M. Inhibition of autophagy potentiates the efficacy of Gli inhibitor GANT-61 in MYCN-amplified neuroblastoma cells. BMC Cancer. 2014;14:768
32. Lu JX, Guan S, Zhao YL, Yu Y, Woodfield SE, Zhang HY. et al. The second-generation ALK inhibitor alectinib effectively induces apoptosis in human neuroblastoma cells and inhibits tumor growth in a TH-MYCN transgenic neuroblastoma mouse model. Cancer Lett. 2017;400:61-8
33. Shi Q, Wang WP, Jia ZQ, Chen P, Ma KT, Zhou CY. ISL1, a novel regulator of CCNB1, CCNB2 and c-MYC genes, promotes gastric cancer cell proliferation and tumor growth. Oncotarget. 2016;7:36489-500
34. Liang XQ, Zhang QQ, Cattaneo P, Zhuang SW, Gong XH, Spann NJ. et al. Transcription factor ISL1 is essential for pacemaker development and function. J Clin Invest. 2015;125:3256-68
35. Neale G, Su X, Morton CL, Phelps D, Gorlick R, Lock RB. et al. Molecular characterization of the pediatric preclinical testing panel. Clin Cancer Res. 2008;14:4572-83
36. Albino D, Scaruffi P, Moretti S, Coco S, Truini M, Di Cristofano C. et al. Identification of low intratumoral gene expression heterogeneity in neuroblastic tumors by genome-wide expression analysis and Game Theory. Cancer. 2008;113:1412-22
37. Henrich KO, Bender S, Saadati M, Dreidax D, Gartlgruber M, Shao C. et al. Integrative Genome-Scale Analysis Identifies Epigenetic Mechanisms of Transcriptional Deregulation in Unfavorable Neuroblastomas. Cancer Res. 2016;76:5523-37
38. Westerlund I, Shi Y, Toskas K, Fell SM, Li S, Surova O. et al. Combined epigenetic and differentiation-based treatment inhibits neuroblastoma tumor growth and links HIF2alpha to tumor suppression. Proceedings of the National Academy of Sciences of the United States of America. 2017;114:E6137-e46
39. Cimmino F, Pezone L, Avitabile M, Acierno G, Andolfo I, Capasso M. et al. Inhibition of hypoxia inducible factors combined with all-trans retinoic acid treatment enhances glial transdifferentiation of neuroblastoma cells. Sci Rep. 2015;5:11158
40. Guenther MG, Levine SS, Boyer LA, Jaenisch R, Young RA. A chromatin landmark and transcription initiation at most promoters in human cells. Cell. 2007;130:77-88
41. Duffy DJ, Krstic A, Halasz M, Schwarzl T, Konietzny A, Iljin K. et al. Retinoic acid and TGF-beta signalling cooperate to overcome MYCN-induced retinoid resistance. Genome Med. 2017;9:15
42. Henriksen JR, Haug BH, Buechner J, Tomte E, Lokke C, Flaegstad T. et al. Conditional expression of retrovirally delivered anti-MYCN shRNA as an in vitro model system to study neuronal differentiation in MYCN-amplified neuroblastoma. Bmc Dev Biol. 2011;11:1
43. Smith AG, Popov N, Imreh M, Axelson H, Henriksson M. Expression and DNA-binding activity of MYCN/Max and Mnt/Max during induced differentiation of human neuroblastoma cells. J Cell Biochem. 2004;92:1282-95
44. Ikram F, Ackermann S, Kahlert Y, Volland R, Roels F, Engesser A. et al. Transcription factor activating protein 2 beta (TFAP2B) mediates noradrenergic neuronal differentiation in neuroblastoma. Mol Oncol. 2016;10:344-59
45. Westermark UK, Wilhelm M, Frenzel A, Henriksson MA. The MYCN oncogene and differentiation in neuroblastoma. Seminars in Cancer Biology. 2011;21:256-66
46. Valentijn LJ, Koster J, Haneveld F, Aissa RA, van Sluis P, Broekmans ME. et al. Functional MYCN signature predicts outcome of neuroblastoma irrespective of MYCN amplification. Proc Natl Acad Sci U S A. 2012;109:19190-5
47. Zeid R, Lawlor MA, Poon E, Reyes JM, Fulciniti M, Lopez MA. et al. Enhancer invasion shapes MYCN-dependent transcriptional amplification in neuroblastoma. Nat Genet. 2018;50:515-23
48. Hsu CL, Chang HY, Chang JY, Hsu WM, Huang HC, Juan HF. Unveiling MYCN regulatory networks in neuroblastoma via integrative analysis of heterogeneous genomics data. Oncotarget. 2016;7:36293-310
49. Erler JT, Bennewith KL, Nicolau M, Dornhofer N, Kong C, Le QT. et al. Lysyl oxidase is essential for hypoxia-induced metastasis. Nature. 2006;440:1222-6
50. Cai CL, Liang X, Shi Y, Chu PH, Pfaff SL, Chen J. et al. Isl1 identifies a cardiac progenitor population that proliferates prior to differentiation and contributes a majority of cells to the heart. Developmental cell. 2003;5:877-89
51. Caputo L, Witzel HR, Kolovos P, Cheedipudi S, Looso M, Mylona A. et al. The Isl1/Ldb1 Complex Orchestrates Genome-wide Chromatin Organization to Instruct Differentiation of Multipotent Cardiac Progenitors. Cell stem cell. 2015;17:287-99
52. Thaler JP, Lee SK, Jurata LW, Gill GN, Pfaff SL. LIM factor Lhx3 contributes to the specification of motor neuron and interneuron identity through cell-type-specific protein-protein interactions. Cell. 2002;110:237-49
53. Robertson NO, Smith NC, Manakas A, Mahjoub M, McDonald G, Kwan AH. et al. Disparate binding kinetics by an intrinsically disordered domain enables temporal regulation of transcriptional complex formation. Proceedings of the National Academy of Sciences of the United States of America. 2018;115:4643-8
54. Hunter CS, Dixit S, Cohen T, Ediger B, Wilcox C, Ferreira M. et al. Islet alpha-, beta-, and delta-cell development is controlled by the Ldb1 coregulator, acting primarily with the islet-1 transcription factor. Diabetes. 2013;62:875-86
55. Ediger BN, Lim HW, Juliana C, Groff DN, Williams LT, Dominguez G. et al. LIM domain-binding 1 maintains the terminally differentiated state of pancreatic beta cells. J Clin Invest. 2017;127:215-29
56. Janesick A, Wu SC, Blumberg B. Retinoic acid signaling and neuronal differentiation. Cell Mol Life Sci. 2015;72:1559-76
57. Huang M, Weiss WA. Neuroblastoma and MYCN. Cold Spring Harbor perspectives in medicine. 2013;3:a014415
58. Zimmerman KA, Yancopoulos GD, Collum RG, Smith RK, Kohl NE, Denis KA. et al. Differential expression of myc family genes during murine development. Nature. 1986;319:780-3
59. Marshall GM, Carter DR, Cheung BB, Liu T, Mateos MK, Meyerowitz JG. et al. The prenatal origins of cancer. Nat Rev Cancer. 2014;14:277-89
60. Kramer M, Ribeiro D, Arsenian-Henriksson M, Deller T, Rohrer H. Proliferation and Survival of Embryonic Sympathetic Neuroblasts by MYCN and Activated ALK Signaling. The Journal of neuroscience: the official journal of the Society for Neuroscience. 2016;36:10425-39
61. Lochmann TL, Powell KM, Ham J, Floros KV, Heisey DAR, Kurupi RIJ. et al. Targeted inhibition of histone H3K27 demethylation is effective in high-risk neuroblastoma. Science translational medicine. 2018:10
Author contact
![]() Corresponding authors: Yunfu Sun and Xingqun Liang, Shanghai East Hospital, Tongji University School of Medicine, 150 Jimo Road, Shanghai 200120, China. Tel: 86-21-65988605; Email: yfsunedu.cn (Y.S.), Tel: 86-21-61569560; Email: xingqunliangedu.cn (X.L.).
Corresponding authors: Yunfu Sun and Xingqun Liang, Shanghai East Hospital, Tongji University School of Medicine, 150 Jimo Road, Shanghai 200120, China. Tel: 86-21-65988605; Email: yfsunedu.cn (Y.S.), Tel: 86-21-61569560; Email: xingqunliangedu.cn (X.L.).