Impact Factor
- Issue 14; 2026
- Issue 13; 2026
- Issue 12; 2026
- Issue 11; 2026
- Issue 10; 2026
- Volume 16; 2026
- Advance Articles
- Past Issues
- Cover Images
- Cover Suggestion
- Index & Coverage
- Special Issues
Introduction
Materials and methods
Ubiquitination assay
Results
Discussion
Abbreviations
Supplementary Material
Acknowledgements
References
International Journal of Biological Sciences
International Journal of Medical Sciences
 Global reach, higher impact

Theranostics 2019; 9(10):2999-3013. doi:10.7150/thno.31301 This issue Cite
Research Paper
Metabolic enzyme PDK3 forms a positive feedback loop with transcription factor HSF1 to drive chemoresistance
Jinye Xu1, Qiqi Shi1, Wenxia Xu1, Qiyin Zhou2, Rongkai Shi1, Yanning Ma3, Dingwei Chen4, Liyuan Zhu1, Lifeng Feng1, Alfred Sze-Lok Cheng5, Helen Morrison6, Xian Wang2, Hongchuan Jin1 ![]()
1. Laboratory of Cancer Biology, Key Lab of Biotherapy in Zhejiang, Sir Run Run Shaw Hospital, Medical School of Zhejiang University, Hangzhou, China;
2. Department of Medical Oncology, Sir Run Run Shaw Hospital, Medical School of Zhejiang University, Hangzhou, China;
3. Department of Radiation Oncology, Shunde Hospital, Southern Medical University, China;
4. Department of Surgery, Sir Run Run Shaw Hospital, Medical School of Zhejiang University, Hangzhou, China;
5. School of Biomedical Sciences, The Chinese University of Hong Kong;
6. Institute of Molecular Cell Biology, Jena University Hospital, Jena, Germany.
Received 2018-11-7; Accepted 2019-4-11; Published 2019-5-9
Abstract

Background & Aims: Dysregulation of metabolism plays an important role in the development and progression of cancers, while the underlying mechanisms remain largely unknown. This study aims to explore the regulation and relevance of glycolysis in chemoresistance of gastric cancer.
Methods: Biochemical differences between chemoresistant and chemosensitive cancer cells were determined by metabolism profiling, microarray gene expression, PCR or western blotting. Cancer cell growth in vitro or in vivo were analyzed by viability, apoptosis and nude mice assay. Immunoprecipation was used to explore the interaction of proteins with other proteins or DNAs.
Results: By metabolic and gene expression profiling, we found that pyruvate dehydrogenase kinase 3 (PDK3) was highly expressed to promote glycolysis in chemoresistant cancer cells. Its genetic or chemical inhibition reverted chemoresistance in vitro and in vivo. It was transcriptionally regulated by transcription factor HSF1 (Heat shock factor 1). Interestingly, PDK3 can localize in the nucleus and interact with HSF1 to disrupt its phosphorylation by GSK3β. Since HSF1 was subjected to FBXW7-catalyzed polyubiquitination in a phosphorylation-dependent manner, PDK3 prevented HSF1 from proteasomal degradation. Thus, metabolic enzyme PDK3 and transcription factor HSF1 forms a positive feedback loop to promote glycolysis. As a result, inhibition of HSF1 impaired enhanced glycolysis and reverted chemoresistance both in vitro and in vivo.
Conclusions: PDK3 forms a positive feedback loop with HSF1 to drive glycolysis in chemoresistance. Targeting this mitonuclear communication may represent a novel approach to overcome chemoresistance.
Keywords: chemoresistance, glycolysis, PDK3, HSF1, metabolism
Introduction
Despite of rapid progression in precision oncology, systemic chemotherapy remains the major treatment for most cancer patients, especially for cancers with limited targeted therapy options such as gastric cancer. Resistance to chemotherapy or chemoresistance represents the biggest challenge for cancer therapy. Nearly all cancer patients exhibit intrinsic or acquired chemoresistance, leading to the treatment failure and unsatisfied overall survival. There is an urgent need to understand molecular mechanisms underlying chemoresistance and develop effective approaches targeting chemoresistance.
Chemoresistance is a result of complex reprogrammed processes such as drug exportation/importation, drug detoxification, DNA damage repair and apoptosis [1]. Recently, the relevance of metabolic regulation to chemoresistance received great attention [2-5]. More and more efforts have been put on targeting metabolism to overcome chemoresistance [6].
Actually, remodeled metabolism featured by enhanced glycolysis has been recognized to drive cancer development and progression [7]. Being firstly reported by Otto Warburg in 1924, reprogramming glucose metabolism from oxidative phosphorylation (OXPHOS) to glycolysis, now named as Warburg effect, has been defined as one of the most common hallmarks of cancers [8]. In addition to providing energies and building blocks essential for biosynthesis, metabolic enzymes in enhanced glycolysis can participate in the propagation of oncogenic signaling to support proliferation and survival [9]. Meanwhile, many intermediate metabolites are bioactive messengers regulating the activity of many signaling molecules and transcription factors [10-12].
While targeting glycolysis indeed exerted strong anti-tumor effects [13], the underlying mechanisms for deregulated metabolism in cancer cells remain largely unclarified. Previously, we and others have reported that both genetic and epigenetic alternations contributed to the rewired metabolism in carcinoegene-sis [2, 3, 14, 15]. Herein, we reported that pyruvate dehydrogenase kinase 3 (PDK3) was highly expressed in chemoresistant cancer cells. Its genetic or chemical inhibition reverted chemoresistance in vitro and in vivo. Being transcriptionally regulated by transcription factor HSF1 (Heat shock factor 1), PDK3 protein also interacted with HSF1 to prevent its ubiquitination-dependent degradation. Therefore, targeting the feedback loop of PDK3 and HSF1 may represent a novel approach to overcome chemoresistance.
Materials and methods
Cell culture and small chemical inhibitors
All cell lines were obtained from the Type Culture Collection of the Chinese Academy of Sciences (Shanghai, China). Drug resistant cells SGC-R and BGC-R cells were developed from SGC7901 and BGC823, respectively [16]. All cell lines were cultured as previously reported. The chemical reagents including Dichloroacetic acid (DCA) (D54702), KNK437 (SML0964), Cycloheximide (R750107), chloroquine (C6628), MG132 (474790) and PD150606 (D5946) were purchased from Sigma Aldrich (USA). MLN4924 (B1036) and radicicol (A4067) were purchased from ApexBio (USA). Cisplatin and KRIBB11 (S840201) were obtained from Selleck (Shanghai, China).
SiRNAs and plasmids
Small interfering RNA (siRNA) targeting HSF1, PDK3, FBXW7, β-TRCP1, and HIF1ɑ were synthesized by Genepharma (Shanghai, China). The sequence of these siRNAs were listed in Table S1.SiRNAs were transfected into cells seeded overnight by Lipofectamine RNAiMAX transfection reagent (Invitrogen, USA). The Flag-HSF1 plasmid was commercially available from OligoEngine Corporation (USA). The mutation of Lys80 (K80Q) in HSF1 with deficiency of transcription activity was generated using Quick Change Site-Directed Mutagenesis (Stratagene, USA) [17]. The primer was showed in Table S2. The pCMV3-Myc-PDK3 plasmid was obtained from Sino Biological Inc (China). The X-treme GENE HP DNA Transfection Reagent (Roche, USA) was employed to transfect the plasmids. After transfection for 48 to 72 hours, the cells were used for RNA isolation, immunoblotting and other assays.
RNA isolation and PCR
Total RNA was extracted with Trizol reagent (Invitrogen, USA) and quantified with NanoDrop 2000 (Nanodrop, USA). 2 μg total RNA was reverse transcribed with High-Capacity cDNA Reverse Transcription Kit (Applied Biosystems, USA). The relative expression of mRNA level was determined by quantitative real-time PCR (qRT-PCR) with the SYBR Green Master reagents (Applied Biosystems, USA). The primers were displayed in Table S2.
Chromatin immunoprecipitation (ChIP)
ChIP analysis was conducted with the SimpleChIP™ Enzymatic Chromatin IP Kit (CST, USA) as previously described [18]. Antibodies used were anti-HSF1 (CST, 1: 100) or negative control anti-IgG. The primers used for the PCR analysis of precipitated DNA were shown in Table S2.
Luciferase reporter assay
PDK3 promoter including the HSF1 binding sites was cloned and inserted into the PGL3-enhance vectors (Promega Corporation, USA). The constructed plasmid was cotransfected with pRL renilla and HSF1 or PDK3 plasmids in HEK293 cells. The luciferase activities were measured by the Dual-GLO Luciferase Assay System (Promega Corporation, USA) after transfection for 48 hours.
Immunoblotting, Immunoprecipitation and Immunohistochemistry
Immunoblotting, immunopreciptation (IP) and immunohistochemistry (IHC) assays were performed as previously reported [19]. For immunoblotting, total proteins were extracted with RIPA buffer supplemented with protease inhibitors (Roche, USA) and quantified with BSA standard methodology. Primary antibodies used were listed in Table S3. For immunoprecipitation, cells were washed with PBS and lysed in NP40 buffer containing 20 mM Tris-HCl (PH 7.4), 150 mM NaCl, 1%NP40, 10% glycerol and protease inhibitor on ice for 30 minutes with rotation. Primary antibodies used were anti-HSF1 (Abcam, 1: 100), anti-Myc (CST, 1: 200), anti-Flag (Sigma, 1:200). For IHC assay, antibodies used were anti-cleaved-Caspase 3 (CST, 1: 100) and HRP-conjugated secondary antibody.
Ubiquitination assay
To determine the effect of PDK3 on FBXW7-induced HSF1 polyubiquitination, HEK293 cells were co-transfected with HSF1, PDK3, FBXW7, and His-HA-Ub. 42 h after transfection, the cells were exposed with MG132 for 6 h. Cells were harvested and lysed in 6 M guanidinium denaturing solution as previously reported [20]. HSF1-poly-ub was purified with Ni-bead pull-down and detected by immunoblotting with HSF1 antibody.
GST-pull down
The fragments of HSF1 were cloned by PCR and inserted into the pGEX-4T-1 vector (GE Healthcare Life Science, USA). The primers used were displayed in Table S2. The recombinant proteins were expressed in Escherichia coli BL21 and purified with glutathion Sepharose 4B (GE Healthcare Life Science, USA). Immobilized GST-HSF1 fusion proteins were employed to capture myc-PDK3 expressed in HEK293 cells. Bound proteins were eluted with 2 × SDS loading Buffer and subjected to immunoblotting.
Nuclear-cytoplasmic fractionation
Isolation of nuclear and cytoplasmic extract was performed with a Nuclear Cytoplasmic Extraction Reagent kit (Thermofisher Scientific, USA) as previously described [21].
Immunofluorescence and confocal microscopy
Cells seeded on coverslips overnight and exposed to MitoTracker Deep Red FM (Invitrogen, USA) at 37 °C for 30 min were fixed and permeabilized with methanol and 0.2% Triton X-100, respectively. After incubating with 3% BSA, the cells were incubated with the antibodies of HSF1 (Abcam, 1: 200), Myc (CST, 1: 200), or PDK3 (Santa Cruz, 1: 200) overnight at 4 °C in a humid chamber. Then appropriate secondary antibodies were added to the coverslips. The images were analyzed and captured by a Nikon A1 laser scanning confocal microscope (Nikon, Japan) after staining the nucleus with DAPI.
Metabolism analysis
For PDH activity assay, 100 million cells were lysed in the PDH assay buffer and intracellular PDH activity was determined with the PDH activity assay kit (BioVision, USA) based on the manufacturer's protocol. The concentrations of glucose, lactate and pyruvic in the culture medium were measured using Abbott ArchitectC16000 kit (Abbott Park, USA), Lactic Acid assay kit and Pyruvate assay kit (Nanjing Jiancheng, China), respectively. The untargeted metabolomics analysis of cells as indicated were performed by gas chromatography time-of-flight mass spectrometry (GC-TOF/MS) as previously reported [22]. In brief, cell pellets and cell medium of each cells with three replicates were harvested, dried and derivatized with methoxyamine and MSTFA (1% TMCS) containing FAMEs. One μL derivatized solution was injected an Agilent 7890B gas chromatography coupled on time-of-flight mass spectrometry system (Pegasus HT, Leco Corp., St. Joseph, MO, USA). The relative abundance due to discrepancy in sample preparation including derivatization efficacy was compensated with the addition of internal standards including 13C-Glucose. The pooled biological QC samples were employed as the quality control (QC) samples. The median of the metabolite variations was below 20% and any signal with variations greater than 20% was rejected for the data analysis. The acquired raw data were processed with the software XploreMET (v3.0), Metabo-Profile, Shanghai, China.
Measurement of mitochondrial membrane potential and Reactive Oxygen Species (ROS)
Mitochondrial membrane potential was assessed with a Mitochondria Staining Kit (JC-1) (MultiSciences, China) based on the manufacturer's protocol as previously described [23]. ROS generation in living cells was prepared with the DCFDA / H2DCFDA - Cellular ROS Assay Kit (Abcam, UK) and analyzed by flow Cytometry.
Cell viability and flow cytometer assay
After treatment with indicated drugs, the cell viability was detected by adding the CellTiter 96 AQueous Non-Radioactive Cell Proliferation Assay reagent (Promega, American). Cell apoptosis was measured by flow cytometry analysis as previously reported [19].
In vivo tumorigenicity
All the animal care and experiments were performed in compliance with protocols approved by the Institutional Animal Care and Use Committee and NIH guidelines. 2 million MFC cells were injected subcutaneously into the dorsal left flank of female Balb/c nude mice (6-8 weeks old) (n=5 per group). Treatment began when tumors reached a volume of 100-150 mm3. The mice in 1# group were treated with DMSO as the control. The mice in 2# group were intraperitoneally injected with KNK437 (10 mg/kg) once every three days. The mice in 3# group were treated with DCA daily (0.5 g/L in drinking water) [24]. The mice in 4# group were intraperitoneally injected with 5 mg/kg cisplatin once every 5 days. The mice in 5# group were treated with the combination of KNK437 and cisplatin and the mice in 6# group were treated with combination of DCA and cisplatin. Tumor sizes were measured every 3 days using caliper to plot growth curve as previously described [19].
Bioinformatics analysis
To identify the association of glycolysis with chemoresistant cells, global gene expression profiles in BGC-R and SGC-R cells as well as their parental chemosensitive cells, BGC823 and SGC7901 was analyzed with Gene Set Enrichment Analysis (GSEA) using the GSEA 3.0 software (http://www.broadinstitute.org/gsea/), the Gene Set of Hallmark -glycolysis which contains the most comprehensive genes involved in glycolysis from MsigDB was employed for GSEA [25].
Kaplan-Meier analysis of the overall survival (OS) and progression-free survival (PFS) in GC cohorts according to PDK3 mRNA expression were achieved by using an online tool (http://www.kmplot.com) and the best cut-point was employed as the cutoff.
Statistical Analysis
Principal component analysis (PCA) was conducted to detect metabolite patterns clustering and classification trends by packages in R studio (http://cran.r-project.org/). Student's t test or one-way analysis of variance (ANOVA) was used for comparison between two groups and multiple comparisons respectively. P<0.05 was respected as statistically significant and all data was presented as mean ± SD. All experiments were conducted three times independently under similar conditions, unless otherwise specified.
Results
PDK3 is upregulated in chemoresistant cancer cells
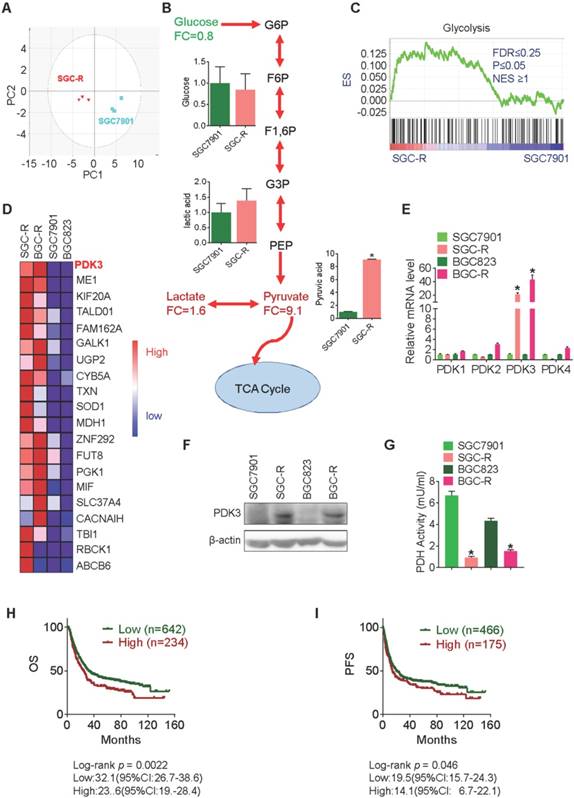
In our previous study, glycolysis was found to be enhanced in intrinsic chemoresistant cancer cells MGC803, and acquired chemoresistant cancer cells BGC-R [2]. We confirmed this phenomenon in another chemoresistance cancer cell line, SGC-R, by performing a time-of-flight mass spectrometry (GC-TOF/MS) based analysis (Figure 1A and 1B). To identify the association of glycolysis with chemoresistant cells, global gene expression profiles in BGC-R and SGC-R cells as well as their parental chemosensitive cells, BGC823 and SGC7901 was analyzed with Gene Set Enrichment Analysis (GSEA) using the GSEA 3.0 software (http://www.broadinstitute.org/gsea/) [25]. As a result, genes involved in glycolysis were significantly enriched in chemoresistant cells (Figure 1C). Among these deregulated glycolysis-associated genes, PDK3 was the most upregulated gene in chemoresistant cells (Figure 1D). Both PDK3 mRNA and protein were upregulated in two chemoresistant cells (Figure 1E and 1F), accompanied by the reduced activity of pyruvate dehydrogenase (PDH) (Figure 1G). However, the expression of other PDKs including PDK1, PDK2, and PDK4 were not increased in chemoresistant cells (Figure 1E). Importantly, increased PDK3 expression was associated with unfavorable overall survival (OS) and progression free survival (PFS) (Figure 1H and 1I). Together, these results indicate that PDK3 might be important for enhanced glycolysis and chemoresistance.
PDK3 is upregulated in chemoresistant cancer cells. A, Principal component analysis (PCA) sore plots based on Glycosis&TCA metabolite profiles obtained from GC-TOF/MS analysis of SGC-R and SGC7901 cells. B, Metabolites changes in the glycolytic pathway in SGC-R and SGC7901 cells were detected by GC-TOF/MS. C, Gene expression profile of chemoresistant cells and their parental cells was analyzed by GSEA enrichment. D, Heatmap analysis of expression levels of genes in glycolytic pathway. E, The relative expression of PDKs mRNA levels in SGC-R, BGC-R and their parental chemosensitive cell lines (SGC7901 and BGC823). F, Immunoblot analysis of the protein expression of PDK3 in chemoresistant GC cells and their parental cells. G, PDH activitie was detected by PDH assay in chemoresistant cells relative to their parental cells. H and I, Kaplan-Meier analysis of the overall survival (OS) and progression-free survival (PFS) in GC cohorts according to PDK3 mRNA expression were achieved by using an online tool (http://www.kmplot.com) and the best cut-point was employed as the cutoff. Log-rank p-values and hazard ratios (HRs; 95% confidence interval in parentheses) were shown.
PDK3 drives glycolysis to promote chemoresistance
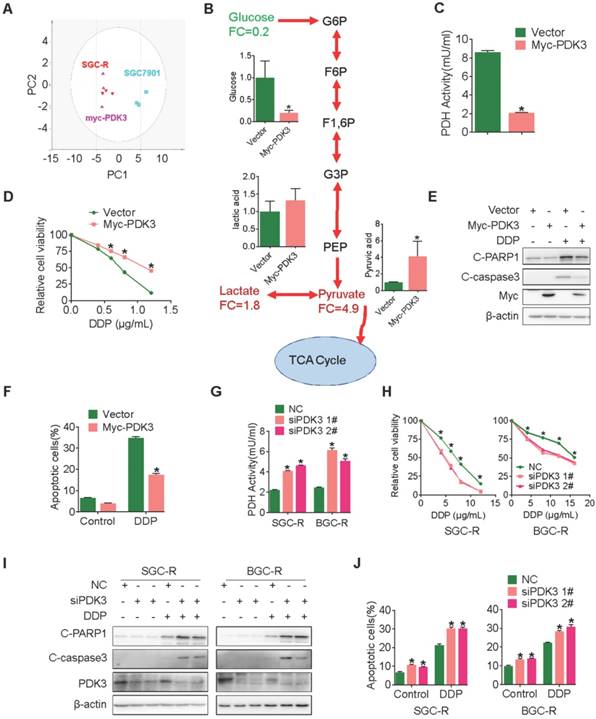
To confirm this proposal, we performed GC-TOF/MS based metabonomics analysis in cancer cells with ectopic PDK3 expression. Similar with chemoresistant cells, PDK3-overexpressing cells displayed a distinguished glycolysis metabolism profile from the parental SGC7901 cells (Figure 2A and 2B). Consistently, the PDH activity and the production of ROS were decreased in SGC701 cells with PDK3 overexpression (Figure 2C and S1E), whereas the glucose consumption, the production of pyruvic acid and lactic acid were upregulated and the mitochondrial membrane was depolarized (Figure S1A-D). In addition, PDK3 overexpression significantly reduced sensitivity to chemotherapeutic drug cisplatin (DDP) (Figure 2D) and drug-induced apoptosis activation in drug-sensitive cancer cells (Figure 2E, 2F and S1K). In contrast, knockdown of PDK3 expression in drug resistant cells increased PDH activity (Figure 2G), inhibited glycolysis (Figure S1F-H), restored mitochondrial functions (Figure S1I and SIJ) and exacerbated DDP induced viability inhibition (Figure 2H) and apoptosis activation (Figure 2I, 2J and S1L). In conclusion, PDK3 is upregulated in chemoresistant cancer cells to promote glycolysis and chemoresistance.
PDK3 drives glycolysis to promote chemoresistance. A, Principal component analysis (PCA) sore plots based on Glycosis&TCA metabolite profiles obtained from GC-TOF/MS analysis of SGC-R cells, stable PDK3 overexpression SGC7901 cells and the control SGC7901 cells. B, Metabolites changes in the glycolytic pathway induced by PDK3 overexpression were detected by GC-TOF/MS. C, PDH activity in SGC7901 cells with stable PDK3 expression was measured as in Figure 1G. D, SGC7901 cells with stable PDK3 expression were treated with various doses of DDP for 24 h and MTS was performed to detect their viability. E, Effect of PDK3 overexpression on c-PARP1 and c-caspase3 levels in SGC7901 cells treated with or without DDP were determined by immunoblot analysis. F, Effect of PDK3 overexpression on DDP-induced apoptosis of SGC7901 cells was determined by Flow cytometry analysis after PI and Annexin-V staining. G, PDH activity in chemoresistant cells with PDK3 knock-down was measured as in 2C. H, The effect of PDK3 knock-down on DDP-induced viability inhibition of chemoresistant cells were analyzed by MTS assay. I, Effect of PDK3 knock-down on DDP-induced cleavage of PARP1 and caspase3 were determined by immunoblot analysis. J, Effect of PDK3 knock-down on DDP-induced apoptosis of chemoresistant cells was determined by Flow cytometry analysis as in 2F.
Chemical inhibition of PDK3 impaires glycolysis to reverse chemoresistance
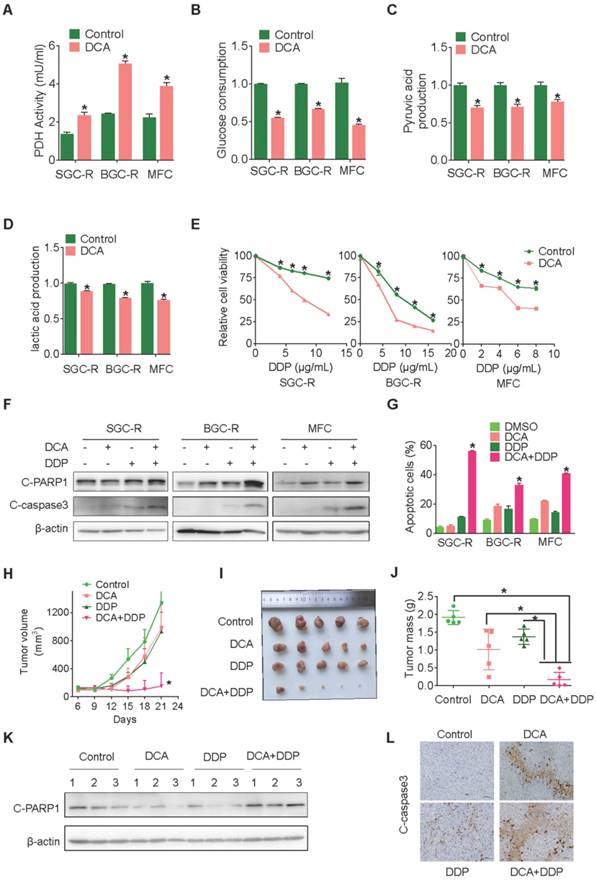
These results indicate that PDK3 might be a reasonable target to overcome chemoresistance. Indeed, once glycolysis was suppressed by its chemical inhibitor DCA (Dichloroacetate) (Figure 3A-D), both intrinsic and acquired chemoresistant cancer cells restored DDP sensitivity and displayed more drug-induced apoptosis (Figure 3E-G and S2C). Similar to DCA, another inhibitor of PDK3 radicicol also displayed strong ability to overcome drug resistance (Figure S2E-H). Importantly, the combination of DCA and DDP dramatically retarded tumor growth and activated apoptosis, while either DCA or DDP alone had neglect effects on the in vivo growth of chemoresistant cells (Figure 3H-L).
Chemical inhibition of PDK3 impaired glycolysis to reverse chemoresistance. A, PDH activity in chemoresistant cells with or without DCA treatment were determined as in 1G. B-D, Glucose consumption (B) and production of pyruvic acid (C) or lactic acid (D) in chemoresistant cells were measured after exposure to 10 mM DCA for 6 h. E, Viability of various cells treated with various doses of DDP and DCA were evaluated by MTS assay. F and G, Apoptosis of SGC-R, BGC-R and MFC cells after treatment with DCA and/or DDP (6 mg/ml) were analyzed by immunoblot (F) and flowcytometry analysis (G). H-J, MFC cells were used for in vivo tumorigenicity analysis. Tumour sizes were measured every 3 days using caliper to plot growth curve (H) and tumor mass were weighted at the end of experiment (I and J). K and L, Cleaved PARP1 or caspase-3 in tumor tissues were evaluated by immunoblot analysis (K) or immunohistochemistry staining (L), respectively.
HSF1 stimulates PDK3 transcription
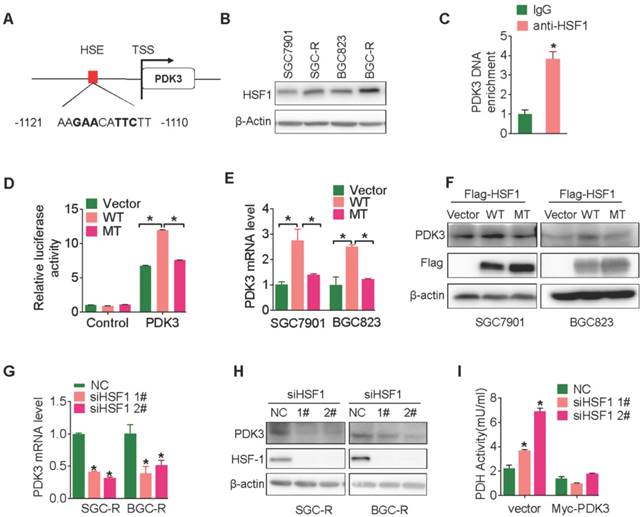
Next, we wondered how PDK3 was upregulated in chemoresistant cells. It has been reported that the expression of PDK3 can be regulated by hypoxia-inducible factor-1α (HIF1α) [26]. However, PDK3 expression was not reduced in chemoresistant cells after depleting HIF1α (Figure S3A). We screened putative transcription factor binding sites in a region upstream to the transcription start site (TSS) of the PDK3 gene locus (PROMO, http:// alggen.lsi.upc.es/cgibin/promo_v3/promo/promoinit.cgi?dirDB=TF_8.3) [27] and identified a classical potential binding sites (nGAAnnTTCn) of heat shock factor 1 (HSF1) (Figure 4A) [28], which is a key regulator in cancer development and metabolism reprogramming [19, 29]. Furthermore, HSF1 expression was increased in chemoresistant cells relative to their parental chemosensitive cells (Figure 4B). Chromatin Immunoprecipitation (ChIP) analysis indeed revealed that HSF1 bound to PDK3 promoter (Figure 4C) and increased HSF1 occupancy at this site occurred in SGC-R cells than in the parental SGC7901 cells (Figure S3B). Moreover, HSF1 significantly stimulated PDK3 promoter-driven luciferase activty (Figure 4D). PDK3 expression was upregulated by wild type HSF1 but not HSF1 mutant with deficiency of transcription activity (Figure 4E, 4F, S3C and 3D). Conversely, both the mRNA and protein level of PDK3 were markedly downregulated after knocking down HSF1 (Figure 4G and 4H). As a result, PDH activity was increased by HSF1 knockdown, which was rescued by PDK3 overexpression (Figure 4I and S3E). In summary, these results demonstrate that HSF1 promotes PDK3 transcription in chemoresistant gastric cancer cells.
HSF1 stimulates PDK3 transcription. A, Schematic diagram of putative HSF1-binding sequence within a region 2000bp upstream to the TSS (transcription start site) of human PDK3. B, Immunoblot analysis of the protein expression of HSF1 in chemoresistant GC cells and their parental cells. C, The binding of HSF1 to PDK3 promoter was assessed by ChIP assay in SGC-R cells. D, PDK3 promoter-driven activity in the presence of wide-type (WT) or DNA-binding deficiency mutant (MT) HSF1 were analyzed in HEK293 cells by Luciferase reporter assay. E and F, The effect of WT or MT HSF1 on PDK3 expression in chemosensitive cells were analyzed by RT-PCR (E) and immunoblot (F) analysis. G-I, The effect of HSF1 knock-down on PDK3 mRNA. (G), PDK3 protein (H) and PDH activity (I) were determined by as previously described.
PDK3 upregulates HSF1 protein expression by preventing its degradation
Surprisingly, PDK3 overexpression significantly upregulated HSF1 expression (Figure S3E and Figure 5A), indicating that PDK3 may affect HSF1 protein expression in a positive feedback manner. Indeed, PDK3 overexpression increased the transcriptional activity of HSF1 (Figure 5B) and stimulated the expression of HSF1 downstream targets (Figure S4A). On the other hand, knockdown of PDK3 indeed reduced HSF1 expression, transcriptional activity and the expression of its targets (Figure 5C, 5D, and S4B).
PDK3 upregulates HSF1 protein expression by preventing its degradation. A, Immunoblot analysis of HSF1 levels in chemosensitive GC cells with or without PDK3 overexpression. B, The effect of PDK3 overexpression on HSF1 reporter activity in HEK293 cells was analyzed by luciferase reporter assay. C and D, The effect of PDK3 knockdown on HSF1 expression (C) and activity (D) were evaluated as in A and B, respectively. E, The half-life of HSF1 protein in SGC-R cells pretreated with cycloheximide (50 μg/mL) were determined by immunoblot analysis. F, HSF1 proteins in SGC-R cells before and after PDK3 knock-down were immunoprecipitated by anti-HSF1 antibody and blotted with anti-ubiquitin antibody. G, HSF1 protein expression in SGC-R and BGC-R cells with or without PDK3 and FBXW7 knock-down were detected by immunoblot analysis. H, The interaction of HSF1 with FBXW7 in SGC7901 cells with or without PDK3 overexpression was analyzed by co-imunoprecipitation. I, HSF1 ubiquitination before and after PDK3 overexpression was analyzed by uiquitination assay.
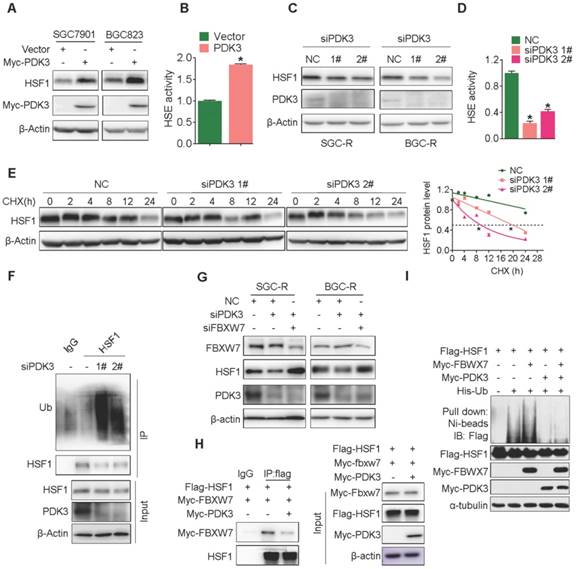
However, HSF1 mRNA levels were not altered upon PDK3 overexpression or knockdown (Figure S5A and S5B). Moreover, HSF1 protein became unstable once PDK3 was knocked down (Figure 5E), while the protein half-life of HSF1 was significantly prolonged in SGC7901 cells with PDK3 over-expression and SGC-R cells (Figure S5C and S5D). Given that HSF1 was subjected to ubiquitination mediated protein degradation rather than autophagic degradation or calpain-dependent proteolysis (Figure S6A) [30], we explored the effect of PDK3 knockdown on HSF1 ubiquitination. As shown in Figure 5F, poly-ubiquitination of HSF1 was significantly increased after PDK3 knockdown. Two SCF E3 ubiquitin ligases FBXW7 and β-TrCP1 have been reported to catalyze HSF1 ubiquitylation [31, 32]. Indeed, MLN4924, a special inhibitor of SCF E3 ubiquitin ligases, was able to upregulate HSF1 protein levels (Figure S6B). However, knockdown of FBXW7 but not β-TrCP1 significantly increased the expression of HSF1 (Figure S6C and S6D). Moreover, the protein level of HSF1 was reduced upon FBXW7 transfection (Figure S6E). And, it could interact with HSF1 (Figure S6F). Importantly, knockdown of FBXW7 succeeded to reverse siPDK3-induced reduction of HSF1 protein levels (Figure 5G). Moreover, PDK3 overexpression weakened the interaction of HSF1 with FBXW7 (Figure 5H), and inhibited FBXW7-induced HSF1 polyubiquitination (Figure 5I). Collectively, PDK3 upregulated HSF1 protein expression by preventing its FBXW7-dependent degradation.
PDK3 interacts with HSF1 to disrupt its phoshorylation by GSK3β
As FBXW7-induced HSF1 polyubiquitination occurred in the nucleus [32], we then examined the intracellular distribution of PDK3. Interestingly, PDK3 localized both in the cytoplasm and the nucleus (Figure 6A-C). Importantly, PDK3 was able to bind HSF1 (Co-IP assay, Figure 6D and 6E), and co-localized with HSF1 in the nucleus (Figure 6F and S7A).
PDK3 interacts with HSF1 to disrupt its phoshorylation by GSK3β. A, Immunofluorescence staining assay of intracellular distribution of exogenous PDK3 in SGC7901 cells. myc-PDK3: green; the mitochondrial marker MitoTracker: red; the nuclear marker DAPI: blue. B and C, Immunoblot analysis of the nuclear or cytoplasm distribution of exogenous (B) and endogenous (C) PDK3 in chemoresistant cells. D and E, The interaction of PDK3 with HSF1 was analyzed by co-immunoprecipitation. (D, HEK293 cells with exogenous PDK3 and HSF1 expression; E, SGC-R cells with endogenous PDK3 and HSF1 expression). F, Co-localization of PDK3 with HSF1 in chemoresistant cells were analyzed under confocal microscopy. PDK3: red; HSF1: green; DAPI: blue. G and H: The interaction region responsible for the interaction of PDK3 with HSF1 was defined by GST-pull down assay. I, Serine phosphorylation of HSF1 in SGC7901 cells before and after PDK3 overexpression were detected by immunoblot analysis. p-HSF1 (S303+S307): 303/307 serine phosphorylation specific antibody; p-serine: serine phsohorylation specific anitbody. J, the interaction of HSF1 with ERK1/2 or GSK3β in SGC7901 cells before and after PDK3 expression was analyzed by immunoprecipitation.
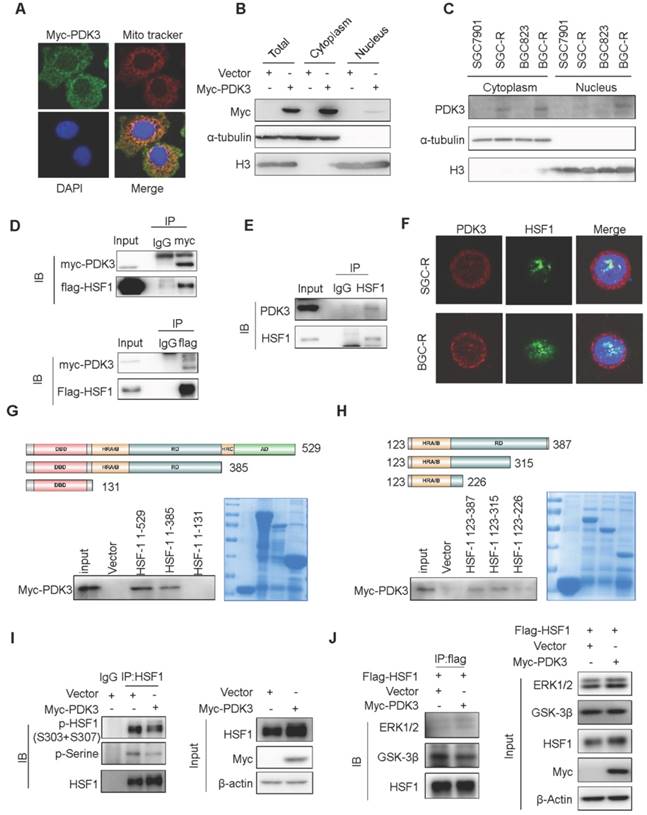
To identify the essential region of HSF1 required to bind PDK3, a series of GST-tagged HSF1 protein was constructed to pull down PDK3. It was revealed that the 226-315 region of HSF1 in the regulatory domain is critical to its interaction with PDK3 (Figure 6G and 6H). It has been reported that GSK3β and ERK1/2 could phosphorylate HSF1 at serine 303 or 307 in this region to promote its interaction with FBXW7, respectively [32]. We found that PDK3 disrupted the interaction of HSF1 with GSK3β but not ERK1 and reduced serine 303/307 phosphorylation (Figure 6I and 6J). Furthermore, downregulation of GSK-3β caused the SGC7901 cells more insensitive to chemotherapeutic drug cisplatin (DDP) than high expression HSF1 alone (Figure S7B).Taken together, these data demonstrate that PDK3 interacts with HSF1 to disrupt its interaction with GSK3β, thus attenuating its phosphorylation-dependent polyubiquitination.
HSF1 stimulates glycolysis to confer chemoresistance
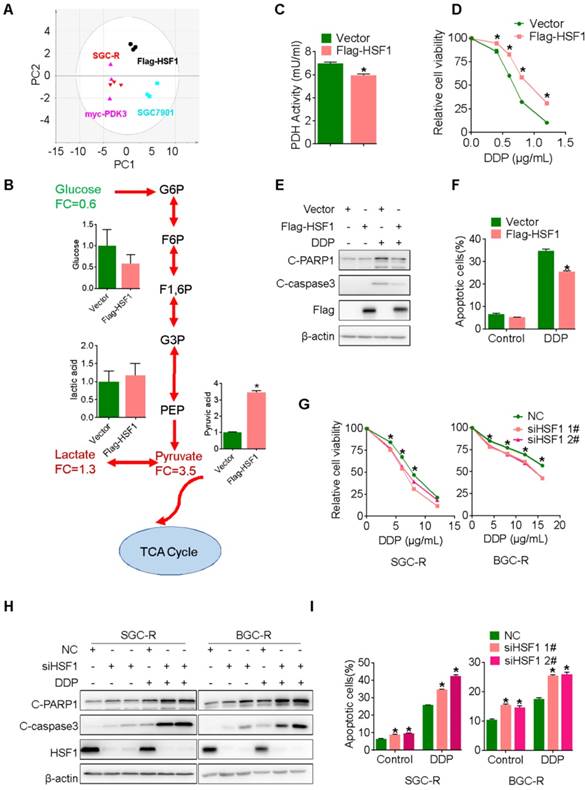
Since PDK3 is transactivated by HSF1, we wondered whether HSF1 is involved in elevated glycolysis. The metabolic alterations in SGC7901 cells with HSF1 overexpression was profiled by GC-TOF/MS. The glucose metabolism in HSF1 over-expressing cells displayed a clear separation from the parental cells and resembled SGC-R and PDK3 over-expressing cells (Figure 7A and 7B). Besides, the PDH activity was also inhibited in the presence of HSF1 overexpression (Figure 7C), whereas the glucose consumption, the production of pyruvic acid and lactic acid were upregulated (Figure S8A-C). Consistent with previous results in PDK3 over-expressing cells, the viability inhibition and apoptosis activation induced by DDP were attenuated in HSF1 over-expressing cells (Figure 7D-F and S8G). In contrast, HSF1 knockdown decreased the glucose consumption, the production of pyruvic acid and lactic acid (Figure S8D-F), and sensitized cancer cells to DDP treatment (Figure 7G-I and S8H). Collectively, these findings suggest that HSF1 stimulates glycolysis to confer chemoresistance.
HSF1 stimulates glycolysis to confer chemoresistance. A, Principal component analysis (PCA) sore plots based on Glycosis&TCA metabolite profiles obtained from GC-TOF/MS analysis of various cells as indicated. B, The effect of HSF1 overexpression on glycolysis metabolites in SGC7901 cells was detected by GC-TOF/MS. C, The effect of HSF1 overexpression on PDH activity was analyzed as 1G. D-F, The effect of HSF1 overexpression on DDP-induced viability inhibition (D, MTS assay), and apoptosis activation (E, PARP1 and caspase-3 cleavage; F, PI and Annexin-V staining). G-I, The effect of HSF1 knock-down on DDP-induced viability inhibition (G, MTS assay), and apoptosis activation (H, PARP1 and caspase-3 cleavage; I, PI and Annexin-V staining).
Chemical inhibition of HSF1 reverses chemoresistance
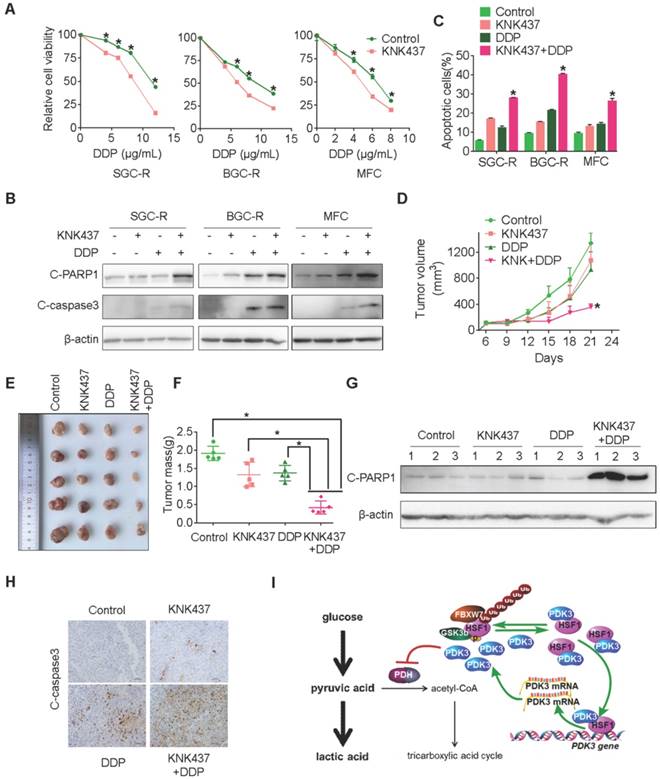
Next, we explored whether the chemical inhibitor of HSF1 could overcome chemoresistance by targeting glycolysis. KNK437, a well-used inhibitor of HSF1 [33], showed strong ability to potentiate chemotherapy induced viability inhibition and apoptosis activation in chemoresistant cells (Figure 8A-C and S9B). Similarly, KRIBB11, another inhibitor of HSF1, also displayed strong ability to reverse chemoresistance (Figure S9D-G). In line with these in vitro findings, the combination of KNK437 with DDP significantly retarded tumor growth of gastric cancer cells in vivo (Figure 8D-F). Compared to any single agent, more apoptotic cells were found after the combined treatment of KNK437 and DDP (Figure 8G and 8H). In summary, the chemical inhibitor of HSF1 could synergize with chemotherapy both in vitro and in vivo, indicating that targeting may be an effective strategy to overcome chemoresistance.
Chemical inhibition of HSF1 reverses chemoresistance. A, Viability of various cells treated with or without DDP and KNK437 were evaluated by MTS assay. B and C, Apoptosis of various cells treated with or without DDP and KNK437 were evaluated by immunoblot (B, PARP1 and caspase-3 cleavage), and flowcytometry analysis (C, PI and Annexin-V staining). D-F, Nude mice treated as indicated were applied to evaluate the effect of KNK437 and DDP on tumorigenicity of MFC cells as in 3H-J. G and H, Cleaved PARP1 or caspase-3 in tumor tissues were evaluated by immunoblot analysis (G) or immunohistochemistry staining (H), respectively. I, working model: PDK3 was increased as a result of HSF1-driven transcription. It can not only stimulate glycolysis by inhibiting the activity of PDH in the mitochondria, but also directly interacted with HSF1 to protect it from FBXW7-dependent polyubiquitination and degradation. Thus, the metabolic enzyme PDK3 and transcription factor HSF1 forms a positive feedback loop to promote glycolysis and chemoresistance.
Discussion
In spite of many progresses, chemoresistance remains the major hurdle of successful management of gastric cancer (GC). Cisplatin (DDP) based chemotherapy is the most commonly used first-line chemotherapy regiment in perioperative and advanced gastric cancer [34]. Unfortunately, more than half of patients exhibit intrinsic or acquired drug tolerance and the overall 5-year survival rates for gastric cancer patients is approximately 20% in most countries [35]. Multiple molecular pathways have been reported to contribute to chemoresistance in gastric cancer. However, effective approaches to prevent or revert chemoresistance are unavailable in the clinic. In this report, we identify a novel positive feedback loop consisted of metabolic enzyme PDK3 and transcription factor HSF1 to drive chemoresistance in gastric cancer. Interfering with this feedback loop might be an effective targeted approach to overcome chemoresistance.
Reprogramming glucose metabolism from oxidative phosphorylation (OXPHOS) to glycolysis even in the absence of hypoxia, known as the Warburg effect, is one of the well-recognized hallmark of cancer cells [7]. By metabolism profiling, we found a significant difference of glucose metabolism in chemoresistant gastric cancer cells (Figure 1). Enhanced glycolysis serves to rapidly generate the energy and biosynthetic intermediates to maintain malignant behavior of cancer cell [8]. Indeed, inhibiting glycolysis successfully reverted chemoresistance [2]. While its relevance to cancer development has been noticed for a long time, the molecular mechanism underlying the Warburg effect remains unclear. Pyruvate dehydrogenase (PDH) complex are the key metabolic regulators, catalyzing an irreversible reaction of pyruvate to acetyl-CoA by oxidative decarboxylation [36]. By suppressing this reaction via phosphorylating the E1 moiety of the PDH complex, PDKs play crucial roles in the metabolism reprogramming of cancer cells [37]. We found that the expression of PDK3, but not other PDKs, was elevated in chemoresistant gastric cancer cells (Figure 1). Ectopic PDK3 expression enhanced glycolysis and promoted chemoresistance, while the mitochondrial functions were inhibited (Figure 2). In contrast, genetic knockdown or chemical inhibition of PDK3 succeeded to reverse chemoresistance through inhibiting glycolysis (Figure 3). Interestingly, overexpression of PDK3 contributed to drug resistance in colorectal cancer and poor clinical outcome in colorectal cancer [38]. All of these results indicate that targeting PDK3 to inhibit glycolysis might be an effective approach to overcome chemoresistance in human cancers.
Genetic mutations in PDK3 and other PDKs seem to be rare in human cancers, indicating the importance of elevated expression in the increase of PDK3 activity. In chemoresistant cancer cells, both mRNA and protein level of PDK3 were increased. While we could not rule out the possible involvement of post-transcriptional regulation of PDK3 expression in certain circumstance, we proposed that transcription regulation of PDK3 expression is dominant in chemoresistance. Herein, for the first time we found that PDK3 is a direct target of transcription factor HSF1 (Figure 4), which is a key regulator in cancer development and metabolism reprogramming [39, 40]. For example, it could suppress the expression of MIR137 that targets GLS1 mRNA, thus stimulating GLS1 protein expression to promote glutaminolysis and mTOR activation in colorectal carcinogenesis [19]. Consistent with the previous work that HSF1 was responsible for increased lactic acid production in a panel of cancer cell lines, we also found that HSF1 protein expression was increased in chemoresistant cells to promote glycolysis and chemoresistance (Figure 7 and 8)[29]. Moreover, the glucose metabolism in HSF1 over-expressing cells displayed a clear distinction from parental cells and resembled SGC7901-R and PDK3 over-expressing cells. PDH activity was increased by HSF1 knockdown in chemoresistant cells, which was rescued by PDK3 overexpression. It has been reported that the upregulation of PDK3 in cancer cells and stem cells under hypoxic conditions is induced by hypoxia-inducible factor-1α (HIF1α) [41]. However, we failed to find the reduction of PDK3 in chemoresistant cells after knockdown HIF1α. Hence, HSF1 stimulated PDK3 transcription to promote chemoresistance under normoxia and targeting HSF1 might be valuable to overcome chemoresistance.
Recently, more and more metabolic enzymes have been found to have moonlighting functions. In addition to catalyzing metabolic reactions, they are able to directly regulate signal transduction even gene transcription [42]. One of such enzymes is GSK3β, which can phosphorylate oncoprotein β-catenin to promote its degradation [43]. Besides, PKM2 (Pyruvate kinase isoform 2) can translocate to cell nucleus to regulate gene transcriptions [44]. For example, it can serve as a coactivator to promote HIF-1 dependent transactivation and reprogram glucose metabolism [45]. Recently, enzyme PFKFB4 was also found to act as a molecular fulcrum couples sugar metabolism to transcriptional activation by stimulating SRC-3 to promote aggressive metastatic tumours [10]. In this study, we added PDK3 as a new metabolic enzyme to coordinate the metabolic shift with gene transcription (Figure 5 and 6). It abrogated the interaction of HSF1 with E3 ligase FBXW7 and inhibited FBXW7-dependent HSF1 polyubiquitination and subsequent proteasomal degradation. Importantly, PDK3 was able to bind HSF1 and co-localized with HSF1 in the nucleus. The 226-315 region of HSF1 in the regulatory domain is critical to this interaction with PDK3. Interestingly, GSK3β and ERK1 could catalyze the phosphorylation of serine 303 and 307 sites in this region of HSF1, respectively, to promote its interaction with FBXW7 [32]. By interacting with this region of HSF1, PDK3 competed with GSK3β to attenuate serine phosphorylation and subsequent FBXW7-dependent polyubiquitination of HSF1. However, the interaction of PDK3 with ERK1/2 was not impaired. To sum up, this study revealed a positive feedback loop formed by PDK3 and HSF1 to drive chemoresistance. Certainly, other non-metabolic functions for PDK3 still warrant more investigations. For example, the translocation of pyruvate dehydrogenase complex (PDC) from the mitochondria to the nucleus was able to generate nuclear acetyl-CoA and promote histone acetylation required for S phase progression [46]. The regulation and relevance of PDK3 in the generation of nuclear acetyl-CoA and regulation of histone codes would be interesting for further studies. Taken together, the moonlighting functions of these metabolic enzymes in regulating gene transcriptions and signal transductions further highlighted the relevance of metabolic dysfunction to cancer development, and revealed novel therapeutic targets for precision intervention in cancer treatments.
In conclusion, PDK3 was increased to promote chemoresistance as a result of HSF1-driven transcription. It can not only stimulate glycolysis by inhibiting the activity of PDH in the mitochondria, but also directly interact with HSF1 to impair its phosphorylation by GSK3ß and protect it from FBXW7-dependent polyubiquitination and degradation. Thus, the metabolic enzyme PDK3 and transcription factor HSF1 forms a positive feedback loop to promote glycolysis and chemoresistance. Genetic or chemical inhibition of this feedback loop to impair enhanced glycolysis may represent a novel approach to overcome chemoresistance.
Abbreviations
PDK3: pyruvate dehydrogenase kinase 3; HSF: Heat shock factor 1; GSK3β: glycogen synthase kinase beta; FBXW7: F-box/WD repeat-containing protein 7; OXPHOS: oxidative phosphorylation; DDP: Cisplatin; DCA: Dichloroacetic acid; CHX: Cycloheximide; CQ: chloroquine; MLN: MLN4924; HIF1α: hypoxia-inducible factor-1α; β-TRCP1: β-Transducin repeat-containing protein 1; qRT-PCR: quantitative real-time PCR; ChIP: Chromatin immunoprecipitation; IHC: immunohistochemistry; IP: immunopreciptation; Ub: ubiquitination; PDH: pyruvate dehydrogenase; GC-TOF/MS: chromatography time-of-flight mass spectrometry; GSEA: Gene Set Enrichment Analysis; PCA: Principal component analysis; OS: overall survival; PFS: progression free survival; ERK1: extracellular signal-regulated kinase.
Supplementary Material
Supplementary figures and tables.
Acknowledgements
This work was supported by the National Natural Science Foundation of China (81672723, 91740106, 81761138047, 8190110622) and Natural Science Foundation of Zhejiang (LY19H160051).
Author contributions
XJ, SQ, XW, QZ, SR, YM, CD, ZL, and FL performed experiments. XJ, WX and JH analyzed data. XJ, CA, MH and JH wrote the manuscript. JH designed the project.
Competing Interests
The authors have declared that no competing interest exists.
References
1. Ferreira JA, Peixoto A, Neves M, Gaiteiro C, Reis CA, Assaraf YG. et al. Mechanisms of cisplatin resistance and targeting of cancer stem cells: Adding glycosylation to the equation. Drug Resist Updat. 2016;24:34-54
2. Qian X, Xu W, Xu J, Shi Q, Li J, Weng Y. et al. Enolase 1 stimulates glycolysis to promote chemoresistance in gastric cancer. Oncotarget. 2017;8:47691-708
3. Liu X, Wang X, Zhang J, Lam EK, Shin VY, Cheng AS. et al. Warburg effect revisited: an epigenetic link between glycolysis and gastric carcinogenesis. Oncogene. 2010;29:442-50
4. Shukla SK, Purohit V, Mehla K, Gunda V, Chaika NV, Vernucci E. et al. MUC1 and HIF-1alpha Signaling Crosstalk Induces Anabolic Glucose Metabolism to Impart Gemcitabine Resistance to Pancreatic Cancer. Cancer Cell. 2017;32:71-87 e7
5. Kanarek N, Keys HR, Cantor JR, Lewis CA, Chan SH, Kunchok T. et al. Histidine catabolism is a major determinant of methotrexate sensitivity. Nature. 2018;559:632-6
6. Zhao Y, Butler EB, Tan M. Targeting cellular metabolism to improve cancer therapeutics. Cell Death Dis. 2013;4:e532
7. Hanahan D, Weinberg RA. Hallmarks of cancer: the next generation. Cell. 2011;144:646-74
8. Pavlova NN, Thompson CB. The Emerging Hallmarks of Cancer Metabolism. Cell Metab. 2016;23:27-47
9. Lincet H, Icard P. How do glycolytic enzymes favour cancer cell proliferation by nonmetabolic functions? Oncogene. 2015;34:3751-9
10. Dasgupta S, Rajapakshe K, Zhu B, Nikolai BC, Yi P, Putluri N. et al. Metabolic enzyme PFKFB4 activates transcriptional coactivator SRC-3 to drive breast cancer. Nature. 2018;556:249-54
11. Koo JH, Guan KL. Interplay between YAP/TAZ and Metabolism. Cell Metab. 2018;28:196-206
12. Schvartzman JM, Thompson CB, Finley LWS. Metabolic regulation of chromatin modifications and gene expression. J Cell Biol. 2018;217:2247-59
13. Bhattacharya B, Mohd Omar MF, Soong R. The Warburg effect and drug resistance. Br J Pharmacol. 2016;173:970-9
14. Lu C, Ward PS, Kapoor GS, Rohle D, Turcan S, Abdel-Wahab O. et al. IDH mutation impairs histone demethylation and results in a block to cell differentiation. Nature. 2012;483:474-8
15. Lo Re O, Douet J, Buschbeck M, Fusilli C, Pazienza V, Panebianco C. et al. Histone variant macroH2A1 rewires carbohydrate and lipid metabolism of hepatocellular carcinoma cells towards cancer stem cells. Epigenetics. 2018;13:829-45
16. Xu W, Wang S, Chen Q, Zhang Y, Ni P, Wu X. et al. TXNL1-XRCC1 pathway regulates cisplatin-induced cell death and contributes to resistance in human gastric cancer. Cell Death Dis. 2014;5:e1055
17. Westerheide SD, Anckar J, Stevens SM Jr, Sistonen L, Morimoto RI. Stress-inducible regulation of heat shock factor 1 by the deacetylase SIRT1. Science. 2009;323:1063-6
18. Sauer M, Schuldner M, Hoffmann N, Cetintas A, Reiners KS, Shatnyeva O. et al. CBP/p300 acetyltransferases regulate the expression of NKG2D ligands on tumor cells. Oncogene. 2017;36:933-41
19. Li J, Song P, Jiang T, Dai D, Wang H, Sun J. et al. Heat Shock Factor 1 Epigenetically Stimulates Glutaminase-1-Dependent mTOR Activation to Promote Colorectal Carcinogenesis. Mol Ther. 2018;26:1828-39
20. Xu J, Zhou W, Yang F, Chen G, Li H, Zhao Y. et al. The beta-TrCP-FBXW2-SKP2 axis regulates lung cancer cell growth with FBXW2 acting as a tumour suppressor. Nat Commun. 2017;8:14002
21. Hung SC, Pochampally RR, Chen SC, Hsu SC, Prockop DJ. Angiogenic effects of human multipotent stromal cell conditioned medium activate the PI3K-Akt pathway in hypoxic endothelial cells to inhibit apoptosis, increase survival, and stimulate angiogenesis. Stem Cells. 2007;25:2363-70
22. Qiu Y, Cai G, Su M, Chen T, Zheng X, Xu Y. et al. Serum metabolite profiling of human colorectal cancer using GC-TOFMS and UPLC-QTOFMS. J Proteome Res. 2009;8:4844-50
23. Zhou Q, Li H, Li Y, Tan M, Fan S, Cao C. et al. Inhibiting neddylation modification alters mitochondrial morphology and reprograms energy metabolism in cancer cells. JCI Insight. 2019;4:e121582
24. Bonnet S, Archer SL, Allalunis-Turner J, Haromy A, Beaulieu C, Thompson R. et al. A mitochondria-K+ channel axis is suppressed in cancer and its normalization promotes apoptosis and inhibits cancer growth. Cancer Cell. 2007;11:37-51
25. Subramanian A, Tamayo P, Mootha VK, Mukherjee S, Ebert BL, Gillette MA. et al. Gene set enrichment analysis: a knowledge-based approach for interpreting genome-wide expression profiles. Proc Natl Acad Sci U S A. 2005;102:15545-50
26. Lu CW, Lin SC, Chen KF, Lai YY, Tsai SJ. Induction of pyruvate dehydrogenase kinase-3 by hypoxia-inducible factor-1 promotes metabolic switch and drug resistance. J Biol Chem. 2008;283:28106-14
27. Briones-Orta MA, Avendano-Vazquez SE, Ivette Aparicio-Bautista D, Coombes JD, Weber GF, Syn WK. Prediction of transcription factor bindings sites affected by SNPs located at the osteopontin promoter. Data Brief. 2017;14:538-42
28. Wang J, He H, Yu L, Xia HH, Lin MC, Gu Q. et al. HSF1 down-regulates XAF1 through transcriptional regulation. J Biol Chem. 2006;281:2451-9
29. Santagata S, Mendillo ML, Tang YC, Subramanian A, Perley CC, Roche SP. et al. Tight coordination of protein translation and HSF1 activation supports the anabolic malignant state. Science. 2013;341:1238303
30. Blagosklonny MV, An WG, Melillo G, Nguyen P, Trepel JB, Neckers LM. Regulation of BRCA1 by protein degradation. Oncogene. 1999;18:6460-8
31. Lee YJ, Kim EH, Lee JS, Jeoung D, Bae S, Kwon SH. et al. HSF1 as a mitotic regulator: phosphorylation of HSF1 by Plk1 is essential for mitotic progression. Cancer Res. 2008;68:7550-60
32. Kourtis N, Moubarak RS, Aranda-Orgilles B, Lui K, Aydin IT, Trimarchi T. et al. FBXW7 modulates cellular stress response and metastatic potential through HSF1 post-translational modification. Nat Cell Biol. 2015;17:322-32
33. Ohnishi K, Takahashi A, Yokota S, Ohnishi T. Effects of a heat shock protein inhibitor KNK437 on heat sensitivity and heat tolerance in human squamous cell carcinoma cell lines differing in p53 status. Int J Radiat Biol. 2004;80:607-14
34. Sitarz R, Skierucha M, Mielko J, Offerhaus GJA, Maciejewski R, Polkowski WP. Gastric cancer: epidemiology, prevention, classification, and treatment. Cancer Manag Res. 2018;10:239-48
35. Kamangar F, Dores GM, Anderson WF. Patterns of cancer incidence, mortality, and prevalence across five continents: defining priorities to reduce cancer disparities in different geographic regions of the world. J Clin Oncol. 2006;24:2137-50
36. McFate T, Mohyeldin A, Lu H, Thakar J, Henriques J, Halim ND. et al. Pyruvate dehydrogenase complex activity controls metabolic and malignant phenotype in cancer cells. J Biol Chem. 2008;283:22700-8
37. Sutendra G, Michelakis ED. Pyruvate dehydrogenase kinase as a novel therapeutic target in oncology. Front Oncol. 2013;3:38
38. Lu CW, Lin SC, Chien CW, Lin SC, Lee CT, Lin BW. et al. Overexpression of pyruvate dehydrogenase kinase 3 increases drug resistance and early recurrence in colon cancer. Am J Pathol. 2011;179:1405-14
39. Ma X, Xu L, Alberobello AT, Gavrilova O, Bagattin A, Skarulis M. et al. Celastrol Protects against Obesity and Metabolic Dysfunction through Activation of a HSF1-PGC1alpha Transcriptional Axis. Cell Metab. 2015;22:695-708
40. Zhao Y, Liu H, Liu Z, Ding Y, Ledoux SP, Wilson GL. et al. Overcoming trastuzumab resistance in breast cancer by targeting dysregulated glucose metabolism. Cancer Res. 2011;71:4585-97
41. Jeoung NH. Pyruvate Dehydrogenase Kinases: Therapeutic Targets for Diabetes and Cancers. Diabetes Metab J. 2015;39:188-97
42. Seki SM, Gaultier A. Exploring Non-Metabolic Functions of Glycolytic Enzymes in Immunity. Front Immunol. 2017;8:1549
43. Aberle H, Bauer A, Stappert J, Kispert A, Kemler R. beta-catenin is a target for the ubiquitin-proteasome pathway. EMBO J. 1997;16:3797-804
44. Calabretta S, Bielli P, Passacantilli I, Pilozzi E, Fendrich V, Capurso G. et al. Modulation of PKM alternative splicing by PTBP1 promotes gemcitabine resistance in pancreatic cancer cells. Oncogene. 2016;35:2031-9
45. Luo W, Hu H, Chang R, Zhong J, Knabel M, O'Meally R. et al. Pyruvate kinase M2 is a PHD3-stimulated coactivator for hypoxia-inducible factor 1. Cell. 2011;145:732-44
46. Sutendra G, Kinnaird A, Dromparis P, Paulin R, Stenson TH, Haromy A. et al. A nuclear pyruvate dehydrogenase complex is important for the generation of acetyl-CoA and histone acetylation. Cell. 2014;158:84-97
Author contact
![]() Corresponding author: Dr. Hongchuan Jin, Email: jinhcedu.cn
Corresponding author: Dr. Hongchuan Jin, Email: jinhcedu.cn