Impact Factor
- Issue 14; 2026
- Issue 13; 2026
- Issue 12; 2026
- Issue 11; 2026
- Issue 10; 2026
- Volume 16; 2026
- Advance Articles
- Past Issues
- Cover Images
- Cover Suggestion
- Index & Coverage
- Special Issues
Introduction
Materials and Methods
Results
Discussion
Abbreviations
Supplementary Material
Acknowledgements
Contributions
References
International Journal of Biological Sciences
International Journal of Medical Sciences
 Global reach, higher impact

Theranostics 2019; 9(13):3687-3706. doi:10.7150/thno.33684 This issue Cite
Research Paper
Targeting mitochondrial dynamics by regulating Mfn2 for therapeutic intervention in diabetic cardiomyopathy
Lang Hu1*, Mingge Ding2*, Daishi Tang3*, Erhe Gao4, Congye Li1, Kaiyan Wang5, Bingchao Qi1, Jihuan Qiu1, Huishou Zhao1, Pan Chang6, Feng Fu5 ![]() , Yan Li1
, Yan Li1 ![]()
1. Department of Cardiology, Xijing Hospital, Fourth Military Medical University, Xi'an, 710032, China
2. Department of Cardiology, Xi'an Central Hospital, Xi'an Jiaotong University, Xi'an, 710003, China
3. Department of Endocrinology, Affiliated Zhongshan Hospital of Dalian University, Dalian, 116000, China
4. Center for Translational Medicine, Temple University School of Medicine, Philadelphia, PA, USA.
5. Department of Physiology and Pathophysiology, Fourth Military Medical University, Xi'an, 710032, China
6. Department of Cardiology, The Second Affiliated Hospital of Xi'an Medical University, Xi'an 710038, China.
*These authors contributed equally to this work.
Received 2019-1-31; Accepted 2019-4-24; Published 2019-5-31
Abstract

Increasing evidence has implicated the important role of mitochondrial pathology in diabetic cardiomyopathy (DCM), while the underlying mechanism remains largely unclear. The aim of this study was to investigate the role of mitochondrial dynamics in the pathogenesis of DCM and its underlying mechanisms.
Methods: Obese diabetic (db/db) and lean control (db/+) mice were used in this study. Mitochondrial dynamics were analyzed by transmission electron microscopy in vivo and by confocal microscopy in vitro.
Results: Diabetic hearts from 12-week-old db/db mice showed excessive mitochondrial fission and significant reduced expression of Mfn2, while there was no significant alteration or slight change in the expression of other dynamic-related proteins. Reconstitution of Mfn2 in diabetic hearts inhibited mitochondrial fission and prevented the progression of DCM. In an in-vitro study, cardiomyocytes cultured in high-glucose and high-fat (HG/HF) medium showed excessive mitochondrial fission and decreased Mfn2 expression. Reconstitution of Mfn2 restored mitochondrial membrane potential, suppressed mitochondrial oxidative stress and improved mitochondrial function in HG/HF-treated cardiomyocytes through promoting mitochondrial fusion. In addition, the down-regulation of Mfn2 expression in HG/HF-treated cardiomyocytes was induced by reduced expression of PPARα, which positively regulated the expression of Mfn2 by directly binding to its promoter.
Conclusion: Our study provides the first evidence that imbalanced mitochondrial dynamics induced by down-regulated Mfn2 contributes to the development of DCM. Targeting mitochondrial dynamics by regulating Mfn2 might be a potential therapeutic strategy for DCM.
Keywords: Diabetic cardiomyopathy, Mitochondrial dynamics, Mitochondrial dysfunction, Mfn2, PPARα
Introduction
Diabetes mellitus (DM) is a major threat to human health worldwide, and the prevalence of DM will continue to rise during the next 10 years. It is estimated that more than 353 million people worldwide will suffer from DM by 2030 [1, 2]. Cumulative evidence reveals that diabetes is associated with abnormal cardiac structure and function, leading to diabetic cardiomyopathy (DCM) [3]. Models of DCM can be typically classified as type 1 or 2, with the latter representing over 90% of the human diabetic population [4]. Nowadays, specific strategies for preventing type 2 DCM in numerous diabetic patients have not been clarified yet. Mitochondria are the primary organelles for reactive oxygen spices (ROS) generation and energy production in cardiomyocytes. Emerging evidence has suggested that mitochondrial dysfunction may play a pivotal role in the pathogenesis of DCM [5-7]. For example, impaired respiratory function and increased ROS production are observed in mitochondria isolated from atrial tissue of diabetic patients [8]. Moreover, it is essential to control mitochondrial ROS production and to protect mitochondria from losing their ability to generate energy in order to prevent DCM [9]. However, despite increasing evidence implicating the important role of mitochondrial pathology in DCM, the underlying mechanism is still largely unclear.
The crucial role of mitochondrial morphological alteration in mitochondrial homeostasis has been highlighted in recent studies. Mitochondrial morphological alteration, also known as mitochondrial dynamics, mainly comprises mitochondrial fusion and fission. Mitochondria continually adapt their shapes through fusion and fission in response to changes in energy demand and supply. The constant cycle of fusion and fission not only determines mitochondrial morphology but also regulates various mitochondrial functions, including energy production, oxidative stress and apoptosis [10, 11]. Mitochondrial fusion seems to have beneficial effects because it is associated with enhanced mitochondrial function and increased ATP production [12]. In contrast, excessive mitochondrial fission is considered to be detrimental because it causes mitochondrial dysfunction and increased ROS [13-15]. Importantly, several studies have reported that impaired mitochondrial dynamics is observed in the cardiac tissues from both DCM animals and patients [16, 17]. However, whether targeting mitochondrial dynamics is an effective strategy to prevent the development of DCM remains largely unknown.
A series of GTPases are involved in the regulation of mitochondrial dynamics. Mitochondrial fission is driven by Dynamic-related protein1 (Drp1) and mitochondrial fission 1 protein (Fis1)[18-20]. Drp1 exists largely in a cytosolic pool and is recruited by Fis1 from the cytosol to the mitochondria for fission reactions. The fusion of the mitochondrial outer membrane is controlled by mitofusin 1 and 2 (Mfn1 and Mfn2), and the fusion of inner membrane is governed by optic atrophy 1(Opa1). These proteins work together to maintain the homeostasis of mitochondrial dynamics. An imbalance between mitochondrial fission and fusion regulatory proteins has been shown to contribute to many cardiac pathologies including myocardial ischemia/reperfusion and heart failure [21, 22]. Nevertheless, it is still largely unclear how these fission/fusion proteins are changed in diabetic hearts, especially in type 2 diabetic hearts. Moreover, the mechanisms by which diabetes regulate the expression of mitochondrial dynamics proteins in cardiomyocytes remain to be defined.
In this study, we identified down-regulated Mfn2 as a pivotal factor contributing to imbalanced mitochondrial dynamics and mitochondrial dysfunction in type 2 DCM. Moreover, Mfn2 overexpression effectively alleviated DCM by promoting mitochondrial fusion and improving mitochondrial function. These findings suggest that targeting mitochondrial dynamics by regulating Mfn2 might be a potential therapeutic strategy for DCM.
Materials and Methods
Animals
All animal experiments were performed in accordance with the National Institutes of Health guidelines for the use of laboratory animals and were approved by the Fourth Military Medical University Animal Use and Care Committee. Leptin receptor-deficient (db/db) mice and lean control mice (db/+) were provided by Changzhou Cavens Laboratory Animal Co. Ltd. (Jiangsu, China).
Primary culture of neonatal rat cardiomyocytes
All experimental procedures were approved by the Fourth Military Medical University Animal Use and Care Committee. Primary cardiomyocytes were prepared from neonatal rat hearts as previously described [23]. Thereafter, the cardiomyocytes were subjected to low-glucose (LG) medium (5.5 mmol/L glucose), osmolarity control (OC) medium (5.5 mmol/L glucose and 19.5mmol/L mannitol), high-glucose (HG) medium (25 mmol/L glucose), HG+ oleate acid (HG+OA) medium(25 mmol/L glucose and 500 μmol/L oleate), HG+ palmitate acid (HG+PA) medium (25 mmol/L glucose and 500 μmol/L palmitate) or HG+PA+OA (25 mmol/L glucose, 500 μmol/L palmitate and 500μmol/L oleate) for 24 hours.
Echocardiography
Echocardiography was performed in M-mode with a VEVO 2100 echocardiography system (VisualSonics Inc., Toronto, Canada). During the procedure, mice were anaesthetized using 2.5% isoflurane. Anesthesia was maintained with 2% isoflurane. Continuous electrocardiogram monitoring system was used to measure mouse heart rate under conscious or anesthetic condition. M-mode echocardiography was obtained to record the left ventricular systolic and diastolic motion profile. The left ventricular internal diameter at end-systole (LVIDs) and left ventricular internal diameter at end-diastole (LVIDd) were measured. Left ventricular end-diastolic volume (LVEDV) and end systolic volume (LVESV) were calculated using computer algorithms. Left ventricle ejection fraction (LVEF) and left ventricle fractional shortening (LVFS) were calculated as LVEF (%) = (LVEDV-LDESV)/LVEDV×100 and LVFS (%) = (LVIDd-LVIDs)/ LVIDd×100, respectively. Analysis of Doppler echocardiography was performed to determine diastolic trans-mitral blood flow velocities for peak early (E) and late (A) fillings, the ratio of E wave to A wave (E/A). Pulse wave Doppler of the mitral E-wave and A-wave velocities were taken from the four chambers view and E/A ratio were measured to assess diastolic function. All the echocardiographic images were analyzed using Vevo 2100 software.
Transmission electron microscopy (TEM)
Heart samples from the left ventricular free wall were isolated and fixed with 2.5% glutaraldehyde in a 0.1 M phosphate buffer (pH 7.4, 4℃) for 24 hours, rinsed several times with 0.1 M phosphate buffer (pH 7.4) and then post-fixed with 1% osmium tetroxide in deionized water. Subsequent procedures were performed as previously described [24]. All images were obtained by a technician blinded to the treatment with one transmission electron microscope (JEM-1230, JEOL Ltd., Tokyo, Japan) at 300 kV. Mitochondrial images were analyzed by a technician blinded to the treatment using Image J software. The number of mitochondria combined with mean mitochondrial size were used for the analysis of mitochondrial morphology as previously described [25, 26]. At least 300 mitochondria in a minimum of 8 images per mice were analyzed. The number of mitochondria was calculated in an area bigger than 800 µm2 in 8 images.
Down-regulation and up-regulation of target genes
Empty adenoviral vectors (Ad-EV) and recombinant adenoviral vectors expressing Mfn2 (Ad-Mfn2), PPARα (Ad-PPARα) or Mfn2-specific small hairpin RNA (Ad-shMfn2) were constructed by Hanbio Biotechnology Ltd (Shanghai, China). The titre of the adenoviruses used in this study was about 1.2*1010 PFU/ml. For intramyocardial injection of adenoviruses, mice were anaesthetized using 2.5% isoflurane, intubated and maintained under anesthesia with 2% isoflurane during the surgical procedure. After the hearts were exposed, adenovirus was injected (using a 50 µl needle, Hamilton, 705RN, USA) into the left ventricle free wall (10 µl at each of four sites).
PPARα siRNA (#sc-38885) was purchased from Santa Cruz Biotechnology (USA). For siRNA transfection, Lipofectamine™ RNAiMAX Transfection Reagent (Invitrogen, #13778030) was used. Briefly, two tubes were prepared before transfection. One tube contained Dulbecco's modified Eagle's medium (DMEM) and RNAiMAX Transfection Reagent. Another tube contained DMEM and siRNA. Then, the contents of the two tubes were gently mixed together and incubated at room temperature for 5 min. After 48h transfection of PPARα siRNA, the cells were subjected to HG or HG/HF medium. For adenovirus transfection, cardiomyocytes were cultured in serum-free DMEM containing adenovirus (10 µl/ml, MOI: 100:1) for 6-8 hours. Then, the medium was replaced, and the cells were subjected to HG or HG/HF medium for another 24 hours.
Histological Analysis
Mice hearts were fixed in 4% paraformaldehyde (pH 7.4) overnight, embedded in paraffin, then serially sectioned (5-mm-thick slices) for histological analysis. Standard hematoxylin and eosin staining was performed following standard procedures. Cardiac collagen content was assessed using Masson trichrome staining.
Immunohistochemistry
Immunohistochemistry was performed on mouse hearts as previously described [27]. Briefly, myocardial tissue sections were treated with 3% hydrogen peroxide for 20 min to block endogenous peroxidase. Primary antibody anti-Mfn2 (1:300, Abcam, USA) was used to incubate with tissue sections at 4 ℃ for overnight. Tissues were washed with PBS and then horseradish peroxidase (HRP)-conjugated secondary antibody was incubated for 1 h. Diaminobenzidine (DAB) solution was used to visualize the reaction. For immune histochemical, at least 10 fields per heart were randomly chosen and analyzed.
Wheat germ agglutinin (WGA) staining
For WGA staining, hearts were arrested in diastole with 2 M KCl and fixed in 4% paraformaldehyde (pH 7.4) overnight. Later, hearts were embedded in paraffin and serially sectioned (5-mm-thick slices). Wheat germ agglutinin (green, Thermo Fisher) was diluted 1:100 (10 µg/mL) in the required buffer. Incubation time was one hour protected from light. The sections were washed and then cover slipped with a water-soluble anti-fading mounting medium. Images were captured using the fluorescence microscope and the cardiomyocyte size was calculated using ImageJ software.
Cell apoptosis assay
For analysis of apoptosis in heart tissues, a terminal deoxynucleotidyl transferased UTP nick end labelling (TUNEL) assay kit (Roche Applied Science, Swiss) was used to determine myocardial apoptosis following the manufacturer's instructions as previously described[28]. Only TUNEL- and DAPI-positive nuclei located within heart tissues were considered as apoptotic nuclei. For TUNEL staining, at least 10 fields per heart were randomly chosen and analyzed. Apoptosis rate in primary cardiomyocytes was analyzed by flow cytometry analysis using PE-Annexin V Apoptosis Detection Kits (#559763; BD Biosciences) according to the manufacturer's instructions.
Mitochondrial membrane potential measurement
To measure mitochondrial membrane potential, mitochondrial membrane potential assay kits with JC-1(#C2006) were obtained from Beyotime Biotechnology (Jiangsu, China). All procedures were performed according to the manufacturer's protocol as previously described [28].
Assessment of mitochondrial morphology in cells
To view mitochondrial morphology, primary cardiomyocytes were stained with 100 mM MitoTracker™ Red CMXRos probe (M7512, Thermo Fisher Scientific, USA) at 37℃ for 30 min. Images were acquired with a confocal laser-scanning microscope (Nikon A1R MP+ Confocal Microscope, Nikon, Japan). The number and morphology of mitochondria were analyzed and quantified as previously described [24]. Percentage of cells with fragmented mitochondria (small and round) was counted.
Measurement of ROS production in isolated heart mitochondria
Mitochondrial ROS generation was measured spectrophotometrically (560-nm excitation and 590-nm emission) in 125 µg/ml of mitochondrial protein as previously described [29]. Mitochondria were isolated from mouse hearts with Tissue Mitochondria Isolation Kits (C3606, Beyotime Biotechnology, Jiangsu, China) in strict accordance with the manufacturer's instructions. The mitochondria was incubated in a solution containing: 20 mM Tris, 250 mM sucrose, 1 mM EGTA, 1 mM EDTA, and 0.15% bovine serum albumin adjusted to pH 7.4 at 25°C with continuous stirring. ROS was measured with the H2O2-sensitive dye amplex red reagent (10 µM) (Thermo Fisher, Waltham, MA) according to the manufacturer's instructions using a Bio-tek plate reader every 2 min for total 20 min. Aliquots of H2O2 were used for calibration and the rates were determined with linear regressions.
Detection of mitochondrial ROS (mitoROS) and total ROS in primary cardiomyocytes and mice hearts
MitoROS and total ROS were detected using the fluorescent probe MitoSOX (#M36008, Thermo Fisher, USA) and Fluorometric Intracellular ROS Kits (#S0033, Beyotime Biotech, China) respectively. Images were obtained with a confocal laser-scanning microscope (Nikon A1R MP+ Confocal Microscope, Nikon, Japan).
Dihydroethidium (DHE) staining was used to determine the intracellular superoxide anion levels in mouse heart tissue. The images were analyzed with ImagePro Plus image analysis software. MnSOD activity and MDA levels were measured using Mn-SOD Assay Kits (S1013, Beyotime Biotechnology, Jiangsu, China) and Lipid Peroxidation MDA Assay Kits (S0131, Beyotime Biotechnology, Jiangsu, China) according to the protocols provided by the manufacturer. For DHE staining, at least 10 fields per heart were randomly chosen and analyzed.
Measurement of mitochondrial oxygen consumption rate (OCR)
An XF24 Extracellular Flux Analyser (Agilent SeaHorse Bioscience, USA) recorded oxygen consumption rate (OCR) as previously described [30]. Primary cardiomyocytes were cultured with the medium as indicated in an Agilent Seahorse XF24 Cell Culture Microplate (V7-PS, 100777-004, Agilent). OCR was recorded after equilibration and after FCCP (0.5 μM) and antimycin (1.5 μM) treatments, these values were used to calculate basal and maximal OCR. All OCR measurements were normalized with well-by-well haemocytometer cell counts.
Western blotting and quantitativereal-time (RT)-PCR
Mouse heart tissue and primary cardiomyocytes were analyzed by western blotting as previously described [27]. For mitochondrial protein isolation, mitochondria were isolated from primary cardiomyocytes with Cell Mitochondria Isolation Kits (C3601, Beyotime Biotechnology, Jiangsu, China) in strict accordance with the manufacturer's instructions. Primary antibodies against the following proteins were used: β-actin (Proteintech, China, #20536-1-AP), Mfn1 (Abcam, #ab57602), Mfn2 (Abcam, #ab56889), Opa1 (Abcam, #ab42364), Fis1 (Genetex, USA, #GTX111010), Drp1 (Cell signaling, USA, #8570), PPARα (Novus, #NBP1-04676), cytochrome C (Abcam, #ab133504), caspase-3 (Cell signaling technology, #9662), cleaved caspase-3 (Cell signaling technology, #9664) and Nox4 (Abcam, #ab133303).
RNA was extracted with RNAisoPlus (#9189Q, Takara, Japan), cDNA was synthesized with aPrimeScript™ RT Reagent Kit with gDNA Eraser (#RR047Q, Takara), and quantitative RT-PCR was performed with SYBR® Premix Ex Taq™ II (#RR820L, Takara). All procedures were performed strictly following the manufacturers' protocols. The primer sequences are as follows: Mfn2 forward CTTGAAGACACCCACAGGAACA, Mfn2 reverse GGCCAGCACTTCGCTGATAC; Actin forward GTCCCTCACCCTCCCAAAAG, and actin reverse GCTGCCTCAACACCTCAACCC.
Chromatin immunoprecipitation (ChIP) assay
ChIP was performed using a Simple ChIP Plus Enzymatic Chromatin IP Kit (#9003, Cell signaling technology, Danvers, USA) following the protocol provided by the manufacturer. In brief, the cells were fixed with formaldehyde, and the chromatin was sheared. Then, the fragmented chromatin was incubated with a PPARα antibody (#NBP1-04676, Novus, USA) and protein G magnetic beads. DNA released from the precipitates was analyzed by PCR. The primer sequences specific to the PPARα binding region within the Mfn2 promoter region were as follows: Mfn2 promoter forward: 5´-TGATCCGGAAAGGAAAACAG-3´ and reverse: 5´- CACCGAAAGGCCACAGTAAT-3´. IgG was employed as the negative control.
Luciferase reporter assay
To analyze the PPARα-dependent transcriptional regulation of Mfn2, full length (-2000/0, see supporting information) and fragments (-1200/0, -1000/0, -800/0, -600/0) from the 2kb promoter sequence 5' upstream of the transcription start site of rat Mfn2 were cloned into the PGL3.0-Basic vector upstream of luciferase cassette. The PGL3.0-Basic plasmid was provided by HanBio technology (Shanghai, China). All constructs were verified by sequencing. A dual-luciferase reporter assay system was used to assess the luciferase activity. Briefly, HEK-293T cells were transfected with various promoter constructs and co-transfected with the Renilla luciferase reporter plasmid (pRL-TK). Meanwhile, the cells were co-infected with the PPARα or empty adenovirus for 24 h. Cells were then lysed and processed according to the manufacturer's instructions. The luciferase activity was measured using a GloMax96 plate reader (Biotek, USA). For each sample, the pGL3.0-firefly luciferase activity was normalized to Renilla luciferase activity of the pRL-TK control.
Statistical analysis
All values were presented as the mean ± standard error (SEM). All data were subjected to one-way ANOVA or two-way repeated measures ANOVA followed by Bonferroni post hoc test correction where appropriate using GraphPad Prism 6.0 software (GraphPad Software, La Jolla, USA). A value of P<0.05 was considered statistically significant.
Results
Excessive mitochondrial fission and reduced Mfn2 expression were observed in diabetic hearts of db/db mice
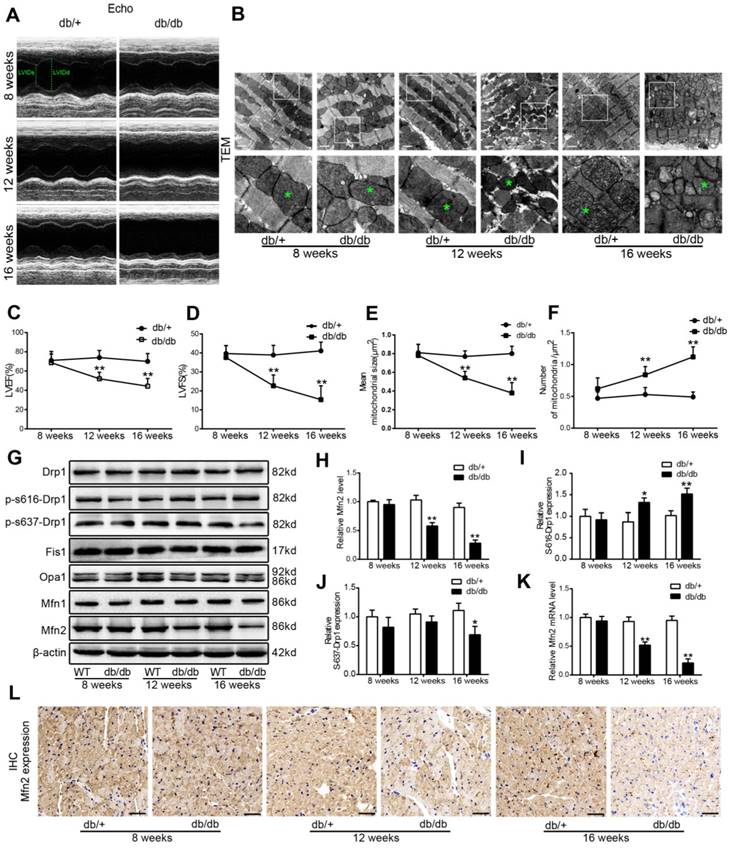
Compared with those of db/+ control mice, body weight, blood glucose and serum lipids including triglyceride (TG) and total cholesterol (TC) in db/db mice were significantly increased at the beginning of 8-week-old (Figure S1). Serial echocardiography was performed in db/+ and db/db mice at 8, 12 and 16 weeks of age. Compared with db/+ mice, db/db mice showed impaired cardiac function at 12 and 16 weeks of age, as evidenced by decreased LVEF and LVFS (Figure 1A, C and D). Moreover, diabetic hearts from db/db mice exhibited excessive mitochondrial fission at 12-week-old and 16-week-old compared with control hearts. As shown by Figure 1B, E and F, mean mitochondrial size was decreased and the number of mitochondria per μm2 was increased in diabetic hearts. To investigate the key proteins underlying the excessive mitochondrial fission in diabetic hearts, the levels of the main mitochondrial dynamics-related proteins (Drp1, Fis1, Mfn1, Mfn2, and Opa1) were determined. Compared with control hearts of db/+ mice, Mfn2 expression was significantly down-regulated in diabetic hearts of db/db mouse at the beginning of 12-week-old (Figure 1G and H), while other dynamic-related protein expression remained unchanged (Drp1, Fis1, Mfn1 and Opa1). Phospho-Ser-616-Drp1 was slightly increased in the hearts of 16-week-old db/db mice, while Phospho-Ser-637-Drp1 was slightly decreased in diabetic hearts of db/db mice at 16-week-old. The down-regulation of Mfn2 was even more obvious in the hearts of 16-week-old db/db mice. Reduced protein expression of Mfn2 in db/db mouse hearts was confirmed by immunohistochemical staining (Figure 1L). A consistent pattern of mRNA expression was observed by quantitative RT-PCR (Figure 1K), suggesting that the expression of Mfn2 in diabetic hearts is mainly down-regulated at the transcriptional level. Collectively, these data indicate that there is excessive mitochondrial fission in the development of DCM. Moreover, although there was altered phosphorylated modification of Drp1 at Ser616 or Ser637 in diabetic hearts, the change of Mfn2 expression was earlier and more evident.
Excessive mitochondrial fission and reduced Mfn2 expression were observed in diabetic hearts of 12-week-old db/db mice. (A) Representative echocardiography images. LVIDd and LVIDs were labeled. (B) Representative transmission electron microscopic images of the myocardium, mitochondria were labeled by asterisks. Scale bar = 1 μm. (C) LVEF, left ventricular ejection fraction (D) LVFS, left ventricular fractional shortening. (E) Mean size of mitochondria. (F) The number of mitochondria per um2. (G) Representative blot images of mitochondrial fission-related proteins (Drp1 and Fis1) and fusion-related proteins (Opa1, Mfn1 and Mfn2). (H) Quantitative analysis of Mfn2 protein expression. (I) Quantitative analysis of S-616-Drp1 protein expression. (J) Quantitative analysis of S-637-Drp1 protein expression. (K) Real-time PCR analysis of Mfn2 mRNA expression. (L) Representative immunohistochemical stains of Mfn2 in mouse hearts. Scale bars = 50 μm. * P<0.05 vs. db/+; **P<0.01 vs. db/+. n = 8 animals.
Reconstitution of Mfn2 prevented mitochondrial fission and DCM in db/db mice
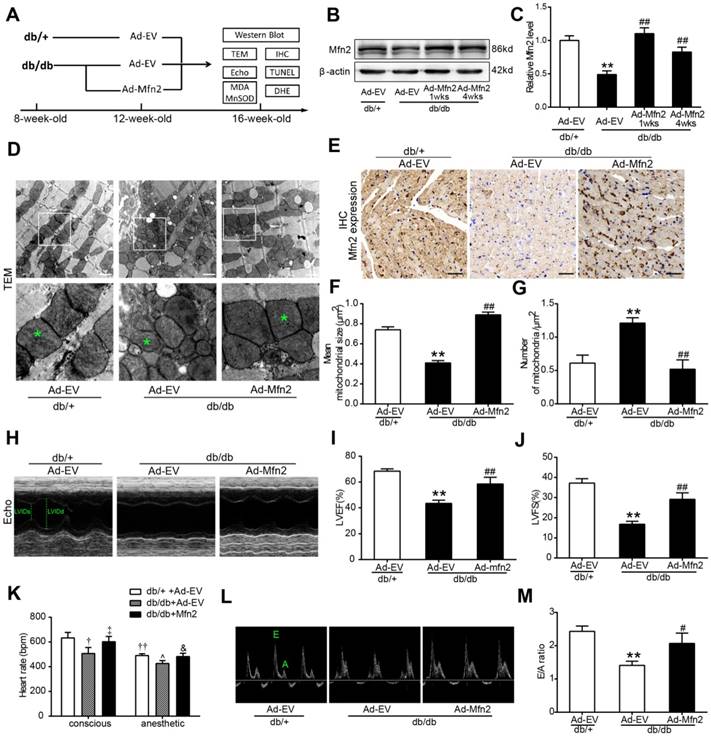
To determine whether the reconstitution of Mfn2 protects the heart against DCM, adenoviral vectors encoding Mfn2 were intramyocardially injected into 12-week-old db/db mice or wild type (WT) C57 mice. Mfn2 expression was determined at 1 week and 4 weeks after injection, and cardiac function was measured at 4 weeks after injection (Figure 2 and S3). As shown in Figure 2B and 2C, myocardial Mfn2 expression was increased by ~2.2 fold in db/db mice hearts at 1 week after Mfn2-expressing adenovirus (Ad-Mfn2) injection compared with Ad-EV injection. Four weeks after injection, Mfn2 expression was slightly lower but remained ~1.8 fold higher than that of Ad-EV (Figure 2B and C). Immunohistochemical staining further confirmed the increased expression of Mfn2 in almost all the area of left ventricular at 4 weeks after injection, suggesting intramyocardially adenovirus injection did achieve transmural expression of Mfn2 in mouse hearts (Figure 2E and S2). Ad-Mfn2 injection also significantly increased the expression of Mfn2 in the hearts of WT mice (Figure S3A). Overexpression of Mfn2 by adenovirus infection did not have significant effects on mitochondrial morphology and cardiac function in WT hearts (Figure S3B-G). Reconstitution of Mfn2 efficiently prevented mitochondrial fission as evidenced by the increased mean size of mitochondria and decreased number of mitochondria per μm2 in db/db mice hearts (Figure 2D, F and G). Moreover, reconstitution of Mfn2 significantly enhanced cardiac function in diabetic db/db mice as evidenced by increased LVEF and LVFS (Figure 2H-J). Heart rate was measured in conscious or anesthetic mice. As shown in Figure 2K, heart rate was significantly lower in db/db mice under conscious or anesthetic condition compared with db/+ mice, while reconstitution of Mfn2 partly recovered heart rate in db/db mice. Furthermore, Doppler echocardiography indicated that Mfn2 reconstitution also alleviated diastolic dysfunction in 16-week-old db/db mice, as evidenced by elevated E/A ratio after Mfn2-expressing adenovirus injection (Figure 2L and M). Taken together, these data indicate that reconstitution of Mfn2 prevents mitochondrial fission and improves cardiac function in diabetic db/db mice.
Reconstitution of Mfn2 prevents mitochondrial fission and DCM in db/db mice (A) Schematic representation of the experimental protocols. (B, C) Representative blot images and quantitative analysis of Mfn2 expression. (D) Representative transmission electron microscopic images of the myocardium, mitochondria were labeled by asterisks. Scale bars=1 μm. (E) Representative immunohistochemical stains of Mfn2 in mouse hearts. Scale bars = 50 μm. (F) Mean area of mitochondria. (G) The number of mitochondria per um2. (H) Representative M-mode echocardiography images. LVIDs and LVIDd were labeled. (I) LVEF, left ventricular ejection fraction (J) LVFS, left ventricular fractional shortening. (K) Heart rate of db/+ and db/db mice under conscious or anesthetic condition. (L) Representative Doppler echocardiography images. (M) E/A ratio. Ad-EV, control adenovirus; Ad-Mfn2, recombinant adenovirus encoding Mfn2. **P<0.01 vs. db/+ + Ad-EV. ##P<0.01 vs. db/db + Ad-EV. †P<0.05 vs. db/+ + Ad-EV (conscious). ††P<0.01 vs. db/+ + Ad-EV (conscious). ‡ P<0.05 vs. db/db + Ad-EV (conscious). ^ P<0.05 vs. db/+ + Ad-EV (anesthetic). &P<0.05 vs. db/db + Ad-EV (anesthetic). n = 8 animals.
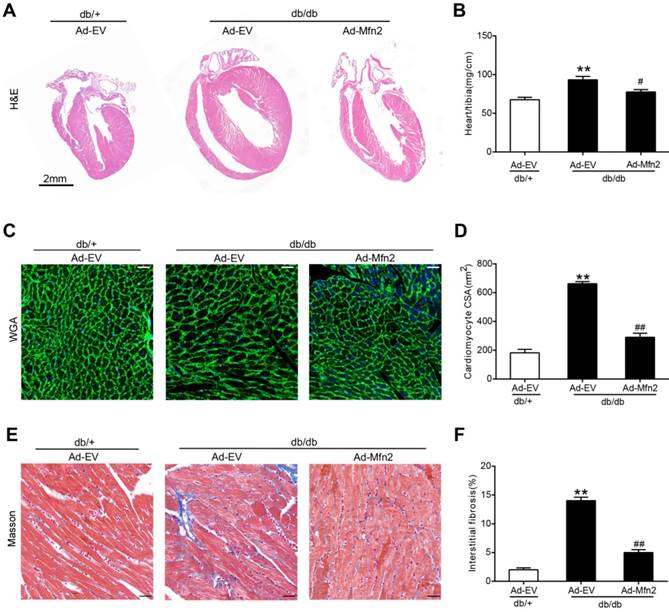
Cardiac hypertrophy and fibrosis are common features in DCM. Four weeks after adenovirus injection, cardiac hypertrophy and fibrosis were determined in 16-week-old db/db and control db/+ mice. As shown in Figure 3, db/db mice showed significant cardiac hypertrophy and fibrosis compared with control mice as evidenced by enlarged hearts, increased cardiomyocyte cross-sectional area, elevated ratios of heart weight to tibia length and increased interstitial fibrosis. These pathological changes were efficiently ameliorated in the hearts of db/db mice receiving Ad-Mfn2.
Reconstitution of Mfn2 alleviated cardiac hypertrophy and fibrosis in diabetic db/db mice. (A) The gross morphology of hearts stained by hematoxylin and eosin staining. Scale bar = 2mm. (B) The ratio of heart weight to tibia length. (C, D) Representative images of wheat germ agglutinin staining and quantitative analysis of the cross-sectional area of cardiomyocytes. Scale bar= 20 μm. (E, F) Representative images of Masson trichrome staining of hearts and quantitative analysis of interstitial fibrosis. Scale bars=25 μm. Ad-EV, control adenovirus; Ad-Mfn2, recombinant adenovirus encoding Mfn2; CSA, cross-sectional area. **P<0.01 vs. db/+ + Ad-EV. #P<0.05 vs. db/db + Ad-EV. ##P<0.01 vs. db/db + Ad-EV. n=8 animals.
Reconstitution of Mfn2 inhibited apoptosis and oxidative stress in diabetic hearts
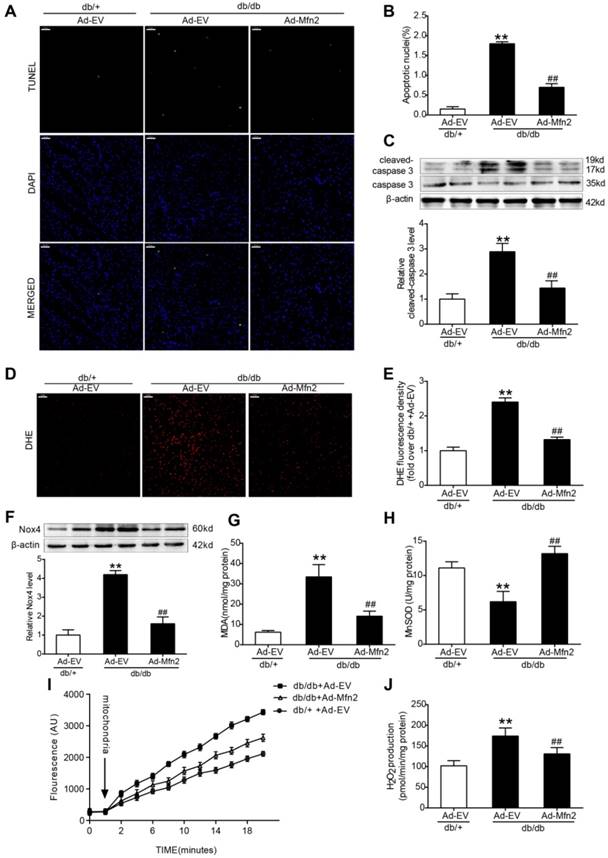
Compared with the control hearts of db/+ mice, the expression of cleaved caspase-3 and apoptotic index were increased in the diabetic hearts of db/db mice. Reconstitution of Mfn2 significantly reduced apoptotic index and decreased the expression of cleaved caspase-3 in diabetic hearts (Figure 4A-C). Excessive oxidative stress is closely associated with the induction of apoptosis [9, 31]. Nox4-derived ROS is the major source of oxidative stress in diabetic hearts [32]. As expected, myocardial Nox4 expression and superoxide anion production (stained by DHE) and MDA levels were significantly increased in diabetic hearts compared with control hearts (Figure 4D-G), while MnSOD activity of diabetic hearts was decreased (Figure 4H). Furthermore, heart mitochondria were isolated and mitochondrial ROS production was measured with H2O2-sensitive dye amplex red reagent. As shown in Figure 4I and J, mitochondria-derived ROS production was significantly increased in db/db mice hearts. Up-regulated Mfn2 markedly inhibited myocardial oxidative stress in db/db mice, as evidenced by reduced Nox4 expression and mitochondria derived ROS production, decreased MDA levels and increased MnSOD activity (Figure 4D-J). Overexpression of Mfn2 by adenovirus infection did not have significant effects on myocardial apoptosis and oxidative stress in WT hearts (Figure S3H-K). Taken together, these data indicate that reconstitution of Mfn2 reduces cardiomyocyte apoptosis and suppresses mitochondrial oxidative stress in diabetic hearts.
Reconstitution of Mfn2 inhibited cell apoptosis and oxidative stress in diabetic hearts. (A) Representative photomicrographs of TUNEL-stained and DAPI-stained heart sections. Green fluorescence shows TUNEL-positive nuclei; Blue fluorescence shows nuclei of total cardiomyocytes (DAPI-positive). Scale bar = 50 μm. (B) Percentage of TUNEL-positive nuclei. (C) Representative blot images and quantitative analysis of cleaved-caspase 3 and total caspase 3. (D) Representative microphotographs of DHE staining in heart sections. Scale bar=50 μm. (E) Quantitative analysis of DHE fluorescence density (fold over db/+ +Ad-EV). (F) Representative blot images and quantitative analysis of Nox4 protein expression. (G) Myocardial malondialdehyde (MDA) content. (H) Mitochondrial manganese superoxide dismutase (MnSOD) activity. (I) Time-dependent increase of mitochondrial ROS related fluorescence density. (J) Isolated mitochondrial H2O2 production. Ad-EV, control adenovirus; Ad-Mfn2, recombinant adenovirus encoding Mfn2. **P<0.01 vs. db/+ +Ad-EV. ##P<0.01 vs. db/db+Ad-EV. n=6-8 animals.
Mfn2 overexpression prevented HG/HF-induced mitochondrial fission, whereas Mfn2 knockdown caused mitochondrial fission in cardiomyocytes
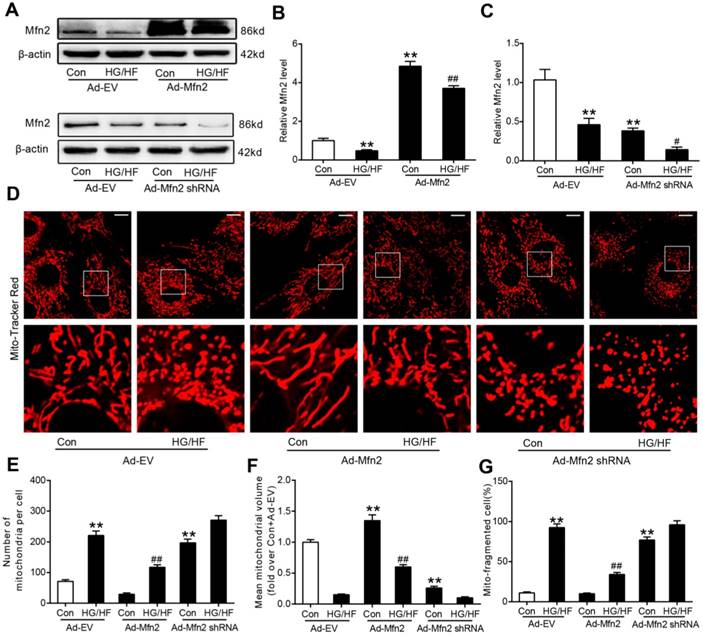
Mito-tracker red, phalloidin and DAPI have been used to stain the mitochondria, cytoskeleton and nuclear respectively in our preliminary experiment. As shown in Figure S4, there is a cluster of mitochondria in one cell. The nuclear is in the center of the mitochondria, and the cytoskeleton surrounds the mitochondria. The cell boundaries are visible and obvious even without nuclear or cytoplasmic marker. It is easy to identify one cell from the neighboring cells when only using Mito-tracker red. In general, a cluster of mitochondria represents one cell. Then we only use Mito-tracker red as the dye in the subsequent experiments. We investigated whether the gain-of-function or loss-of-function manipulation of mitochondrial dynamics proteins caused significant morphological changes in primary cardiomyocytes using MitoTracker Red probe. As shown in Figure S5, in primary cardiomyocytes cultured in low glucose medium (LG, 5.5 mmol/L) for 24 hours, mitochondrial morphology mainly presented as elongated tubules with highly interconnecting networks. There were no significant changes in mitochondrial morphology in cells cultured in high glucose medium (HG, 25mmol/L) or osmolarity control (OC) medium (5.5 mmol/L glucose and 19.5mmol/L mannitol) for 24 hours compared with those cultured in LG. There were also no significant changes in mitochondrial morphology in cardiomyocytes cultured in HG+OA medium (25 mmol/L glucose and 500 μmol/L oleate acid) compared with those cultured in HG (25 mmol/L glucose) medium. Nevertheless, after stimulation with HG+PA (25 mmol/L glucose and 500 μmol/L palmitate) or HG+PA+OA (25 mmol/L glucose and 500 μmol/L palmitate and 500 μmol/L oleate acid) for 24 hours, mitochondria became fragmented and the expression of Mfn2 was significantly reduced, while there were no significant differences in the expression of other mitochondrial fission-related proteins (total Drp1 and Fis1) and fusion-related proteins (Mfn1 and Opa1) (Figure S5 E-G). These results indicate that palmitate but not oleate acid could induce mitochondrial fission and downregulate the expression of Mfn2. HG was then chosen as the control for all subsequent experiments as it had no significant effects on mitochondrial morphology, while HG+PA was served as HG/HF in this study. Moreover, compared with HG treatments, HG+PA or HG+PA+OA incubation resulted in slightly increased phospho-Ser616-Drp1 expression and decreased phospho-Ser637-Drp1 expression (Figure S5E and F). Notably, as shown in Figure 5, transfection with the adenovirus encoding Mfn2 (Ad-Mfn2) increased the expression of Mfn2 (Figure 5A and 5B) and prevented mitochondrial fission (Figure 5D-G) in HG/HF-treated cells, whereas silencing Mfn2 expression with the adenovirus encoding Mfn2 shRNA (Ad-Mfn2 shRNA) induced excessive mitochondrial fission in control normal cardiomyocytes (Figure 5A, 5C and 5D-G).
Mfn2 overexpression prevented HG/HF-induced mitochondrial fission, whereas Mfn2 knockdown caused mitochondrial fission in cardiomyocytes. (A) Representative blot images of Mfn2. (B, C) Quantitative analysis of Mfn2 protein expression. (D) Representative confocal microscope images showing mitochondrial morphology stained by MitoTracker Red. Original magnification ×600. (E) The number of mitochondria per cell. (F) Mean volume of mitochondria (fold over Con+Ad-EV). (G) The percentage of cells with fragmented mitochondria. Ad-EV, control adenovirus; Ad-Mfn2, recombinant adenovirus encoding Mfn2; Ad-Mfn2-shRNA, recombinant adenovirus encoding short hairpin RNA against Mfn2; HG/HF, high-glucose and high-fat medium (25 mmol/L glucose and 500 μmol/L palmitate). **P<0.01 vs. con + Ad-EV. #P<0.05, ##P<0.01 vs. HG/HF + Ad-EV. n = 6 in each group.
Mfn2 overexpression inhibited HG/HF-induced mitochondria-dependent apoptosis, whereas Mfn2 knockdown induced mitochondria-dependent apoptosis
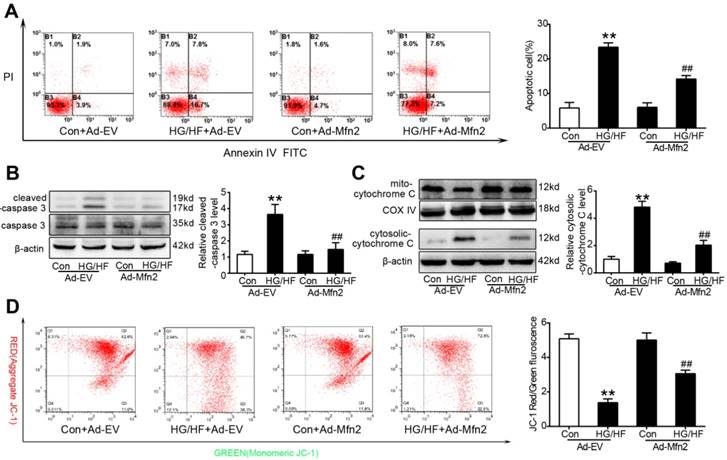
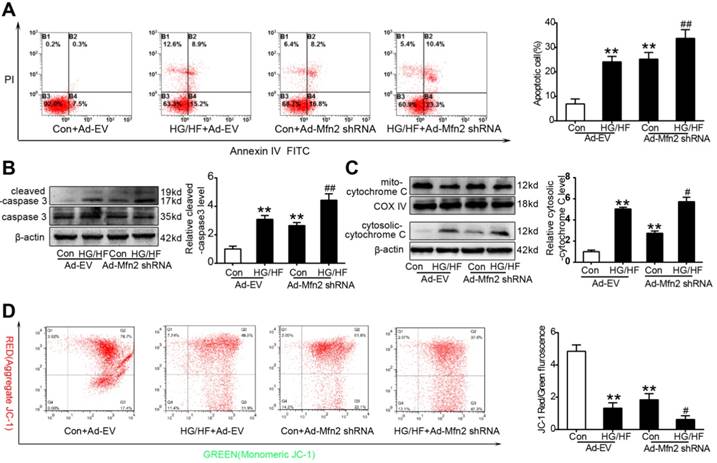
Cardiomyocyte apoptosis was examined in vitro by flow cytometry and western blot analysis. As shown in Figure 6, up-regulated Mfn2 remarkably reduced cell apoptosis in HG/HF-treated cardiomyocytes, as evidenced by decreased percentages of apoptotic cells (Figure 6A) and decreased expression of cleaved caspase-3 (Figure 6B). Moreover, Mfn2 overexpression significantly increased the mitochondrial membrane potential (Figure 6D) and inhibited the release of cytochrome c from mitochondria (Figure 6C), indicating that up-regulation of Mfn2 inhibits mitochondria-dependent apoptosis in HG/HF-treated cardiomyocytes. In contrast, as shown in Figure 7, silencing Mfn2 expression with Ad-Mfn2 shRNA significantly induced mitochondria-dependent apoptosis in control normal cardiomyocytes as evidenced by increased percentages of apoptotic cells, up-regulated expression of cleaved caspase-3, elevated release of cytochrome c and decreased mitochondrial membrane potential. In addition, Mfn2 knockdown further exacerbated HG/HF-induced mitochondria-dependent apoptosis.
Mfn2 overexpression preserved mitochondrial membrane potential and inhibited mitochondria-dependent apoptosis in HG/HF-treated cardiomyocytes. (A) Flow cytometry analysis of apoptosis by annexin V and PI staining (left) and quantification of apoptotic cells (right) in primary cardiomyocytes. (B) Representative blot images and quantitative analysis of cleaved-caspase 3 expression. (C) Representative blot images and quantitative analysis of cytosolic cytochrome c expression. (D) Flow cytometry analysis (left) and quantification (right) of mitochondrial membrane potential by JC-1 in primary cardiomyocytes. High levels of green fluorescence (x-axis) represent reduced ΔΨm, and high levels of red fluorescence (y-axis) show increased ΔΨm. A decrease in the red/green fluorescence is indicative of loss of ΔΨm. Ad-EV, control adenovirus; Ad-Mfn2, recombinant adenovirus encoding Mfn2; HG/HF, high-glucose and high-fat medium (25 mmol/L glucose and 500 μmol/L palmitate). **P<0.01 vs. Con + Ad-EV. ##P<0.01 vs. HG/HF + Ad-EV. n = 6 in each group.
Mfn2 knockdown decreased mitochondrial membrane potential and induced mitochondria-dependent apoptosis in control normal cardiomyocytes. (A) Flow cytometry analysis of apoptosis by annexin V and PI staining (left) and quantification of apoptotic cells (right) in primary cardiomyocytes. (B) Representative blot images and quantitative analysis of cleaved-caspase 3 expression. (C) Representative blot images and quantitative analysis of cytosolic cytochrome c expression. (D) Flow cytometry analysis (left) and quantification (right) of mitochondrial membrane potential by JC-1 in primary cardiomyocytes. High levels of green fluorescence (x-axis) represent reduced ΔΨm, and high levels of red fluorescence (y-axis) show increased ΔΨm. A decrease in the red/green fluorescence is indicative of loss of ΔΨm. Ad-EV, control adenovirus; Ad-Mfn2-shRNA, recombinant adenovirus encoding short hairpin RNA against Mfn2; HG/HF, high-glucose and high-fat medium (25 mmol/L glucose and 500 μmol/L palmitate). **P<0.01 vs. Con + Ad-EV. #P<0.05, ##P<0.01 vs. HG/HF + Ad-EV. n = 6 in each group.
Mfn2 overexpression protected against HG/HF-induced mitochondrial dysfunction, whereas Mfn2 knockdown induced mitochondrial dysfunction
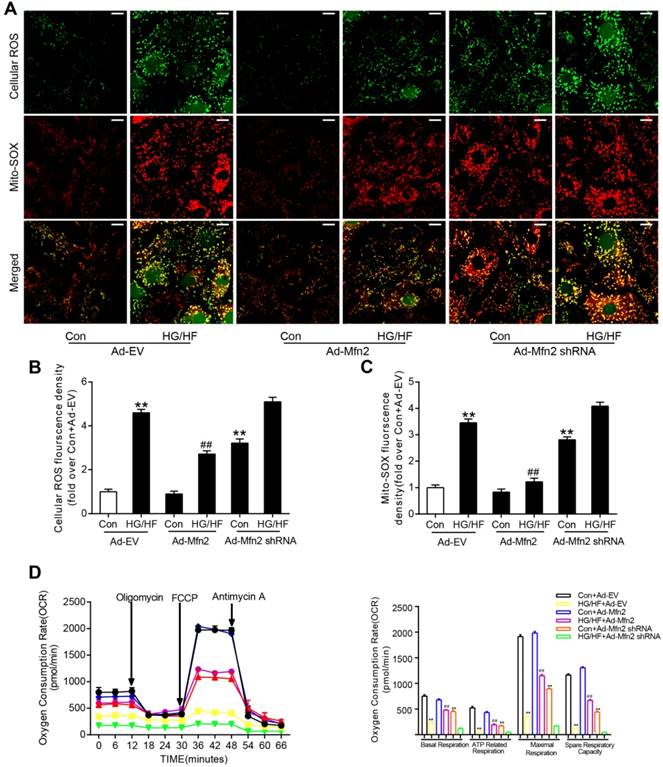
Further investigation of mitochondrial oxidative stress and mitochondrial function (respiratory capacity) was carried out in cardiomyocytes. As shown in Figure 8A-C, HG/HF culture leaded to increased cellular ROS (shown as green) as well as mitochondria-derived ROS (shown as red). The co-staining (shown as yellow) results suggested that mitochondria are the major source of cellular ROS. Overexpression of Mfn2 reduced both total cellular ROS and mitochondria-derived ROS in HG/HF-treated cardiomyocytes. HG/HF suppressed the mitochondrial respiratory capacity including basal respiration; ATP-linked respiration, maximal respiration, and spare respiration, all of which were significantly improved by Mfn2 overexpression (Figure 8D). In contrast, knockdown of Mfn2 increased mitochondria-derived ROS and impaired the mitochondrial respiratory capacity in control normal cardiomyocytes, suggesting enhanced mitochondrial oxidative stress and disturbed mitochondrial function in Mfn2-knockdown cells.
Mfn2 overexpression protected against HG/HF-induced mitochondrial dysfunction, whereas Mfn2 knockdown induced mitochondrial dysfunction. (A) Representative confocal microscope images of intracellular ROS and mitochondria derived superoxide production. Original magnification ×600. (B) Quantitative analysis of intracellular ROS density in primary cardiomyocytes (fold over Con + Ad-EV). (C) Quantitative analysis of mitochondria derived superoxide production in primary cardiomyocytes (fold over Con + Ad-EV). (D) Oxygen consumption rate (OCR) and quantitative statistical analysis of OCR. Ad-EV, control adenovirus; Ad-Mfn2, recombinant adenovirus encoding Mfn2; Ad-Mfn2-shRNA, recombinant adenovirus encoding short hairpin RNA against Mfn2; HG/HF, high-glucose and high-fat medium (25 mmol/L glucose and 500 μmol/L palmitate). **P<0.01 vs. Con + Ad-EV, ##P<0.01 vs. HG/HF + Ad-EV. n = 6 in each group.
To further confirm whether mitochondrial fusion played a major role in mfn2-mediated protective effects, an activator of mitochondrial fission, FCCP (10 μM, Selleck Chemicals, USA) [33], or recombinant adenovirus expressing Drp1 (Ad-Drp1) was used to recall the fission in the cardiomyocyte transfected with Ad-Mfn2. As shown in Figure S6, in HG/HF-treated cardiomyocytes without Mfn2 overexpression, FCCP or Ad-Drp1 had no significant effects on the percentage of cells with mitochondrial fragmentation and the percentage of apoptotic cells. Nevertheless, application of FCCP or Ad-Drp1 in Mfn2-overexpressed cells blunted the protective effects of Mfn2 on cell apoptosis, mitochondrial membrane potential, and mitochondria-derived ROS. In contrast, M1 (5 μM, Sigma-Aldrich, USA), a small molecule that promotes the fusion of genetically induced fragmented mitochondria[34], was used to restore the mitochondrial fusion in the cardiomyocyte transfected with Ad-Mfn2 shRNA, The cardiomyocytes transfected with Ad-Mfn2 shRNA were incubated with M1 for another 24 hours. As shown in Figure S7, M1 treatment restored mitochondrial fusion and exerted the protective effects on cell apoptosis, mitochondrial membrane potential and mitochondria-derived ROS in Mfn2-knockdown cardiomyocytes. All these findings suggest that Mfn2 overexpression alleviates HG/HF-induced mitochondrial dysfunction by promoting mitochondrial fusion, whereas Mfn2 knockdown disrupts mitochondrial function by inducing mitochondrial fission.
The transcription of Mfn2 was directly regulated by PPARα
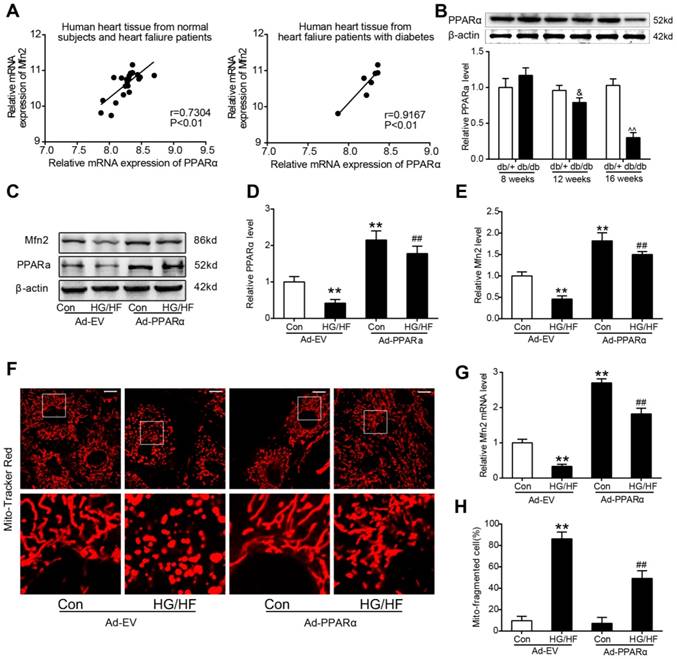
The study above has shown that the expression of Mfn2 in diabetic hearts is mainly down-regulated at the transcriptional level, and then the transcriptional mechanism underlying the down-regulation of Mfn2 was finally investigated. Public microarray mRNA expression data derived from the heart failure patients with or without T2DM were downloaded from the Gene Expression Omnibus (GEO) database (https://www.ncbi.nlm.nih.gov/geo/query/acc.cgi?acc=GSE26887) to evaluate the correlations between the mRNA expression of Mfn2 and several potential transcription factors (PGC-1α, PPARα, PPARγ, PPARδ, Stat3, and FoxO1) in human hearts (Figure 9A and Figure S8). Pearson correlation analysis indicated that only PPARα had a significant positive correlation with Mfn2 (Figure 9A left, r=0.7304, P<0.01). The correlation became even more significant when only heart tissues from heart failure patients with DM were analysed (Figure 9A right, r=0.9167, P<0.01). Consistently, the protein levels of PPARα were down-regulated in the hearts of 12-week-old db/db mouse when compared with the hearts of age-matched db/+mouse. The down-regulation of PPARα became more obvious in the hearts of 16-week-old db/db mice (Figure 9B). Moreover, it was shown in Figure 9C and S9A that the expression of PPARα was also significantly reduced in the cardiomyocytes cultured in HG/HF medium compared with those cultured in Con. Overexpression of PPARα with Ad-PPARα significantly increased the expression and mRNA level of Mfn2 and inhibited the down-regulation of Mfn2 and mitochondrial fission induced by HG/HF (Figure 9C-H), whereas knockdown of PPARα with siRNA exhibited the opposite effect (Figure S9).
Overexpression of PPARα inhibited the down-regulation of Mfn2 and mitochondrial fission induced by HG/HF. (A) Correlations between the mRNA expression levels of PPARα and Mfn2 were evaluated in human hearts based on a public microarray expression data set (GSE26887). Left: 19 hearts from patients with heart failure and 5 nonfailing control hearts. Right: Only 7 hearts from type 2 diabetes patients with heart failure were included. (B) Representative blot images and quantitative analysis of PPARα protein expression in db/+ and db/db mice hearts. (C-E) Representative blot images and quantitative analysis of PPARα and Mfn2 protein expression in primary cardiomyocytes with treatment as indicated. (F) Representative confocal microscope images showing mitochondrial morphology stained by MitoTracker Red. Original magnification ×600. (G) Real-time PCR analysis of Mfn2 mRNA expression in primary cardiomyocytes with treatment as indicated. (H) The percentage of cells with fragmented mitochondria. Ad-EV, control adenovirus; Ad-PPARα, recombinant adenovirus encoding PPARα; HG/HF, high-glucose and high-fat medium (25 mmol/L glucose and 500 μmol/L palmitate). &P<0.05 vs. 12-week-old db/+; ^^P<0.01 vs. 16-week-old db/+; **P<0.01 vs. Con + Ad-EV; ##P<0.01 vs. HG/HF + Ad-EV. n = 6 in each group.
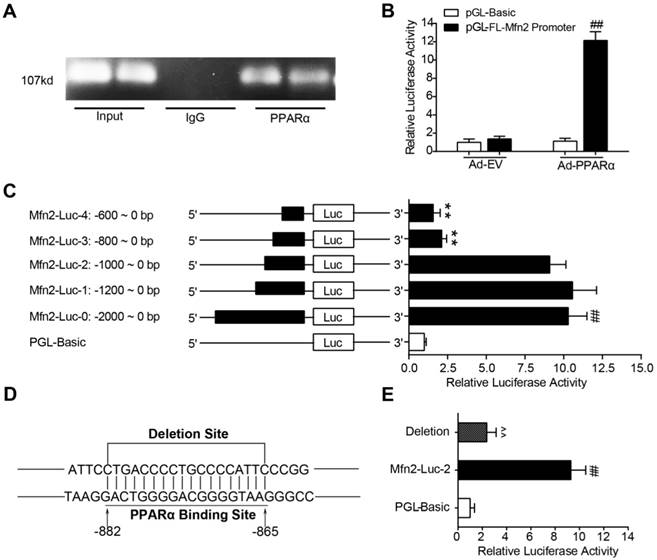
ChIP and PCR analysis revealed that PPARα bound to the promoter region of the Mfn2 gene in primary cardiomyocytes (Figure 10A). To determine whether PPARα directly regulates Mfn2 transcription, the rat full-length Mfn2 promoter (-2000-0) was cloned upstream from the luciferase reporter gene in the pGL3.0 Basic plasmid (PGL-FL-Mfn2 promoter reporter). As shown in Figure 10B, PGL-FL-Mfn2 promoter reporter was co-transfected with Ad-PPARα or Ad-EV into HEK-293T cells, the resultant relative luciferase activity indicated that PPARα induced a robust and positive response. To identify the exact PPARα-binding sites in Mfn2 promoter region, 5' series promoter deletion fragments were cloned upstream from the luciferase reporter gene in the pGL3.0 Basic plasmid. HEK-293T cells co-transfected with Ad-PPARα and different Mfn2 promoter-reporter constructs were subjected to luciferase reporter assay at 24 hours post-transfection. As shown in Figure 10C, Ad-PPARα transfection exerted a similar induction effect on Mfn2-Luc-0 (FL-Mfn2 promoter), Mfn2-Luc-1 and Mfn2-Luc-2. However, Ad-PPARα transfection did not significantly promote luciferase activity on Mfn2-Luc-3 and Mfn2-Luc-4, indicating that the PPARα regulatory sites were within the Mfn2 promoter region between -1000 and -800. Then, the specific PPARα binding sites were predicted by sequencing analysis, a suspicious sequence “GACTGGGGACGGGGTAAG” located in the region from -882 to -865 was found. Furthermore, when sequence “GACTGGGGACGGGGTAAG” was deleted from Mfn2-Luc-2, the luciferase activity induced by Ad-PPARα transfection was reduced by 74% (Figure 10D and E). Together, the concordant results of the ChIP and luciferase reporter studies suggest that PPARα regulates the transcription of Mfn2 by directly binding to the sequence “GACTGGGGACGGGGTAAG” within the promoter.
PPARα directly binds to the promoter of Mfn2 gene. (A) ChIP analysis for PPARα binding to the Mfn2 promoter in primary rat cardiomyocytes. (B) Responses of the Full-length Mfn2 promoter reporter to Ad-EV or Ad-PPARα. (C) Responses of the individual fragments of Mfn2 promoter to Ad-PPARα. (D) A schematic illustrates the deleted sequence of Mfn2 promoter region. (E) Responses of sequence deleted promoter of Mfn2 to Ad-PPARα. Ad-PPARα, recombinant adenovirus encoding PPARα; ##P<0.01 vs. pGL-Basic + Ad-PPARα; **P<0.01 vs. Mfn2-Luc-0; ^^P<0.01 vs. Mfn2-Luc-2. n = 6 in each group.
Discussion
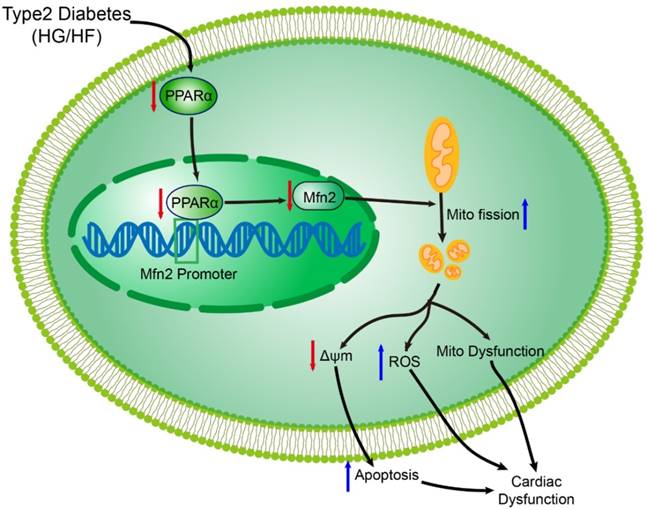
Accumulating evidence has indicated that diabetes result in functional and structural changes of the myocardium. However, the underlying pathological mechanism of DCM (especially in type 2 DCM) is far from clear. Several important observations have been made in the present study. First, we validated that reduced Mfn2 expression and excessive mitochondrial fission were observed in diabetic hearts, which results in mitochondrial dysfunction in DCM. Second, reconstitution of Mfn2 promoted mitochondrial fusion, alleviated mitochondrial dysfunction and consequently inhibited the development of DCM. Last, the down-regulation of Mfn2 expression in diabetic cardiomyocytes was due, at least in part, to decreased expression of PPARα (Figure 11). Collectively, our study demonstrates for the first time that imbalanced mitochondrial dynamics is induced by Mfn2 down-regulation and contributes to the development of DCM. Therefore, targeting mitochondrial dynamics by regulating Mfn2 might be a potential therapeutic strategy for DCM.
Schematic figure illustrating that imbalanced mitochondrial dynamics induced by decreased Mfn2 promotes mitochondrial dysfunction and diabetic cardiomyopathy. PPARα positively regulates Mfn2 expression by directly binding to its promoter. Type 2 diabetes (high-glucose and high-fat, HG/HF) reduces the expression of PPARα and then decreases the expression of Mfn2. Reduction of Mfn2 causes mitochondrial fission and subsequently leads to the mitochondria-derived ROS production, mitochondrial dysfunction and mitochondria-dependent apoptosis, which results in the development of diabetic cardiomyopathy. Reconstitution of Mfn2 reduces mitochondria-dependent apoptosis, suppresses mitochondria-derived ROS production, alleviates mitochondrial dysfunction and protects against diabetic cardiomyopathy. Mito, mitochondrial; ΔΨm, mitochondrial membrane potential.
Although mitochondria are often depicted as isolated organelles, they actually form highly dynamic networks. The dynamic cycling of mitochondrial fusion and fission is essential for maintaining various cellular function, including energy production, ROS generation and cell apoptosis [35]. Accumulating evidence has indicated that both mitochondrial oxidative damage and mitochondrial dysfunction are observed in diabetic hearts and contribute to the development of DCM [31, 36]. However, the mechanisms underlying mitochondrial pathology in DCM are still largely unclear. In this study, we provide compelling evidence showing that type 2 diabetes (hyperglycaemia and hyperlipidaemia) reduces Mfn2 expression and causes excessive mitochondrial fission both in vitro and in vivo. db/db mouse hearts showed reduced Mfn2 expression and impaired cardiac function at 12 weeks of age compared with db/+ mice. Our results are consistent with some existing studies which reported that db/db hearts exhibited a marked reduction in cardiac function at 12 weeks of age[37-40]. Nevertheless, several other studies have reported much later development of cardiac dysfunction at 15-16 weeks of age in db/db mice compared with control mice [23, 41]. This inconsistency may be due to differences in testing conditions, image acquisition and data analysis. In addition, heart rate was significantly lower in db/db mice under conscious or anesthetic condition compared with db/+ mice. The main reason for lower heart rate observed in db/db mice may be due to damaged sympathetic activity. Previous studies have indicated a significant reduction of cardiac norepinephrine concentration and an impairment of axoplasmic transport of norepinephrine in the hearts of db/db diabetic mice [42-44]. The reconstitution of Mfn2 prevents mitochondrial fission and inhibits mitochondrial injury and mitigates the progression of DCM in diabetic db/db mice. In contrast, knockdown of Mfn2 induces mitochondrial fission and mitochondrial dysfunction, which mimics an important molecular characteristic of diabetic cardiomyocytes. These results suggest that decreased Mfn2 in diabetic hearts disrupts the balance of fission and fusion dynamics and then accelerates the progression of DCM. Overall, our study develops a new concept that imbalanced mitochondrial dynamics induced by decreased Mfn2 contributes to the development of type 2 DCM, partly by enhancing mitochondrial oxidative stress and mitochondria-dependent apoptosis.
Mitochondrial morphologic abnormalities and dysfunction represent common observations in both type 1 and type 2 diabetes, while it seems that the fission/fusion proteins are differently affected. Our previous study has demonstrated that enhanced mitochondrial fission was mediated by increased expression of fission-related proteinDrp1 in STZ-induced type 1 diabetic hearts [24]. In this study, increased mitochondrial fission was caused by the down-regulation of fusion-related protein Mfn2 in type 2 diabetic hearts of db/db mice. The microenvironment enveloping cardiac myocytes in type 2 diabetes is distinct from that of type 1 diabetes, which may result in different changes of fission/fusion proteins in the heart. Consistent with the findings of our study, Bach et al. reported that Mfn2 was significantly down-regulated in human skeletal muscle at both the mRNA and protein levels in type 2 diabetes [45]. Another in vivo study also showed that Mfn2 was reduced in rat cardiac tissue in different stages of diabetes [46]. Nevertheless, cardiac tissues from type 2 DM patients showed reduced expression of Mfn1 [47]. The inconsistent results may be due to the fact that the biopsies were taken from the right atrium, not the left ventricular tissue where the DCM pathology is the most obvious [48].
Mfn2 was originally identified as a mitochondrial protein mediating mitochondrial outer membrane fusion. Interestingly, recent data have shown that Mfn2 appears to have a number of pleiotropic non-fusion roles, which plays an important role in cardiac disease. Mfn2 has been reported to tether the endoplasmic reticulum to the mitochondria for Ca2+ signalling from the endoplasmic reticulum to mitochondria [49, 50]. Moreover, Mfn2 plays a crucial role in the cardiac autophagic process by facilitating the fusion between autophagosome and lysosome, and Mfn2 deficiency impairs autophagosome-lysosome fusion and gradually leads to cardiac vulnerability and dysfunction [51, 52]. In our study, the protective effects of Mfn2 in HG/HF-treated cardiomyocytes are blunted by fission activator FCCP, while fusion activator M1 restored mitochondrial fusion and exerted the protective effects in Mfn2-knockdown cardiomyocytes, suggesting that imbalanced mitochondrial dynamics induced by down-regulated Mfn2 could be the main cause of cardiac dysfunction in diabetic hearts. Nevertheless, other non-fusion roles besides Mfn2 defect such as impaired autophagosome degradation and the disruption of endoplasmic reticulum-mitochondria signalling may also be involved in the pathogenesis of DCM, which can be reversed by the reconstitution of Mfn2. In our study, mitochondrial fission activator FCCP or Ad-Drp1 have no significant effects on the percentage of cells with mitochondrial fragmentation and the percentage of apoptotic cells in HG/HF-treated cardiomyocytes without Mfn2 overexpression. The reason for this may be that there exist shared mechanisms of action between HG/HF and FCCP or Ad-Drp1 treatments. As shown in our study, HG/HF-treated cardiomyocytes exhibit reduced mitochondrial membrane potential and increased expression of phospho-Ser616-Drp1 (the active form of Drp1), which are similar with the actions of FCCP or Ad-Drp1.
Increased incidence of cardiac arrhythmias was also identified in DCM animals in recent studies [53, 54]. Emerging evidence indicates that mitochondrial dysfunction can impair cardiac electrical functioning by disturbing the intracellular ion homeostasis and membrane excitability through decreased ATP production and excessive reactive oxygen species (ROS) generation, resulting in increased susceptibility to cardiac arrhythmias [55]. In our study, reconstitution of Mfn2 suppressed mitochondrial ROS generation and improved mitochondrial function in DCM. Moreover, previous study has shown that vagus nerve stimulation exerted cardioprotection against myocardial ischemia/reperfusion injury via attenuation of mitochondrial dysfunction, increased mitochondrial fusion, decreased mitochondrial fission [56]. Although there was no study investigating the role of Mfn2 in cardiac arrhythmias up to now, it is speculated that overexpression of Mfn2 may reduce the incidence of cardiac arrhythmias in DCM by inhibiting mitochondrial oxidative stress and ameliorating mitochondrial dysfunction.
Another important finding of the present study is that down-regulated Mfn2 in diabetic hearts is partly attributed to decreased expression of transcription factor PPARα, which is supported by the suppression of PPARα observed in various tissue from animal models and patients with type 2 diabetes [57, 58]. PPARα, a main member of the nuclear receptor super family PPARs, plays a critical role in the lipid metabolism by regulating their oxidation and storage [59]. Moreover, PPARα has been reported to suppress the myocardial inflammatory responses when activated by synthetic ligands [60, 61]. Reduced expression of PPARα is observed in pressure overload-induced cardiac hypertrophy [62, 63]. In the present study, we found that overexpression of PPARα increases the expression of Mfn2 and promotes mitochondrial fusion in HG/HF-treated cardiomyocytes, whereas knockdown of PPARα exhibits the opposite effect. Elezabya et al. have reported that both PPARα and Mfn2 are significantly down-regulated in mice with cardiomyocyte-specific lipid overload, accompanied by marked decreases in mitochondrial size [64]. In addition, previous study has showed that chronic exposure to fatty acid excess downregulates PPARα expression in the cardiomyocytes, the downregulation of PPARα may lead to further myocardial damage by suppressing cellular free fatty acid oxidation [65]. It seems that the downregulation of PPARα and Mfn2 is a result of dysregulated lipid metabolism in diabetic hearts.
This study has several limitations. First, as a result of ethical issues, the expression of Mfn2 cannot be determined in the left ventricular tissue of diabetic patients. Second, not all the conclusions were obtained from in vivo study. Third, the cause of down-regulated Mfn2 in DCM is still largely unknown, although we identified the suppression of PPARα was involved. The significant positive correlation between the expression of Mfn2 and PPARα was proved from public microarray mRNA expression data derived from the heart failure patients with or without diabetes. Since clinical metabolic/functional data was not included in this database, it is hard for us to correlate Mfn2 and PPARα expression in human heart tissue with clinical metabolic/functional data and to quantify expression of some of the proteins analysed in the main experimental study. Maybe further study is needed to clarify the correlation between PPARα/Mfn2 and clinical metabolic/functional data in diabetic patients. Despite these limitations, we believe that our study has provided important new insights for understanding the role of abnormal mitochondrial dynamics in type 2 DCM.
In summary, our study provides compelling evidence that imbalanced mitochondrial dynamics induced by down-regulated Mfn2 promoted mitochondrial dysfunction and diabetic cardiomyopathy, and the reconstitution of mitochondrial fusion through overexpression of Mfn2 restores mitochondrial homeostasis and alleviates the development of diabetic cardiomyopathy. The findings suggest that targeting mitochondrial dynamics by regulating Mfn2 might be a potential therapeutic strategy for diabetic cardiomyopathy.
Abbreviations
ATP: adenosine-triphosphate; DCM: diabetic cardiomyopathy; DM: diabetes mellitus; Drp1: dynamic-related protein1; FCCP: carbonyl cyanide m-chlorophenylhydrazone; Fis1: mitochondrial fission 1 protein; FoxO1: forkhead box protein O1; LVEF: left ventricular ejection fraction; LVFS: left ventricular fraction shortening; MnSOD: manganese superoxide dismutase; MDA: malondialdehyde; Mfn1: Mitofusin1; Mfn2: mitofusin2; Nox4: NADPH oxidase 4; Opa1: optic atrophy 1; OCR: oxygen consumption rate; PPARα: peroxisome proliferators-activated receptors alpha; PPARγ: peroxisome proliferators-activated receptors gamma; PPARδ: peroxisome proliferators-activated receptors delta; PGC-1α: Peroxisome proliferator-activated receptor gamma co-activator 1-alpha; ROS: reactive oxygen spices; STZ: Streptozocin; Stat3: Signal transducer and activator of transcription 3; TG: triglyceride; TC: total cholesterol.
Supplementary Material
Supplementary figures and information.
Acknowledgements
This work was supported by the grants from the National Natural Science Foundation of China (No. 81770369, No. 81570252, No. 81670354, No. 81600235), Key Research and Development Plan of Shaanxi (No. 2018SF-294), Innovation Capability Support Program of Shaanxi (Program No. 2019KJXX-084) and the Fundamental Research Funds for the Central Universities (No. xzy012019115).
Contributions
Yan Li and Feng Fu conceived and designed the study. Lang Hu, Mingge Ding, Daishi Tang, Kaiyan Wang and Feng Fu performed the animal experiments. Lang Hu, Mingge Ding, Daishi Tang, Kaiyan Wang and Jihuan Qiu carried out the cell experiments. Lang Hu, Mingge Ding, Daishi Tang, Huishou Zhao and Pan Chang performed the molecular biology experiments. Lang Hu, Mingge Ding, Daishi Tang and Bingchao Qi analyzed the data. Lang Hu drafted the manuscript. Feng Fu and Yan Li revised and edited the manuscript. All authors have read and approved the final version of this manuscript.
Competing Interests
The authors have declared that no competing interest exists.
References
1. Wild S, Roglic G, Green A, Sicree R, King H. Global prevalence of diabetes: estimates for the year 2000 and projections for 2030. Diabetes Care. 2004;27:1047-53
2. Yach D, Stuckler D, Brownell KD. Epidemiologic and economic consequences of the global epidemics of obesity and diabetes. Nat Med. 2006;12:62-6
3. Bugger H, Abel ED. Molecular mechanisms of diabetic cardiomyopathy. Diabetologia. 2014;57:660-71
4. Nathan DM. Diabetes: Advances in Diagnosis and Treatment. Jama. 2015;314:1052-62
5. Aon MA, Tocchetti CG, Bhatt N, Paolocci N, Cortassa S. Protective mechanisms of mitochondria and heart function in diabetes. Antioxid Redox Signal. 2015;22:1563-86
6. Schilling JD. The mitochondria in diabetic heart failure: from pathogenesis to therapeutic promise. Antioxid Redox Signal. 2015;22:1515-26
7. Verma SK, Garikipati VNS, Kishore R. Mitochondrial dysfunction and its impact on diabetic heart. Biochim Biophys Acta Mol Basis Dis. 2017;1863:1098-105
8. Anderson EJ, Kypson AP, Rodriguez E, Anderson CA, Lehr EJ, Neufer PD. Substrate-specific derangements in mitochondrial metabolism and redox balance in the atrium of the type 2 diabetic human heart. J Am Coll Cardiol. 2009;54:1891-8
9. Ansley DM, Wang B. Oxidative stress and myocardial injury in the diabetic heart. J Pathol. 2013;229:232-41
10. Galloway CA, Yoon Y. Mitochondrial dynamics in diabetic cardiomyopathy. Antioxid Redox Signal. 2015;22:1545-62
11. Wai T, Langer T. Mitochondrial Dynamics and Metabolic Regulation. Trends Endocrinol Metab. 2016;27:105-17
12. Vasquez-Trincado C, Garcia-Carvajal I, Pennanen C, Parra V, Hill JA, Rothermel BA. et al. Mitochondrial dynamics, mitophagy and cardiovascular disease. J Physiol. 2016;594:509-25
13. Chiong M, Cartes-Saavedra B, Norambuena-Soto I, Mondaca-Ruff D, Morales PE, Garcia-Miguel M. et al. Mitochondrial metabolism and the control of vascular smooth muscle cell proliferation. Front Cell Dev Biol. 2014;2:72
14. Ong SB, Hall AR, Hausenloy DJ. Mitochondrial dynamics in cardiovascular health and disease. Antioxid Redox Signal. 2013;19:400-14
15. Serasinghe MN, Chipuk JE. Mitochondrial Fission in Human Diseases. Handb Exp Pharmacol. 2017;240:159-88
16. Kelley DE, He J, Menshikova EV, Ritov VB. Dysfunction of mitochondria in human skeletal muscle in type 2 diabetes. Diabetes. 2002;51:2944-50
17. Dabkowski ER, Baseler WA, Williamson CL, Powell M, Razunguzwa TT, Frisbee JC. et al. Mitochondrial dysfunction in the type 2 diabetic heart is associated with alterations in spatially distinct mitochondrial proteomes. Am J Physiol Heart Circ Physiol. 2010;299:H529-40
18. Lee H, Yoon Y. Mitochondrial fission and fusion. Biochem Soc Trans. 2016;44:1725-35
19. van der Bliek AM, Shen Q, Kawajiri S. Mechanisms of mitochondrial fission and fusion. Cold Spring Harb Perspect Biol. 2013:5
20. Nan J, Zhu W, Rahman MS, Liu M, Li D, Su S. et al. Molecular regulation of mitochondrial dynamics in cardiac disease. Biochim Biophys Acta Mol Cell Res. 2017;1864:1260-73
21. Ding M, Dong Q, Liu Z, Liu Z, Qu Y, Li X. et al. Inhibition of dynamin-related protein 1 protects against myocardial ischemia-reperfusion injury in diabetic mice. Cardiovasc Diabetol. 2017;16:19
22. Marin-Garcia J, Akhmedov AT. Mitochondrial dynamics and cell death in heart failure. Heart Fail Rev. 2016;21:123-36
23. Ji L, Liu F, Jing Z, Huang Q, Zhao Y, Cao H. et al. MICU1 alleviates diabetic cardiomyopathy through mitochondrial Ca2+-dependent antioxidant response. Diabetes. 2017;66:1586-600
24. Ding M, Feng N, Tang D, Feng J, Li Z, Jia M. et al. Melatonin prevents Drp1-mediated mitochondrial fission in diabetic hearts through SIRT1-PGC1alpha pathway. J Pineal Res. 2018;65:e12491
25. Chen L, Gong Q, Stice JP, Knowlton AA. Mitochondrial OPA1, apoptosis, and heart failure. Cardiovasc Res. 2009;84:91-9
26. Nan J, Hu H, Sun Y, Zhu L, Wang Y, Zhong Z. et al. TNFR2 Stimulation Promotes Mitochondrial Fusion via Stat3- and NF-kB-Dependent Activation of OPA1 Expression. Circ Res. 2017;121:392-410
27. Ma M, Song L, Yan H, Liu M, Zhang L, Ma Y. et al. Low dose tunicamycin enhances atherosclerotic plaque stability by inducing autophagy. Biochem Pharmacol. 2016;100:51-60
28. Liu M, Lu S, He W, Zhang L, Ma Y, Lv P. et al. ULK1-regulated autophagy: A mechanism in cellular protection for ALDH2 against hyperglycemia. Toxicol Lett. 2018;283:106-15
29. Feng Y, Bopassa JC. Oxygen surrounding the heart during ischemic conservation determines the myocardial injury during reperfusion. Am J Cardiovasc Dis. 2015;5:127-39
30. Maddocks OD, Berkers CR, Mason SM, Zheng L, Blyth K, Gottlieb E. et al. Serine starvation induces stress and p53-dependent metabolic remodelling in cancer cells. Nature. 2013;493:542-6
31. Fillmore N, Mori J, Lopaschuk GD. Mitochondrial fatty acid oxidation alterations in heart failure, ischaemic heart disease and diabetic cardiomyopathy. Br J Pharmacol. 2014;171:2080-90
32. Maalouf RM, Eid AA, Gorin YC, Block K, Escobar GP, Bailey S. et al. Nox4-derived reactive oxygen species mediate cardiomyocyte injury in early type 1 diabetes. Am J Physiol Cell Physiol. 2012;302:C597-604
33. Jin Q, Li R, Hu N, Xin T, Zhu P, Hu S. et al. DUSP1 alleviates cardiac ischemia/reperfusion injury by suppressing the Mff-required mitochondrial fission and Bnip3-related mitophagy via the JNK pathways. Redox Biol. 2018;14:576-87
34. Wang D, Wang J, Bonamy GM, Meeusen S, Brusch RG, Turk C. et al. A small molecule promotes mitochondrial fusion in mammalian cells. Angew Chem Int Ed Engl. 2012;51:9302-5
35. Nasrallah CM, Horvath TL. Mitochondrial dynamics in the central regulation of metabolism. Nat Rev Endocrinol. 2014;10:650-8
36. Blake R, Trounce IA. Mitochondrial dysfunction and complications associated with diabetes. Biochim Biophys Acta. 2014;1840:1404-12
37. Semeniuk LM, Kryski AJ, Severson DL. Echocardiographic assessment of cardiac function in diabetic db/db and transgenic db/db-hGLUT4 mice. Am J Physiol Heart Circ Physiol. 2002;283:H976-82
38. Aasum E, Hafstad AD, Severson DL, Larsen TS. Age-dependent changes in metabolism, contractile function, and ischemic sensitivity in hearts from db/db mice. Diabetes. 2003;52:434-41
39. Yue P, Arai T, Terashima M, Sheikh AY, Cao F, Charo D. et al. Magnetic resonance imaging of progressive cardiomyopathic changes in the db/db mouse. Am J Physiol Heart Circ Physiol. 2007;292:H2106-18
40. Aasum E, Belke DD, Severson DL, Riemersma RA, Cooper M, Andreassen M. et al. Cardiac function and metabolism in Type 2 diabetic mice after treatment with BM 17.0744, a novel PPAR-alpha activator. Am J Physiol Heart Circ Physiol. 2002;283:H949-57
41. Pereira L, Matthes J, Schuster I, Valdivia HH, Herzig S, Richard S. et al. Mechanisms of Ca2+ transient decrease in cardiomyopathy of db/db type 2 diabetic mice. Diabetes. 2006;55:608-15
42. Giachetti A. Axoplasmic transport of noradrenaline in the sciatic nerves of spontaneously diabetic mice. Diabetologia. 1979;16:191-4
43. Tessari F, Travagli RA, Zanoni R, Prosdocimi M. Effects of long-term diabetes and treatment with gangliosides on cardiac sympathetic innervation: a biochemical and functional study in mice. J Diabet Complications. 1988;2:34-7
44. Lehnen AM, Rodrigues B, Irigoyen MC, De Angelis K, Schaan BD. Cardiovascular changes in animal models of metabolic syndrome. J Diabetes Res. 2013;2013:761314
45. Bach D, Naon D, Pich S, Soriano FX, Vega N, Rieusset J. et al. Expression of Mfn2, the Charcot-Marie-Tooth neuropathy type 2A gene, in human skeletal muscle: effects of type 2 diabetes, obesity, weight loss, and the regulatory role of tumor necrosis factor alpha and interleukin-6. Diabetes. 2005;54:2685-93
46. Gao Q, Wang XM, Ye HW, Yu Y, Kang PF, Wang HJ. et al. Changes in the expression of cardiac mitofusin-2 in different stages of diabetes in rats. Mol Med Rep. 2012;6:811-4
47. Montaigne D, Marechal X, Coisne A, Debry N, Modine T, Fayad G. et al. Myocardial contractile dysfunction is associated with impaired mitochondrial function and dynamics in type 2 diabetic but not in obese patients. Circulation. 2014;130:554-64
48. Lorenzo-Almoros A, Tunon J, Orejas M, Cortes M, Egido J, Lorenzo O. Diagnostic approaches for diabetic cardiomyopathy. Cardiovasc Diabetol. 2017;16:28
49. de Brito OM, Scorrano L. Mitofusin 2 tethers endoplasmic reticulum to mitochondria. Nature. 2008;456:605-10
50. Merkwirth C, Langer T. Mitofusin 2 builds a bridge between ER and mitochondria. Cell. 2008;135:1165-7
51. Zhao T, Huang X, Han L, Wang X, Cheng H, Zhao Y. et al. Central role of mitofusin 2 in autophagosome-lysosome fusion in cardiomyocytes. J Biol Chem. 2012;287:23615-25
52. Chen Y, Dorn GW 2nd. PINK1-phosphorylated mitofusin 2 is a Parkin receptor for culling damaged mitochondria. Science. 2013;340:471-5
53. Liu Z, Cai H, Zhu H, Toque H, Zhao N, Qiu C. et al. Protein kinase RNA-like endoplasmic reticulum kinase (PERK)/calcineurin signaling is a novel pathway regulating intracellular calcium accumulation which might be involved in ventricular arrhythmias in diabetic cardiomyopathy. Cell Signal. 2014;26:2591-600
54. Soliman H, Nyamandi V, Garcia-Patino M, Zhang PC, Lin E, Jia ZP. et al. ROCK2 promotes ryanodine receptor phosphorylation and arrhythmic calcium release in diabetic cardiomyocytes. Int J Cardiol. 2019;281:90-8
55. Yang KC, Bonini MG, Dudley SC Jr. Mitochondria and arrhythmias. Free Radic Biol Med. 2014;71:351-61
56. Nuntaphum W, Pongkan W, Wongjaikam S, Thummasorn S, Tanajak P, Khamseekaew J. et al. Vagus nerve stimulation exerts cardioprotection against myocardial ischemia/reperfusion injury predominantly through its efferent vagal fibers. Basic Res Cardiol. 2018;113:22
57. Hu Y, Chen Y, Ding L, He X, Takahashi Y, Gao Y. et al. Pathogenic role of diabetes-induced PPAR-alpha down-regulation in microvascular dysfunction. Proc Natl Acad Sci U S A. 2013;110:15401-6
58. Ding J, Li M, Wan X, Jin X, Chen S, Yu C. et al. Effect of miR-34a in regulating steatosis by targeting PPARalpha expression in nonalcoholic fatty liver disease. Sci Rep. 2015;5:13729
59. Han L, Shen WJ, Bittner S, Kraemer FB, Azhar S. PPARs: regulators of metabolism and as therapeutic targets in cardiovascular disease. Part I: PPAR-alpha. Future Cardiol. 2017;13:259-78
60. Okayasu T, Tomizawa A, Suzuki K, Manaka K, Hattori Y. PPARalpha activators upregulate eNOS activity and inhibit cytokine-induced NF-kappaB activation through AMP-activated protein kinase activation. Life Sci. 2008;82:884-91
61. Marx N, Sukhova GK, Collins T, Libby P, Plutzky J. PPARalpha activators inhibit cytokine-induced vascular cell adhesion molecule-1 expression in human endothelial cells. Circulation. 1999;99:3125-31
62. Sorokina N, O'Donnell JM, McKinney RD, Pound KM, Woldegiorgis G, LaNoue KF. et al. Recruitment of compensatory pathways to sustain oxidative flux with reduced carnitine palmitoyltransferase I activity characterizes inefficiency in energy metabolism in hypertrophied hearts. Circulation. 2007;115:2033-41
63. Barger PM, Kelly DP. PPAR signaling in the control of cardiac energy metabolism. Trends Cardiovasc Med. 2000;10:238-45
64. Elezaby A, Sverdlov AL, Tu VH, Soni K, Luptak I, Qin F. et al. Mitochondrial remodeling in mice with cardiomyocyte-specific lipid overload. J Mol Cell Cardiol. 2015;79:275-83
65. Lee TI, Kao YH, Chen YC, Huang JH, Hsiao FC, Chen YJ. Peroxisome proliferator-activated receptors modulate cardiac dysfunction in diabetic cardiomyopathy. Diabetes Res Clin Pract. 2013;100:330-9
Author contact
![]() Corresponding authors: Yan Li, M.D., Ph.D., E-mail: profleeyancom Department of Cardiology, Xijing Hospital, Fourth Military Medical University. Tel:86-29-84775183, Fax: 86-29-84775183 or Feng Fu, M.D., Ph.D., E-mail: fufeng11edu.cn Department of Physiology and Pathophysiology, Fourth Military Medical University. Tel: 86-29-81862307, Fax: 86-29-84774520
Corresponding authors: Yan Li, M.D., Ph.D., E-mail: profleeyancom Department of Cardiology, Xijing Hospital, Fourth Military Medical University. Tel:86-29-84775183, Fax: 86-29-84775183 or Feng Fu, M.D., Ph.D., E-mail: fufeng11edu.cn Department of Physiology and Pathophysiology, Fourth Military Medical University. Tel: 86-29-81862307, Fax: 86-29-84774520