Impact Factor
- Issue 12; 2026
- Issue 11; 2026
- Issue 10; 2026
- Issue 9; 2026
- Issue 8; 2026
- Volume 16; 2026
- Advance Articles
- Past Issues
- Cover Images
- Cover Suggestion
- Index & Coverage
- Special Issues
Introduction
Methods
Results
Discussion
Abbreviations
Supplementary Material
Acknowledgements
References
International Journal of Biological Sciences
International Journal of Medical Sciences
 Global reach, higher impact

Theranostics 2019; 9(17):4946-4958. doi:10.7150/thno.35458 This issue Cite
Research Paper
Integrative multi-omics analysis identifies a prognostic miRNA signature and a targetable miR-21-3p/TSC2/mTOR axis in metastatic pheochromocytoma/paraganglioma
Bruna Calsina1#, Luis Jaime Castro-Vega2,3#, Rafael Torres-Pérez1, Lucía Inglada-Pérez1,4, Maria Currás-Freixes1, Juan María Roldán-Romero1, Veronika Mancikova1, Rocío Letón1, Laura Remacha1, María Santos1, Nelly Burnichon2,3,5, Charlotte Lussey-Lepoutre2,6, Elena Rapizzi7, Osvaldo Graña8, Cristina Álvarez-Escolá9, Aguirre A de Cubas1, Javier Lanillos1, Alfonso Cordero-Barreal1, Ángel M Martínez-Montes1, Alexandre Bellucci10, Laurence Amar2,3,11, Fabio Luiz Fernandes-Rosa2,3, María Calatayud12, Javier Aller13, Cristina Lamas14, Júlia Sastre-Marcos15, Letizia Canu7, Esther Korpershoek16, Henri J Timmers17, Jacques WM Lenders17,18, Felix Beuschlein19,20, Martin Fassnacht-Capeller21,22, Graeme Eisenhofer23, Massimo Mannelli7, Fátima Al-Shahrour8, Judith Favier2,3, Cristina Rodríguez-Antona1,4, Alberto Cascón1,4, Cristina Montero-Conde1, Anne-Paule Gimenez-Roqueplo2,3,5, Mercedes Robledo1,4 ![]()
1. Hereditary Endocrine Cancer Group, Human Cancer Genetics Program, Spanish National Cancer Research Centre (CNIO), Madrid, Spain
2. INSERM, UMR970, Paris-Cardiovascular Research Center, Equipe Labellisée par la Ligue contre le Cancer, Paris, France
3. Université Paris Descartes, PRES Sorbonne Paris Cité, Faculté de Médecine, Paris, France
4. Centro de Investigación Biomédica en Red de Enfermedades Raras (CIBERER), Madrid, Spain
5. Assistance Publique Hôpitaux de Paris, Hôpital Européen Georges Pompidou, Service de Génétique, Paris, France
6. Sorbonne Université, Pitié-Salpêtrière Hospital, Department of nuclear medicine, Paris, France
7. Department of Experimental and Clinical Biomedical Sciences, University of Florence, Florence, Italy
8. Bioinformatics Unit, Structural Biology Program, Spanish National Cancer Research Center (CNIO), Madrid, Spain
9. Servicio de Endocrinología y Nutrición, Hospital Universitario La Paz, Madrid, Spain
10. Assistance Publique-Hôpitaux de Paris, Hôpital Européen Georges Pompidou, Service de Radiologie, Paris, France
11. Assistance Publique-Hôpitaux de Paris, Hôpital Européen Georges Pompidou, Hypertension Unit, Paris, France
12. Department of Endocrinology and Nutrition Service, Hospital Universitario 12 de Octubre, Madrid, Spain
13. Department of Endocrinology, Puerta de Hierro University Hospital, Madrid, Spain
14. Department of Endocrinology, Albacete University Hospital Complex, Albacete, Spain
15. Department of Endocrinology, Virgen de la Salud Hospital-Toledo Hospital Complex, Toledo, Spain
16. Department of Pathology, Erasmus Medical Center Cancer Institute, University Medical Center Rotterdam, Rotterdam, The Netherlands
17. Department of Internal Medicine, Radboud University Medical Centre, 6525 HP Nijmegen, The Netherlands
18. Department of Medicine III, University Hospital and Medical Faculty Carl Gustav Carus, Technische Universität Dresden, Dresden, Germany
19. Medizinische Klinik und Poliklinik IV, Klinikum der Universität München, Munich, Germany
20. Klinik für Endokrinologie, Diabetologie und Klinische Ernährung, Universitätsspital Zürich, Zürich, Switzerland
21. Department of Internal Medicine I, Endocrine and Diabetes Unit, University Hospital Würzburg, University of Würzburg, Germany
22. Comprehensive Cancer Center Mainfranken, University of Würzburg, Germany
23. Institute of Clinical Chemistry and Laboratory Medicine, University Hospital Carl Gustav Carus, Medical Faculty Carl Gustav Carus, Technische Universität Dresden, Dresden, Germany
# These authors contributed equally
Received 2019-4-3; Accepted 2019-5-9; Published 2019-7-9
Abstract

Rationale: Pheochromocytomas and paragangliomas (PPGLs) are rare neuroendocrine tumors that present variable outcomes. To date, no effective therapies or reliable prognostic markers are available for patients who develop metastatic PPGL (mPPGL). Our aim was to discover robust prognostic markers validated through in vitro models, and define specific therapeutic options according to tumor genomic features.
Methods: We analyzed three PPGL miRNome datasets (n=443), validated candidate markers and assessed them in serum samples (n=36) to find a metastatic miRNA signature. An integrative study of miRNome, transcriptome and proteome was performed to find miRNA targets, which were further characterized in vitro.
Results: A signature of six miRNAs (miR-21-3p, miR-183-5p, miR-182-5p, miR-96-5p, miR-551b-3p, and miR-202-5p) was associated with metastatic risk and time to progression. A higher expression of five of these miRNAs was also detected in PPGL patients' liquid biopsies compared with controls. The combined expression of miR-21-3p/miR-183-5p showed the best power to predict metastasis (AUC=0.804, P=4.67·10-18), and was found associated in vitro with pro-metastatic features, such as neuroendocrine-mesenchymal transition phenotype, and increased cell migration rate. A pan-cancer multi-omic integrative study correlated miR-21-3p levels with TSC2 expression, mTOR pathway activation, and a predictive signature for mTOR inhibitor-sensitivity in PPGLs and other cancers. Likewise, we demonstrated in vitro a TSC2 repression and an enhanced rapamycin sensitivity upon miR-21-3p expression.
Conclusions: Our findings support the assessment of miR-21-3p/miR-183-5p, in tumors and liquid biopsies, as biomarkers for risk stratification to improve the PPGL patients' management. We propose miR-21-3p to select mPPGL patients who may benefit from mTOR inhibitors.
Keywords: multi-omic integration, pheochromocytoma/paraganglioma, miR-21-3p, liquid biopsy, prognostic biomarker
Introduction
Pheochromocytomas and paragangliomas (PPGLs) are rare neuroendocrine tumors (3-8 cases per 106 person-year) with marked genetic heterogeneity [1]. Approximately 15-20% of patients with PPGLs develop metastases, and the 5-year overall survival rate after diagnosis of the first metastasis is 60% [2, 3]. Altough clinical characteristics such as tumor size, extra-adrenal location and increased plasma concentration of 3-methoxytyramine could provide useful information to estimate the likelihood of metastasis [4-6], there are no histological criteria or clinically validated molecular biomarkers to identify patients whose tumors will become metastatic. Currently, SDHB mutation status is the only genetic factor associated with poor prognosis [7]. We recently reported that assessment of telomerase activation and ATRX mutations in tumor tissue may have clinical significance for identifying metastatic disease (mPPGLs) [8]. Nevertheless, most mPPGLs are currently diagnosed at advanced stages, thus precluding successful management of the disease [9]. Furthermore, no effective therapies are available for patients who develop mPPGL [10].
High-throughput omic platforms are robust technologies for identifying molecular mechanisms of tumorigenesis and potential markers for diagnosis, prognosis and response to treatment. In PPGLs, genomic profiling has led to the identification of several markers related to clinical variables, including mPPGL [11-13].
miRNAs regulate gene expression at the post-transcriptional level by targeting mRNAs for degradation and/or repressing their translation. Altered expression of miRNAs has been shown to be paramount for cancer-related processes, becoming a new class of cancer biomarkers detectable in tumor tissues and circulation. In PPGLs patients, some miRNAs have been associated with genotype or mPPGL [12, 14-21]. However, most series studied so far were small with limited follow-up, and lacked validation, which hinders the identification of miRNAs with prognostic value.
Here, we perform a comprehensive analysis of miRNomes from 443 PPGLs with clinical and genetic information, aimed at identifying miRNAs predictive for mPPGL. We provide evidence of a metastatic signature, assessed in tumors and liquid biopsies, with prognostic value. Furthermore, integrative miRNA-mRNA analysis, TCGA proteomics and in vitro assays support a new role of miR-21-3p in mTOR pathway regulation, with potential therapeutic implications for mPPGL (Figure S1).
Methods
miRNA discovery
Discovery of differentially expressed miRNAs. Three different public datasets [12, 16, 17] were used for extracting miRNA expression data from 443 samples and computing miRNA differential expression between metastatic and non-metastatic groups in each sub-series. Full details on bioinformatics analyses and filtering criteria applied for selecting miRNAs for validation are provided in Supplementary Methods.
Confirmation of differentially expressed miRNAs in a validation series. Validation of selected miRNAs was performed in 49 genetically characterized formalin-fixed paraffin-embedded primary tumors. Patients provided informed consent for the use of specimens and clinical data in accordance with the guidelines of the institutional ethics committees. Furthermore, a set of eight paired primary-metastatic samples was used to assess miRNAs with significant association in the validation step. The main characteristics of this series are presented in Table S1. RNA extraction and miRNA quantification are detailed in Supplementary Methods. One-sided nonparametric Mann-Whitney test (GraphPad Prism, RRID:SCR_002798) was used to confirm selected miRNAs deregulation in validation series, based on the assumption that miRNAs had to follow the same direction as in the discovery series.
Clinical outcome analysis of validated miRNAs. Time to progression (TTP) was evaluated with the Kaplan-Meier method and differences between the groups were tested with the log-rank test (SPSS, RRID:SCR_002865) for each validated miRNA. TTP was defined as the time between the first PPGL diagnosis and the first documented metastases. We included 246 patients from the discovery and validation series, either presenting metachronous metastases (presented ≥ one year after diagnosis), or with more than one-year follow-up (median follow-up time=1290 days). Patients without evidence of metastases were censored at the date of the last follow-up.
Risk model of metastasis prediction. The models were constructed using stepwise conditional logistic regression with the total cohort of 492 patients (443 from the discovery set plus 49 from the validation series). miRNAs associated with a shorter TTP were included in the analysis. To combine the data, the expression of each miRNA was expressed as a dichotomous variable using the median miRNA expression as the cutoff in each series. Additionally, we included binary variables that identified the different series and the SDHB status. The classification power of the model was evaluated by computing receiver operating characteristic (ROC) curves and area under the ROC curves (AUC).
Integration of miRNA and mRNA expression data: Targetome
Integration of miRNA and mRNA expression profiles of the discovery series. To identify genes potentially regulated by miR-183-3p and miR-21-3p, we considered only samples from the discovery series with miRNA and mRNA expression data available (n=434), and assumed a regulatory role for a miRNA only if the expression level of the miRNA and its known mRNA target showed a significant negative correlation (P<0.05). Analysis and interpretation were carried out in three steps:
Step 1. Generation of a list of candidate target genes for each miRNA from the validated miRNA-target interactions (1027 for miR-183-5p and 853 for miR-21-3p) extracted from miRTarBase release 6.1 [22] (http://mirtarbase.mbc.nctu.edu.tw/), OncomiRDB [23] (http://lifeome.net/database/oncomirdb/) and TarBase v.7.0 [24] (http://diana.imis.athena-innovation.gr/DianaTools/index.php?r=tarbase/index).
Step 2. Generation of normalized mRNA expression matrices including only step 1 genes (Targetome) for each sub-series. Further details are specified in Supplementary Methods.
Step 3. Identification of potential target mRNAs by matching the expression of the miRNAs and their predicted target genes. Spearman's correlations between the six Targetome matrices considering each of the three sub-series and the expression of each of the two miRNAs were calculated using R. We further examined genes with significant correlations (P<0.05) and ρ<-0.4 in at least one series. Of these genes, only those with either a significant negative correlation in both other remaining series or represented by at least two probes in one sub-series, were considered. Finally, only genes proposed in the literature as potential tumor suppressors or involved in differentiation were taken into account for further consideration in the validation series and the cell model.
Expression of potential target genes in the validation series. Candidate target genes selected in the integration analysis were quantified by qPCR in the 49 tumor samples from the validation series as described in Supplementary Methods. Spearman's correlation analysis of mRNA-miRNA expression was performed.
Pan-cancer targeted integrative analysis of miRNA, mRNA and functional proteomics
We included 8,960 human cancer samples representing 32 different major tumor types for which TCGA data on miRNA expression was available. RNA-seq, miRNA-seq and reverse-phase protein array (RPPA) data were downloaded from UCSC Xena (http://xena.ucsc.edu/) and cBioPortal (http://www.cbioportal.org/). Spearman's correlation coefficient was used to assess the correlation of miRNA and gene/protein levels (SPSS). Results representations were obtained using the ggplot2 R package (RRID:SCR_014601).
PI3K/AKT/mTOR drug sensitivity signature. We applied the sensitivity signature scores for the TCGA dataset reported by Zhang et al. [25], which were derived from the signature obtained in cell lines after treatment with PI3K/AKT/mTOR inhibitors [26], and performed a correlation analysis between miR-21-3p expression and the PI3K/AKT/mTOR drug sensitivity signature.
Functional assays in cell models
Plasmids and cell lines. The MIMIC Inducible Human Lentiviral microRNA vector with the mCMV promoter, the TurboGFP reporter and hsa-miR-183-5p (VSH6904-224645044, Dharmacon), and the MIMIC Inducible Human Lentiviral microRNA vector with the mCMV promoter, the TurboRFP reporter and hsa-miR-21-3p (VSH6904-224638696, Dharmacon), were stably introduced into the previously generated and authentified human neuroblastoma cell lines SK-N-AS wild-type (WT) and SK-N-AS SDHB KD (SDHB knocked down) [27]. SMARTvector Inducible Non-targeting Controls (VSC6570 and VSC6571) were used as controls. Transduced cells were selected using puromycin at 1 μg/ml, and cells with high expression of the reporter were FACS sorted and used for subsequent studies.
Cells were maintained in complete Dulbecco's Modified Eagle Medium (DMEM; Sigma#D5796), supplemented with 10% (v/v) fetal bovine serum (FBS, Sigma), 1% (v/v) penicillin/streptomycin, 0.6% (v/v) Fungizone (Gibco), puromycin (1 μg/ml) and G418 (0.3 mg/ml), and maintained at 37°C/5% CO2. Cells were routinely tested for mycoplasma and all experiments were performed between passage 10 and 20. miRNA and reporter expression was induced by treatment with 1 μg/ml of doxycycline; this concentration was selected following optimization experiments.
Wound healing migration assay. Experiments were performed as described in Rapizzi et al. [28]. Cell migration was quantified using ImageJ software (RRID: SCR_003070) at 15h and 24h after scratching, based on at least 18 pictures for each time point and condition. Experiments were performed in duplicate.
qPCR. Expression of neuroendocrine-to-mesenchymal transition (neuroendoMT) markers and potential miRNA gene targets was evaluated in the cell model by qPCR (Supplementary Methods).
Western blotting. Cells were seeded and treated as for RNA extraction, and total protein was extracted and homogenized in RIPA lysis buffer (Sigma) supplemented with protease and phosphatase inhibitors (Sigma). Protein concentration was measured using the Pierce BCA Protein Assay Kit (Thermo Scientific) and total proteins (20 μg) were separated by 10% SDS-PAGE and transferred onto a polyvinylidene difluoride membrane (Millipore, Darmstadt, Germany). Primary antibodies used in this study were rabbit anti-Tuberin/TSC2 mAb (1:1000; Cell Signaling #4308, RRID: AB_10547134), and mouse anti-β-Actin mAb (1:2000; Sigma#A5441, RRID: AB_476744). Absolute band intensities of the indicated proteins were captured and quantified with the Image Lab software v4.1 (BioRad, RRID: SCR_014210). β-Actin was used as loading control normalizer. Data were expressed in relative units using the control condition as reference.
Drug treatment. Doxycycline-pretreated cells (120h) were plated in 96-well plates at a density of 2000 cells/well and treated with different concentrations of rapamycin (Apollo Scientific #BIR8101) 24h later. The treatment duration was twice the cell doubling time (~96h) and the CellTitler-Glo (Promega) cell viability assay was used to assess cell viability by luminescence measurement using a Victor plate reader (PerkinElmer) 30 min after addition of the reagent.
Detection of circulating miRNAs
Serum samples from an independent exploratory series of 36 PPGL patients were enrolled by the COMETE network (France). Authorization was obtained from the institutional review board [Comité de Protection des Personnes, Ile de France III, June 2012]. Informed consent for studies on circulating miRNAs was signed by all patients. Clinical data from this series and the control cohort of adult healthy volunteers (n=10) is summarized in Table S2.
For the preparation of conditioned media (CM), wild type and Sdhb-/- immortalized mouse chromaffin cells (imCCs) [29] were seeded under standard culture conditions (DMEM/Glutamax, 10% FBS and 1% penicillin-streptomycin) and maintained at 5% CO2/37°C. Once cells reached an optimal confluence, the monolayer was washed with serum-free (SF) DMEM, and cells were replenished with SF media. After 24h, CM was collected, centrifuged and cells were counted.
For miRNA extraction with mirVana™ PARIS™ Kit (Thermo Fisher Scientific, Waltham, MA, USA), 450 µl of serum or filtered CM (0.2 µm pore size) from cultured cells were used. Droplet digital PCR was utilized for detection and quantification of circulating miRNAs as explained in Supplementary Methods. One-sided nonparametric Mann-Whitney test (GraphPad Prism) was used to test for differences in miRNAs levels in circulation between the different groups.
Results
miRNA profiling uncovers a signature of six miRNAs associated with metastatic risk
Exploring the discovery series, we identified 49 miRNAs differentially expressed in metastatic compared to non-metastatic cases (Figure 1A, Figure S2A, Table S3). After an extensive literature review (Table S4), six out of the eight selected miRNAs were validated (miR-21-3p, miR-182-5p, miR-96-5p, miR-551b-3p, miR-183-5p, miR-202-5p) (Figure S2B, Table S3).
miRNAs associated with metastatic behavior. (A) Venn diagram of differentially expressed miRNAs (FDR<0.05, |log2 fold change| ≥ 0.75) in the different sub-series of the discovery series (n=443). Downregulated miRNAs are indicated with a downward pointing arrow, and upregulated miRNAs are indicated with an upward pointing arrow. miRNAs selected for validation are shown in bold and are underlined. (B) Kaplan-Meier plots of time to progression (time between the first PPGL diagnosis and the first documented metastases) of patients according to the expression level of the indicated miRNA in tumor tissue. High expression (above the median expression level of the whole group) of the miRNA is represented in blue and low expression (below the median level) in green (n=246 patients from the discovery and validation series, either presenting metachronous metastases ─ presented ≥ one year after diagnosis ─, or with more than one-year follow-up - median follow-up time=1290 days). Patients without evidence of metastases were censored at the date of the last follow-up. P-values were calculated with a log-rank test. N: number of patients.
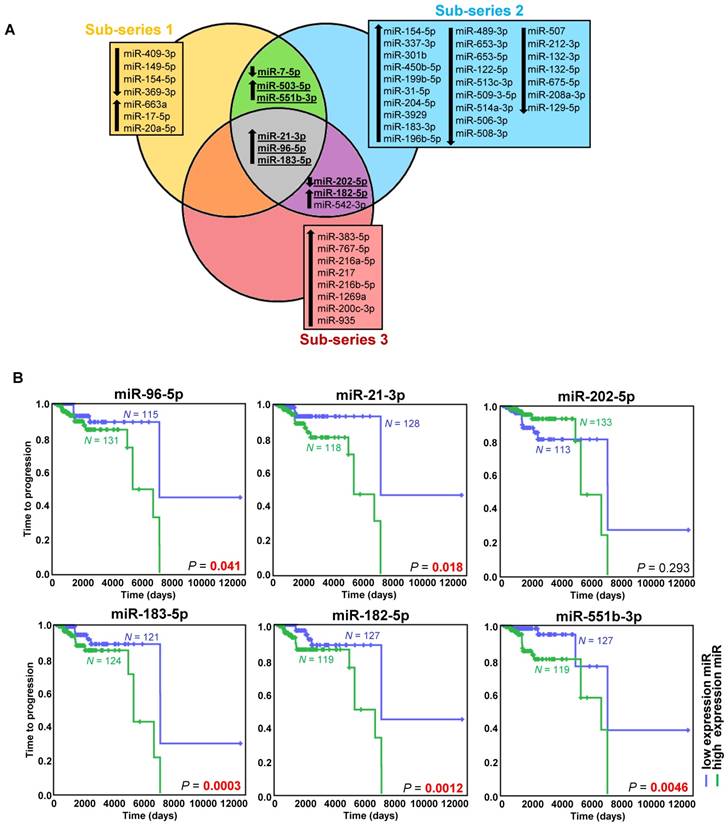
High expression of the five upregulated miRNAs was significantly associated with a shorter TTP (Figure 1B). Using the paired primary-metastatic tissues, we observed that these five miRNAs showed similar levels in both tissues, and notably miR-21-3p was significantly upregulated in metastases versus primary tumors (P=0.0099) (Figure S2B).
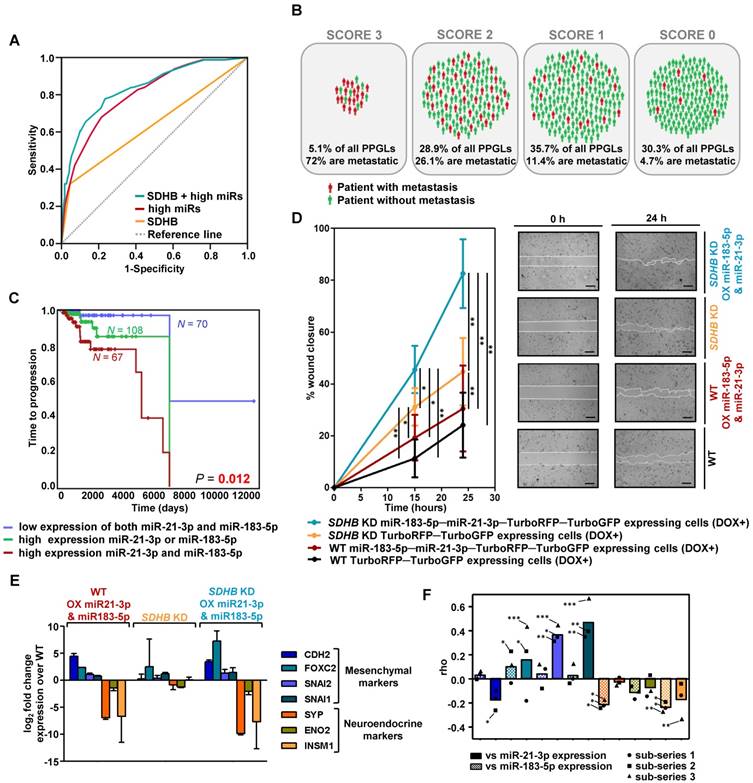
With the validated miRNAs associated with shorter TTP, we established a prognostic predictive model. The final model, corrected for SDHB status, selected miR-21-3p and miR-183-5p as the best predictive markers of metastases. The miRNA-based classifier (AUC=0.804, 95%CI=0.753-0.855, P=4.67·10-18) showed higher accuracy than SDHB genotype alone (AUC=0.637, 95%CI=0.563-0.711, P=9.29·10-5), while the predictive value increased when adding SDHB status to the model (AUC=0.837, 95%CI=0.787-0.886, P=9.88·10-22) (Figure 2A). When segregating patients according to their classifier features, 72% of score 3 (high miR-183-5p and miR-21-3p levels; SDHB mutated) patients were metastatic, compared to the 4.7% of score 0 (low miR-183-5p and miR-21-3p expression, and no-SDHB mutated) (Figure 2B). Concurrent high expression of miR-21-3p and miR-183-5p was significantly more associated with shorter TTP than high expression of either miRNA alone (Figure 2C).
Risk model of metastasis prediction. (A) Receiver operating characteristic curve analysis showing the accuracy of the miR-SDHB classifier to discriminate mPPGL patients. Data correspond to all samples from the discovery plus the validation series (n=492). miRNAs associated with a shorter TTP were included in the analysis. To combine the data of the different series for the generation of the model, the expression of each miRNA was expressed as a dichotomous variable using the median miRNA expression as the cutoff in each series. Binary variables that identified the different series and the SDHB status were included. AUC, 95%CI and P-values are given in the text. (B) Schematic representation of patients from discovery and validation series (n=492) divided into four groups depending on the miR-SDHB classifier (score 3 = high miR-183-5p and high miR-21-3p and SDHB mutated; score 2 = high miR-21-3p or high miR-183-5p and SDHB mutated, or high miR-21-3p and miR-183-5p and SDHB not mutated; score 1 = high miR-21-3p or high miR-183-5p or SDHB mutated; score 0 = none of the aforementioned criteria apply). Red icons: patients with mPPGL; green icons: non-metastatic patients. (C) Kaplan-Meier plot of TTP of patients according to the expression levels of the miRNAs indicated. High and low expression indicates expression above and below the median expression level of the whole group, respectively. N: number of patients. P-values were calculated with a log-rank test. (D) Wound healing assay in SK-N-AS cells with/without SDHB stably silenced and with/without ectopic expression of miR-21-3p and miR-183-5p. Wound area was assessed at 0, 15 and 24 h. Quantification is based on 18 pictures/condition, n=2. Error bars represent SD.*P<0.05, **P<0.01; two-tailed unpaired t-test. Scale bars=100 µm. (E, F) Expression of the indicated mesenchymal and neuroendocrine genes observed in the SK-N-AS cell model and in the discovery series. (E) Log2 fold change expression of the indicated genes relative to WT TurboRFP-TurboGFP-expressing control cells after normalization of each sample to β-actin. All cells were pretreated with doxycycline (1µg/ml, 120h). Expression is reported as mean of triplicates and error bars represent SD. (F) Spearman's correlations (rho) between the genes shown in Figure (E) and miR-21-3p (smooth columns) or miR-183-5p (dotted columns) expression in the discovery series. Bars indicate the mean of the 3 sub-series; individual values of each sub-series are also shown (•=sub-series 1, ■=sub-series 2, ▲=sub-series 3). ***P<1·10-9, **P<1·10-4, *P<0.05. DOX+: doxycycline pretreated cells (1µg/ml, 120h). WT: wild type; OX: overexpressing; KD: knock down.
High miR-183-5p and miR-21-3p expression trigger features related to a pro-metastatic phenotype
To further explore the role of miR-183-5p and miR-21-3p in metastasis, we evaluated in a cell model migration, proliferation and transition to a mesenchymal state, characteristics classically associated with an aggressive phenotype.
SDHB-deficient cells have an increased migration capacity compared to WT cells [29]. We replicated this phenotype in a wound healing assay and also observed increased migration of cells overexpressing miR-183-5p and miR-21-3p, both in the presence and absence of a functional SDHB gene (Figure 2D). However, we did not observe differences in cell proliferation.
It has been reported that SDHB loss is associated with a neuroendoMT [30], and we therefore assessed the expression of neuroendocrine (SYP, ENO2, INSM1) and mesenchymal (CDH2, FOXC2, SNAI2, SNAI1) markers to study whether overexpression of miR-21-3p and miR-183-5p acerbated this feature. Although cells did not show obvious morphological changes, overexpression of miR-21-3p and miR-183-5p increased expression of mesenchymal markers and decreased expression of neuroendocrine ones, both in WT and in SDHB-silenced cells (Figure 2E).
Expression of the same markers was evaluated in the discovery series. We observed that mesenchymal markers showed a positive correlation and neuroendocrine markers a negative one with the expression of the two miRNAs (Figure 2F). miR-21-3p generally increased the expression of mesenchymal markers, whereas miR-183-5p decreased the expression of neuroendocrine genes.
Integration of mRNA and miRNA expression reveals that TSC2 mRNA is reduced upon high miR-21-3p levels
We integrated the miR-21-3p and miR-183-5p expression data with their targetomes to identify potential relevant targets for these miRNAs. A significant negative correlation was observed in 43.3% of predicted miR-21-3p targets, and in 10.7% of miR-183-5p ones in at least one sub-series (Figure 3A and 3B); of these, only ten genes met the established filtering criteria for miR-21-3p and four for miR-183-5p (Table S5 and S6). After applying biological criteria (Table S7), six genes (TSC2, SGPL1, CREBL2 and CALM1 for miR-21-3p; SMAD7 and RAI2 for miR-183-5p) were selected for replication in the validation series (Figure 3C). Only TSC2 expression showed a significant negative correlation with miR-21-3p expression in this series (ρ=-0.324, P=0.023).
Identification of potential gene targets of miR-21-3p and miR-183-5p. (A, B) Venn diagrams summarizing significant genes showing a negative correlation (P<0.05) with miR-21-3p and miR-183-5p expression, respectively, in each sub-series of the Discovery series. Only genes shared between at least two sub-series are shown; rho and p-values are shown in Tables S4 and S5. Genes selected for validation are shown in bold. (C) Bubble diagram showing the correlation between mRNA levels of selected target genes in the discovery and validation series; the colors of the bubbles indicate the rho-value and their diameter is proportional to - log10(P) as indicated below the panel. NA: data not available. (D) Bubble diagrams showing the correlations between mRNA expression of the selected target genes and miRNA expression across 32 TCGA projects representing the major cancer types: LAML, acute myeloid leukemia; ACC, adrenocortical carcinoma; BLCA, bladder urothelial carcinoma; LGG, brain lower grade glioma; BRCA, breast invasive carcinoma; CESC, cervical squamous cell carcinoma and endocervical adenocarcinoma; CHOL, cholangiocarcinoma; COAD, colon adenocarcinoma; READ, rectum adenocarcinoma; ESCA, esophageal carcinoma; HNSC, head and neck squamous cell carcinoma; KICH, kidney chromophobe; KIRC, kidney renal clear cell carcinoma; KIRP, kidney renal papillary cell carcinoma; LIHC, liver hepatocellular carcinoma; LUAD, lung adenocarcinoma; LUSC, lung squamous cell carcinoma; DLBC, lymphoid neoplasm diffuse large B-cell lymphoma; MESO, mesothelioma; OV, ovarian serous cystadenocarcinoma; PAAD, pancreatic adenocarcinoma; PCPG, pheochromocytoma and paraganglioma ('PPGL' in our report); PRAD, prostate adenocarcinoma; SARC, sarcoma; SKCM, skin cutaneous melanoma; STAD, stomach adenocarcinoma; TGCT, testicular germ cell tumors; THYM, thymoma; THCA, thyroid carcinoma; UCS, uterine carcinosarcoma; UCEC, uterine corpus endometrial carcinoma; PANCAN: dataset downloaded from UCSC Xena. Glioblastoma multiforme was not included in the study since miRNA expression data was not available in UCSC Xena. n: number of samples per project. Colors and diameters of the bubbles are as in (C) and are summarized at the bottom of the panel. (E) Normalized mRNA expression of genes selected from the targetome in miR-21-3p─TurboRFP expressing cells (TSC2, SGPL1, CREBL1, CALM1) or miR-183- 5p─TurboGFP expressing cells (SMAD7). Expression for each condition is normalized to β-actin and expression in control cells (mean + SD; n=3). We represent the average of WT and SDHB KD cells of the mean-centered expression of the miRNA expressing cells (DOX+) over TurboRFP or TurboGFP expressing control cells (DOX+), respectively after initial doxycycline stimulation (1µg/ml) at t0. Two-tailed unpaired t-test was applied to test for differences with control cells not overexpressing miRNA (*: P<0.05). Red arrows indicate medium changes (DOX-stimulation).
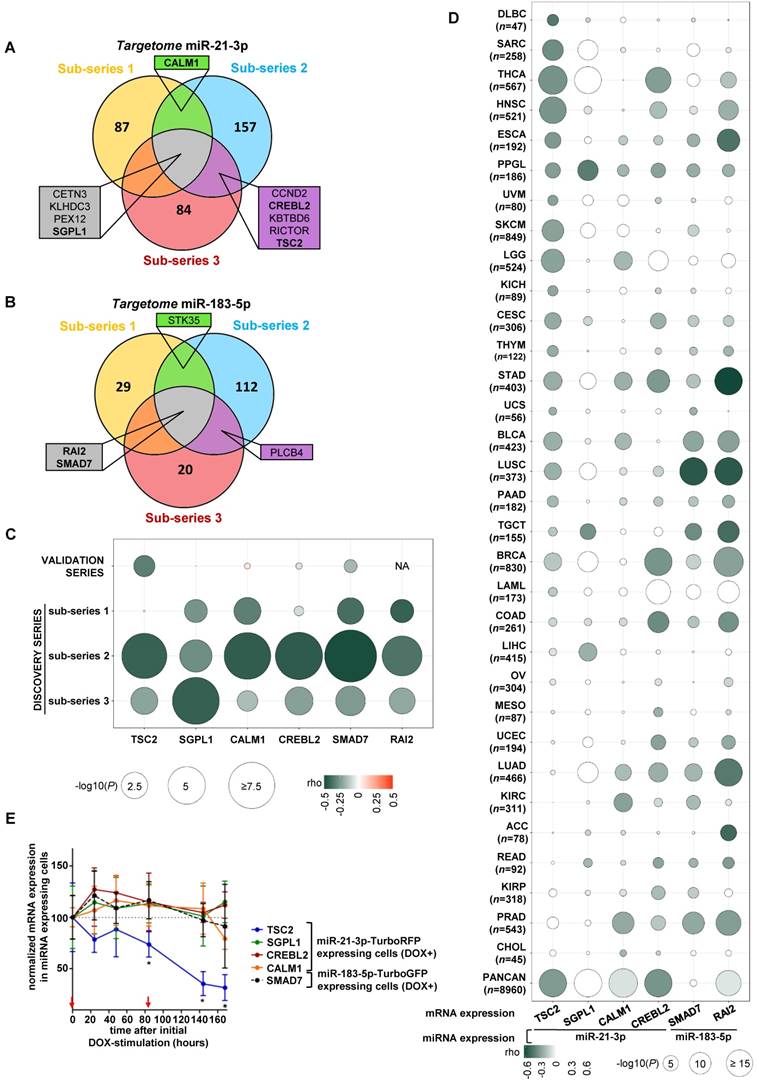
In parallel, 32 cancers TCGA data sets were used to assess the correlation between the expression of selected gene-miRNA pairs. Of them, 62.5% showed a significant negative correlation between miR-21-3p and TSC2 expression. Furthermore, the analysis performed with the whole PanCan (n=8,960 tumors) cohort indicated that only TSC2 and CREBL2 showed a significant negative correlation (ρ<-0.3, P<1·10-200) with miR-21-3p expression (Figure 3D).
Expression of the six aforementioned genes was evaluated in the cell models overexpressing the miRNAs, and only TSC2 showed a significant decrease in expression (Figure 3E).
Using TargetScan (http://www.targetscan.org/vert_72/), we found binding sites at 3'UTR in CREBL2, SGPL1 and CALM1 (Figure S3A, S3B and S3C) for miR-21-3p, but none in the remaining genes. However, extensive visual inspection of miRNA sequences and the 3'UTRs of TSC2, SMAD7 and RAI2 revealed potential binding sites (Figure S3A, S3E and S3F).
Role of miR-21-3p in mTOR pathway regulation
Using functional proteomics data from the TCGA project, we evaluated the effect that miR-21-3p could have on protein levels. In PPGLs, we found a significant negative correlation for miR-21-3p expression with TSC2 protein levels (ρ=-0.31, P=4.5·10-3), as well as a positive one with pS6 (in Ser235/236: ρ=0.36, P=9.1·10-4; in Ser240/244: ρ=0.20, P=0.07) (Figure 4A); a positive correlation tendency with pAKT levels was also observed (Figure S4).
Involvement of miR-21-3p in mTOR pathway regulation. (A) Bubble plot indicating Spearman's correlations (rho) between key mTOR pathway proteins that could be affected by TSC2 mRNA downregulation and miR-21- 3p upregulation. TCGA RPPA data of TSC2 protein, p-S6 S235/236 and S240/244 was correlated with miR-21-3p expression in PPGL and LGG TCGA samples (showing the highest mTOR pathway activity reported by Zhang et al.[25]), as well as in KICH and PAAD samples (lowest levels of mTOR pathway activity); bubble colors indicate the rho coefficient and their diameter is proportional to - log10(P) as indicated below the panel. (B) Representative western blot of TSC2 expression in SK-N-AS WT and SDHB KD cells, with or without ectopic expression of miR-21-3p (miR-21-3p-TurboRFP expressing cells DOX + and control TurboRFP expressing cells DOX +, respectively). Relative quantification of the TSC2 signal in miR-21-3p expressing cells was normalized to the one in TurboRFP expressing cells (DOX +). B-actin has been used as loading control. (C) Scatter plots showing the correlation between miR-21-3p expression and PI3K/AKT/mTOR drug sensitivity signature (from Zhang et al.[25]) in PPGL (n=178) and LGG (n=514) tumors from the TCGA project. Spearman's correlation coefficient (ρ) and P-values are shown. (D) Cell viability percentage in SK-N-AS miR-21-3p - TurboRFP cells (induced with doxycycline [DOX+] or not [DOX-]) and in SK-N-AS TurboRFP [DOX+] cells treated with the indicated concentrations of rapamycin for 96h. Proportion of viability is shown as the mean ± SD of 2-paired independent experiments performed in triplicate. Two-tailed unpaired t-test was applied to test for differences (*: P<0.01). DOX+: doxycycline pretreated cells (1µg/ml, 120h).
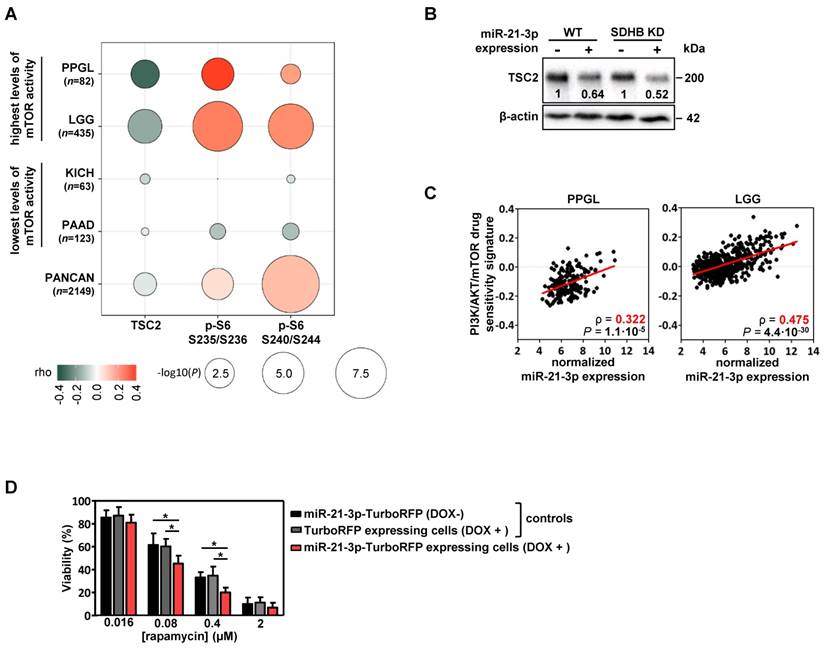
We also explored the potential role of miR-21-3p in other cancer types with high levels of mTOR activity [25]. Apart from PPGL, low-grade glioma (LGG) also exhibits a significant negative correlation between miR-21-3p and TSC2 (ρ=-0.18, P=1.3·10-4), as well as a positive one with pS6 levels (in Ser235/236: ρ=0.27, P=1.7·10-8; in Ser240/244: ρ=0.23, P=6.6·10-7) (Figure 4A). By contrast, in cancer types with the lowest levels of mTOR activity (kidney chromophobe -KICH- and pancreatic adenocarcinoma -PAAD-) no significant correlations were observed. Downregulation of TSC2 in cells overexpressing miR-21-3p was further demonstrated by Western blot (Figure 4B).
To determine whether miR-21-3p levels could also be associated with an increased response to drugs targeting mTOR pathway, we explored the inhibitor-sensitivity mRNA signature proposed by Zhang et al. [25] for TCGA project samples. This signature score correlated significantly with miR-21-3p levels in PPGL and LGG (Figure 4C), but not for KICH and PAAD (Figure S5).
Furthermore, cells with ectopic expression of miR-21-3p showed a significant reduction in cell proliferation after rapamycin treatment in comparison to their controls (Figure 4D).
Metastatic miRNA signature is detected in the circulation
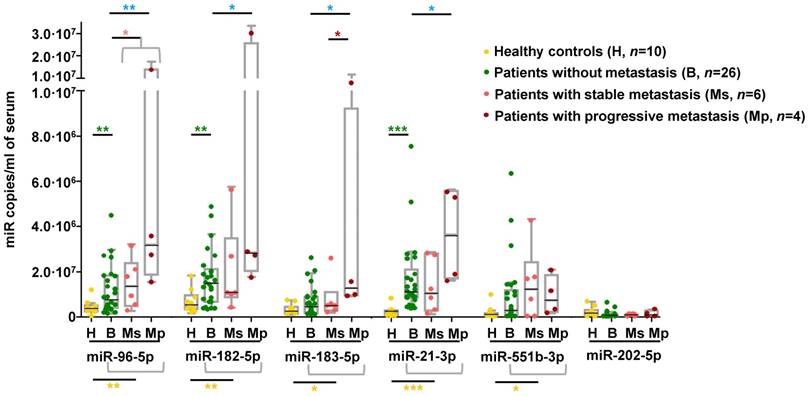
We explored whether the miRNA signature displayed by metastatic tumors could be detected in circulation of an independent series of PPGL patients. We observed that serum levels of all miRNAs of the signature except miR-202-5p were significantly higher in PPGL patients than in healthy controls, regardless of the metastatic status (Figure 5). miR-96-5p, miR-182-5p and miR-21-3p remained elevated in PPGL vs. healthy individuals, with miR-21-3p being the best discriminator (AUC=0.96; P=0.0001). Notably, circulating levels of all miRNAs of the signature (except miR-551b-3p and miR-202-5p) exhibited a tendency towards increased expression in mPPGLs compared to non-metastatic cases, reaching statistical significance in the mPPGL subgroup with evidence of progressive disease (Table S8). Levels of miR-183-5p remained significantly higher in patients with progressive vs. stable mPPGL. Levels of miR-21-3p were significantly correlated with metastatic burden (r=0.38; P=0.04).
Detection of mPPGL-related miRNAs in the circulation. Box and whisker plots indicate serum levels of the indicated miRNAs in healthy (H, yellow), non-metastatic (B, green) and mPPGL patients (Ms and Mp; orange and brown, respectively) determined by ddPCR. Distinction between stable mPPGL (Ms) and progressive mPPGL (Mp) was based on clinical and radiological data (see Table S8). Mann-Whitney test was applied to test for significant differences. Significant differences between H and the patient cohort (including B, Ms and Mp) are indicated with yellow asterisks, between H and B with green asterisks, between B and metastatic (including Ms and Mp) patients with pink asterisks, between B and Mp with blue asterisks, and Ms and Mp with red asterisks. *: P<0.05, **: P<0.01 and ***: P<0.00001.
To better ascertain if miRNAs of the metastatic signature are secreted by chromaffin cells, we quantified levels of these miRNAs in conditioned medium of imCCs, a model of PPGL. Consistent with the findings in serum of PPGL patients, miR-202-5p and miR-551b-3p, which exhibited low levels in patients, were undetectable in imCCs, whereas the levels of all other miRNAs were higher in Sdhb-/- compared to WT cells (Figure S6).
Discussion
Precision cancer medicine focuses on patients' stratification according to their metastatic risk, and/or potential treatment benefits. Rare cancers are becoming models for personalized medicine as more clinical, genetic and genomic knowledge leads to insights into signaling pathways and mechanisms underlying their pathogenesis. Here, we propose a new metastatic risk miRNA signature, with prognostic value and related to shorter TTP. Eventually, this signature could be measured as a circulating biomarker in serum from PPGL patients. Furthermore, our study reveals a new putative miR-21-3p/TSC2/mTOR regulatory axis as a potential treatment target.
The high expression cluster miR-183/96/182-5p in mPPGL was already reported in SDHx-related PPGLs [16, 17], but we now identified its high expression in mPPGLs regardless of their genotype. We also uncovered three novel markers of mPPGL, which have been described to be deregulated in multiple cancers (see Table S4). The fact that the model only includes miR-21-3p and miR-183-5p, and is able to discriminate metastatic patients with higher accuracy than SDHB-positive status (widely accepted as a mPPGL marker), suggests that additional important molecular features are involved in PPGL progression. This hypothesis is supported by the enhanced collective cell migration, likely driven by a neuroendoMT phenotype, observed in the wound healing assay after overexpression of miR-21-3p and miR-183-5p in an SDHB-silenced cell line.
The integration of miR-21-3p and miR-183-5p with mRNA data identified targets potentially regulated by those miRNAs, and that miR-21-3p may be involved in the regulation of the mTOR pathway through TSC2 mRNA downregulation. In this regard, the 3' UTR of TSC2 contains a 6mer pairing with miR-21-3p with a single nucleotide mismatch, which is compensated by a 4nt compensatory site downstream of the miRNA pairing sequence, similar to previously reported cases [31]. In addition, although other mechanisms such as targeting the 5'UTR and the open reading frame could also be considered, we cannot exclude the possibility of indirect effects of other responsive UTR targets of miR-21-3p as 43.3% of the 852 potential miR-21-3p gene targets showed an inverse correlation with the miRNA levels. In fact, we also found a weaker positive correlation of miR-21-3p with pAKT levels in PPGL and LGG, indicating a possible regulation upstream of the pathway through AKT phosphorylation, TSC1-TSC2 complex destabilization, TSC2 ubiquitination and, consequently, mTOR pathway activation [32].
To note, constitutive activation of PI3K/AKT/mTOR signaling is a feature described in PPGLs and associated with increased activation of pAKT [33]. Actually, both PPGL and LGG exhibit activation of this pathway despite a lack of canonical somatic alterations [25]. Taking advantage of the phospho-proteomics data from the TCGA project, we have shown that miR-21-3p correlates significantly with markers of mTOR pathway activation. We did not observe the effects on mTOR pathway activation after miR-21-3p overexpression in the cell model. However, protein output can vary by 2-fold without detectable effects, and consequences of most of the miRNAs alone are challenging to detect in the lab [31]. Taking into account our findings, additional mechanisms of activation of the mTOR pathway, such as miR-21-3p regulation, should be considered.
Studies targeting mTOR in preclinical PPGL models have provided some promising results [34-38], and there is also immunohistochemical evidence of heterogeneous mTOR activation in mPPGLs [39-41]. Nevertheless, discordant results have been reported in clinical studies with everolimus [42-44] that could be due to the absence of appropriate inclusion criteria using molecular markers. In fact, few studies have examined markers for stratifying mPPGL patients for targeted molecular therapies [3]. With this in mind, we have found in PPGL and LGG that miR-21-3p shows a significant correlation with a sensitivity signature of drugs targeting mTOR pathway. The enhanced sensitivity to rapamycin of our miR-21-3p overexpressing cell model indicates that, indeed, miR-21-3p could be a potential marker for selecting candidate patients for treatment with mTOR inhibitors.
Our findings support the concept of a miRNA signature for patient stratification according to metastatic risk. Importantly, a significant fraction of the metastatic miRNA signature was detected in the serum of an independent cohort of patients showing increased levels of these miRNAs. miRNAs associated with a shorter TTP in tumor tissue (miR-21-3p, miR-183-5p, miR-182-5p and miR-96-5p) were also increased in the serum of metastatic cases and showed the highest levels during the progressive phase of metastasis. The mechanisms of how these metastasis-related miRNAs enter the circulation and whether they are biologically functional warrant further investigation. We show that circulating miRNAs are indeed secreted by imCCs, and that this secretion is increased in cells with a more aggressive phenotype [30]. While these miRNAs may have cell-intrinsic roles, as we showed for miR-21-3p, it is also possible that they participate in cell-cell communication by controlling the tumor microenvironment. Regulation of gene expression by miRNAs outside the cell of origin may also account for cancer progression and therapy resistance [45]. These findings extend the potential clinical utility of detecting the metastatic miRNA signature in liquid biopsies, but further prospective studies will be required to address this issue.
In conclusion, the power of a large sample series combined with multi-omic integration and the accessibility of TCGA data of other cancer entities has enabled the identification of robust biomarkers relevant to disease progression. This strategy is also a powerful tool for elucidating appropriate therapeutic options based on molecular biomarkers in PPGL, which is a significant step towards achieving precision medicine for patients with mPPGL - a disease with no FDA-approved therapies [2].
Abbreviations
PPGL: Pheochromocytoma and paraganglioma; mPPGL: metastatic pheochromocytoma and paraganglioma; TTP: time to progression; ROC: receiver operating characteristic; AUC: area under the ROC curves; FBS: fetal bovine serum; neuroendoMT: neuroendocrine-to-mesenchymal transition; qPCR: quantitative real-time PCR; CM: conditioned media; SF: serum-free; WT: wild-type; SDHB KD: SDHB knocked down; TCGA: The Cancer Genome Atlas; LGG: low-grade glioma; KICH: kidney chromophobe; PAAD: pancreatic adenocarcinoma; imCCs: immortalized mouse chromaffin cells.
Supplementary Material
Supplementary methods, figures and tables.
Acknowledgements
We gratefully acknowledge Manuel Morente and María Jesús Artiga from the CNIO biobank for providing assistance on tumor tissue selection, Joaquín Amat for his advice and great help on data visualization and plotting, as well as María Maroto and Guillermo de Cárcer from the Cell Division and Cancer Group at the CNIO for technical support and fruitful discussions. We are also grateful to Mathieu Madeleine and all members of the Genetics Department, Biological Resources Center and Tumor Bank Platform, Hôpital européen Georges Pompidou (BB-0033-00063) for technical support.
This work was supported by the Instituto de Salud Carlos III (ISCIII), Acción Estratégica en Salud, cofounded by FEDER, [grant number PI14/00240, PI17/01796 to M.R., PI15/00783 to A.C], the Paradifference Foundation [no grant number applicable to M.R.], the ANR [ANR-2011-JCJC-00701 MODEOMAPP to AP.G-R], the European Union [FP7/2007-2013 n° 259735, Horizon 2020 n° 633983 to AP.G-R], Epigénétique et Cancer [EPIG201303 METABEPIC to AP.G-R], the the Ligue Nationale contre le Cancer ["Cartes d'Identité des Tumeurs (CIT) program" to AP.G-R], the Institut National du Cancer, the Direction Générale de l'Offre de Soins [PRT-K 2014, COMETE-TACTIC, INCa-DGOS_8663 to AP.G-R], the Deutsche Forschungsgemeinschaft (DFG) [CRC/Transregio 205/1 “The Adrenal: Central Relay in Health and Disease“ to F.B, M.F and G.E], the Rafael del Pino Foundation [Becas de Excelencia Rafael del Pino 2017 to B.C], the Severo Ochoa Excellence Programme [project SEV-2011-0191 to M.C-F], La Caixa Foundation [B004235 to JM.R-R], the Spanish Ministry of Education, Culture and Sport [grant number FPU16/05527 to M.S.], the Site de Recherche Intégré sur le Cancer-SIRIC [CARPEM Project to N.B.] and the AECC Foundation [grant number AIO15152858 to C.M-C].
Author Contributions
Conceptualization, B.C., LJ.CV., C.RA., A.C., C.MC., AP.GR. and M.R.; Methodology, B.C., LJ.CV., R.TP., L.IP., C.MC. and M.R.; Software, R.TP., L.IP., O.G. and F.A.; Validation, B.C and LJ.CV.; Formal Analysis, B.C., R.RP and L.IP.; Investigation, B.C., LJ.CV., M.CF., JM.RR., V.M., R.L., L.R., M.S., AA.dC., A.CB. and M.R.; Resources, N.B., C.LL., E.R., C.AE., A.B., L.A., FL.FR., M.C., J.A., C.L., J.SM., L.C., E.K., HJ.T., J.L., F.B., M.FC., G.E., M.M. and J.F.; Data Curation, B.C, LJ.CV., M.CF., R.L., A.C., AP.GR. and M.R.; Writing -Original Draft, B.C., LJ.CV., R.TP. and M.R.; Writing -Review & Editing, B.C., LJ.CV., R.TP., JM.RR., V.M., J.L., AM.MM., J.L., M.FC., G.E., C.RA., A.C., C.MC., AP.GR. and M.R.; Visualization, B.C.; Supervision, M.R.; Project Administration, M.R.; Funding Acquisition, AP.GR. and M.R.
Competing Interests
The authors have declared that no competing interest exists.
References
1. Favier J, Amar L, Gimenez-Roqueplo A-P. Paraganglioma and phaeochromocytoma: from genetics to personalized medicine. Nat Rev Endocrinol. 2015;11(2):101-11
2. Jimenez C. Treatment for patients with malignant pheochromocytomas and paragangliomas: A perspective from the hallmarks of cancer. Front Endocrinol (Lausanne). 2018;9:277
3. Baudin E, Habra MA, Deschamps F. et al. Therapy of endocrine disease: Treatment of malignant pheochromocytoma and paraganglioma. Eur J Endocrinol. 2014;171(3):R111-22
4. Plouin PF, Amar L, Dekkers OM. et al. European Society of Endocrinology Clinical Practice Guideline for long-term follow-up of patients operated on for a phaeochromocytoma or a paraganglioma. Eur J Endocrinol. 2016;174(5):G1-G10
5. John H, Ziegler WH, Hauri D, Jaeger P. Pheochromocytomas: Can malignant potential be predicted? Urology. 1999;53(4):679-683
6. Eisenhofer G, Lenders JWM, Siegert G. et al. Plasma methoxytyramine: A novel biomarker of metastatic pheochromocytoma and paraganglioma in relation to established risk factors of tumour size, location and SDHB mutation status. Eur J Cancer. 2012;48(11):1739-1749
7. Gimenez-Roqueplo AP, Favier J, Rustin P. et al. Mutations in the SDHB gene are associated with extra-adrenal and/or malignant phaeochromocytomas. Cancer Res. 2003;63(17):5615-5621
8. Job S, Draskovic I, Burnichon N. et al. Telomerase Activation and ATRX Mutations Are Independent Risk Factors for Metastatic Pheochromocytoma and Paraganglioma. Clin Cancer Res. 2019;25(2):760-770
9. Jochmanova I, Pacak K. Pheochromocytoma: The first metabolic endocrine cancer. Clin Cancer Res. 2016;22(20):5001-5011
10. Plouin PF, Fitzgerald P, Rich T. et al. Metastatic pheochromocytoma and paraganglioma: Focus on therapeutics. Horm Metab Res. 2012;44(5):390-399
11. De Cubas AA, Korpershoek E, Inglada-Pérez L. et al. DNA methylation profiling in pheochromocytoma and paraganglioma reveals diagnostic and prognostic markers. Clin Cancer Res. 2015;21(13):3020-3030
12. Fishbein L, Leshchiner I, Walter V. et al. Comprehensive Molecular Characterization of Pheochromocytoma and Paraganglioma. Cancer Cell. 2017;31(2):181-193
13. Loriot C, Burnichon N, Gadessaud N. et al. Epithelial to mesenchymal transition is activated in metastatic pheochromocytomas and paragangliomas caused by SDHB gene mutations. J Clin Endocrinol Metab. 2012;97(6):E954-62
14. Meyer-Rochow GY, Jackson NE, Conaglen J V. et al. MicroRNA profiling of benign and malignant pheochromocytomas identifies novel diagnostic and therapeutic targets. Endocr Relat Cancer. 2010;17(3):835-846
15. Patterson E, Webb R, Weisbrod A. et al. The microRNA expression changes associated with malignancy and SDHB mutation in pheochromocytoma. Endocr Relat Cancer. 2012;19(2):157-66
16. De Cubas AA, Leandro-García LJ, Schiavi F. et al. Integrative analysis of miRNA and mRNA expression profiles in pheochromocytoma and paraganglioma identifies genotype-specific markers and potentially regulated pathways. Endocr Relat Cancer. 2013;20(4):477-493
17. Castro-Vega LJ, Letouze E, Burnichon N. et al. Multi-omics analysis defines core genomic alterations in pheochromocytomas and paragangliomas. Nat Commun. 2015;6:6044
18. Pillai S, Lo CY, Liew V. et al. MicroRNA 183 family profiles in pheochromocytomas are related to clinical parameters and SDHB expression. Hum Pathol. 2017;64:91-97
19. Tömböl Z, Eder K, Kovács A. et al. MicroRNA expression profiling in benign (sporadic and hereditary) and recurring adrenal pheochromocytomas. Mod Pathol. 2010;23(12):1583-1595
20. Tsang VHM, Dwight T, Benn DE. et al. Overexpression of miR-210 is associated with SDH-related pheochromocytomas, paragangliomas, and gastrointestinal stromal tumours. Endocr Relat Cancer. 2014;21(3):415-426
21. Zong L, Meng L, Shi R. Role of miR-101 in pheochromocytoma patients with SDHD mutation. Int J Clin Exp Pathol. 2015;8(2):1545-1554
22. Chou CH, Chang NW, Shrestha S. et al. miRTarBase 2016: Updates to the experimentally validated miRNA-target interactions database. Nucleic Acids Res. 2016;44(D1):D239-D247
23. Wang D, Gu J, Wang T, Ding Z. OncomiRDB: A database for the experimentally verified oncogenic and tumor-suppressive microRNAs. Bioinformatics. 2014;30(15):2237-2238
24. Vlachos IS, Paraskevopoulou MD, Karagkouni D. et al. DIANA-TarBase v7.0: Indexing more than half a million experimentally supported miRNA:mRNA interactions. Nucleic Acids Res. 2015;43(D1):D153-D159
25. Zhang Y, Kwok-Shing Ng P, Kucherlapati M. et al. A Pan-Cancer Proteogenomic Atlas of PI3K/AKT/mTOR Pathway Alterations. Cancer Cell. 2017;31(6):820-832.e3
26. Garnett MJ, Edelman EJ, Heidorn SJ. et al. Systematic identification of genomic markers of drug sensitivity in cancer cells. Nature. 2012;483(7391):570-5
27. Rapizzi E, Fucci R, Giannoni E. et al. Role of microenvironment on neuroblastoma SK-N-AS SDHB-silenced cell metabolism and function. Endocr Relat Cancer. 2015;22(3):409-417
28. Rapizzi E, Ercolino T, Fucci R. et al. Succinate Dehydrogenase Subunit B Mutations Modify Human Neuroblastoma Cell Metabolism and Proliferation. Horm Cancer. 2014;5(3):174-184
29. Letouzé E, Martinelli C, Loriot C. et al. SDH Mutations Establish a Hypermethylator Phenotype in Paraganglioma. Cancer Cell. 2013;23(6):739-752
30. Loriot C, Domingues M, Berger A. et al. Deciphering the molecular basis of invasiveness in Sdhb-deficient cells. Oncotarget. 2015;6(32):32955-65
31. Bartel DP. MicroRNAs: Target Recognition and Regulatory Functions. Cell. 2009;136(2):215-33
32. Inoki K, Li Y, Zhu T. et al. TSC2 is phosphorylated and inhibited by Akt and suppresses mTOR signalling. Nat Cell Biol. 2002;4(9):648-57
33. Fassnacht M, Weismann D, Ebert S. et al. AKT is highly phosphorylated in pheochromocytomas but not in benign adrenocortical tumors. J Clin Endocrinol Metab. 2005;90(7):4366-70
34. Giubellino A, Bullova P, Nölting S. et al. Combined inhibition of mTORC1 and mTORC2 signaling pathways is a promising therapeutic option in inhibiting pheochromocytoma tumor growth: In vitro and in vivo studies in female athymic nude mice. Endocrinology. 2013;154(2):649-55
35. Lee M, Minaskan N, Wiedemann T. et al. Targeting PI3K/mTOR signaling exerts potent antitumor activity in pheochromocytoma in vivo. Endocr Relat Cancer. 2017;24(1):1-15
36. Du J, Tong A, Wang F. et al. The Roles of PI3K/AKT/mTOR and MAPK/ERK Signaling Pathways in Human Pheochromocytomas. Int J Endocrinol. 2016;2016:5286972
37. Zhang X, Wang X, Qin L. et al. The dual mTORC1 and mTORC2 inhibitor PP242 shows strong antitumor activity in a pheochromocytoma PC12 cell tumor model. Urology. 2015;85(1):273.e1-7
38. Nölting S, Maurer J, Spöttl G. et al. Additive Anti-Tumor Effects of Lovastatin and Everolimus in Vitro through Simultaneous Inhibition of Signaling Pathways. PLoS One. 2015;10(12):e0143830
39. Chaux A, Brimo F, Gonzalez-Roibon N. et al. Immunohistochemical evidence of dysregulation of the mammalian target of rapamycin pathway in primary and metastatic pheochromocytomas. Urology. 2012;80(3):736.e7-12
40. Oudijk L, Papathomas T, De Krijger R. et al. The mTORC1 Complex Is Significantly Overactivated in SDHX -Mutated Paragangliomas. Neuroendocrinology. 2017;105(4):384-393
41. Favier J, Igaz P, Burnichon N. et al. Rationale for anti-angiogenic therapy in pheochromocytoma and paraganglioma. Endocr Pathol. 2012;23(1):34-42
42. Oh DY, Kim TW, Park YS. et al. Phase 2 study of everolimus monotherapy in patients with nonfunctioning neuroendocrine tumors or pheochromocytomas/paragangliomas. Cancer. 2012;118(24):6162-70
43. Druce MR, Kaltsas GA, Fraenkel M. et al. Novel and evolving therapies in the treatment of malignant phaeochromocytoma: Experience with the mTOR inhibitor everolimus (RAD001). Horm Metab Res. 2009;41(9):697-702
44. Costello BA, Borad MJ, Qi Y. et al. Phase I trial of everolimus, gemcitabine and cisplatin in patients with solid tumors. Invest New Drugs. 2014;32(4):710-6
45. Anfossi S, Babayan A, Pantel K, Calin GA. Clinical utility of circulating non-coding RNAs — an update. Nat Rev Clin Oncol. 2018;15(9):541-563
Author contact
![]() Corresponding author: Dr. Mercedes Robledo, Hereditary Endocrine Cancer Group Leader, Centro Nacional de Investigaciones Oncológicas (CNIO), C/Melchor Fernandez Almagro, 3. 28029 - Madrid (Spain). Telephone number: +34 917328000 Ext 3320; e-mail: mrobledoes
Corresponding author: Dr. Mercedes Robledo, Hereditary Endocrine Cancer Group Leader, Centro Nacional de Investigaciones Oncológicas (CNIO), C/Melchor Fernandez Almagro, 3. 28029 - Madrid (Spain). Telephone number: +34 917328000 Ext 3320; e-mail: mrobledoes