Impact Factor
- Issue 14; 2026
- Issue 13; 2026
- Issue 12; 2026
- Issue 11; 2026
- Issue 10; 2026
- Volume 16; 2026
- Advance Articles
- Past Issues
- Cover Images
- Cover Suggestion
- Index & Coverage
- Special Issues
Introduction
Materials and Methods
Results
Discussion
Conclusions
Abbreviations
Supplementary Material
Acknowledgements
References
International Journal of Biological Sciences
International Journal of Medical Sciences
 Global reach, higher impact

Theranostics 2021; 11(14):6644-6667. doi:10.7150/thno.56059 This issue Cite
Research Paper
Prodromal neuroinflammatory, cholinergic and metabolite dysfunction detected by PET and MRS in the TgF344-AD transgenic rat model of AD: a collaborative multi-modal study
Aisling M Chaney1,2*, Francisco R Lopez-Picon3,4, Sophie Serrière5, Rui Wang6#, Daniela Bochicchio2,7, Samuel D Webb8, Matthias Vandesquille2,7, Michael K Harte9, Christina Georgiadou2,7, Catherine Lawrence7,10, Julie Busson5, Johnny Vercouillie5,11, Clovis Tauber11, Frédéric Buron12, Sylvain Routier12, Tristan Reekie13, Anniina Snellman3,4, Michael Kassiou13, Johanna Rokka14†, Karen E Davies1, Juha O Rinne15,16, Dervis A Salih6$, Frances A Edwards6, Llwyd D Orton8, Stephen R Williams1, Sylvie Chalon5, Hervé Boutin2,7,10 ![]()
1. Faculty of Biology, Medicine and Health, School of Health Sciences, Division of Informatics, Imaging and Data Sciences, University of Manchester, Manchester, UK.
2. Wolfson Molecular Imaging Centre, University of Manchester, Manchester, UK.
3. MediCity Research Laboratory, University of Turku, Turku, Finland.
4. PET Preclinical Laboratory, Turku PET Centre, University of Turku, Turku, Finland.
5. UMR 1253, iBrain, Université de Tours, Inserm, Tours, France.
6. Department of Neuroscience, Physiology and Pharmacology, University College London, London, UK.
7. Faculty of Biology, Medicine and Health, School of Biological Sciences, Division of Neuroscience and Experimental Psychology, University of Manchester, M13 9PL, UK.
8. School of Healthcare Science, Department of Life Sciences, Manchester Metropolitan University, Manchester, UK.
9. Faculty of Biology, Medicine and Health, School of Health Sciences, Division of Pharmacy and Optometry, University of Manchester, Manchester, UK.
10. Geoffrey Jefferson Brain Research Centre, Manchester Academic Health Science Centre, Northern Care Alliance & University of Manchester, Manchester, UK.
11. CERRP, Centre d'Etudes et de Recherches sur les Radiopharmaceutiques, Tours, France.
12. ICOA, UMR CNRS 7311, Université d'Orléans, Orléans, France.
13. School of Chemistry, University of Sydney, NSW, Australia.
14. Turku PET Centre, Radiopharmaceutical Chemistry Laboratory, University of Turku, Turku, Finland.
15. Turku PET Centre, Turku University Hospital, Turku, Finland.
16. Division of Clinical Neurosciences, Turku University Hospital, Turku, Finland.
* Present address: Department of Radiology, Stanford University, Palo Alto, CA, 94304, USA.
# Present address: Institute for Synaptic Plasticity, Center for Molecular Neurobiology Hamburg (ZMNH), University Medical Center Hamburg-Eppendorf, Hamburg, Germany.
†Present address: Department of Public Health and Caring Sciences, Geriatrics; Molecular Geriatrics, Uppsala University, Uppsala, Sweden.
$Present address: UK Dementia Research Institute, University College London, London, UK.
Received 2020-11-17; Accepted 2021-2-15; Published 2021-5-3
Abstract

Mouse models of Alzheimer's disease (AD) are valuable but do not fully recapitulate human AD pathology, such as spontaneous Tau fibril accumulation and neuronal loss, necessitating the development of new AD models. The transgenic (TG) TgF344-AD rat has been reported to develop age-dependent AD features including neuronal loss and neurofibrillary tangles, despite only expressing APP and PSEN1 mutations, suggesting an improved modelling of AD hallmarks. Alterations in neuronal networks as well as learning performance and cognition tasks have been reported in this model, but none have combined a longitudinal, multimodal approach across multiple centres, which mimics the approaches commonly taken in clinical studies. We therefore aimed to further characterise the progression of AD-like pathology and cognition in the TgF344-AD rat from young-adults (6 months (m)) to mid- (12 m) and advanced-stage (18 m, 25 m) of the disease.
Methods: TgF344-AD rats and wild-type (WT) littermates were imaged at 6 m, 12 m and 18 m with [18F]DPA-714 (TSPO, neuroinflammation), [18F]Florbetaben (Aβ) and [18F]ASEM (α7-nicotinic acetylcholine receptor) and with magnetic resonance spectroscopy (MRS) and with (S)-[18F]THK5117 (Tau) at 15 and 25 m. Behaviour tests were also performed at 6 m, 12 m and 18 m. Immunohistochemistry (CD11b, GFAP, Aβ, NeuN, NeuroChrom) and Tau (S)-[18F]THK5117 autoradiography, immunohistochemistry and Western blot were also performed.
Results: [18F]DPA-714 positron emission tomography (PET) showed an increase in neuroinflammation in TG vs wildtype animals from 12 m in the hippocampus (+11%), and at the advanced-stage AD in the hippocampus (+12%), the thalamus (+11%) and frontal cortex (+14%). This finding coincided with strong increases in brain microgliosis (CD11b) and astrogliosis (GFAP) at these time-points as assessed by immunohistochemistry. In vivo [18F]ASEM PET revealed an age-dependent increase uptake in the striatum and pallidum/nucleus basalis of Meynert in WT only, similar to that observed with this tracer in humans, resulting in TG being significantly lower than WT by 18 m. In vivo [18F]Florbetaben PET scanning detected Aβ accumulation at 18 m, and (S)-[18F]THK5117 PET revealed subsequent Tau accumulation at 25m in hippocampal and cortical regions. Aβ plaques were low but detectable by immunohistochemistry from 6 m, increasing further at 12 and 18 m with Tau-positive neurons adjacent to Aβ plaques at 18 m. NeuroChrom (a pan neuronal marker) immunohistochemistry revealed a loss of neuronal staining at the Aβ plaques locations, while NeuN labelling revealed an age-dependent decrease in hippocampal neuron number in both genotypes. Behavioural assessment using the novel object recognition task revealed that both WT & TgF344-AD animals discriminated the novel from familiar object at 3 m and 6 m of age. However, low levels of exploration observed in both genotypes at later time-points resulted in neither genotype successfully completing the task. Deficits in social interaction were only observed at 3 m in the TgF344-AD animals. By in vivo MRS, we showed a decrease in neuronal marker N-acetyl-aspartate in the hippocampus at 18 m (-18% vs age-matched WT, and -31% vs 6 m TG) and increased Taurine in the cortex of TG (+35% vs age-matched WT, and +55% vs 6 m TG).
Conclusions: This multi-centre multi-modal study demonstrates, for the first time, alterations in brain metabolites, cholinergic receptors and neuroinflammation in vivo in this model, validated by robust ex vivo approaches. Our data confirm that, unlike mouse models, the TgF344-AD express Tau pathology that can be detected via PET, albeit later than by ex vivo techniques, and is a useful model to assess and longitudinally monitor early neurotransmission dysfunction and neuroinflammation in AD.
Keywords: Alzheimer's disease, animal models, positron emission tomography, magnetic resonance spectroscopy, neuroinflammation
Introduction
Alzheimer's disease (AD) is a major global health problem, affecting approximately 50 million people worldwide [1]. Yet, our understanding of the mechanisms leading to progressive neurodegeneration and dysfunction in AD remains incomplete. Clinical AD pathology is characterised by progressive amyloid-beta plaque (Aβ) deposition, neurofibrillary tangle (NFT) formation due to Tau protein aggregation and neuronal loss. However it has become clear that AD is a complex and multi-faceted disease involving not only Aβ and Tau pathology but also chronic activation of microglia and astrocytes [2, 3], metabolic dysfunction [4], and altered cholinergic activity [5]. Moreover, it is hypothesised that pathological alterations may begin many years before AD symptoms become apparent making early diagnosis and disease management challenging. Therefore, a better understanding of the pathophysiology underlying AD manifestation and progression is urgently needed to improve diagnosis and treatment of this devastating disorder.
Preclinical investigations using animal models are an essential part of the arsenal of tools to probe specific disease mechanisms and test the efficacy of therapeutic and diagnostic strategies within a living organism. Genetically modified mouse models are commonly used in AD research, allowing the investigation and confirmation of pathology induced by human familial AD mutations associated with amyloid precursor protein (APP) and presenilin 1 or 2 (PS1/PS2). These mouse models develop AD-like amyloid pathology such as age-dependent increases in Aβ plaque deposition, soluble and insoluble Aβ40/Aβ42 levels, and cerebral amyloid angiopathy (CAA) [6]. Although all these transgenes-induced AD models are modelling the familial rather than the sporadic AD, until models of spontaneous AD exist, these models are beneficial in gaining a better understanding of amyloidogenic pathways and other disease processes. However, most of these models do not develop neuronal loss or NFTs without the integration of a Tau transgene. While some amyloid models have been reported to express increased hyperphosphorylated Tau, Tau aggregates similar to NFTs are not observed [7, 8]. This lack of concordance with the clinical situation may be in part responsible for the low success in translatability of AD therapies. Hence, there has been a drive for improved animal models, which encompass the multiple pathological features observed in clinical AD. Consequently, transgenic AD rat models have been developed, with rats having the additional advantage over mice of a larger brain size for in vivo imaging and improved possibility for behavioural testing [9]. Early genetic rat models were unsuccessful in precipitating extracellular amyloid plaques [10]; later attempts yielded better results but most developed only Aβ plaques (for review see Do Carmo and Cuello, 2013 [11]). However, a more recent model, the TgF344-AD rat, described by Cohen et al. [12], demonstrated an age-dependent progressive amyloid pathology including plaque deposition, CAA, inter-neuronal and soluble amyloid in regions associated with and at levels comparable to that observed in clinical AD. Moreover, NFT-like Tau pathology as well as neuronal loss and neuroinflammation were also reported, overall providing a better representation of AD-like pathology. In their study Cohen et al. characterised the model at 6, 16 and 26 months (m) of age. Increased Aβ40 was reported as early as 6 m with cognitive deficits by 15 m and NFT deposition by 16 m. Finally, increased microglial and astrocyte activation were detected ex vivo as early as 6 m of age. Since then, various deficits and dysfunctions have been reported at different ages in these rats including alterations in hippocampal and cortical neurotransmission [13-16], neurovascular dysfunction [17], behavioural deficits [18-21], functional connectivity alterations [22-24] and blood-brain barrier alterations [25]. Hence this model seems to be a good candidate, yet some important parameters have not been investigated and questions remain as to whether this is a useful model to investigate longitudinal in vivo markers of AD.
Here we take an in vivo multi-modal approach to characterise AD development and progression in TgF344-AD and wildtype (WT) rats from early to more advanced stages of the disease (6 to 25 m), including non-invasive longitudinal imaging, ex vivo immunohistochemical analysis and cognitive assessments. Specifically, and for the first time, [18F]DPA-714, [18F]ASEM, [18F]Florbetaben ([18F]AV-1) and (S)-[18F]THK5117 PET imaging were performed to assess neuroinflammation, the acetylcholine system, Aβ plaque deposition and Tau aggregates respectively. Additionally, magnetic resonance spectroscopy (MRS) was performed to assess metabolite alterations associated with neuronal dysfunction and inflammation. Altogether, those in vivo measurements, combined with ex vivo immunohistochemical assessments are providing novel and wide-ranging information about the neuropathological characteristics and utility of this model.
Materials and Methods
Animals
Two male and two female WT Fischer and TgF344-AD rats with the APPswe and PS1Δe9 mutations were purchased from the laboratory of Prof T. Town (University of Southern California) and were set up as breeding pairs, housed in the Biological Services Unit at the University of Manchester. Genotyping was outsourced to Transnetyx®. All animals were housed in groups of 2-4 per cage with individual ventilation, environmental enrichment, constant access to food and water and a 12:12 hour cycle of light and dark.
In vivo experiments were conducted across three centres: University of Manchester (UK), University of Tours (France) and University of Turku (Finland) and animals were housed and fed in the same conditions as in Manchester. All experiments carried out at the University of Manchester were performed in accordance with the Animal Scientific Procedures Act 1986, following internal ethical review. Breeding pairs from this colony were sent to the University of Tours and University of Turku where rats were bred for investigation of amyloid ([18F]Florbetaben), α7-nAchR ([18F]ASEM) and Tau ((S)-[18F]THK5117). In Tours, animals were treated in accordance with the European Community Council Directive 2010/63/EU for laboratory animal care and the experimental protocol was validated by the Regional Ethical Committee (Authorization n°4795.03). Genotyping was outsourced to Charles River GEMS (France). In Turku all animal experiments were approved by the Regional State Administrative Agency for Southern Finland (ESAVI/3899/04.10.07/2013 and ESAVI/4499/04.10.07/2016), and animal care complied with the principles of the laboratory animal care and with the guidelines of the International Council of Laboratory Animal Science.
Details of numbers of animals for each experiment are provided below and in Tables S1-S4. Survival curves and mortality/exclusions are shown for the University of Manchester cohort in Table S4 and Figure S1.
Study Design
Animals bred at the University of Manchester underwent behavioural testing, MRS, [18F]DPA-714 PET, and immunohistochemistry studies. N number per group were based on power analysis of our own or previously published data with α = 0.05 and β = 0.95 [12, 21, 26-30]. Various parameters including moderate increases in neuroinflammation, Aβ and Tau have been reported in the Tg-F344-AD rat via immunohistochemistry at 6, 16 and 26 m [12]. Thus, [18F]DPA-714 PET was performed at 6 m, 12 m and 18 m to non-invasively assess longitudinal alterations in neuroinflammation in WT and TG rats from early to advanced disease. Similarly, these time-points were used for MRS imaging and behavioural assessment. In particular, the 12 m time-point was chosen because we wanted to address the progression in the critical prodromal stage of the disease and from Cohen et al. [12] it seemed clear that AD-like pathology was already quite advanced by 16 m of age. Brain tissue was harvested in a subset of rats at each time-point (Table S1) for ex vivo analysis i) between 5m 3 weeks and 7m 2 weeks (referred to as the 6 m time-point; WT: 208 ± 24 days, n = 5 (mean ± SD); TG: 203 ± 21 days, n = 8), ii) between 11m 3 weeks and 13 m 2 weeks (12 m time-point; WT: 391 ± 23 days, n = 5; TG: 389 ± 16 days, n = 6) and iii) between 18 m 2 weeks and 19m 3 weeks (18 m time-points; end-point for animals from the longitudinal study and few additional animals; WT: 585 ± 11 days, n = 13; TG: 591 ± 14 days, n = 11) (See Tables S1 and S2 for full details). There was a minimum gap of one week between anaesthetising animals for imaging and conducting behavioural tests. Imaging experiments were carried out during the light phase of day. Behavioural assessments begun at the end of the dark phase (4-7 AM) as the rats were more active and exploratory behaviour was increased at this time.
WT and TG males (n = 8 per group) bred at the University of Tours were enrolled in [18F]Florbetaben and [18F]ASEM PET studies at 6, 12 and 18 m (for more details see Table S3).
Tau pathology was assessed in 3 WT and 4 (one animal died at 24 months of age) TG females bred at the University of Turku using (S)-[18F]THK5117 PET at 15 and 25 m and ex vivo autoradiography at 25m. Tau studies were conducted at later time-points owing to previous findings indicating NFT-like Tau deposition in these rats from a mid-disease state (i.e., 16 m) [12]. At 15 m (457 ± 9 days) rat weights were WT 295 ± 5g and TG 302 ± 28g. At 25 m (748 ± 11 days) rat weights were WT 339 ± 37g and TG 340 ± 6g.
PET Acquisition and Analysis
[18F]DPA-714 PET
To assess in vivo neuroinflammatory status [18F]DPA-714 PET was performed in WT and TG rats at 6, 12 and 18 m. [18F]DPA-714 was synthesized as previously described [31]. Animals underwent anaesthesia (1.5-2.5% isoflurane in a 30%/70% 02/NO2 mixture at 1.2 l/min), tail vein cannulation, [18F]DPA-714 injection (33.1 ± 6.8 MBq) and 60 min dynamic PET/CT imaging. Imaging was carried out on a Siemens Inveon® PET/CT scanner and image reconstruction was performed as previously described [26, 27] (see Suppl. Material for more details). Skeletal and brain regions were defined manually in the CT images using Brainvisa and Anatomist software (http://brainvisa.info) to register PET-CT images with a MRI template; ROIs were quantified in Brainvisa by applying a rat MRI template adapted from Schwarz and colleagues [32]. Co-registration with a MRI atlas seem appropriate as Anckaerts et al. [22] did not report any age-dependent genotype-specific cortical atrophy or ventricular enlargement in the TG groups. ROIs included: entorhinal cortex, cingulate cortex, frontoparietal motor and somatosensory cortex, frontal cortex, temporal cortex, hippocampus, thalamus, hypothalamus and striatum. For the PET quantification the summed frames from 20 to 60 (Figure S3A) min were used to calculate the uptake values normalised to cerebellum (NUVCb). The cerebellum was chosen as it is routinely used (clinically and preclinically) as a pseudo-reference region for TSPO-PET quantification in Alzheimer's disease populations [26, 29, 33-36].
[18F]Florbetaben and [18F]ASEM PET
[18F]florbetaben and [18F]ASEM PET were performed to assess respectively amyloid burden and α7 nicotinic acetylcholine receptor (α7-nAchR) density in WT and TG rats at 6, 12 and 18 m (see Table S3). [18F]Florbetaben [37] and [18F]ASEM [30] were synthesized as described previously. Anaesthetised animals (1.5-2% isoflurane in 1.5-2 L/min of O2) were scanned over 51 min for [18F]Florbetaben and 61 min for [18F]ASEM on a superArgus PET/CT system (Sedecal, Spain) according to Sérrière et al. [29] (for more details see Suppl. Material). Before PET acquisition, a 5 min CT scan was acquired for attenuation correction. Animals received a bolus injection of 37 MBq/350 g body weight of [18F]Florbetaben or [18F]ASEM in a saline solution via the tail vein. Images were analysed using PMOD (3.403, PMOD Technologies, Zurich, Switzerland). Partial volume effect correction was applied on all PET images which were co-registered to the Schiffer rat brain MRI template for regions of interest (ROI) analysis. Normalised uptake values (NUV) were calculated using the brainstem as reference region for [18F]Florbetaben (last 3 frames, 43-51 min acquisition, Figure S3B) [38] and cerebellum for [18F]ASEM [39] (last 6 frames, 49-61 min acquisition, Figure S3C).
(S)-[18F]THK5117 PET and autoradiography
To assess Tau deposition, (S)-[18F]THK5117 PET was performed in WT and TG rats at 15 and 25m. (S)-[18F]THK5117 was synthesized as previously described [40]. Prior to PET acquisition, a CT scan was acquired for attenuation correction. The rats were anesthetised with 2.5% isoflurane in a 30%/70% O2/NO2 mixture at 400-500 mL/min and then injected with a bolus injection of (S)-[18F]THK5117 (23.7 ± 3.0 MBq) and 60 min dynamic scans were acquired using a Siemens Inveon® PET/CT scanner and reconstructed with OSEM-3D. PET images were pre-processed and co-registered to the Schiffer rat brain MRI template for ROI analysis (for more details see Suppl. Material). Following the final in vivo scan, the brains were quickly removed and frozen in isopentane (2-methylbutane; Sigma-Aldrich) on dry ice to perform ex vivo autoradiography studies. Coronal sections (20 μm) were obtained using a cryomicrotome (Leica CM3050S) and collected on a glass slide (Superfrost Ultra Plus; Thermo Fisher). The slides were exposed to an image plate (Fuji BAS Imaging Plate TR2025; Fuji Photo Film Co., Ltd.) for 4 hours.
For the PET quantification the summed frames from 30 to 40 min were used (Figure S3D); PET and autoradiography data are expressed as standard uptake values normalised to striatum (NUVstr). ROIs included: temporal-auditory, piriform, frontal, frontoparietal and cingulate cortices, hippocampus, thalamus, pons, cerebellum, hypothalamus and striatum. PET and autoradiography quantification were performed as previously described [41].
Magnetic Resonance Spectroscopy Acquisition and Analysis
To assess metabolite profile, single voxel MRS was performed in the full hippocampus (2 × 9 × 3 mm3), right hippocampus (2 × 4.5 × 3 mm3), thalamus (2.5 × 8 × 3 mm3), hypothalamus (2 × 3 × 3 mm3) and cortex (1.2 × 3 × 3 mm3) in TG and WT rats at 6, 12 and 18 m of age (for localisation of the voxel for each brain region, see Figure S2). Isoflurane (2-3%) in oxygen (2L/min) was used to anesthetise and maintain rats. MRI and MRS were performed and analysed as previously described [26, 42] (see Suppl. Material for more details). Respiratory rate (65-80 breaths per min) and temperature (36.5-37 °C) were monitored and maintained throughout by altering respectively the anaesthesia and hot air supply. Metabolites are expressed as amplitude of institutional units relative to water.
Immunohistochemistry
For full details of Immunohistochemistry protocols, please see Suppl. Material. For all immunohistochemical analysis, the observers were blinded to the genotype and age-group of the animals, having only access to the animal number given at birth to each animal until all images were captured and analysed. However, it must be noted that the presence of Aβ plaques and associated microglial activation and astrogliosis were obvious when looking at the brain sections under a microscope. Number of animals used for each quantitative immunohistochemistry can be found in Table S5.
Immunofluorescence for GFAP & CD11b, NeuN, Neurochrom and amyloid
Animals were culled and brain were processed and cut as described previously [26, 27] (see Suppl. Material for more details).
Immunohistochemistry was carried out on TG and WT 20 µm thick frozen brain sections (n = 5-9 per group, see Table S5) to visualise CD11b (microglial marker), GFAP (astrocytic marker), NeuN and Neurochrom (neuronal markers), and 6E10 (Aβ marker) as previously described [26] (for more details see Suppl. Material).
Three to five images from 2-4 brain sections spanning between 1 and 2.86 mm lateral of Bregma were collected for each brain structure (hippocampus, thalamus and cortex) per animal. Image were collected on an Olympus BX51 upright microscope using 10×/0.30 or 20×/0.50 UPlanFLN objectives and captured using a Retiga 6000 Color camera through QCapture Pro 7 Software (QImaging Inc.). Specific band pass filter sets were used to prevent bleed through from one channel to the next.
6E10 slides were scanned using a 3D Histec Pannoramic250 slide scanner and 1-4 snapshots per brain area of interest were taken using 3D Histec CaseViewer software. All snapshots were analysed using Fiji [43] (for full details see Suppl. Material).
Chromogenic NeuN immunohistochemistry and analysis
Sagittal sections were stained with rabbit anti-NeuN and Vector DAB HRP substrate (For full details of protocol see Suppl. Material).
Amyloid Thioflavin-S staining and Tau immunohistochemistry
Because our attempt to perform immunohistochemistry for Tau using snap-frozen brain sections failed, we looked for PFA-perfused-fixed brains from one of our partners of the INMiND consortium. Perfused-fixed brains from 18 m old animals were a generous gift from Dr Guadalupe Soria (IDIBAPS, Barcelona, Spain) and were used for Phospho-Tau immunohistochemistry and amyloid Thioflavin-S staining. PFA-perfused-fixed brains were cryoprotected in 30% sucrose, sectioned into 30 µm thick sagittal sections using a Leica frozen microtome and stored as free-floating brain sections at 4 °C in PBS/0.3% azide. Phospho-Tau and Thioflavin-S co-staining: sections were permeabilised by incubating with 0.3% Triton-X 100/PBS then endogenous peroxidase was quenched in 0.5% H2O2 for 30 min, and blocked in 2.5% normal horse serum (MP-7422, Vector Laboratory) followed by incubation with AT8, CP13 or PHF-1 primary antibody overnight at 4°C. Secondary Anti-Mouse IgG (MP-7422, Vector Laboratory) was applied for 30 min, followed by peroxidase substrate solution (SK-4105, Vector Laboratory) until desirable stain intensity developed. Sections were then incubated in 1% Thioflavin-S (T1892, SIGMA) solution for 7 min and washed with 70% Ethanol, before mounting with Fluoromount-G medium (Southern Biotech).
The entire hippocampus was imaged in each section using an EVOS FL Auto microscope (Life Technologies) with a ×20 objective, by area defined serial scanning (n = 3 per genotype). The image was processed using EVOS FL Auto Cell Imaging System and Adobe Photoshop CS6.
Tau Western blot analysis
Approximately 100 mg of cortex tissue was homogenised in 1 mL cold RIPA buffer as described previously [44]. The protein sample for Tau expression analysis was extracted from cortical tissue homogenate then lysed in Tau Dye. Lysed protein was boiled for 5 min at 95 °C. Next, Western blotting was performed using the SDS-PAGE gel and nitrocellulose membrane, with 50 µg protein loaded for each sample. CP13, PHF-1, DA9 and HSPA9 primary antibodies were used (for more details see Table S6). Protein bands were visualized using enhanced chemiluminescence. Imaging was performed using the BIO-RAD ChemiDoc MP imaging system and protein expression bands were analysed by Image Lab software (BIO-RAD) (for more details see Suppl. Material).
Behaviour
The background strain (Fischer 344) used to generate the TgF344-AD has been reported to be highly anxious and proved to be so in our hands (avoidance, agitated when handled, vocalising, biting) [45, 46]. We thus ensured that animals were extensively handled prior to behavioural testing (see details in Suppl. Material).
Novel Object Recognition Test
To assess short-term non-associative working memory, a novel object recognition (NOR) test was carried out in WT (n = 9-10) and TG (n = 9-11; see Table S1 for details) rats at 3, 6, 12 and 18 m as previously described [47]. In brief, NOR tests were performed in 3% light, and involved acquisition, delay and retention phases of 3 min each. Time spent exploring the novel and familiar objects in the retention phase was used to quantify the discrimination index (DI) for each animal, defined as the novel minus the familiar time divided by the total time, giving values ranging from -1 to +1. Animals were excluded from analysis if side bias was displayed in the acquisition phase (> 60% time on one side) or if they did not demonstrate exploratory behaviour towards any objects in the retention phase (< 2s cut-off; 3 m: 2 TG; 6 m: 2 WT and 1 TG; 12 m: 2 WT and 3 TG; and 18 m: 3 WT and 1 TG were excluded).
Social Interaction Test
A social interaction test was used to assess anxiety-like behaviour [48] in the WT (n = 9) and TG rats (n = 9-10; see Table S1 for details) at 9, 12, 15 and 18 m. This test was carried out in 45% light. All rats were age and weight matched to avoid/minimise dominance and fighting behaviour. In brief, a test rat and an unfamiliar wildtype conspecific rat were placed in an arena for 10 min with an inanimate object (e.g. metal can or plastic bottle) in the centre. Time spent sniffing, following, and avoiding the conspecific animal as well as exploring the central object were quantified and data expressed as a discrimination index (see above). Arenas were cleaned with 70% ethanol in between trials.
Statistical analysis
The data were statistically analysed using GraphPad® Prism™ (v8.4, GraphPad Software, Inc., San Diego, California USA).
Shapiro-Wilk normality test was carried out for raw exploration times to assess side bias and, depending on the normality of the distribution, either t-tests or Wilcoxon tests were used. Survival rate of the University of Manchester cohort was analysed using a Log-rank Mantel-Cox test. Mixed model effects analysis was used to assess alterations in DI in the NOR test. T-tests were used to investigate time spent exploring familiar and novel objects as well as social interaction behaviours in WT and TG animals at individual time-points. One-way ANOVA was used to assess levels of exploration over time in each group.
Mixed model effects analysis was used to assess the effect of genotype and age (as repeated factor) and possible interaction on MRS metabolites levels and [18F]DPA-714 and (S)-[18F]THK5117 PET NUV values in WT and TG. [18F]ASEM PET NUV were analysed using 2-way ANOVA to assess the effect of genotype and age (as repeated factor) and possible interaction.
Normality of the CD11b, GFAP, NeuN and Aβ immunohistochemistry quantitative data was analysed using d'Agostino and Pearson test and if significant, outliers were removed. Only GFAP in the temporal/posterior cingulate cortex and CD11b and GFAP in the thalamus did not pass the normality test and outliers were removed (see Table S5). Immunohistochemistry quantitative data were analysed using 2 way-ANOVA (genotype and age).
If a significant effect and/or interaction were found with the mixed model effects analysis or ANOVA, a post-hoc Sidak test was performed to determine group differences.
Autoradiographic data for (S)-[18F]THK5117 comparing WT and TG at 25m of age were analysed with Welsh's t-tests. For all statistical analyses, the significance level was p < 0.05.
Data availability
The datasets generated during and/or analysed during the current study are available upon reasonable request. Request should be addressed to the corresponding author and data will be made available by the institution where the experiments took place.
Results
Animals
The study of the University of Manchester cohort revealed that the TgF344-AD strain can easily be aged up to 18-19m but that, upon reaching this age, the rate of spontaneous illnesses or deaths start to increase due to spontaneous stroke, intracerebral or subarachnoid haemorrhage or tumours (Figure S1 and Tables S1 and S4). The survival rate was not however significantly associated with genotype (p = 0.2748, Log-rank Mantel-Cox test; Figure S1). There was no statistical difference in body weights between the 2 cohorts of male rats (Tours and Manchester) presented in Table S2 and S3 (data not shown).
Neuroinflammation and reactive gliosis detected by [18F]DPA-714 PET and immunohistochemistry are increased in the hippocampus, cortex and thalamus of aged Tg-F344-AD rats
[18F]DPA-714 PET was performed to non-invasively assess longitudinal alterations in neuroinflammation in WT and TG rats at 6 m, 12 m and 18 m (Figure 1). Data are presented as NUVCB as the uptake in cerebellum was not affected by genotype (Figure S4A). Both genotype and age significantly affected uptake in the hippocampus (genotype p = 0.001, age p < 0.001), frontal cortex (genotype p = 0.010, age p < 0.001), thalamus (genotype; p = 0.002, age; p < 0.001) and retrosplenial/cingulate cortices (genotype p = 0.007, age p = 0.002). In the hippocampus, elevated uptake was observed in TG vs WT rats at 12 m (+11 ± 8% p = 0.045) and 18 m (+12 ± 5% p = 0.001) (Figure 1B). Additionally, increased uptake with age was seen in TG rats from 12 m (vs 6 m +13 ± 10% p = 0.008, 18 m vs 6 m +21 ± 7% p < 0.001, 18 m vs 12 m +8 ± 9% p = 0.042) but only at 18 m in WT (vs 6 m +16 ± 7% p < 0.001 and vs 12 m +7 ± 5% p = 0.001) indicating that hippocampal inflammation associated with normal aging is exacerbated in TG rats (Figure 1B). Similarly, [18F]DPA-714 uptake was significantly increased in TG when compared to WT rats at 18 m in the frontal cortex (+14 ± 7% p = 0.002), thalamus (+11 ± 7% p = 0.020) and retrosplenial/cingulate cortices (+7 ± 5% p = 0.024). 18F]DPA-714 signal was also increased with age in the retrosplenial/cingulate cortices (+13 ± 9% 18 m vs 6 m, p = 0.003) in the TG group only (Figure 1B). Moreover, [18F]DPA-714 uptake was only affected by genotype in the entorhinal and frontoparietal motor cortices (p = 0.042 and p = 0.046 respectively, Figure S4B).
(A) Representative averaged 20-60 min [18F]DPA-714 PET-CT images co-registered with the MR template. ROIs for the retrosplenial & cingulate cortices (RCgCx), thalamus (Thal) and hippocampus (Hipp) are shown in the top left (6 m, WT) image. The frontal cortex is not shown on the PET-CT images as this region is more rostral. (B) [18F]DPA-714 uptake quantification in various regions of the brain in WT (green circle symbols) and TgF344-AD (red square symbols) rats at 6, 12 and 18 months (m) of age. Data are expressed as mean ± SD of uptake values normalised to cerebellum. * and ✝ indicate significant differences vs the 6 and 12 m old animals respectively and # indicates significant difference between WT and TG for rats of same age. *, ✝ or # indicates p < 0.05, **/……/## p < 0.01 and ***/………/### p < 0.001. PET data were analysed using a mixed model (age as repeated factor and genotype) and a Sidak post-hoc test.
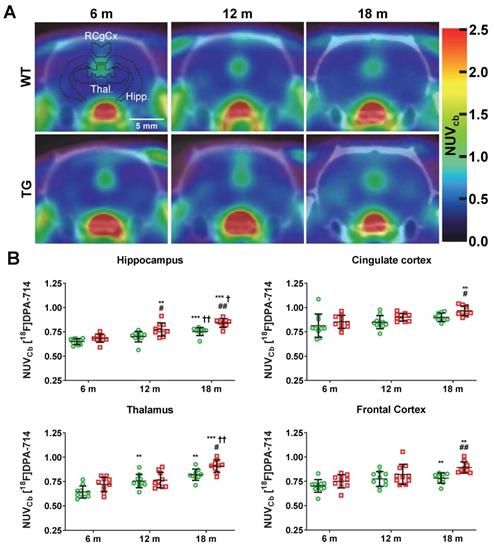
Additionally, an effect of age was also observed in both WT and TG in some of these regions. [18F]DPA-714 uptake was increased with age in the frontal cortex (WT 18 m vs 6 m: +12 ± 7% p = 0.003, TG 18 m vs 6 m: +17 ± 12% p = 0.003) and thalamus (WT 12 m vs 6 m: +18 ± 15%, p = 0.009, WT 18 m vs 6 m: +30 ± 16%, p = 0.001; TG 18 m vs 6 m: +24 ± 8% p < 0.001, TG 18 m vs 12 m: +19 ± 14% p = 0.005) (Figure 1B), indicating that these region are also affected by normal aging.
In contrast, in temporal-auditory cortex, frontoparietal somatosensory cortex and striatum, a significant effect of age only was detected (p = 0.042, p < 0.001, p < 0.001 respectively) (Figure S4C). However, in the temporal-auditory cortex, this effect of age was most likely driven by the TG data with a trend for genotype effect (p = 0.0599) and a significant difference between WT and TG at 18 m (Figure S4C). In the striatum, an age effect was seen in both WT and TG with a significant increase in neuroinflammation at 12 m (+10-12%) and 18 m (+15-18%) (Figure S4C). In the hypothalamus, a significant interaction age × genotype (p = 0.01) was observed with a transient increase in [18F]DPA-714 uptake in TG only observed at 12 m (+26 ± 18% vs 6 m, p = 0.007 and +24 ± 21% vs 18 m p = 0.049) and returning to baseline at 18 m (Figure S4D).
Activated microglial and astrogliosis were quantified by CD11b and GFAP immunohistochemistry labelling density at 6, 12 and 18 m (Figure 2). Quantification of images revealed both age and genotype dependent increases in CD11b-positive cells in hippocampus (genotype p < 0.001, age p = 0.002, genotype × age interaction p = 0.006), frontal cortex (genotype p < 0.001, age p < 0.003, genotype × age interaction p = 0.007), temporal cortex (genotype p < 0.001, age p = 0.004, genotype × age interaction p = 0.005) and thalamus (genotype p < 0.001, age p = 0.003). Markedly elevated CD11b staining (%stained area) was observed in TG rats vs WT in the temporal/cingulate cortices at 12 m and 18 m (+564 ± 28% and +383 ± 33% respectively, both p < 0.001, Figure 2), and at 18 m in the hippocampus (+723 ± 44% p < 0.001), frontal cortex (+435 ± 54% p < 0.001) and thalamus (+115 ± 30% p = 0.001) (Figure S5). Consistent with these results, increases in CD11b staining with age was also observed in TG rats in these regions which was not evident in the WT rats (Figure 2, Figure S5).
Representative micrographs of microglial (CD11b, top panel) and astrocytes (GFAP, bottom panel) in the temporal/posterior cingulate cortices of WT and TG rats at 6, 12 and 18 months (m) of age. Quantification of the immunofluorescence expressed as percentage of area stained. * and ✝ indicate significant differences vs the 6 and 12 m animals respectively and # indicates significant difference between WT and TG for rats of same age. *, ✝ or # indicates p < 0.05, **/……/## p < 0.01 and ***/………/### p < 0.001. Data were analysed using 2-way ANOVA (age as repeated factor and genotype) and a Sidak post-hoc test. Scale bars represent 200µm.
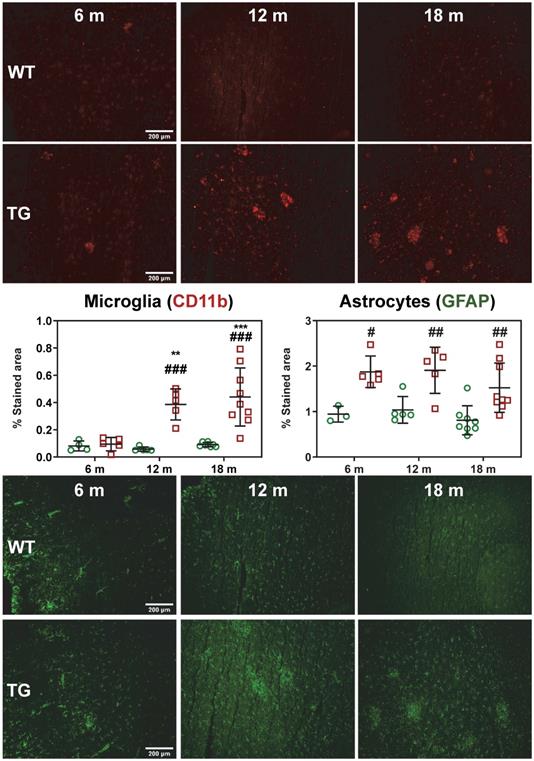
Astrogliosis (GFAP+) was found to be elevated in temporal/posterior cingulate (TG vs WT: 6 m: +99 ± 18%, p = 0.013; 12 m: +84 ± 27% p = 0.007; 18 m: +89 ± 38%, p = 0.004; Figure 2) and frontal cortex (TG vs WT 12 m: +109 ± 25% and 18 m: +98 ± 38% p < 0.001 for both, Figure S5). In the thalamus, astrogliosis was increased in TG vs WT at 6 m (+158 ± 21%, p = 0.001) but decreased with age to reach similar levels as in WT (6 m vs 12 m: -44 ± 42%, p = 0.008, and 6 m vs 18 m: -39 ± 32%, p = 0.007, respectively, Figure S5). In the hippocampus, there was a significant effect of genotype (p = 0.008) and a significant decrease with age at 18 m vs. 6 m in both WT (-47 ± 33%, p = 0.036) and TG (-36 ± 24%, p = 0.014, Figure S5).
[18F]ASEM PET imaging indicates reduced subcortical α7-nAChR density in TgF344-AD rats
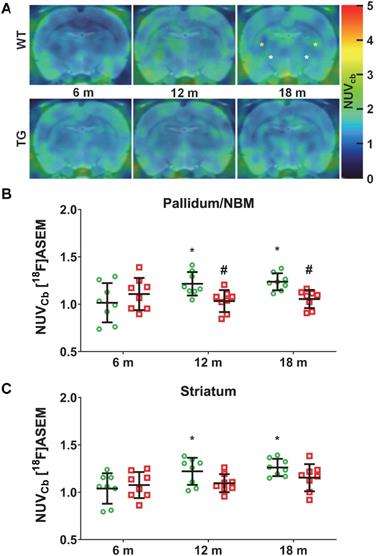
Serial [18F]ASEM PET imaging was performed to assess α7-nAChR density as a marker of cholinergic function with disease progression in TG compared to WT rats. Explorations of α7-nAChRs has not previously been investigated in this model, thus [18F]ASEM PET was also performed at 6 m, 12 m and 18 m (Figure 3A). Significant changes in [18F]ASEM signal were observed in the pallidum/nucleus basalis of Meynert (NBM), with a significant effect of genotype (p = 0.028) and an age × genotype interaction (p = 0.017). Increased [18F]ASEM uptake was observed in this brain region with age in WT rats (12 m vs 6 m: +25 ± 33%, p = 0.031; 18 m vs 6 m: +27 ± 30%, p = 0.015), which did not occur in TG, resulting in the TG being significantly lower than the WT at 12 m (-15 ± 11% , p = 0.038) and 18 m (-15 ± 8%, p = 0.038) (Figure 3B). A similar effect was detected in the striatum (age effect p = 0.019) driven by a significant increase in tracer uptake only in WT animals (12 vs 6 m: +22 ± 32%, p = 0.049; 18 m vs 6 m: +25 ± 29%, p = 0.012) (Figure 3C). There was a more modest increase with age in thalamus (age effect, p = 0.047; post-hoc 18 m vs 6 m: +10 ± 12% p = 0.045) (Figure S6A). In contrast, no significant differences were observed in cortex (Figure S6B) or hippocampus (Figure S6C-D).
(A) Representative sum images (49-61 min) of [18F]-ASEM (α7 nicotinic receptor) PET-MR in the brain of WT and TgF344-AD rats at 6, 12 and 18 months (m) of age (pallidum/nucleus basalis of Meynert (NBM), striatum are respectively indicated with white, yellow * on the top right (WT 18 m) PET image). Quantification of the [18F]-ASEM uptake in pallidum/NBM (B) and striatum (C) of WT (green circle symbols) and TgF344-AD (red square symbols) rats. (B, C) Data are expressed as mean ± SD of uptake values (sum image 20-60 min) normalised to cerebellum. * and ✝ indicate significant differences vs the 6 and 12 m old animals respectively and # indicates significant difference between WT and TG within age groups. *, ✝ or # indicates p < 0.05. PET data were analysed using a 2-way ANOVA (age as repeated factor and genotype) and a Sidak post-hoc test.
Amyloid deposition detected by [18F]Florbetaben PET and immunohistochemistry is increased in hippocampus and cortex of TgF344-AD rats
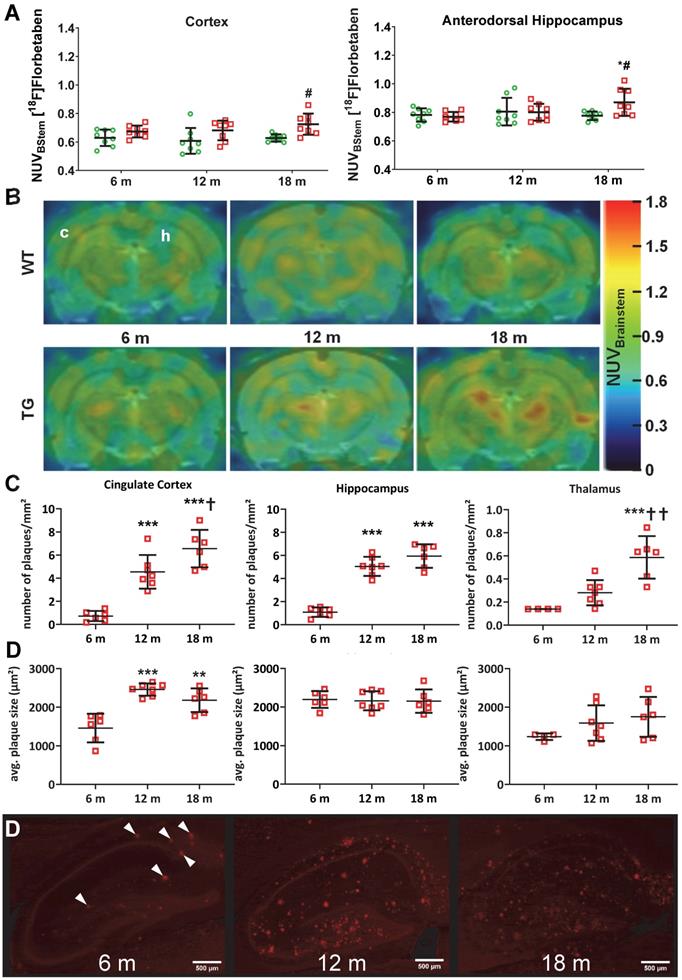
[18F]Florbetaben ([18F]AV-1) PET was conducted to assess levels of amyloid pathology in both genotypes at 6 m, 12 m and 18 m (Figure 4A-B). Analysis revealed a significant genotype effect in the cortex (p = 0.001) and genotype × age interaction in the dorsal hippocampus (p = 0.028), which resulted in increased uptake in TG compared to WT rats at 18 m in both regions (+15 ± 7% p = 0.012 and +12 ± 7% p = 0.020 respectively) (Figure 4A-B). Increased tracer uptake was also observed at 18 m vs. 6 m in TG dorsal hippocampus (+13 ± 12% p = 0.005). Progressive amyloid burden was confirmed via 6E10 immunohistochemistry (Figure 4C-D). No changes were observed in striatum and cerebellum, which are known to be less affected by Aβ pathology (Figure S7). Quantification of 6E10 immunofluorescence revealed a significant increase in amyloid plaques number from 6 m in cingulate cortex (+533 ± 47% at 12 m and +813 ± 43% at 18 m vs 6 m p < 0.001; +44 ± 28% at 18 m vs 12 m p = 0.039), hippocampus (+364 ± 26% at 12 m and +446 ± 27% at 18 m vs 6 m p < 0.001), and later in thalamus (+321 ± 16% and +109 ± 35% at 18 m vs 6 m and 12 m, p < 0.001 and p = 0.003 respectively) (Figure 4C). Notably, the number of plaques in the thalamus was about 10 times lower than in cortex and hippocampus at all ages (Figure 3C). In addition to progressive amyloid deposition, increased plaque size (µm2) was also seen with age in cingulate cortex (+68 ± 16% at 12 m and +49 ± 20% at 18 m vs 6 m, p < 0.001 and p = 0.002 respectively), but not hippocampus or thalamus (Figure 4D).
PET quantification (A) of [18F]Florbetaben uptake normalised to brain stem in the cortex and dorsal hippocampus of WT (green circle) and TG (red squares) rats and (B) representative PET-MR sum images (43-51 min) of [18F] Florbetaben brain uptake at 6, 12 and 18 months of age (In top left image, c and h denotes the position of the cortex and hippocampus respectively). (C) Quantification of the β-amyloid immunohistochemistry (6E10) in the cingulate cortex, hippocampus and thalamus of TG rats 6, 12 and 18 months (m) of age. NOTE there are two (D) on figure. (D) Representative images of the β-amyloid immunohistochemistry (6E10) in the hippocampus of TG rats (scale bars represent 500 µm). Data are expressed as mean ± SD. * and ✝ indicate significant differences vs the 6and 12 mold animals respectively and # indicates significant difference between WT and TG. *, ✝ or # indicates p < 0.05, **/……/## p < 0.01 and ***/………/### p < 0.001. PET data were analysed using a mixed model, immunohistochemistry data were analysed using a 2-way ANOVA with age as repeated factor and genotype in both analysis and a Sidak post-hoc test.
(S)-[18F]THK5117 PET and autoradiography detect increased Tau pathology, immunohistochemistry reveals that it is localized around amyloid plaques in TgF344-AD rats
(S)-[18F]THK5117 PET was performed to detect Tau deposition at 15 m and 25 m (Figure 5A). Longitudinal analysis revealed a significant effect of genotype and/or age on tracer uptake in temporal-auditory cortex (genotype p < 0.001, age p = 0.020, age × genotype interaction p = 0.012), frontal cortex (genotype p = 0.012, age p = 0.001), piriform cortex (genotype p < 0.001) and hippocampus (genotype p = 0.003), resulting in increased signal in TG vs WT rats in these regions (temporal-auditory cortex 15m: +11 ± 3%, p = 0.006, 25 m: +24 ± 3%, p < 0.001; hippocampus 25 m: +13 ± 3%, p = 0.019; piriform cortex 15 m: 17 ± 4%, p < 0.001, 25 m: 15 ± 2%, p < 0.001, Fig, 5A; frontal cortex, 15 m: +9 ± 2%, p = 0.003 Figure S8A). Increased uptake was observed with age only in cingulate cortices (p = 0.016) and frontoparietal cortex (p = 0.009). No significant difference was observed in the thalamus (Figure 5A), pons, cerebellum or hypothalamus via PET.
Tauopathy in the TgF344-AD rats as detected by in vivo by PET imaging (A), autoradiography (B) and immunohistochemistry (C). (A) PET data revealed an increase in [18F]THK5117 uptake in TG rats, mostly in hippocampal and cortical areas. (B) Ex vivo autoradiography revealed greater differences in Tau signal than PET in most cortical areas, the hippocampus, and a modest but significant increase in the thalamus. (C) Immunohistochemistry using AT8 anti-Tau antibody in 18 month (m) old TG rats revealed that Tau deposition (arrows) occurred only around amyloid plaques. PET and autoradiography data are expressed as mean ± SD. * and # indicate significant difference between 15 and 25m old animals and between WT and TG, respectively. * or # indicates p < 0.05, **/## p < 0.01 and ***/### p < 0.001. PET data were analysed using a 2-way ANOVA (genotype and age) and a Sidak post-hoc test. Autoradiography data were analysed using a Welch's t-test. (C) Scale bars represent 200 µm (top row) and 20 µm (bottom row).
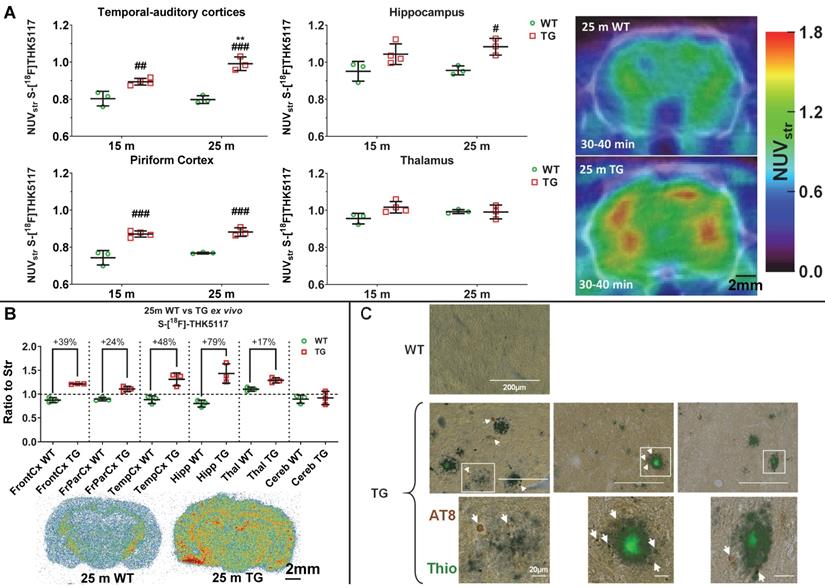
High resolution in ex vivo autoradiography of the animals previously scanned with (S)-[18F]THK5117 at 25m confirmed increased signal in TG rats in cortical areas: frontal:+39 ± 3%, p = 0.007; frontoparietal: +24 ± 5%, p = 0.008; temporal: +48 ± 10%, p = 0.014) and hippocampal (+79 ± 12%, p = 0.023) regions (Figure 5B). A moderate increase was also observed in the thalamus (+17 ± 4%, p = 0.012); however, in line with the in vivo PET results, no significant difference was detected in the cerebellum (Figure 5B).
As gold-standard experiments to confirm (S)-[18F]THK5117 PET and autoradiography experiments, we performed immunohistochemistry using phospho-Tau AT8 (Figure 5C), CP13 and PHF-1 (Figure S8B-C) anti-Tau antibodies and confirmed the presence of endogenous Tau hyperphosphorylated in various positions (AT8: Ser202+Thr205; CP13: Ser202; PHF-1: Ser396+Ser404) in hippocampus of TG but not WT rats at 18 m. Moreover, Tau pathology appeared to be localized around Thioflavine-S positive amyloid plaques in this model. Western blots of hippocampus and whole-cortex homogenates were not sensitive enough to detect a significant increase in Tau phosphorylation in TG rats (Figure S9); this is consistent with the phosphorylated Tau detected being restricted to the periphery of Aβ plaques by immunohistochemistry (Figure 5C, Figure S8) which will be diluted when working on homogenate of whole brain structures such as hippocampus or cortex.
Neuronal loss in TgF344-AD rats is limited to regions occupied by Aβ plaques
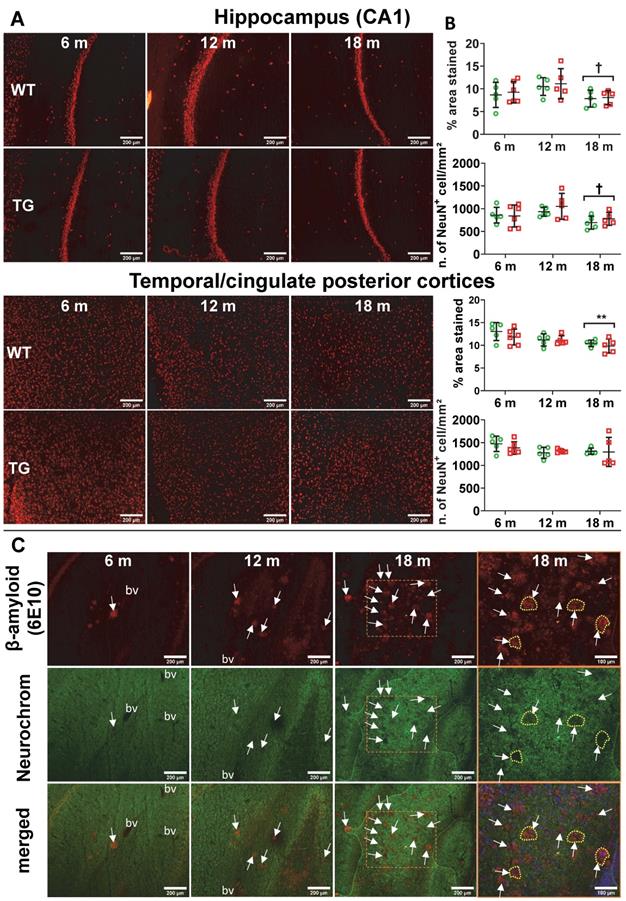
Despite extensive attempts to detect neuronal loss using NeuN immunohistochemistry by fluorescence or chromogenic methods, we only detected age-related neuronal loss in hippocampus (CA1), cingulate posterior and temporal cortices (Figure 6A-B, Figure S10) and thalamus (Figure S10A). We found no significant effect of genotype. However, we noticed an increase in autofluorescence in the cell body of the neurons with age, it is therefore possible that this transient increase in the number of NeuN+ cells might be a false positive, this motivated the use of the chromogenic method to avoid this issue for further investigations.
(A) Representative micrographs of NeuN staining in WT and TG rats at 6, 12 and 18 months (m) of age in the hippocampus CA1 (top panel) and temporal-cingulate posterior cortices (bottom panel) and (B) their respective quantification expressed as percentage stained area and number of NeuN positive cells/mm². There was no significant difference in NeuN staining between WT and TG and only a significant decrease due to age. Data are expressed as mean ± SD. * and ✝ indicate significant differences vs the 6 and 12 m old animals respectively. * or ✝ indicates p < 0.05, **/…… p < 0.01. Data were analysed using 2-way ANOVA (age as repeated factor and genotype) and a Sidak post-hoc test. (C) Representative micrographs of immunohistochemistry for pan-neuronal Neurochrom and β-amyloid in the hippocampus of TG rats at 6, 12 and 18 months (m) of age highlighting a clear loss of neuronal staining where β-amyloid plaques are present. Normal Neurochrom staining is characterised by a homogenous staining of the grey matter (bv = space occupied by blood vessels, negative for Neurochrom). Last panel on the right shows higher magnification of dotted line box of 18 m group with DAPI stain for the merged images. Yellow dotted lines highlight the loss of Neurochrom staining at the location of Aβ plaques. (A & C) Scale bars represent 200 µm.
The chromogenic method revealed only a non-significant trend of decrease in neuronal count in CA3 in TG at 18 m (-14% ± 12, p = 0.298) (Figure S11). Neutral red Nissl labelling of dentate gyrus, CA1 and CA3 produced similar results (data not shown).
Using the pan-neuronal marker Neurochrom, we were however able to observe clear loss of neuronal staining in the space occupied by or even surrounding Aβ plaques (Figure 6C, Figure S10B), demonstrating a direct but very localised impact of Aβ plaques on neurons. Normal Neurochrom staining is characterised by a homogenous staining of the grey matter in which blood vessels (bv in Figure 6C) and lack of staining due to plaques appear darker (white arrows in Figure 6C).
Absence of significant cognitive decline in TG rats may be masked by reduced locomotor activity in the Fischer strain
Longitudinal NOR revealed a significantly longer exploration of the novel over the familiar object in the retention phase of the task in both WT and TG animals at both 3 and 6 m of age (Figure 7A), however neither WT nor TG animals demonstrated any preference for the novel object at 12 or 18 m of age (Figure 7A). Analysis of discrimination index (DI) over time did not reveal any significant differences between groups (genotype p = 0.093, age p = 0.283, interaction age × genotype p = 0.986, Figure 7B). Total exploration times in the retention phase of the NOR test was significantly reduced in both WT (12 vs 3 m: -14 ± 62% p < 0.0001; 12 vs 6 m: -63 ± 63% p = 0.006; 18 vs 3 m: -68 ± 56 % p = 0.0002; 18 vs. 6 m: - 60 ± 57% p = 0.0117) and TG rats (6 vs 3 m: -37 ± 41% p = 0.0267; 12 vs 3 m: -67 ± 34 % p = 0.0002; 18 vs 3 m: -86 ± 47% p < 0.0001; 18 vs. 6 m: -77 ± 56 % p = 0.026) with age (Figure 7C). Similar results were found for total exploration time in the acquisition phase (Figure S12B). No significant differences were identified between the exploration of the left and right objects in the acquisition phase with either group at any age indicating no side bias (Figure S12C). In general, this reduced locomotor activity limits the interaction with objects in the NOR and may be masking any cognitive deficits between genotypes.
(A) Wildtype (WT) and transgenic (TG) rats displayed increased exploration of the novel object in the NOR retention phase at 3 and 6 months (m) but were unable to discriminate objects at 12 and 18 m of age (t-tests). Analysis of discrimination index (DI) over time did not reveal any significant differences between groups (genotype p = 0.093, age p = 0.283, 2-way ANOVA mixed model repeated measure) (B). Total exploration times in the retention phase of the NOR test revealed significantly reduced active exploration of both WT and TG rats with age (1-way ANOVA) (C). TG rats spent decreased time sniffing con-specific animals than WT rats in the social interaction test, with a significant reduction observed at 9 m (t-tests). Data are expressed as mean ± SEM. + indicates significant difference vs. 3 m and * indicates significant difference vs. 6 m. +/* p < 0.05, **p < 0.01, +++/*** p < 0.001 and ++++/**** p < 0.0001.
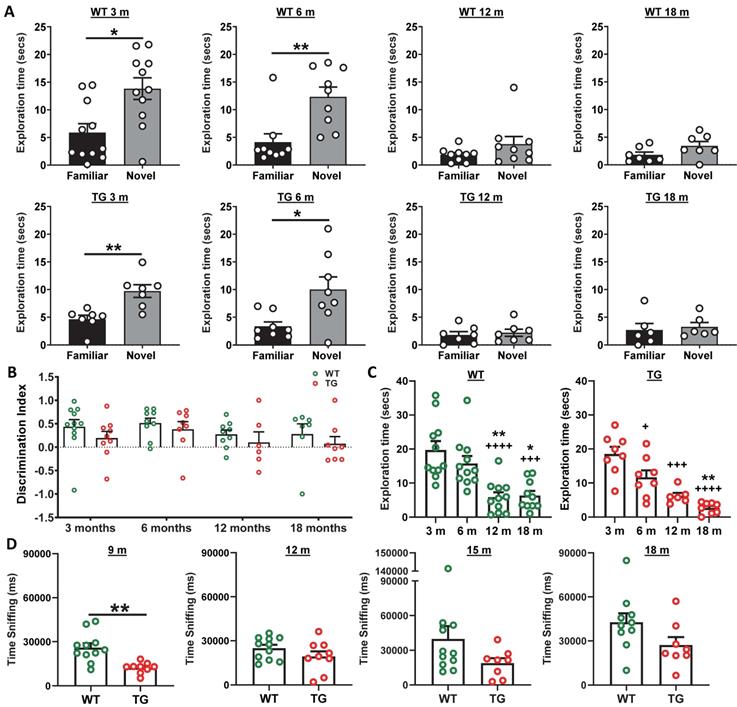
Following our own observations in the NOR at 3 and 6 m, we decided to investigate social interaction at 9, 12, 15 and 18 m by investigating sniffing behaviour of a conspecific WT animal, as well as quantifying the time of exploration of a central object. A reduction was observed in sniffing behaviour at 9m (Figure 7D) with TG rats spending less time sniffing and interacting with conspecific animals compared to WT (p = 0.001). However, there was no effect at other time points. No significant differences were seen in exploration of the central object between WT and TG rats at any time-point (9m p = 0.087; 12 m p = 0.905; 15m p = 0.498; 18 m p = 0.203) (Figure S12D).
AD-like pathology and normal aging affect regional brain metabolite profiles assessed by MRS
MRS was performed in WT and TG rats at 6, 12 and 18 m to assess metabolite profiles in the hippocampus (bilateral and right side), thalamus, hypothalamus and cortex (example spectra in Figure 8A). An effect of age (p < 0.001) and an age × genotype interaction (p = 0.037) were observed with N-acetyl-aspartate (NAA) in the bilateral hippocampus, resulting in significantly reduced NAA levels in 18 m TG vs age-matched WT (-18 ± 14%, p = 0.042) and vs 6 m TG rats (-31 ± 15%, p = 0.017) (Figure 8B). We did not observe alterations in NAA in other regions displaying high levels of Aβ plaques in this rat model such as the cortical voxel.
AD-like pathology and normal aging affect regional brain metabolite profiles. (A) Example MRS spectra obtained from the hippocampus of Wildtype (WT) and transgenic (TG) rats at 6 months (m) of age. The multiple peaks of metabolites of interest are labelled as: 1: N-Acetyl-aspartate, 2: Glutamate, 3: total Creatine (creatine + phosphocreatine), 4: tCholine, 5: Taurine, 6: myo-inositol. (B) Metabolites affected by age and genotype/age × genotype interaction. (C) Metabolites affected by age alone. * and ✝ indicate significant differences vs the 6and 12 m old animals respectively and # indicates significant difference between WT and TG. *, ✝ or # indicates p < 0.05, **/……/## p < 0.01 and ***/………/### p < 0.001. The concentration of metabolites presented are expressed in institutional units which relate to mMol/kg tissue wet weight, assuming a water content of 0.78 mL/g in rodent brain. MRS data were analysed using a mixed model (age as repeated factor and genotype) and a Sidak post-hoc test. Results are shown as mean ± SD. Note: brain region names in figure are written differently for some panels e.g. hipp. & hippocampus, Hypothal. & hypothalamus.
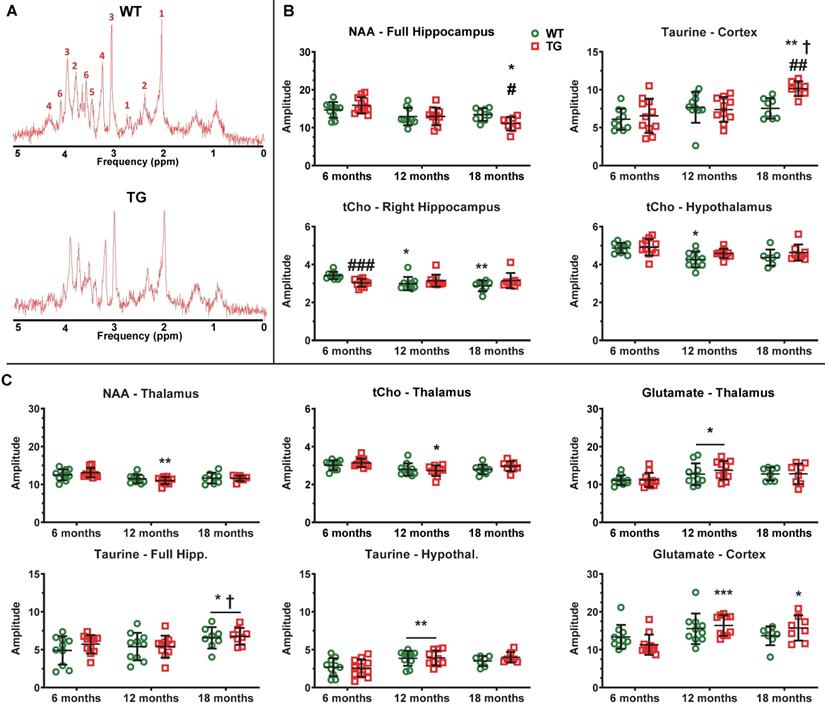
The total of choline-containing compounds (tCho) in hypothalamus was affected at both age (p < 0.001) and genotype (p = 0.047), with a modest but significant reduction in WT rats at 12 m only (vs 6 m: -12 ± 6%, p = 0.017). Similarly, tCho levels in right hippocampus were affected by age and genotype (interaction p = 0.002), with reduced tCho levels seen in TG vs WT rats at 6 m (-11%, p < 0.001) and with age only in WT animals (12 m vs 6 m: -13 ± 9%, p = 0.040; 18 m vs 6 m: -16 ± 8%, p = 0.006, Figure 8B). In contrast, cortical Taurine levels increased in the cortex (age p < 0.001, interaction p = 0.047 and a trend for genotype p = 0.058), leading to significant increases with age in TG rats (18 m vs 6 m: +55 ± 22%, p = 0.007; 18 m vs. 12 m: +37 ± 16%, p = 0.012) and in TG when compared to WT rats at 18 m (+35 ± 14%, p = 0.002).
Additionally, some metabolites were affected by age alone in the thalamus (NAA p < 0.001; tCho p = 0.003; glutamate p = 0.012), cortex (glutamate p < 0.001), full hippocampus (Taurine p = 0.031) and hypothalamus (Taurine p < 0.001). However, some changes were driven by the TG data (Thalamus: 12 vs. 6 m: NAA -16% p = 0.006; tCho -13 ± 9% p = 0.032; Cortex 12 m and 18 m vs 6 m: Glutamate +45 ± 20% p < 0.001 and +39 ± 22% p = 0.019, respectively) (Figure 8C). Myo-inositol levels were not significantly altered at any time-point.
Discussion
Through the use of a multi-modal approach carried out independently in various labs, we demonstrate here that a comprehensive range of parameters, from cognition to brain pathological features, are altered in the TgF344-AD rat model. We report for the first time, longitudinally and in vivo, alterations of neuroinflammation, the α7 nicotinic receptor, amyloid burden, Tau pathology and brain metabolites using PET and MRS techniques in the TgF344-AD model of AD. It must however be noted that most ex vivo observations obtained here are similar to those seen in mouse models of AD. Hence the AD rat presents a model that is similar in most aspects to the transgenic mouse models but with the undoubted advantage of having a larger brain that allows application of a wide range of in vivo imaging techniques which are far less applicable to or less sensitive in mice. It must be noted however that the larger rat brain does not completely circumvent potential limitations of in vivo imaging such as partial volume effect, which may hamper quantification of PET signal in all species including humans especially when measuring small brain structures and/or subtle changes. Ultimately, in vivo imaging presents the advantages of being non-invasive, allowing longitudinal studies to explore various molecular targets in a same animal and is fully translational while ex vivo read-outs are the complementary, more sensitive, absolute gold standards in term of pathophysiology.
Our findings support the use of imaging in such a rat model to monitor disease progression in vivo and investigate new therapies more sensitively than can be achieved with behavioural tests, which are harder to measure and may appear only at later stages. The changes we have observed in the TG rat model are also in good agreement with clinical observations, further supporting the use of this model to investigate AD.
Neuroinflammation
Evidence suggests that neuroinflammation has an integral role to play in AD development with reports of increased neuroinflammation early in clinical AD and MCI as well as in pre-clinical models [33, 49, 50]. Cohen et al. [12] detected a moderate increase in neuroinflammation using immunohistochemistry as early as 6 m in the TgF344-AD rat model. Hence, we wanted to investigate if we could detect these in vivo using [18F]DPA-714 PET. Here, we observed increased [18F]DPA-714 uptake in the hippocampus (12 m) and cortical areas and thalamus (18 m) of TG rats compared to WT rats. These results are in agreement with numerous previous TSPO PET study in mouse models of AD [26, 29, 51-56] and also the majority of clinical studies [33, 57-59] which reported similar (+10-30%) significant increase in TSPO tracer uptake mostly in regions affected by AD pathology (e.g. hippocampus, frontal and cingulate cortices). Interestingly, increased [18F]DPA-714 binding was also seen with age in WT animals, suggesting increased inflammation occurs with normal aging. This is in line with findings of increased neuroinflammation with normal aging [60-62] as notably assessed by TSPO PET in in WT animals (+4-20%) [63, 64] as well as healthy subjects (+4.7~10% per decade) [65, 66]. Similarly, ex vivo analysis by immunohistochemistry demonstrated an early (6 m) modest presence of activated microglia/macrophages, increasing sharply by 12 m and even further at 18 m in the hippocampus and cortical areas in TG. Increases in [18F]DPA-714 uptake was matched by increase in CD11b staining in most ROIs, except for the hippocampus at 12 m in which there was a trend to increase in CD11b (p = 0.098) and the temporal cortex in which the [18F]DPA-714 uptake was not significantly altered at 12 m. Various reasons such as difference in sensitivity of the methods and/or statistical variability are likely to have caused such discrepancies. Interestingly, and in agreement with our PET results, microglial activation was also found to be elevated in thalamus at 18 m, although more modestly than in the hippocampus and cortices, and in relation with the much lower amyloidosis (× 10 less in thalamus than hippocampus/cortices). Astrogliosis was also increased in TG vs WT but conversely to microgliosis, astrogliosis was elevated in TG at all ages and as early as 6 m but tended to decrease with age in both TG and WT.
These results are altogether in agreement with our PET results and numerous previous reports showing increasing microglial activation with AD burden and age in various rodent models including the TgF344-AD rats [12, 26, 29, 63, 67-73]. Similarly, the decrease in astrocyte staining with age and/or progression of AD pathology observed here is consistent with previous reports that have demonstrated a complex regulation of astrocytes with age and disease with astrogliosis in disease combined with a decrease in astrocyte numbers and function with age [74-78].
Amyloid pathology
Here we report the first longitudinal investigation of amyloid-PET in the TgF344-AD model. Using in vivo [18F]Florbetaben PET, we detected a significant cortical and hippocampal amyloid deposition in TG compared to WT rats at 18 m (+12-15%) of age, similar to those detected in mice (+12~25%) at 18-20m of age [29, 63, 79, 80] but lower than those reported in clinical studies (+25~100%) [57, 81, 82]. In support of this, immunohistochemical analysis revealed significant progressive amyloid deposition in cortical and hippocampal regions of TG rats starting from a sparse but significant amyloid deposition at 6 m progressing towards a heavy amyloid load at 12 m and 18 m of age. Our immunohistochemical results are in agreement with the initial report in this model [12]. However, amyloid PET was not able to detect significant increases at 12 m in vivo, likely due to i) the limitations in resolution of small animal PET imaging, ii) the poor signal to noise ratio of amyloid tracers which are notoriously lipophilic and iii) 12 m being a relatively young age for the rats. In this regard, and compared to clinical amyloid PET scans, it must be considered that 6 m and 12 m are relatively young ages in rats which have a life-expectancy that can reach about 30m depending on the strain [83], although the TgF344-AD rats have been aged only up to 25m here (Turku) and up to 26 m in the literature [12]; so one may consider that these rats were imaged proportionally at younger than AD or MCI patients would.
Tau pathology
The TgF344-AD rat was reported by Cohen et al. [12] to be the first rodent model to exhibit spontaneous NFT-like hyperphosphorylated Tau accumulation similar to that seen clinically. Here we use (S)-[18F]THK5117 to investigate longitudinally the Tau burden in vivo. We observed significant increase in (S)-[18F]THK5117 uptake in cortical and hippocampal regions TG rats when compared to age-matched WT rats mostly at 25m of age. Ex vivo autoradiography supported these findings and revealed markedly elevated binding in regions known to be affected in AD including the frontal cortex, hippocampus and thalamus. These results are somehow in contradiction with the Tau biochemistry analysis performed by Cohen et al. [12] which demonstrated increased Tau level earlier, at 6 and 16 m, but no further increase at 26 m, however this is most likely due to the methodological approaches being very different (in vivo or ex vivo isotopic methods vs Western blots). However, our immunohistochemical analysis identified Tau hyperphosphorylation in the hippocampus at 18 m in agreement with previous studies [12, 28]. Our immunohistochemical analysis also revealed that hyperphosphorylated Tau was found only in dystrophic neurites around the amyloid plaques in the TG rats. This is in agreement with the potential seeding of Tau pathology by Aβ [84] and observations by Cohen et al. [12] and also Morrone et al. [19] who reported that 80-85% of PHF1+ neurons were located near Aβ plaques. This observation is however in contrast to Tau burden reported also in non-plaque regions of the cortex and hippocampus [12, 28]. Those differences between studies may potentially be related to differences in the methods used and/or ages studied here and in other studies. The differences between the results of in vivo Tau PET and immunohistochemistry are likely to be explained by the lower sensitivity of PET and by the previously reported off-target binding of (S)-[18F]THK5117 [85, 86]. Such off-target binding, notably to monoamine oxidases, has been a major problem to most first-generation Tau tracers [87, 88]. The results presented here clearly confirms that off-target binding of Tau tracers may hamper detection of Tauopathy, and although second generation of Tau tracers have shown negligible monoamine oxidase binding [88, 89], binding to other molecules such as neuromelanin and melanin still present a challenge to development of a Tau-specific PET tracer [87, 90, 91]. It is generally accepted that hyperphosphorylated Tau or NFT are absent or extremely difficult to detect in the mouse models with identical transgenes, although in some models, modest levels of hyperphosphorylated Tau have been reported [92]. Some PET studies using other tracers have successfully imaged Tau accumulation in transgenic Tau mouse model, and it is possible that using one of the new Tau PET tracers may show in vivo tau accumulation in the TgF344-AD rats at earlier time-points. Conversely, the levels of Tau deposition in this model have now been consistently reported by us and others [12, 19, 28], suggesting that this rat model reproduces this essential feature of AD. Moreover, the 3R to 4R Tau ratio in rats is similar to humans, but different to mice. Similarly to this model, the APP × PS1 rat model generated by Flood et al. [93] displayed dense fibrillar Aβ plaques with phosphorylated Tau in close proximity. Conversely, in the McGill-R-Thy1-APP model generated by Leon et al. [94], no neuronal loss or NFT-like Tau pathology were reported despite displaying amyloid pathology, cognitive deficits, and increased neuroinflammation.
Neurodegeneration
Here, and despite using 2 different methods of immunostaining for NeuN, we were not able to detect a significant decrease in numbers of neurons between WT and TG, contrary to the initial report on the TgF344-AD rats [12]. We however detected a significant decrease in NeuN percentage-stained area with age in both WT and TG in hippocampus, posterior cingulate/temporal cortices and thalamus at 18 m of age, which may have contributed to the lack of differences between WT and TG at this age. Since the publication of the initial characterisation of the TgF344-AD strain, reports regarding neuronal loss/neurodegeneration have produced mixed results. Leplus et al. [95] detected loss of neurons in the gyrus dentatus and the cortex but not in CA1 using 18 m old animals, whereas Voorhees et al. [96] reported neuronal loss in the hippocampus and not in the cortex at 24m of age. Voorhees et al. [96] noted that NeuN staining could produce false negative following the phagocytosis of neuronal debris by microglia and had to rely on cresyl-violet staining. Our results are however in line with those independently produced by our collaborators Anckaerts et al. [22] who did not detect any significant loss of neurons by NeuN immunostaining in female TgF344-AD at 10 and 20m of age. We however confirmed using Neurochrom staining that amyloid plaques create a void of viable neurons around them (Figure 6C and Figure S9B). This, in itself, is likely to disturb neuronal functions and connectivity. This hypothesis of very localised neuronal disruption fits well with our MRS findings showing decreased levels of NAA in the hippocampus, the presence of hyperphosphorylated-Tau positive neurons around the Aβ plaques shown here and the previously reported decrease in connectivity by rsfMRI [22, 23, 97]. Subtle localised neuronal alterations are also in agreement with other reports showing a decrease in glutamic acid decarboxylase positive neurons in CA1 [13], and in norepinephrine transporter and dopamine β-hydroxylase positive fibres in the hippocampus and gyrus dentatus respectively, without gross neuronal loss in the locus coeruleus [28]. In line with these changes in specific neurotransmission systems, we here demonstrate that there is significant age-dependent increase in α7-nAChR in the striatum and pallidum/NBM in WT, which does not occur in TG. It is noteworthy that our imaging study of α7-nAChR performed for the first time longitudinally in rodents is consistent with a human PET study that revealed an increased uptake of [18F]ASEM according to age in various brain regions including the striatum [98]. This apparent adaptation to aging, not occurring in TG, leads to a significantly lower level of α7-nAChR in TG at 18 m in the pallidum/NBM, which, if it had been taken in isolation, may have been considered as a decrease in TG rats. One may also consider that the changes attributed here to the pallidum/NBM may actually reflect changes occurring more specifically in the NBM (substantia innominata) principal efferent cholinergic structure in the rat brain and which was included in this larger ROI because the size of the NBM alone is beyond the resolution of PET and because of its close proximity with the globus pallidus [99]. It is particularly relevant to consider this in light of previous reports showing alterations of cholinergic receptor density in the striatum and thalamus which have been reported in AD [100-104].
We thus brought here new evidence of the involvement of the cholinergic system during aging and their dysfunction in AD, hence further supporting its interests as therapeutic target in AD. In particular, the involvement of α7-nAChR in this context may suggest this family of receptors as a potential target in AD [105-107]. Overall, this strongly supports the need for longitudinal in vivo multimodality investigations of the cholinergic system in animal models, as well as clinical settings to fully understand the changes in both ACh and its receptors in AD. In particular, the measurement of ACh levels in the basal forebrain in animal models and should be considered in future investigations.
Behaviour
Cognitive deficits in the TgF344-AD model have been previously reported from 6 m in the Barnes maze and at 13 m [19] and 24m using NOR [12]. Here, we assessed NOR at the earlier time-points of 3 m, 6 m, 12 m and 18 m. At both 3 and 6 m, we did not observe significantly reduced performance in these rats suggesting there is no cognitive decline in TG compared to WT rats at these ages. However, we did observe reduced locomotor activity in both WT and TG rats from 12 m, which reduced their ability to perform the task. We observed deficits in social interaction at 9m of age with no changes at other time points. These results suggest that i) subsequent time-points between 18 m and 24m and ii) more refined tests, such as Morris water maze (MWM) and reversed-MWM [28] or delayed non-matching-to-sample task [23, 97], might be better suited to investigate the TgF344-AD rats. However, even with more sophisticated tests the cognitive deficits observed in TgF344-AD when compared to WT at various ages remain modest [23, 28, 97] requiring a thorough analysis of all parameters recorded [21] in order to observe significant differences. Reduced locomotor activity has previously been reported in Fischer male rats compared to other strains [46, 108] and could affect the ability of the rats to perform the NOR test. The fact that the same rats were monitored longitudinally at various age in the same environment may also explained a certain lack of motivation to perform the tests, although rats were exposed to totally new objects in the NOR tests and new conspecific animals for the social interaction test at each time-points. Altogether, our results are nevertheless in line with previous reports showing low motor activity [109], and anxious-depressive-like behaviour in the TgF344-AD [110]. The previously reported anxiety of the Fischer-344 strain [45, 46, 111] coupled with reduced locomotion in both WT and TG animals experienced here suggests that back-crossing transgenic rats generated on a Fischer-344 background in another strain such as Wistar or Lister-hooded should be considered when behavioural parameters are particularly important read-outs.
Metabolite alterations
MRS permits the non-invasive detection of biochemical changes in vivo, allowing potential identification of changes in regional brain metabolites prior to anatomical or disease manifestation. We here report the first MRS investigation of the TgF344-AD rats. We notably observed alterations in hippocampal NAA and tCho, and cortical Taurine levels between genotypes with age. Interestingly, decreased hippocampal NAA levels were observed in TG but not in WT rats with age. NAA has long been considered as a marker of neuronal density [112], though it may better be described as a marker of neuronal function [112-115]. Therefore, decreased NAA levels are indicative of neuronal/brain dysfunction, hence our results suggest that hippocampal neuronal dysfunction occurred with age and worsened in the presence of AD-like pathology in TgF344-AD rats. This is consistent with multiple reports of decreased hippocampal NAA levels in AD and MCI patients [116-123], and in mouse models of AD [124-127] including our recent study using a mouse model [26] with the same mutations as the TgF344-AD rat [26]. Similar changes in NAA were also observed in the other TG rat model of AD McGill-R-Thy1-APP at 3 m or 9m of age [128, 129].
In the hippocampus, tCho decreased with age in WT but not in TG; TG animals had however significantly lower level of tCho than WT at 6 m suggesting an early alteration of tCho in TG with no further changes with age. Decreased tCho levels have also been reported in AD patients [117] but results are inconsistent with others reporting no significant changes [120]. In animal models of AD, levels of choline compounds were also decreased at 3 or 9m of age in McGill-R-Thy1-APP rats [128, 129]. Conversely, Esteras et al. [130] and Forster et al. [131] found increased levels of tCho in AβPP/PS1 and TASTPM mice respectively, whereas we did not find any significant change in APPswe × PS1Δ9 mice [26]. Free choline is needed for the production of the neurotransmitter acetylcholine [132], so a decrease in tCho level may suggest reduced choline availability for acetylcholine synthesis. However, since free choline is only a minor component of the tCho peak (< 10% [133]), this interpretation has to remain speculative.
Myo-inositol has been suggested to be a glial specific marker and that increasing levels may be indicative of microglial activation or gliosis [116]. In this context, one could hypothesize an increase in myo-inositol in the TgF344-AD rat similarly to the transient (12 m) increase in myo-inositol reported in McGill-R-Thy1-APP rats [129]. However, despite increased neuroinflammation and amyloid pathology demonstrated in this model by this study and previously [12], no significant differences in myo-inositol levels were identified at any time-point. Again, previous findings using other models produced different results, we did not observe any change in myo-inositol in APPswe × PS1Δ9 mice [26] whereas Forster et al. [131] found a robust increase in myo-inositol levels in the more aggressive TASTPM mouse model. However, the notion that myo-inositol is a glial marker is based on a single published report by Leibfritz and Brand [134] and a link with gliosis has never been further solidified. Furthermore, recent studies have questioned the association between myo-inositol and neuroinflammation while a correlation with amyloid burden has been reported [116].
On the other hand, we did see increased Taurine in TG rats. Taurine is an essential amino-acid known to have numerous functions such as osmoregulatory, neurotrophic and neuroprotective roles and excess or deficiency of Taurine levels leads to several diseases [135-138]. Taurine has also previously been shown to protect against excitotoxicity induced by amyloid [139], therefore the increase we observed in the cortex of TG rats at 18 m may be a compensatory protective mechanism to counter the amyloid-induced damages. In the hippocampus and hypothalamus, the increase in Taurine levels was driven by age suggesting a potential compensation to also counter aging processes. Our results are in line with increases in Taurine reported at 9 and 12 m of age in McGill-R-Thy1-APP rats [129] but have not been recapitulated in mouse models [26, 131].
Multiple regional metabolite alterations were identified with aging alone. This is in accordance with previous reports in both preclinical models [26, 129] and humans [140, 141], and highlights the need to better characterize the effects of normal aging to enable accurate measure of AD-specific alterations. Moreover, while MRS seems to be a valid tool to assess metabolite levels in vivo, the complexity of the analysis, differences in quantification methods (such as normalisation to water, total metabolites or creatine) as well as difficulties related to the size of the mouse brain when compared with rats and even more so between rodents and human may explain some of the discrepancies observed between studies. This highlights the need for further investigations combining in vivo MRS and PET with various ex vivo techniques such as mass-spectrometry to measure small metabolites and further understand their role in AD pathology.
Conclusions
Altogether our results provide an extensive review of the AD-like pathology and phenotype of the TgF344-AD rats model from early to advanced stage of the disease which is important to characterise for understanding disease progression and for testing new treatments. Our results show here, for the first time, interesting characteristics in term of altered metabolites by MRS, alongside quantification of α7-nAChR, Tau, Aβ and neuroinflammation by in vivo PET imaging confirmed by ex vivo analysis. Hence, providing a full, multi-modal characterisation of this model from early age (6 and 12 m) up to a more advance stage (18 m). The overall results of this study are summarised in Table 1. This study was made possible only through extensive collaboration between many labs. We would like to note however that a true multi-centre study, implying repeating similar experiments in different institutions, would be needed to investigate variability of data collection within each technique and provide added robustness to the results. Although it must be acknowledged that such study would significantly increase the financial cost as well as the ethical cost in term of number of animals used. Such characterization is essential before further studies, which are both time-consuming and expensive, could be reasonably undertaken using this model. The data provided here support the potential of this model to investigate mechanisms of AD pathology and new therapeutics with the significant advantage of the rat larger brain, which allows more precise quantifications in in vivo longitudinal imaging studies, when compared to mice.
Summary of the study findings
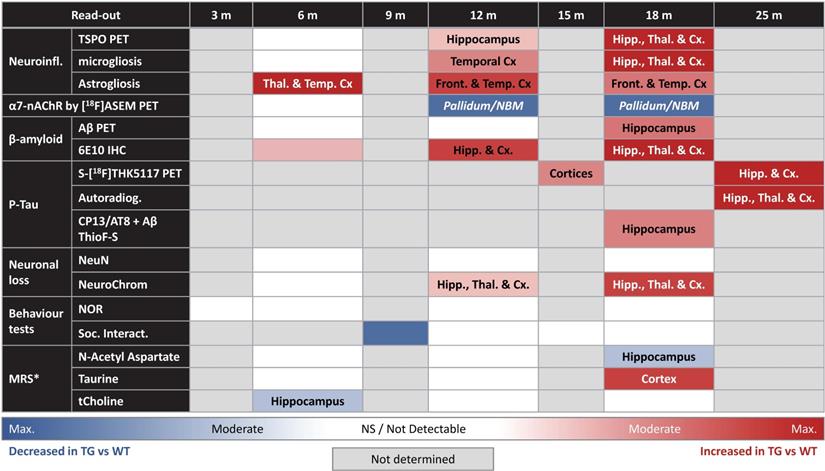
The age in months (m) at which each parameter (in rows) was assessed is indicated in columns. Changes found at these time-points: a grey shading indicate that there was no assessment of the parameter shown in the corresponding row, a white shading indicates that the parameter was assessed but no significant change were found, a blue or red shading indicate respectively a significant decrease/lower values or increase/higher values in the TG vs age-matched WT. Brain areas where the significant changes were detected are indicated in each cell (abbreviations: α7-nAChR = α7 nicotinergic acetyl-choline receptor; Autoradiog. = autoradiography; ThioF-S = thioflavine-S; NOR = novel object recognition test; Soc. Interact. = social interaction behavioural test; Thal. = thalamus; Hipp. = Hippocampus; Temporal Cx. = temporal cortex; Front. Cx = frontal cortex; Cx. = all neorcortical areas). * For MRS, the regions of interest correspond to the voxel shown Figure S2.
Abbreviations
AD: Alzheimer's disease; Aβ: amyloid-beta plaque; CAA: cerebral amyloid angiopathy; PET: positron emission tomography; APP: amyloid precursor protein; PS1: presenilin 1; NFTs: neurofibrillary tangle; TG: transgenic; MRS: magnetic resonance spectroscopy; α7-nAchR: α7 nicotinic acetylcholine receptor; NAA: N-acetyl-aspartate; tCho: choline-containing-compounds; WT: wild-type.
Supplementary Material
Supplementary figures and tables.
Acknowledgements
The experiments in this study were performed at individual centres through collaboration between partners of the FP7 EU INMiND with expertise in MRS, TSPO-PET, tau-PET, amyloid-PET, α7-nAchR-PET and animal behaviour and external partners for the ex vivo study.
We acknowledge Professor Okamura from Tohoku University for providing the precursor and reference compounds for (S)-[18F]THK5117 imaging.
We would like to sincerely thank Dr Guadalupe Soria (Experimental 7T MRI Unit, IDIBAPS, C/ Rosselló 149-153, 08036 Barcelona, Spain) for generously providing perfused-fixed brain sections of 18 months old rats from her TgF344-AD colony.
We would like to thank Dr Peter Davies (Albert Einstein College of Medicine, Bronx, NY, USA) for the gift of Tau antibodies.
HB and the INMiND partners involved in this study would like to express their gratitude to Prof Andreas Jacobs, coordinator of the INMiND consortium, for his constant support to this multi-site collaborative study in particular, and his critical input during the annual INMiND meetings. The authors also wish to thank all the personnel of the WMIC, especially Dr Michael Fairclough, Ms. Lidan Christie, Mr Michael Green, Mr Jamil Gregory, Ms Carol Brough and Ms Gemma Chapman for facilitating the study. The authors also wish to thank GlaxoSmithKline and more particularly Dr. A. Bifone for providing the rat brain MRI template used for co-registration with the PET images at the UoM.
Funding
The purchase of the TgF344-AD rat was jointly supported by the European Union's Seventh Framework Programme (FP7/2007-2013) under grant agreement n° HEALTH-F2-2011-278850 (INMiND) and Alzheimer Research UK network funds at the UoM.
This work was funded by the European Union's Seventh Framework Programme (FP7/2007-2013) under grant agreement n°HEALTH-F2-2011-278850 (INMiND) in Manchester, Turku and Tours (grant holders: HB, University of Manchester; SC, University of Tours; JOR, University of Turku).
The MR facility was supported through an equipment grant from BBSRC UK (BB/F011350). The developers of jMRUI [142] and the support of it through the EU FP7 'TRANSACT' (FP7-PEOPLE-2012-ITN- 316679) are hereby acknowledged.
AMC was funded by a PhD studentship of the BioImaging Institute of the UoM. MV was funded by the EPSRC project EP/M005909/1.
The work in the University of Tours was supported by Labex IRON (ANR-11-LABX-18-01).
Authors contributions
University of Turku: FRLP designed and performed the (S)-[18F]THK5117 in vivo PET and autoradiography study. JR performed the synthesis of (S)-[18F]THK5117 and AS contributed to the data analysis, JOR participated in the study design and manuscript revision.
University of Tours: SS performed and analysed the [18F]ASEM and [18F]Florbetaben experiments; JB contributed to the breeding, genotyping of the TgF344-AD colony and to the PET experiments; JV prepared the radiotracers; CT contributed to the PET image analysis; SC designed, coordinated and supervised all the studies performed at the University of Tours.
University College London: RW performed all the Tau immunohistochemistry and Western blot experiments; DAS contributed to these experiments and supervision of the work; FAE supervised the studies at UCL.
University of Orleans: FB produced the stable ASEM and precursor for radiolabelling of [18F]ASEM; SR supervised this work at the University of Orleans.
Manchester Metropolitan University: SDW performed the chromogenic NeuN immunohistochemistry and image analyses; LO contributed to image analyses and supervised the studies at MMU.
University of Sydney: TR produced the precursor and cold reference required for the synthesis of [18F]DPA-714 in Manchester; MK supervised the work and generously provided those reagents to HB.
University of Manchester: AMC performed and analysed the behaviour, MRS and PET studies; DB, MV and CG performed the immunohistochemistry and analysed the images; MKH helped design and interpret the behavioural tests; KED provided essential support for the MRS study, SRW designed and supervised the MRS study; HB contributed to, designed and supervised all experiments taking place at the University of Manchester, designed the overall study and coordinated the work. HB and AMC wrote the manuscript and all authors contributed to the writing, edited and reviewed the manuscript.
Competing Interests
HB holds a grant funded by GlaxoSmithKline pharmaceutical company; DB was funded by this grant; GlaxoSmithKline was not involved in any of the work presented here.
References
1. Patterson C. World Alzheimer Report 2018, The state of the art of dementia research: New frontiers. Alzheimer's Disease International. 2018
2. McManus RM, Heneka MT. Role of neuroinflammation in neurodegeneration: new insights. Alzheimers Res Ther. 2017;9:14
3. Mhatre SD, Tsai CA, Rubin AJ, James ML, Andreasson KI. Microglial malfunction: the third rail in the development of Alzheimer's disease. Trends Neurosci. 2015;38:621-36
4. Wang H, Tan L, Wang HF, Liu Y, Yin RH, Wang WY. et al. Magnetic Resonance Spectroscopy in Alzheimer's Disease: Systematic Review and Meta-Analysis. J Alzheimers Dis. 2015;46:1049-70
5. Ferreira-Vieira TH, Guimaraes IM, Silva FR, Ribeiro FM. Alzheimer's disease: Targeting the Cholinergic System. Curr Neuropharmacol. 2016;14:101-15
6. Esquerda-Canals G, Montoliu-Gaya L, Guell-Bosch J, Villegas S. Mouse Models of Alzheimer's Disease. J Alzheimers Dis. 2017;57:1171-83
7. Kurt MA, Davies DC, Kidd M, Duff K, Howlett DR. Hyperphosphorylated tau and paired helical filament-like structures in the brains of mice carrying mutant amyloid precursor protein and mutant presenilin-1 transgenes. Neurobiol Dis. 2003;14:89-97
8. Radde R, Bolmont T, Kaeser SA, Coomaraswamy J, Lindau D, Stoltze L. et al. Abeta42-driven cerebral amyloidosis in transgenic mice reveals early and robust pathology. EMBO Rep. 2006;7:940-6
9. Ellenbroek B, Youn J. Rodent models in neuroscience research: is it a rat race? Dis Model Mech. 2016;9:1079-87
10. Echeverria V, Ducatenzeiler A, Alhonen L, Janne J, Grant SM, Wandosell F. et al. Rat transgenic models with a phenotype of intracellular Abeta accumulation in hippocampus and cortex. J Alzheimers Dis. 2004;6:209-19
11. Do Carmo S, Cuello AC. Modeling Alzheimer's disease in transgenic rats. Mol Neurodegener. 2013;8:37
12. Cohen RM, Rezai-Zadeh K, Weitz TM, Rentsendorj A, Gate D, Spivak I. et al. A Transgenic Alzheimer Rat with Plaques, Tau Pathology, Behavioral Impairment, Oligomeric Aβ, and Frank Neuronal Loss. J Neurosci. 2013;33:6245-56
13. Bazzigaluppi P, Beckett TL, Koletar MM, Lai AY, Joo IL, Brown ME. et al. Early-stage attenuation of phase-amplitude coupling in the hippocampus and medial prefrontal cortex in a transgenic rat model of Alzheimer's disease. J Neurochem. 2018;144:669-79
14. Smith LA, McMahon LL. Deficits in synaptic function occur at medial perforant path-dentate granule cell synapses prior to Schaffer collateral-CA1 pyramidal cell synapses in the novel TgF344-Alzheimer's Disease Rat Model. Neurobiol Dis. 2018;110:166-79
15. Stoiljkovic M, Kelley C, Horvath TL, Hajos M. Neurophysiological signals as predictive translational biomarkers for Alzheimer's disease treatment: effects of donepezil on neuronal network oscillations in TgF344-AD rats. Alzheimers Res Ther. 2018;10:105
16. Stoiljkovic M, Kelley C, Stutz B, Horvath TL, Hajos M. Altered Cortical and Hippocampal Excitability in TgF344-AD Rats Modeling Alzheimer's Disease Pathology. Cereb Cortex. 2019;29:2716-27
17. Joo IL, Lai AY, Bazzigaluppi P, Koletar MM, Dorr A, Brown ME. et al. Early neurovascular dysfunction in a transgenic rat model of Alzheimer's disease. Sci Rep. 2017;7:46427
18. Sare RM, Cooke SK, Krych L, Zerfas PM, Cohen RM, Smith CB. Behavioral Phenotype in the TgF344-AD Rat Model of Alzheimer's Disease. Front Neurosci. 2020;14:601
19. Morrone CD, Bazzigaluppi P, Beckett TL, Hill ME, Koletar MM, Stefanovic B. et al. Regional differences in Alzheimer's disease pathology confound behavioural rescue after amyloid-beta attenuation. Brain. 2020;143:359-73
20. Berkowitz LE, Harvey RE, Drake E, Thompson SM, Clark BJ. Progressive impairment of directional and spatially precise trajectories by TgF344-Alzheimer's disease rats in the Morris Water Task. Sci Rep. 2018;8:16153
21. Pentkowski NS, Berkowitz LE, Thompson SM, Drake EN, Olguin CR, Clark BJ. Anxiety-like behavior as an early endophenotype in the TgF344-AD rat model of Alzheimer's disease. Neurobiol Aging. 2018;61:169-76
22. Anckaerts C, Blockx I, Summer P, Michael J, Hamaide J, Kreutzer C. et al. Early functional connectivity deficits and progressive microstructural alterations in the TgF344-AD rat model of Alzheimer's Disease: A longitudinal MRI study. Neurobiol Dis. 2019;124:93-107
23. Munoz-Moreno E, Tudela R, Lopez-Gil X, Soria G. Early brain connectivity alterations and cognitive impairment in a rat model of Alzheimer's disease. Alzheimers Res Ther. 2018;10:16
24. Munoz-Moreno E, Tudela R, Lopez-Gil X, Soria G. Brain connectivity during Alzheimer's disease progression and its cognitive impact in a transgenic rat model. Netw Neurosci. 2020;4:397-415
25. Dickie BR, Vandesquille M, Ulloa J, Boutin H, Parkes LM, Parker GJM. Water-exchange MRI detects subtle blood-brain barrier breakdown in Alzheimer's disease rats. Neuroimage. 2019;184:349-58
26. Chaney A, Bauer M, Bochicchio D, Smigova A, Kassiou M, Davies KE. et al. Longitudinal investigation of neuroinflammation and metabolite profiles in the APPswe xPS1Deltae9 transgenic mouse model of Alzheimer's disease. J Neurochem. 2018;144:318-35
27. Sridharan S, Lepelletier FX, Trigg W, Banister S, Reekie T, Kassiou M. et al. Comparative Evaluation of Three TSPO PET Radiotracers in a LPS-Induced Model of Mild Neuroinflammation in Rats. Mol Imaging Biol. 2017;19:77-89
28. Rorabaugh JM, Chalermpalanupap T, Botz-Zapp CA, Fu VM, Lembeck NA, Cohen RM. et al. Chemogenetic locus coeruleus activation restores reversal learning in a rat model of Alzheimer's disease. Brain. 2017;140:3023-38
29. Serriere S, Tauber C, Vercouillie J, Mothes C, Pruckner C, Guilloteau D. et al. Amyloid load and translocator protein 18 kDa in APPswePS1-dE9 mice: a longitudinal study. Neurobiol Aging. 2015;36:1639-52
30. Vetel S, Vercouillie J, Buron F, Vergote J, Tauber C, Busson J. et al. Longitudinal PET Imaging of alpha7 Nicotinic Acetylcholine Receptors with [(18)F]ASEM in a Rat Model of Parkinson's Disease. Mol Imaging Biol. 2020;22:348-57
31. James ML, Fulton RR, Vercoullie J, Henderson DJ, Garreau L, Chalon S. et al. DPA-714, a new translocator protein-specific ligand: synthesis, radiofluorination, and pharmacologic characterization. J Nucl Med. 2008;49:814-22
32. Schwarz AJ, Danckaert A, Reese T, Gozzi A, Paxinos G, Watson C. et al. A stereotaxic MRI template set for the rat brain with tissue class distribution maps and co-registered anatomical atlas: application to pharmacological MRI. Neuroimage. 2006;32:538-50
33. Hamelin L, Lagarde J, Dorothee G, Leroy C, Labit M, Comley RA. et al. Early and protective microglial activation in Alzheimer's disease: a prospective study using 18F-DPA-714 PET imaging. Brain. 2016;139:1252-64
34. Garcia-Lorenzo D, Lavisse S, Leroy C, Wimberley C, Bodini B, Remy P. et al. Validation of an automatic reference region extraction for the quantification of [(18)F]DPA-714 in dynamic brain PET studies. J Cereb Blood Flow Metab. 2018;38:333-46
35. Sacher C, Blume T, Beyer L, Peters F, Eckenweber F, Sgobio C. et al. Longitudinal PET Monitoring of Amyloidosis and Microglial Activation in a Second-Generation Amyloid-beta Mouse Model. J Nucl Med. 2019;60:1787-93
36. Brendel M, Focke C, Blume T, Peters F, Deussing M, Probst F. et al. Time Courses of Cortical Glucose Metabolism and Microglial Activity Across the Life Span of Wild-Type Mice: A PET Study. J Nucl Med. 2017;58:1984-90
37. Wang H, Shi H, Yu H, Jiang S, Tang G. Facile and rapid one-step radiosynthesis of [(18)F]BAY94-9172 with a new precursor. Nucl Med Biol. 2011;38:121-7
38. Overhoff F, Brendel M, Jaworska A, Korzhova V, Delker A, Probst F. et al. Automated Spatial Brain Normalization and Hindbrain White Matter Reference Tissue Give Improved [(18)F]-Florbetaben PET Quantitation in Alzheimer's Model Mice. Front Neurosci. 2016;10:45
39. Gao Y, Kellar KJ, Yasuda RP, Tran T, Xiao Y, Dannals RF. et al. Derivatives of dibenzothiophene for positron emission tomography imaging of alpha7-nicotinic acetylcholine receptors. J Med Chem. 2013;56:7574-89
40. Okamura N, Furumoto S, Harada R, Tago T, Yoshikawa T, Fodero-Tavoletti M. et al. Novel 18F-labeled arylquinoline derivatives for noninvasive imaging of tau pathology in Alzheimer disease. J Nucl Med. 2013;54:1420-7
41. Lopez-Picon FR, Kirjavainen AK, Forsback S, Takkinen JS, Peters D, Haaparanta-Solin M. et al. In vivo characterization of a novel norepinephrine transporter PET tracer [(18)F]NS12137 in adult and immature Sprague-Dawley rats. Theranostics. 2019;9:11-9
42. Ratiney H, Sdika M, Coenradie Y, Cavassila S, van Ormondt D, Graveron-Demilly D. Time-domain semi-parametric estimation based on a metabolite basis set. NMR Biomed. 2005;18:1-13
43. Schindelin J, Arganda-Carreras I, Frise E, Kaynig V, Longair M, Pietzsch T. et al. Fiji: an open-source platform for biological-image analysis. Nat Methods. 2012;9:676-82
44. Salih DA, Rashid AJ, Colas D, de la Torre-Ubieta L, Zhu RP, Morgan AA. et al. FoxO6 regulates memory consolidation and synaptic function. Genes Dev. 2012;26:2780-801
45. Rex A, Sondern U, Voigt JP, Franck S, Fink H. Strain differences in fear-motivated behavior of rats. Pharmacol Biochem Behav. 1996;54:107-11
46. Rex A, Voigt JP, Fink H. Behavioral and neurochemical differences between Fischer 344 and Harlan-Wistar rats raised identically. Behav Genet. 1999;29:187-92
47. Ennaceur A, Delacour J. A new one-trial test for neurobiological studies of memory in rats. 1: Behavioral data. Behav Brain Res. 1988;31:47-59
48. File SE, Hyde JR. Can social interaction be used to measure anxiety? Br J Pharmacol. 1978;62:19-24
49. Chaney A, Williams SR, Boutin H. In vivo molecular imaging of neuroinflammation in Alzheimer's disease. J Neurochem. 2019;149:438-51
50. Lagarde J, Sarazin M, Bottlaender M. In vivo PET imaging of neuroinflammation in Alzheimer's disease. J Neural Transm (Vienna). 2018;125:847-67
51. James ML, Belichenko NP, Shuhendler AJ, Hoehne A, Andrews LE, Condon C. et al. [(18)F]GE-180 PET Detects Reduced Microglia Activation After LM11A-31 Therapy in a Mouse Model of Alzheimer's Disease. Theranostics. 2017;7:1422-36
52. Keller T, Lopez-Picon FR, Krzyczmonik A, Forsback S, Kirjavainen AK, Takkinen JS. et al. [(18)F]F-DPA for the detection of activated microglia in a mouse model of Alzheimer's disease. Nucl Med Biol. 2018;67:1-9
53. Lopez-Picon FR, Snellman A, Eskola O, Helin S, Solin O, Haaparanta-Solin M. et al. Neuroinflammation Appears Early on PET Imaging and Then Plateaus in a Mouse Model of Alzheimer Disease. J Nucl Med. 2018;59:509-15
54. Rapic S, Backes H, Viel T, Kummer MP, Monfared P, Neumaier B. et al. Imaging microglial activation and glucose consumption in a mouse model of Alzheimer's disease. Neurobiol Aging. 2013;34:351-4
55. Tournier BB, Tsartsalis S, Rigaud D, Fossey C, Cailly T, Fabis F. et al. TSPO and amyloid deposits in sub-regions of the hippocampus in the 3xTgAD mouse model of Alzheimer's disease. Neurobiol Dis. 2019;121:95-105
56. Blume T, Focke C, Peters F, Deussing M, Albert NL, Lindner S. et al. Microglial response to increasing amyloid load saturates with aging: a longitudinal dual tracer in vivo muPET-study. J Neuroinflammation. 2018;15:307
57. Edison P, Archer HA, Gerhard A, Hinz R, Pavese N, Turkheimer FE. et al. Microglia, amyloid, and cognition in Alzheimer's disease: An [11C](R)PK11195-PET and [11C]PIB-PET study. Neurobiol Dis. 2008;32:412-9
58. Kreisl WC, Lyoo CH, McGwier M, Snow J, Jenko KJ, Kimura N. et al. In vivo radioligand binding to translocator protein correlates with severity of Alzheimer's disease. Brain. 2013;136:2228-38
59. Varrone A, Oikonen V, Forsberg A, Joutsa J, Takano A, Solin O. et al. Positron emission tomography imaging of the 18-kDa translocator protein (TSPO) with [18F]FEMPA in Alzheimer's disease patients and control subjects. Eur J Nucl Med Mol Imaging. 2015;42:438-46
60. Clarke LE, Liddelow SA, Chakraborty C, Munch AE, Heiman M, Barres BA. Normal aging induces A1-like astrocyte reactivity. Proc Natl Acad Sci U S A. 2018;115:E1896-E905
61. Huang Y, Zhao Z, Wei X, Zheng Y, Yu J, Zheng J. et al. Long-term trihexyphenidyl exposure alters neuroimmune response and inflammation in aging rat: relevance to age and Alzheimer's disease. J Neuroinflammation. 2016;13:175
62. Perkins AE, Piazza MK, Deak T. Stereological Analysis of Microglia in Aged Male and Female Fischer 344 Rats in Socially Relevant Brain Regions. Neuroscience. 2018;377:40-52
63. Brendel M, Kleinberger G, Probst F, Jaworska A, Overhoff F, Blume T. et al. Increase of TREM2 during Aging of an Alzheimer's Disease Mouse Model Is Paralleled by Microglial Activation and Amyloidosis. Front Aging Neurosci. 2017;9:8
64. Liu B, Le KX, Park MA, Wang S, Belanger AP, Dubey S. et al. In vivo Detection of Age- and Disease-Related Increases in Neuroinflammation by 18F-GE180 TSPO MicroPET Imaging in Wild-Type and Alzheimer's Transgenic Mice. J Neurosci. 2015;35:15716-30
65. Gulyas B, Vas A, Toth M, Takano A, Varrone A, Cselenyi Z. et al. Age and disease related changes in the translocator protein (TSPO) system in the human brain: positron emission tomography measurements with [11C]vinpocetine. Neuroimage. 2011;56:1111-21
66. Paul S, Gallagher E, Liow JS, Mabins S, Henry K, Zoghbi SS. et al. Building a database for brain 18 kDa translocator protein imaged using [(11)C]PBR28 in healthy subjects. J Cereb Blood Flow Metab. 2019;39:1138-47
67. Heneka MT, Ramanathan M, Jacobs AH, Dumitrescu-Ozimek L, Bilkei-Gorzo A, Debeir T. et al. Locus ceruleus degeneration promotes Alzheimer pathogenesis in amyloid precursor protein 23 transgenic mice. J Neurosci. 2006;26:1343-54
68. Cosenza-Nashat M, Zhao ML, Suh HS, Morgan J, Natividad R, Morgello S. et al. Expression of the translocator protein of 18 kDa by microglia, macrophages and astrocytes based on immunohistochemical localization in abnormal human brain. Neuropathol Appl Neurobiol. 2009;35:306-28
69. Gulyas B, Makkai B, Kasa P, Gulya K, Bakota L, Varszegi S. et al. A comparative autoradiography study in post mortem whole hemisphere human brain slices taken from Alzheimer patients and age-matched controls using two radiolabelled DAA1106 analogues with high affinity to the peripheral benzodiazepine receptor (PBR) system. Neurochem Int. 2009;54:28-36
70. Haga S, Akai K, Ishii T. Demonstration of microglial cells in and around senile (neuritic) plaques in the Alzheimer brain. An immunohistochemical study using a novel monoclonal antibody. Acta Neuropathol. 1989;77:569-75
71. Rodriguez JJ, Noristani HN, Hilditch T, Olabarria M, Yeh CY, Witton J. et al. Increased densities of resting and activated microglia in the dentate gyrus follow senile plaque formation in the CA1 subfield of the hippocampus in the triple transgenic model of Alzheimer's disease. Neurosci Lett. 2013;552:129-34
72. Medawar E, Benway TA, Liu W, Hanan TA, Haslehurst P, James OT. et al. Effects of rising amyloidbeta levels on hippocampal synaptic transmission, microglial response and cognition in APPSwe/PSEN1M146V transgenic mice. EBioMedicine. 2019;39:422-35
73. Matarin M, Salih DA, Yasvoina M, Cummings DM, Guelfi S, Liu W. et al. A genome-wide gene-expression analysis and database in transgenic mice during development of amyloid or tau pathology. Cell Rep. 2015;10:633-44
74. Olabarria M, Noristani HN, Verkhratsky A, Rodriguez JJ. Concomitant astroglial atrophy and astrogliosis in a triple transgenic animal model of Alzheimer's disease. Glia. 2010;58:831-8
75. Verkhratsky A, Zorec R, Parpura V. Stratification of astrocytes in healthy and diseased brain. Brain Pathol. 2017;27:629-44
76. Verkhratsky A, Zorec R, Rodriguez JJ, Parpura V. Pathobiology of Neurodegeneration: The Role for Astroglia. Opera Med Physiol. 2016;1:13-22
77. Carter SF, Chiotis K, Nordberg A, Rodriguez-Vieitez E. Longitudinal association between astrocyte function and glucose metabolism in autosomal dominant Alzheimer's disease. Eur J Nucl Med Mol Imaging. 2019;46:348-56
78. Carter SF, Scholl M, Almkvist O, Wall A, Engler H, Langstrom B. et al. Evidence for astrocytosis in prodromal Alzheimer disease provided by 11C-deuterium-L-deprenyl: a multitracer PET paradigm combining 11C-Pittsburgh compound B and 18F-FDG. J Nucl Med. 2012;53:37-46
79. Rominger A, Brendel M, Burgold S, Keppler K, Baumann K, Xiong G. et al. Longitudinal assessment of cerebral beta-amyloid deposition in mice overexpressing Swedish mutant beta-amyloid precursor protein using 18F-florbetaben PET. J Nucl Med. 2013;54:1127-34
80. Brendel M, Jaworska A, Griessinger E, Rotzer C, Burgold S, Gildehaus FJ. et al. Cross-sectional comparison of small animal [18F]-florbetaben amyloid-PET between transgenic AD mouse models. PLoS One. 2015;10:e0116678
81. Kemppainen NM, Aalto S, Wilson IA, Nagren K, Helin S, Bruck A. et al. PET amyloid ligand [11C]PIB uptake is increased in mild cognitive impairment. Neurology. 2007;68:1603-6
82. Nordberg A, Carter SF, Rinne J, Drzezga A, Brooks DJ, Vandenberghe R. et al. A European multicentre PET study of fibrillar amyloid in Alzheimer's disease. Eur J Nucl Med Mol Imaging. 2013;40:104-14
83. Ghirardi O, Cozzolino R, Guaraldi D, Giuliani A. Within- and between-strain variability in longevity of inbred and outbred rats under the same environmental conditions. Exp Gerontol. 1995;30:485-94
84. He Z, Guo JL, McBride JD, Narasimhan S, Kim H, Changolkar L. et al. Amyloid-beta plaques enhance Alzheimer's brain tau-seeded pathologies by facilitating neuritic plaque tau aggregation. Nat Med. 2018;24:29-38
85. Lemoine L, Saint-Aubert L, Marutle A, Antoni G, Eriksson JP, Ghetti B. et al. Visualization of regional tau deposits using (3)H-THK5117 in Alzheimer brain tissue. Acta Neuropathol Commun. 2015;3:40
86. Leinonen V, Rauramaa T, Johansson J, Bottelbergs A, Tesseur I, van der Ark P. et al. S-[18F]THK-5117-PET and [11C]PIB-PET Imaging in Idiopathic Normal Pressure Hydrocephalus in Relation to Confirmed Amyloid-beta Plaques and Tau in Brain Biopsies. J Alzheimers Dis. 2018;64:171-9
87. Okamura N, Harada R, Ishiki A, Kikuchi A, Nakamura T, Kudo Y. The development and validation of tau PET tracers: current status and future directions. Clin Transl Imaging. 2018;6:305-16
88. Murugan NA, Chiotis K, Rodriguez-Vieitez E, Lemoine L, Agren H, Nordberg A. Cross-interaction of tau PET tracers with monoamine oxidase B: evidence from in silico modelling and in vivo imaging. Eur J Nucl Med Mol Imaging. 2019;46:1369-82
89. Kroth H, Oden F, Molette J, Schieferstein H, Capotosti F, Mueller A. et al. Discovery and preclinical characterization of [(18)F]PI-2620, a next-generation tau PET tracer for the assessment of tau pathology in Alzheimer's disease and other tauopathies. Eur J Nucl Med Mol Imaging. 2019;46:2178-89
90. Leuzy A, Chiotis K, Lemoine L, Gillberg PG, Almkvist O, Rodriguez-Vieitez E. et al. Tau PET imaging in neurodegenerative tauopathies-still a challenge. Mol Psychiatry. 2019;24:1112-34
91. Aguero C, Dhaynaut M, Normandin MD, Amaral AC, Guehl NJ, Neelamegam R. et al. Autoradiography validation of novel tau PET tracer [F-18]-MK-6240 on human postmortem brain tissue. Acta Neuropathol Commun. 2019;7:37
92. Malm TM, Iivonen H, Goldsteins G, Keksa-Goldsteine V, Ahtoniemi T, Kanninen K. et al. Pyrrolidine dithiocarbamate activates Akt and improves spatial learning in APP/PS1 mice without affecting beta-amyloid burden. J Neurosci. 2007;27:3712-21
93. Flood DG, Lin YG, Lang DM, Trusko SP, Hirsch JD, Savage MJ. et al. A transgenic rat model of Alzheimer's disease with extracellular Abeta deposition. Neurobiol Aging. 2009;30:1078-90
94. Leon WC, Canneva F, Partridge V, Allard S, Ferretti MT, DeWilde A. et al. A novel transgenic rat model with a full Alzheimer's-like amyloid pathology displays pre-plaque intracellular amyloid-beta-associated cognitive impairment. J Alzheimers Dis. 2010;20:113-26
95. Leplus A, Lauritzen I, Melon C, Kerkerian-Le Goff L, Fontaine D, Checler F. Chronic fornix deep brain stimulation in a transgenic Alzheimer's rat model reduces amyloid burden, inflammation, and neuronal loss. Brain Struct Funct. 2019;224:363-72
96. Voorhees JR, Remy MT, Cintron-Perez CJ, El Rassi E, Khan MZ, Dutca LM. et al. (-)-P7C3-S243 Protects a Rat Model of Alzheimer's Disease From Neuropsychiatric Deficits and Neurodegeneration Without Altering Amyloid Deposition or Reactive Glia. Biol Psychiatry. 2018;84:488-98
97. Tudela R, Munoz-Moreno E, Sala-Llonch R, Lopez-Gil X, Soria G. Resting State Networks in the TgF344-AD Rat Model of Alzheimer's Disease Are Altered From Early Stages. Front Aging Neurosci. 2019;11:213
98. Coughlin JM, Du Y, Rosenthal HB, Slania S, Min Koo S, Park A. et al. The distribution of the alpha7 nicotinic acetylcholine receptor in healthy aging: An in vivo positron emission tomography study with [(18)F]ASEM. Neuroimage. 2018;165:118-24
99. Paxinos G, Watson C. The Rat Brain in Stereotaxic Coordinates. 7 ed: Academic Press. 2014
100. Court J, Martin-Ruiz C, Piggott M, Spurden D, Griffiths M, Perry E. Nicotinic receptor abnormalities in Alzheimer's disease. Biol Psychiatry. 2001;49:175-84
101. Perry EK, Martin-Ruiz CM, Court JA. Nicotinic receptor subtypes in human brain related to aging and dementia. Alcohol. 2001;24:63-8
102. Schmaljohann J, Minnerop M, Karwath P, Gundisch D, Falkai P, Guhlke S. et al. Imaging of central nAChReceptors with 2-[18F]F-A85380: optimized synthesis and in vitro evaluation in Alzheimer's disease. Appl Radiat Isot. 2004;61:1235-40
103. Selden N, Geula C, Hersh L, Mesulam MM. Human striatum: chemoarchitecture of the caudate nucleus, putamen and ventral striatum in health and Alzheimer's disease. Neuroscience. 1994;60:621-36
104. Sultzer DL, Melrose RJ, Riskin-Jones H, Narvaez TA, Veliz J, Ando TK. et al. Cholinergic Receptor Binding in Alzheimer Disease and Healthy Aging: Assessment In vivo with Positron Emission Tomography Imaging. Am J Geriatr Psychiatry. 2017;25:342-53
105. Bertrand D, Terry AV Jr. The wonderland of neuronal nicotinic acetylcholine receptors. Biochem Pharmacol. 2018;151:214-25
106. Ma KG, Qian YH. Alpha 7 nicotinic acetylcholine receptor and its effects on Alzheimer's disease. Neuropeptides. 2019;73:96-106
107. Valles AS, Borroni MV, Barrantes FJ. Targeting brain alpha7 nicotinic acetylcholine receptors in Alzheimer's disease: rationale and current status. CNS Drugs. 2014;28:975-87
108. Ramos A, Berton O, Mormede P, Chaouloff F. A multiple-test study of anxiety-related behaviours in six inbred rat strains. Behav Brain Res. 1997;85:57-69
109. Voorhees JR, Remy MT, Erickson CM, Dutca LM, Brat DJ, Pieper AA. Occupational-like organophosphate exposure disrupts microglia and accelerates deficits in a rat model of Alzheimer's disease. NPJ Aging Mech Dis. 2019;5:3
110. Wu C, Yang L, Li Y, Dong Y, Yang B, Tucker LD. et al. Effects of Exercise Training on Anxious-Depressive-like Behavior in Alzheimer Rat. Med Sci Sports Exerc. 2020;52:1456-69
111. Bert B, Fink H, Huston JP, Voits M. Fischer 344 and wistar rats differ in anxiety and habituation but not in water maze performance. Neurobiol Learn Mem. 2002;78:11-22
112. Urenjak J, Williams SR, Gadian DG, Noble M. Specific expression of N-acetylaspartate in neurons, oligodendrocyte-type-2 astrocyte progenitors, and immature oligodendrocytes in vitro. J Neurochem. 1992;59:55-61
113. Bates TE, Strangward M, Keelan J, Davey GP, Munro PM, Clark JB. Inhibition of N-acetylaspartate production: implications for 1H MRS studies in vivo. Neuroreport. 1996;7:1397-400
114. Tsai G, Coyle JT. N-acetylaspartate in neuropsychiatric disorders. Prog Neurobiol. 1995;46:531-40
115. Baslow MH, Suckow RF, Gaynor K, Bhakoo KK, Marks N, Saito M. et al. Brain damage results in down-regulation of N-acetylaspartate as a neuronal osmolyte. Neuromolecular Med. 2003;3:95-104
116. Murray ME, Przybelski SA, Lesnick TG, Liesinger AM, Spychalla A, Zhang B. et al. Early Alzheimer's disease neuropathology detected by proton MR spectroscopy. J Neurosci. 2014;34:16247-55
117. Kantarci K. 1H magnetic resonance spectroscopy in dementia. Br J Radiol. 2007 80 Spec No 2: S146-52
118. Shinno H, Inagaki T, Miyaoka T, Okazaki S, Kawamukai T, Utani E. et al. A decrease in N-acetylaspartate and an increase in myoinositol in the anterior cingulate gyrus are associated with behavioral and psychological symptoms in Alzheimer's disease. J Neurol Sci. 2007;260:132-8
119. Shiino A, Watanabe T, Shirakashi Y, Kotani E, Yoshimura M, Morikawa S. et al. The profile of hippocampal metabolites differs between Alzheimer's disease and subcortical ischemic vascular dementia, as measured by proton magnetic resonance spectroscopy. J Cereb Blood Flow Metab. 2012;32:805-15
120. Foy CM, Daly EM, Glover A, O'Gorman R, Simmons A, Murphy DG. et al. Hippocampal proton MR spectroscopy in early Alzheimer's disease and mild cognitive impairment. Brain topography. 2011;24:316-22
121. Watanabe T, Shiino A, Akiguchi I. Absolute quantification in proton magnetic resonance spectroscopy is superior to relative ratio to discriminate Alzheimer's disease from Binswanger's disease. Dement Geriatr Cogn Disord. 2008;26:89-100
122. Rose SE, de Zubicaray GI, Wang D, Galloway GJ, Chalk JB, Eagle SC. et al. A 1H MRS study of probable Alzheimer's disease and normal aging: implications for longitudinal monitoring of dementia progression. Magn Reson Imaging. 1999;17:291-9
123. Targosz-Gajniak MG, Siuda JS, Wicher MM, Banasik TJ, Bujak MA, Augusciak-Duma AM. et al. Magnetic resonance spectroscopy as a predictor of conversion of mild cognitive impairment to dementia. J Neurol Sci. 2013;335:58-63
124. Marjanska M, Curran GL, Wengenack TM, Henry PG, Bliss RL, Poduslo JF. et al. Monitoring disease progression in transgenic mouse models of Alzheimer's disease with proton magnetic resonance spectroscopy. Proc Natl Acad Sci U S A. 2005;102:11906-10
125. Jack CR Jr, Marjanska M, Wengenack TM, Reyes DA, Curran GL, Lin J. et al. Magnetic resonance imaging of Alzheimer's pathology in the brains of living transgenic mice: a new tool in Alzheimer's disease research. Neuroscientist. 2007;13:38-48
126. Chen SQ, Cai Q, Shen YY, Wang PJ, Teng GJ, Zhang W. et al. Age-related changes in brain metabolites and cognitive function in APP/PS1 transgenic mice. Behav Brain Res. 2012;235:1-6
127. Oberg J, Spenger C, Wang FH, Andersson A, Westman E, Skoglund P. et al. Age related changes in brain metabolites observed by 1H MRS in APP/PS1 mice. Neurobiol Aging. 2008;29:1423-33
128. Nilsen LH, Melo TM, Witter MP, Sonnewald U. Early differences in dorsal hippocampal metabolite levels in males but not females in a transgenic rat model of Alzheimer's disease. Neurochem Res. 2014;39:305-12
129. Nilsen LH, Melo TM, Saether O, Witter MP, Sonnewald U. Altered neurochemical profile in the McGill-R-Thy1-APP rat model of Alzheimer's disease: a longitudinal in vivo 1 H MRS study. J Neurochem. 2012;123:532-41
130. Esteras N, Alquezar C, Bartolome F, Antequera D, Barrios L, Carro E. et al. Systematic evaluation of magnetic resonance imaging and spectroscopy techniques for imaging a transgenic model of Alzheimer's disease (AbetaPP/PS1). J Alzheimers Dis. 2012;30:337-53
131. Forster D, Davies K, Williams S. Magnetic resonance spectroscopy in vivo of neurochemicals in a transgenic model of Alzheimer's disease: a longitudinal study of metabolites, relaxation time, and behavioral analysis in TASTPM and wild-type mice. Magn Reson Med. 2013;69:944-55
132. Jope RS. High affinity choline transport and acetylCoA production in brain and their roles in the regulation of acetylcholine synthesis. Brain Res. 1979;180:313-44
133. Bhakoo KK, Williams SR, Florian CL, Land H, Noble MD. Immortalization and transformation are associated with specific alterations in choline metabolism. Cancer Res. 1996;56:4630-5
134. Brand A, Richter-Landsberg C, Leibfritz D. Multinuclear NMR studies on the energy metabolism of glial and neuronal cells. Dev Neurosci. 1993;15:289-98
135. Ripps H, Shen W. Review: taurine: a "very essential" amino acid. Mol Vis. 2012;18:2673-86
136. Lima L, Obregon F, Cubillos S, Fazzino F, Jaimes I. Taurine as a micronutrient in development and regeneration of the central nervous system. Nutr Neurosci. 2001;4:439-43
137. Chen C, Xia S, He J, Lu G, Xie Z, Han H. Roles of taurine in cognitive function of physiology, pathologies and toxication. Life Sci. 2019;231:116584
138. Oja SS, Saransaari P. Significance of Taurine in the Brain. Adv Exp Med Biol. 2017 975 Pt 1: 89-94
139. Louzada PR, Paula Lima AC, Mendonca-Silva DL, Noel F, De Mello FG, Ferreira ST. Taurine prevents the neurotoxicity of beta-amyloid and glutamate receptor agonists: activation of GABA receptors and possible implications for Alzheimer's disease and other neurological disorders. FASEB J. 2004;18:511-8
140. Ding XQ, Maudsley AA, Sabati M, Sheriff S, Schmitz B, Schutze M. et al. Physiological neuronal decline in healthy aging human brain - An in vivo study with MRI and short echo-time whole-brain (1)H MR spectroscopic imaging. Neuroimage. 2016;137:45-51
141. Angelie E, Bonmartin A, Boudraa A, Gonnaud PM, Mallet JJ, Sappey-Marinier D. Regional differences and metabolic changes in normal aging of the human brain: proton MR spectroscopic imaging study. AJNR Am J Neuroradiol. 2001;22:119-27
142. Stefan D, Cesare FD, Andrasescu A, Popa E, Lazariev A, Vescovo E. et al. Quantitation of magnetic resonance spectroscopy signals: the jMRUI software package. Measurement Science and Technology. 2009;20:104035
Author contact
![]() Corresponding author: Dr Hervé Boutin, Wolfson Molecular Imaging Centre, 27 Palatine Road, Manchester, M20 3LJ, UK. E-mail: herve.boutinac.uk; Tel: +44 161 275 0078; Fax: +44 161 275 0003.
Corresponding author: Dr Hervé Boutin, Wolfson Molecular Imaging Centre, 27 Palatine Road, Manchester, M20 3LJ, UK. E-mail: herve.boutinac.uk; Tel: +44 161 275 0078; Fax: +44 161 275 0003.