Impact Factor
- Issue 14; 2026
- Issue 13; 2026
- Issue 12; 2026
- Issue 11; 2026
- Issue 10; 2026
- Volume 16; 2026
- Advance Articles
- Past Issues
- Cover Images
- Cover Suggestion
- Index & Coverage
- Special Issues
Introduction
Methods
Results
Discussion and Conclusions
Abbreviations
Supplementary Material
Acknowledgements
References
International Journal of Biological Sciences
International Journal of Medical Sciences
 Global reach, higher impact

Theranostics 2021; 11(14):6966-6982. doi:10.7150/thno.59096 This issue Cite
Research Paper
Improving the sensitivity of T1 contrast-enhanced MRI and sensitive diagnosing tumors with ultralow doses of MnO octahedrons
Lijiao Yang1#, Lili Wang2#, Guoming Huang1, Xuan Zhang1, Lanlan Chen1 ![]() , Ao Li3, Jinhao Gao3
, Ao Li3, Jinhao Gao3 ![]() , Zijian Zhou4, Lichao Su1, Huanghao Yang1, Jibin Song1
, Zijian Zhou4, Lichao Su1, Huanghao Yang1, Jibin Song1 ![]()
1. MOE Key Laboratory for Analytical Science of Food Safety and Biology, College of Chemistry, Fuzhou University, Fuzhou 350108, China.
2. Department of Diagnostic Radiology, Fujian Medical University Union Hospital, Fuzhou 350001, P. R. China.
3. State Key Laboratory of Physical Chemistry of Solid Surfaces, The MOE Laboratory of Spectrochemical Analysis & Instrumentation, and Department of Chemical Biology, College of Chemistry and Chemical Engineering, Xiamen University, Xiamen 361005, China.
4. State Key Laboratory of Molecular Vaccinology and Molecular Diagnosis & Center for Molecular Imaging and Translational Medicine, School of Public Health, Xiamen University, Xiamen 361102, China.
#These authors contributed equally to this work.
Received 2021-2-5; Accepted 2021-3-20; Published 2021-5-8
Abstract

Rationale: Sensitive and accurate imaging of cancer is essential for early diagnosis and appropriate treatment. For generally employed magnetic resonance imaging (MRI) in clinic, comprehending how to enhance the contrast effect of T1 imaging is crucial for improving the sensitivity of cancer diagnosis. However, there is no study ever to reveal the clear mechanism of how to enhance the effect of T1 imaging and accurate relationships of influencing factors. Herein, this study aims to figure out key factors that affect the sensitivity of T1 contrast-enhanced MRI (CE-MRI), thereby to realize sensitive detection of tumors with low dose of CAs.
Methods: Manganese oxide (MnO) nanoparticles (NPs) with various sizes and shapes were prepared by thermal decomposition. Factors impacting T1 CE-MRI were investigated from geometric volume, surface area, crystal face to r2/r1 ratio. T1 CE-MR imaging of liver, hepatic and subcutaneous tumors were conducted with MnO NPs of different shapes.
Results: The surface area and occupancy rate of manganese ions have positive impacts on the sensitivity of T1 CE-MRI, while volume and r2/r1 ratio have negative effects. MnO octahedrons have a high r1 value of 20.07 mM-1s-1 and exhibit an excellent enhanced effect in liver T1 imaging. ZDS coating facilitates tumor accumulation and cellular uptake, hepatic and subcutaneous tumors could be detected with MnO octahedrons at an ultralow dose of 0.4 mg [Mn]/kg, about 1/10 of clinical dose.
Conclusions: This work is the first quantitative study of key factors affecting the sensitivity of T1 CE-MRI of MnO nanoparticles, which can serve as a guidance for rational design of high-performance positive MRI contrast agents. Moreover, these MnO octahedrons can detect hepatic and subcutaneous tumors with an ultralow dose, hold great potential for sensitive and accurate diagnosis of cancer with lower cost, less dosages and side effects in clinic.
Keywords: factors affecting T1 CE-MRI, sensitive tumor imaging, zwitterionic ZDS coating, ultralow dose, MnO octahedrons
Introduction
The sensitive imaging of tumors is vital for early diagnosis, appropriate treatment and accurate prognosis. Among various clinical diagnostic techniques, magnetic resonance imaging (MRI) has been generally employed due to its noninvasive feature, exquisite soft tissue contrast, unlimited tissue penetration depth and high spatial resolution [1-3]. Compared with T2-weighted MRI, T1 imaging has obvious advantages because positive signals can avoid confusion in recognizing lesions from normal hypointense tissues [4, 5], and the interference caused by calcification, blood pooling and metal deposition [6]. Sensitive diagnosis in T1 imaging in clinic usually requires the utilization of contrast agents (CAs), which can effectively shorten the local spin-lattice relaxation time of protons, and thus raise the longitudinal relaxation rate of water molecules in their vicinity, resulting in greater contrast between different biological tissues [7].
T1 CAs primarily consist of paramagnetic metal based chelates and nanoparticles (NPs), such as gadolinium-based CAs [8, 9], manganese-based CAs [10, 11] and ultrasmall iron oxide NPs [12, 13]. Among them, gadolinium-based chelates were associated with a devastating and latent fatal condition called nephrogenic systemic fibrosis (NSF) [14], the onset of NSF occurs months after the last administration in patients with poor kidney function. Meanwhile, the US Food and Drug Administration (FDA) disclosed that the use of gadolinium-based CAs would induce gadolinium deposition in the brain or bone [15, 16]. On the other hand, ultrasmall iron oxide NPs as T1 CAs attract lots of attention due to their suppressed magnetization by the strong surface spin-canting effect [17, 18]. There are also many excellent surface ligand modifications, such as phosphoric acid anchoring group, carboxyl anchoring group, and catechol anchoring group can can avoid the dissolution and oxidation of ultrasmall iron oxide NPs into Fe ions in biological media [19-21]. However, ultrasmall iron oxide NPs are usually ultrasmall spheres and not easy for further shape engineering and investigating. By contrast, manganese-based NPs with high stability and relatively good biocompatibility are extensively employed in T1 imaging in MRI [22-26].
Though numerous nanomaterials have been broadly developed for improving the sensitivity of in vitro and in vivo T1 imaging, the clear mechanism of how to enhance the effect of T1 imaging is still unresolved. The Solomon, Bloembergen, and Morgan (SBM) theory elucidates the mechanism of relaxation for metal chelates [27-30]. But for nanomaterials, it would be inapplicable to employ this theory because of the complexity of surface structure and the uncertainty in chemical coordination. Previous research mainly focused on particular aspects of T1 CAs, e.g., size and surface structure [31-33], or based on an ideal solid model without sophisticated deep sunken structures and a complicated system with the random position of two metals in some space lattice [34]. In addition, they all only qualitatively studied these influencing factors, the accurate relationship among them still needs to be further explored. Therefore, it is urgent to establish a systematic and comprehensive mechanism for understanding crucial factors that affect T1 contrast-enhanced (CE) effect for magnetic nanomaterials, thereby improves the sensitivity of T1 imaging.
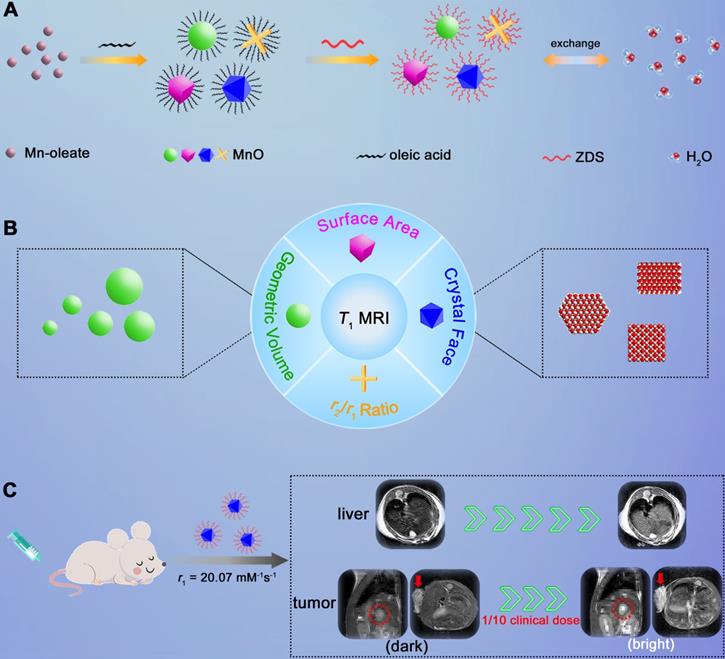
Herein, we adopted manganese oxide (MnO), a pervasively applied agent, as research subject and investigated elements that impact T1 enhanced effect (Scheme 1). We prepared MnO NPs with different sizes (11-25 nm) and shapes (sphere, cube, octahedron and cross). For given nanomaterials, besides the surface modification reported, factors that affect the contrast effect of T1 imaging include geometric volume, surface area, crystal face and r2/r1 ratio. These factors can influence the intensity of paramagnetic ions on exposed surfaces and the effective chemical exchange of water protons with surface paramagnetic ions. High occupancy rate of metal ions on exposed crystal surface and large surface area would lead to high longitudinal relaxivity rate, while large geometric volume results in low T1 relaxation rate and high r2/r1 ratio has negative effect on T1 contrast effect. Moreover, it is noteworthy that MnO NPs with octahedron shape have a markedly high r1 value of 20.07 mM-1s-1 and a low r2/r1 ratio of 1.94, which endows strong contrast effects in in vitro and liver imaging. Meanwhile, with zwitterionic ZDS coating, these octahedrons exhibited strong signal enhancement in hepatic and subcutaneous tumor imaging at an ultralow dose of only 0.4 mg/kg, possessing great potential in sensitive and precise diagnosis in cancer.
Schematic illustration of investigating factors that affect the sensitivity of T1 imaging. (A) Preparation of ZDS modified MnO NPs with different shapes (sphere, cube, octahedron and cross), and the proton exchange of NPs with surrounding water molecules. (B) Factors that impact the contrast effect of T1 imaging: geometric volume, surface area, crystal face and r2/r1 ratio. (C) Significant in vivo liver imaging enhancement after intravenously injecting MnO octahedrons with a high r1 value of 20.07 mM-1s-1, and sensitive contrast-enhanced MRI of hepatic and subcutaneous tumors with intravenous injection of MnO octahedrons at 1/10 of clinical dose.
Methods
Materials and characterization
Manganese chloride tetrahydrate (99%), oleic acid (tech, 90%) and 1-Octadecene (tech, 90%) were purchased from Sigma-Aldrich (USA). Sodium oleate was purchased from Sinopharm Chemical Reagent Co., Ltd. All reagents were used without further purification.
Transmission electron microscopy (TEM) and the related high-resolution TEM (HRTEM) images were performed on a FEI Tecnai G2 F20 microscope (accelerating voltage, 200 kV) and a Hitachi HT7700 Exalens microscope (accelerating voltage, 120 kV). The X-ray powder diffraction (XRD) patterns of the nanoparticles were acquired on a D/MAX-Ultima VI X-ray powder diffractometer (Rigaku Co., Japan). The X-ray absorption spectra (XPS) were conducted at an Escalab 250Xi X-ray photoelectron spectrometer (Thermo Scientific). The hysteresis loops at 300 K were recorded by the superconducting quantum interference device (SQUID). Dynamic light scattering (DLS) were measured by Zetasizer Nano ZS (Malvern Instruments Ltd., England). The measurement of relaxivity and phantom imaging at 0.5 T were all performed on an NMI20-Analyst system. In vivo MRI were performed on 7 T micro MRI System. The concentrations of metals were measured by inductively coupled plasma mass spectroscopy (ICP-MS) on an iCAP RQ system (Thermo Fisher).
Synthesis of manganese oleate complexes
The manganese oleate complexes were synthesized by reacting manganese chlorides and sodium oleate following the typical method. 0.629 g (5 mmol) manganese chloride and 3.044 g (10 mmol) sodium oleate were mixed in 20 mL ethanol and 20 mL distilled water. The solution was heated to 70 °C and maintained for 4 h with stirring under N2 atmosphere. Then the upper layer containing manganese oleate (pink waxy) was separated. Hexane was added and then the solution was washed by water three times. After vaporizing hexane, the manganese oleate was dissolved in 1-octadecene and sealed to avoid oxidation.
Preparation of MnO nanoparticles
We used a one-pot synthesis method to produce MnO NPs with different shapes and sizes. We strictly controlled the amount of oleic acid, sodium oleate, heated temperature and the reflux time. For spheres, 0.618 g (1 mmol) manganese oleate and 0.161 mL (0.5 mmol) oleic acid were mixed in 10 mL of 1-octadecene. The solution was first heated at 100 ºC for 20 min in vacuum to remove impurities with low boiling points in air and solvent. Then the solution was slowly heated, maintained at 200-250 °C for 30 min, and then refluxed at 320 °C in a N2 atmosphere before cooling to room temperature. The refluxing time was 1 h, 1.5 h, 2 h, 2.5 h and 3 h for spheres of 11 nm, 15 nm, 19 nm, 22 nm and 25 nm, respectively. For cubes, 0.618 g manganese oleate and 0.161 mL oleic acid were mixed in 15 mL of 1-octadecene. After removing impurities at 100 ºC, the solution was heated to 330 °C rapidly and maintained at this temperature for 2 h in N2. For octahedrons, 0.618 g manganese oleate, 0.061 mg sodium oleate and 0.161 mL oleic acid were mixed in 12 mL of 1-octadecene. After removing impurities, the solution was heated to 350 °C rapidly and refluxed for 1.5 h in N2. For cross, 0.618 g manganese oleate and 0.322 mL oleic acid were mixed in 15 mL of 1-octadecene with the adding of 0.152 mg sodium oleate. Then the solution was heated to 300 °C with a constant heating rate of 5 °C min-1 and refluxed for 4 h in N2. After the solution was cooled down to room temperature, all the products were separated by centrifugation, washed with ethanol for three times and dispersed in hexane for further use.
Synthesis of zwitterionic dopamine sulfonate (ZDS)
Firstly, 6 mmol dopamine hydrochloride was dissolved in 150 mL ethanol. After slowly adding 6.5 mmol of 1,3-propanesultone and 3 mmol of ammonium hydroxide (28% in water) under N2 atmosphere, the resulting solution was heated at 50 °C for 18 h. Then the dopamine sulfonate was yielded by collecting the white precipitate and washing with ethanol for three times. Afterward, 1 mmol of dopamine sulfonate and 2.4 mmol of anhydrous sodium carbonate were dissolved in 150 mL dimethylformamide (DMF) with the adding of 35 mmol of iodomethane in N2. The resulting solution was heated to 50 °C and stirred at that temperature for 8 h to obtain a yellow oily mixture after removal of DMF in vacuum. After adding 50 mL DMF/Ethyl acetate (1:10 v/v), a pale crude solid was precipitated. Finally, a white solid (ZDS) was acquired by washing with 50 mL refluxing DMF/acetone (1:10 v/v) for three times.
Preparation of water soluble ZDS coated nanoparticles
4 mL hexane containing about 10 mg as-prepared MnO NPs, 4 mL acetone, 2 mL deionized water and 10 mg zwitterionic dopamine sulfonate (ZDS) was mixed in a nitrogen atmosphere. The resulting solution was stirred at room temperature for 4 h to undergo a ligand exchange process. Then the ZDS coated NPs were collected by centrifugation, dispersed in deionized water and stored at 4 °C for further use.
Cytotoxicity evaluation
3-(4,5-dimethylthiazol-2-y1)-2,5-diphenyltetrazolium bromide (MTT) assays was used to evaluate the cytotoxicity of ZDS coated MnO NPs of different shapes and sizes with SMMC-7721 cells. Cells were first seeded into a 96-well plate in RPMI 1640/DMEM at a density of 1 × 10⁴ cells/well and incubated at 37 °C under 5% CO2 overnight. Cells were incubated with ZDS coated MnO NPs for 24 h at different [Mn] concentrations. (0.469, 0.938, 1.875, 3.75, 7.5, 15, 30, 60, and 120 μg/mL). After adding each well with 100 μL fresh media containing 0.5 μg/mL MTT, cells were further incubated at 37 °C for 4 h. The OD492 value (Abs.) of each well was immediately obtained from MultiSkan FC microplate reader and accordingly the cell viability was calculated.
T1 and T2 relaxivities measurements and T1- and T2-weighted phantom images
The T1/T2 relaxation times and T1 phantom images were conducted on a 0.5 T NMI20-Analyst NMR system. T1 phantom images were acquired with MnO NPs with different manganese concentrations of 0.4, 0.2, 0.1, 0.05, 0.025 mM and 0 mM (water). The r1 and r2 values were calculated from the slopes of the best fitting lines of 1/T versus concentration. T1- and T2-weighted phantom images were obtained with a 2D multislice spin-echo (MSE) sequence: TR/TE = 200/2 ms (T1), TR/TE = 2000/40 ms (T2), 512 × 512 matrices.
In vivo liver MR imaging
In vivo T1 imaging of liver was carried out with male BALB/c mice (18-22 g, purchased from Shanghai SLAC Laboratory Animal Co., Ltd) as the model on a 7 T MRI system. All animal experiments were performed in accordance to the protocol approved by the Institutional Animal Care and Use Committee of Fuzhou University and the guide for the care and use of laboratory animals (Ministry of Science and Technology of China, 2006). The images of the liver in the transverse plane at 0 h (Pre-injection), 0.5 h, 1 h, 2 h, and 4 h were attained after intravenous injection of MnO NPs with a dose of 2.0 mg [Mn]/kg (n = 3/group). Parameters of fSEMS sequence: TR/TE = 500/12 ms, FOV = 40 × 40 mm, thickness = 1 mm, average = 4. Signal-to-noise ratio (SNR) was calculated by the equation: SNRliver = SIliver/SDnoise, where SI means signal intensity and SD represents standard deviation. The SNR change (∆SNR) was defined as ∆SNR = |SNRpost - SNRpre|/SNRpre.
In vivo hepatic tumors MRI
All animal experiments were conducted according to the protocol approved by Institutional Animal Care and Use Committee of Fuzhou University. The mice were inoculated with an injection of 3-5 × 10⁵ H22 cells in the liver. Two weeks later, the MR images of hepatic tumors in the sagittal plane were obtained at 0, 1, 2 and 4 h after intravenous injection of MnO octahedrons with a dose of 1.0 mg [Mn]/kg and 0.4 mg [Mn]/kg, and MnO cross at a dose of 2.0 mg [Mn]/kg, and Mn-DPDP with an injection dose of 4.0 mg [Mn]/kg, respectively (n = 3/group). The parameters of imaging were TR/TE = 400/10 ms, thickness = 1.5 mm, and slice = 8. The contrast-to-noise ratio (CNR) changes of tumor is defined as CNR = (SNRtumor - SNRliver) /SNRtumor.
Subcutaneous tumors MR imaging
The subcutaneous tumor model of BALB/c mouse was established by injection of 5 × 10⁶ H22 cells to the subcutaneous tissue. MR images of tumor at the transverse plane at 0 h and 2 h were acquired after intravenously injecting MnO Octahedrons with a dose of 0.4 mg [Mn]/kg, MnO cross with a dose of 2.0 mg [Mn]/kg, and Mn-DPDP at a dose of 4.0 mg [Mn]/kg (n = 3/group). Parameters of scanning sequence: TR/TE = 500/12 ms, FOV = 40 × 40 mm, thickness = 1 mm, 256 × 256 matrices. SNR was calculated by the equation: SNRtumor = SItumor/SDnoise. The contrast-to-noise ratio (CNR) changes of tumor is defined as CNR = (SNRtumor - SNRliver) /SNRtumor. All the experiments were carried out in accordance with the protocol approved by Institutional Animal Care and Use Committee of Fuzhou University.
Statistical analysis
The statistical difference was evaluated with Student's t test. The sizes of nanoparticles were acquired by measuring at least two hundred particles per sample via Image J. All data were presented as mean ± standard deviation.
Results
Synthesis and characterization of MnO NPs with different shapes
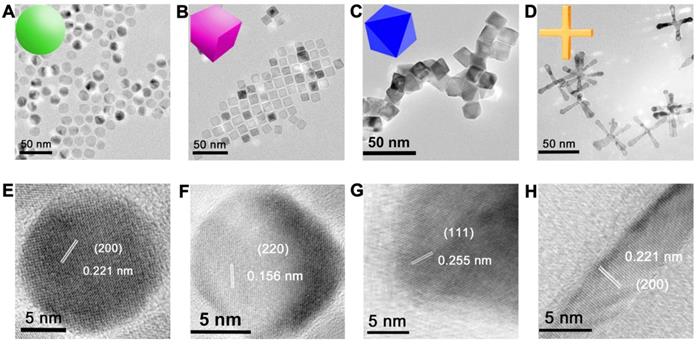
We prepared MnO NPs using a modified one-pot synthesis method [35] by thermal decomposition of manganese oleate as precursor and oleic acid as surfactant in 1-octadecene solvent. MnO NPs with different sizes were fabricated by varying reflux time in procedural heating, MnO NPs with different shapes were prepared by controlling the reflux time and the amount of sodium oleate in different procedural heating (details see Method and Table S1). Transmission electron microscopy (TEM) images (Figure 1A-D and Figure S1) showed that all NPs of four shapes were uniform with high yields (>90%). They were spheres (actually polyhedrons, with a diameter of 15 nm), cubes (with a side length of 12 nm), octahedrons (with a side length of 16 nm) and cross (with a length of 50 nm and a diameter at bottom surface of 5 nm) (Figure S2). The high-resolution TEM (HRTEM) images (Figure 1E-H) showed clear lattice distances of 0.221 nm, 0.156 nm and 0.255 nm, which could be assigned to the (200), (220) and (111) facets of MnO, respectively. Spheres and cross are mainly exposed by plenty of small (200) facets, which are formed to minimize the total surface energy at relatively low temperature according to the previous report [36]. While at high temperature, octahedrons with large (111) face with high surface-energy ratio are generated, as high temperature provides sufficient energy for NPs to grow along the {100} surface [37, 38]. Cubes displayed an interplanar distance of 0.156 nm along the [100] zone axis, which could be ascribed to the (220) plane [39].
TEM and HRTEM images of monodispersed MnO NPs of different shapes with a similar geometrical volume. TEM images of (A) spheres (diameter of 15 nm), (B) cubes (side length of 12 nm), (C) octahedra (side length of 16 nm) and (D) cross (length of 50 nm, diameter of 5 nm). The numbers were averages calculated from two hundred nanoparticles for all samples via Image J analysis. (E-H) The corresponding HRTEM images with clear lattice distances of the above images.
The energy-dispersive X-ray (EDX) line scanning analysis and mapping image of the representative sphere (Figure 2A) confirmed that manganese ions were evenly distributed in MnO NPs. The diffraction peaks of X-ray powder diffraction (XRD) demonstrated the typical cubic structures (JCPDS no. 01-075-0625) of all four MnO samples (Figure 2B). The peaks at 35.10, 40.76, 59.01, 70.55, 74.19 and 88.29 are assigned to (111), (200), (220), (311), (222) and (400) planes of cubic MnO, respectively. Consistent with the XRD analysis, X-ray photoelectron spectroscopy (XPS) spectra (Figure 2C) showed clear peaks of Mn 2p3/2 at 640.33 eV, 640.36 eV, 640.34 eV and 640.43 eV for spheres, cubes, octahedrons and cross, respectively, indicating the existence of pure Mn(II) without Mn(III) in these MnO NPs [40]. The field-independent magnetization (M-H) curves (Figure 2D) affirmed that magnetic moments of four nanostructures exhibited linear trends with the applied magnetic fields at room temperature (300 K), indicating that all MnO performed typical paramagnetic behaviors owing to the existence of uncompensated spins on the surface of particle [41, 42].
Structure, Magnetism and Stability of MnO nanoparticles with different shapes. (A) Energy-dispersive X-ray (EDX) elemental line scanning analysis (inset, STEM-HAADF image and EDX mapping image). (B) X-ray powder diffraction (XRD) patterns of MnO nanoparticles with four different shapes. (C) The X-ray photoelectron spectroscopy (XPS) spectra analysis of MnO nanoparticles with different morphologies. (D) Field-dependent magnetization (M-H) curves (from -60000 to 60000 Oe) of MnO NPs with four different shapes at 300 K. (E) Hydrodynamic diameter analysis by dynamic light scattering (DLS) measurements after surface modification with ZDS. (F) The long-term (from 6 hours to 180 days) hydrodynamic diameters in PBS.
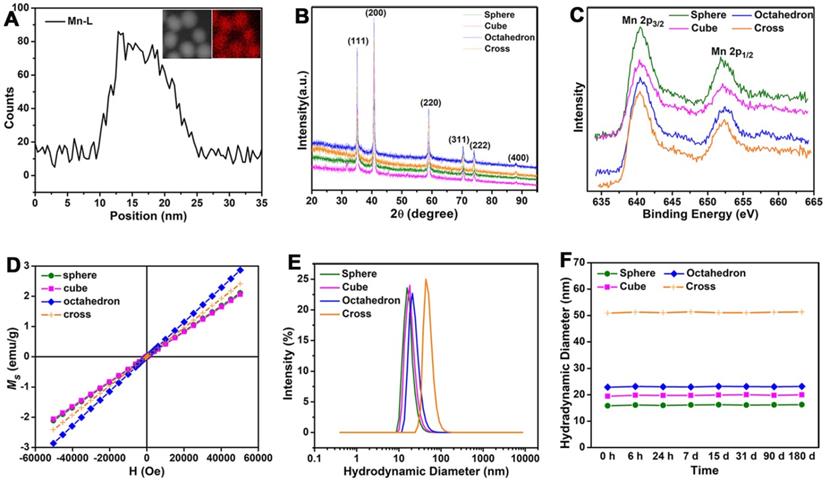
The majority of small molecule ligands only show certain positive or negative surface charge, which is unfavorable to the in vivo pharmacokinetics and T1 imaging of NPs. NPs with negatively charged surface face a limitation in the efficient theranostic response and appear to negatively affect the internalization of NPs, while positively charged NPs are easily cleared from blood circulation [43-45]. Therefore, we chose zwitterionic dopamine sulfonate (ZDS) with neutral charge as surface coating ligand for phase transfer. TEM images (Figure S3) and size distributions (Figure S4) of ZDS-coated MnO NPs with different shapes showed there is no change in their shapes and diameters after ZDS coating. Zeta potential analyses indicate that MnO nanoparticles with diverse shapes possess neutral surface charges in water (Figure S5). Dynamic light scattering (DLS) analysis (Figure 2E) confirmed that all MnO NPs after ZDS coating had narrow size distributions. The hydrated diameters (Figure S6) were 16.25 ± 1.92 nm, 19.98 ± 3.01 nm, 23.17 ± 2.38 nm and 51.34 ± 3.94 nm for spheres, cubes, octahedrons and cross, respectively. The polydispersity coefficient (PDI) (Table S2) corroborated that MnO NPs were stable in PBS solutions for more than six months. Moreover, the diameters of the particles in PBS (Figure 2F) barely changed for a long time, which attests the good stabilities of these ZDS coated MnO NPs.
Investigation on factors impacting T1 MR imaging
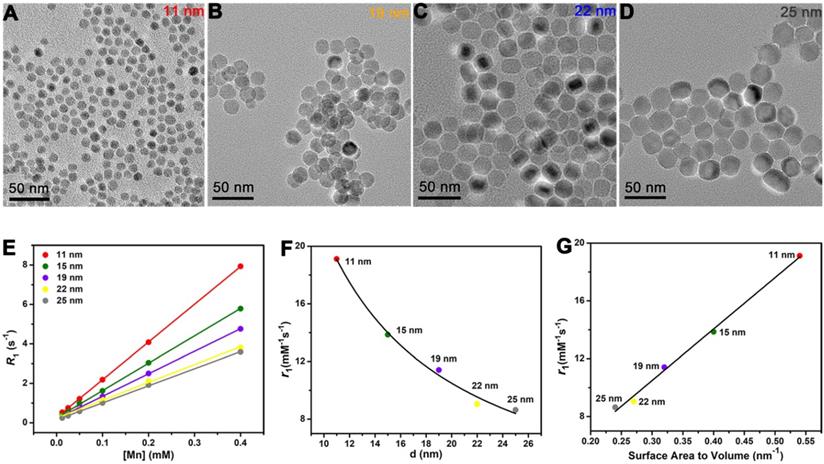
Size-dependent T1 relaxivity has been reported by previous studies [46], but the underlying mechanism behind this appearance is unclear. To avoid the shape effect, it needs NPs have the same surface structure and surface modification. Hence, besides the 15 nm sphere, we also prepared MnO spheres with other different sizes (Figure 3A-D). Their diameters were 11 nm, 19 nm, 22 nm and 25 nm (Figure S7). We then tested their T1 relaxivities on a 0.5 T MR scanner (Figure 3E). The r1 values of 11 nm, 15 nm, 19 nm, 22 nm and 25 nm were 19.12 ± 0.33, 13.86 ± 0.35, 11.41 ± 0.38, 9.05 ± 0.25 and 8.64 ± 0.34 mM-1s-1, respectively (Figure S8). Notably, the T1 relaxivity had a decreasing trend with the increase of the size. Thereupon, we analyzed their relationships between r1 values and diameters of these spheres. The T1 relaxivity is inversely proportional to the diameter, and the nonlinear correlation coefficient is 0.991 (Figure 3F), which indicates an outstanding nonlinear relationship. Coincidentally, for spheres, the diameter has a reciprocal relationship of the surface area to volume ratio. We then further investigated their relationships between r1 values and surface area to volume ratios (Table S3). Consists with the trends of diameters, their T1 relaxivities showed upward tendencies with their surface area to volume ratios (Figure 3G), and the palmary linear correlation coefficient is 0.994. This phenomenon could be attributed to the fact that the surface to volume ratio can reflect the relative intensity of paramagnetic ions on exposed surfaces. In principle, the T1 relaxation increasement is primarily related to the inner sphere regime that protons directly acquire effective chemical exchange with surface paramagnetic ions [47]. Thus, more paramagnetic ions are exposed on the surface with a higher surface to volume ratio, which leads to a higher T1 relaxivity enhancement.
The influences of diameter and surface area to volume ratio in T1 relaxivity. TEM images of monodispersed MnO spheres with different sizes: (A) 11 nm, (B) 19 nm, (C) 22 nm and (D) 25 nm. Scale bar, 50 nm. The diameters were obtained by measuring of at least two hundred particles per sample via Image J. (E) The analysis of longitudinal relaxation rate R1 (1/T1) of MnO spheres with 11 nm, 15 nm, 19 nm, 22 nm and 25 nm. T1 relaxivities were calculated from the slopes of the best-fit linear lines for experimental data. (F) The relationship of r1 value and diameter. The solid line is the fitting curve. (G) The linear relationship of r1 value and surface area to volume ratio.
For MnO NPs, the investigation of clear relationship between crystal surface and T1 relaxivity remains a great challenge in recent years, which probably due to strong metal-oxygen covalent binding and diverse crystal packing structures of NPs [48, 49]. In our work, MnO spheres, cubes, octahedrons and cross have different exposed crystal faces on the surface. Because of the various arrangements of atoms, the crystal face impacts the occupancy rate of effective metal ions on the surface. The (200), (220) and (111) crystal faces of MnO exhibit different occupancy rates of metal ions (Figure 4A-C). The number of ions is 2.00 Mn2+ and 2.00 O2- on the (200) face, 1.41 Mn2+ and 1.41 O2- on the (220) face, 2.31 Mn2+ on the (111) face, per a2 (a is the side length of the unit cell) (Figure S9 and Table S4). Considering O2- ion has no contribution to r1 value, the order for occupancy rate of effective metal on each face is (111) > (200) > (220). And the occupancy rates of effective manganese ions (n) on exposed surfaces of spheres, cubes, octahedrons, cross (Figure 4D) are 2.00, 1.41, 2.31 and 2.00 per a2, respectively. It is noteworthy that four MnO NPs of different shapes have a similar geometrical volume (Figure 4E), which are 1767, 1728, 1931 and 1865 nm3 for spheres, cubes, octahedrons and cross (Table S5), respectively. However, their surface areas (Figure 4F) are calculated to be 707, 864, 887 and 1492 nm2 for spheres, cubes, octahedrons and cross, respectively (Table S6). We then measured their T1 relaxation rates of these four samples with different shapes at 0.5 T (Figure 4G). The r1 values of spheres, cubes, octahedrons and cross were 13.86 ± 0.41, 12.44 ± 0.38, 20.07 ± 0.55 and 28.99 ± 0.64 mM-1s-1, respectively (Figure 4H).
The impacts of crystal face, surface area and geometric volume in T1 relaxivity. (A), (B) and (C) The exposed faces of (200), (220), and (111) of MnO NPs, they have different intensities of manganese ions on the surface. (D) The different occupancy rates of manganese (n Mn) on the surface, (E) similar geometric volumes, and (F) different surface areas of MnO nanoparticles with different shapes. The analysis of (G) longitudinal relaxation rate, R1 (1/T1) and (H) T1 relaxivities, the r1 values were obtained from the slopes of the linear lines. (I) The linear relationship of r1 value and nS/V (occupancy rate of manganese multiply by surface area and divided by volume).
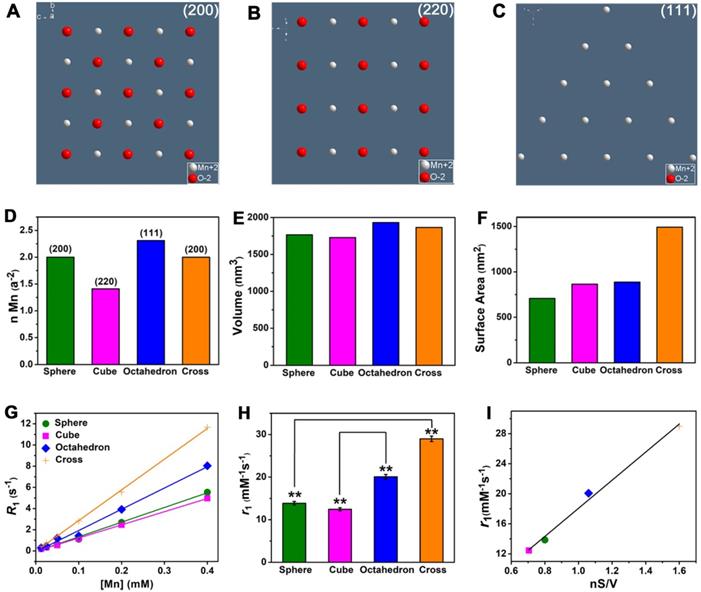
Since the ligand of surface modification is the same and the geometric volume is similar for these four MnO samples, their difference of r1 values could be ascribed to their different crystal structures or surface areas. For spheres and cross, they have the same (200) exposed crystal face, but they have entirely different r1 values. The r1 value of cross (28.99 mM-1s-1) is much higher than that of spheres (13.86 mM-1s-1), probably because of their different surface areas. The cross has a larger surface area (1492 nm2) than sphere (707 nm2) and shows a high r1 value, which indicates r1 value has a positive correlation with surface area. Additionally, we noticed that compared with spheres, the increase in r1 value (2.09 times) and the augment in surface area (2.11 times) of cross are almost the same. This result further suggests that T1 relaxivity has a positive proportional relationship with surface area. For cubes and octahedrons, they have similar surface areas (864 and 887 nm2) but distinct exposed crystal faces of (200) and (111). Cubes have an r1 value of 12.44 mM-1s-1, while octahedrons have a relatively high r1 value of 20.07 mM-1s-1. As previously mentioned, the occupancy rate of effective metal on (111) face (2.31 Mn2+ per a2) is higher than (220) face (1.41 Mn2+ per a2), which implies that the r1 value has a positive relationship with the occupancy rate of manganese ions. Similarly, we discovered that the addition in r1 value (1.61 times) and the augment in occupancy rate of manganese ions (1.64 times) of cross are nearly identical. Thus, we concluded that T1 relaxivity in direct proportion to occupancy rate of metal on the surface.
To verify our conclusions, we analyzed the relationships of occupancy rate of metal (n), surface area (S), geometric volume (V) and T1 relaxivity (r1) (Table S7). It is noted that r1 value is closely related to nS/V for these shapes, which certifies a good positive linear relationship with a coefficient of 0.990 (Figure 4I). In other words, r1 value is positively related to surface area and occupancy rate of effect metal ions but negatively related to geometric volume. A large surface area increases the total number of effective metal centers on the exposed surface. As a result, compared with sphere, cross with a larger surface area can provide more effective metal ions than sphere for chemical exchange with water protons, which accelerates the T1 relaxation process and thus shows a high r1 value. Analogously, compared with cubes, octahedrons exposed metal-rich crystal faces. The occupancy rate of manganese ions on the surface of octahedrons is much higher than that of cubes because crystal surface directly determines the amount of metal on the exposed surface of NPs [50]. It is well known that T1 CAs shorten the proton longitudinal relaxation time by accelerating the chemical exchange between effective metal ions on the surface of NPs and water molecules in the surrounding. Hence, octahedrons have high density of accessible metal ions and more coordination centers, which results in a fast exchange with water molecules and improve the T1 relaxivity. Above all, these results demonstrate that T1 relaxivity is closely affected by crystal face, surface area, geometric volume.
Theoretically, CAs are able to accelerate both T1 and T2 relaxation process of nearby water molecules and enhance T1 and T2 signals under an external magnetic field. Thus, the r2/r1 ratio is also an important factor to estimate the effect of T1 imaging. We performed T2 relaxivity tests of these four MnO NPs with different shapes at 0.5 T (Figure 5A). Their r2 values were 38.81 ± 1.41, 32.28 ± 1.55, 39.02 ± 1.28 and 147.6 ± 1.97 mM-1s-1 for spheres, cubes, octahedrons and cross, respectively (Figure 5B). The ranking of r2 values is consistent with the trend of size of NPs, that is, a higher r2 value is obtained with a larger size, which is consistent with previous reports [51, 52]. We then calculated r2/r1 ratios of these samples, they are 2.80, 2.59, 1.94 and 5.09 for spheres, cubes, octahedrons and cross, respectively (Table S8).
The effect of r2/r1 ratio on T1 CE-MR imaging. T2 relaxivity measurements of MnO nanoparticles of different shapes at 0.5 T: (A) Analysis of transverse relaxation rate R2 (1/T2) and (B) T2 relaxivities. The r2 values are acquired from the slopes of the best-fit lines. (C) The r2 to r1 ratios and T1 relaxivities for MnO nanoparticles with different shapes. (D) T1-weighted phantom images of MnO nanoparticles with four shapes at different concentrations.
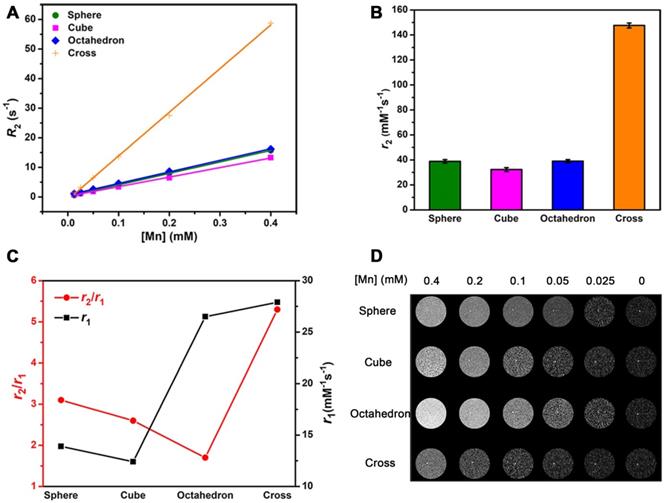
To get an intuitive sense, we studied their enhanced abilities for T1 imaging by showing their T2 relaxivities and r2/r1 ratios in one graph (Figure 5C). Spheres and cubes have moderate r1 values (13.86 and 12.44 mM-1s-1) and moderate r2/r1 ratios (2.80 and 2.59). Cross have the highest r1 value of 28.99 mM-1s-1 but a large r2/r1 ratio of 5.09. A high r2/r1 ratio is unfavorable for the effect of T1 imaging as a strong T2 enhanced effect would result in T2-dominated contrast. Therefore, though cross has the highest r1 value, their high r2/r1 ratio determines that they are not suitable for T1 imaging. In other words, the specific cross shape is favorable for T2 imaging. Particularly, octahedrons have a relatively high r1 value of 20.07 mM-1s-1 and a low r2/r1 ratio of 1.94, which suggests they could be a prominent agent for enhanced T1 imaging.
The results of T1-weighted phantom imaging (Figure 5D) further confirmed our above analysis. There was an increase of signal intensity with the augment of [Mn] concentration for all samples. Spheres and cubes showed clear T1 enhancement as the concentration increased. Nevertheless, the enhanced effect of cross was awfully weak because of its large r2/r1 ratio. Obviously, octahedrons exhibited the strongest positive enhanced effect of these NPs, which is ascribed to their high T1 relaxivity and low r2/r1 ratio. The octahedrons sample showed a palpable light signal compared with the signal of water even at the low concentration of 0.05 mM-1, which indicates that octahedrons have the robust ability for sensitive imaging and precise diagnosis.
T1 CE-MR imaging of liver
Before in vivo T1 imaging, we evaluated the cytotoxicity and biocompatibility of these MnO NPs with different shapes first. The cytotoxicity of these four samples were measured by 3-(4,5-dimethylthiazol-2-y1)-2,5-diphenyltetrazolium bromide (MTT) assays (Figure S10). No apparent cytotoxicity was observed in these groups even at the high concentration of 120 μg [Mn]/mL after incubation with human hepatoma SMMC-7721 cells for 24 h. Moreover, H&E staining results (Figure 6A) indicated no appreciable tissue injury or inflammation of the major five organs two weeks after venous injection of these MnO NPs for mice (at a dose of 2.0 mg [Mn]/kg). All these results attest to the excellent stability and biocompatibility of ZDS modified MnO NPs.
In vivo T1 CE-MR imaging of liver. (A) The organ histology images of different organs (heart, liver, spleen, lung and kidney) after administration of ZDS coated MnO nanoparticles. The H&E staining of BALB/c mice were sacrificed two weeks after caudal venous injection of MnO nanoparticles with four different shapes at a dose of 2.0 mg [Mn]/kg. (B) In vivo T1-weighted MR images in liver at transverse plane of mice before and after intravenous injection of MnO nanoparticles with a dose of 2.0 mg [Mn]/kg to mouse body weight (n = 3/group). (C) Corresponding quantitative analysis of SNR changes in liver of (B) at different time points after administration (n = 3/group).
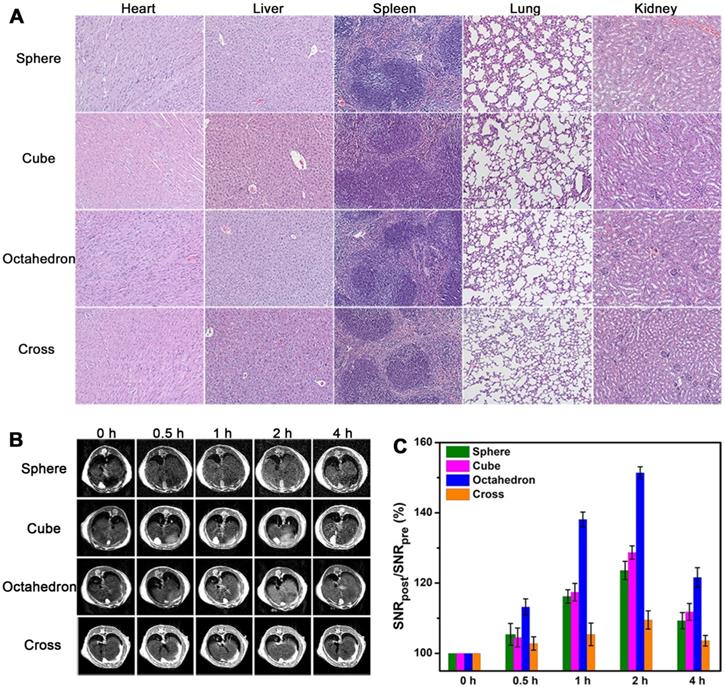
We established the healthy BALB/c mice model and performed T1-weighted MRI in liver at 7.0 T by utilizing MnO NPs with four shapes. We focused on the liver as the region of interest, as the majority of NPs are expeditiously taken up by mononuclear phagocyte system (MPS) and rapidly accumulated in hepatic Kupffer cells [53]. We obtained T1-weighted MR images of transverse plane (Figure 6B) before and after intravenous injection of NPs at a dose of 2.0 mg [Mn]/kg mouse body weight (n = 3/group). Signal enhancements were observed in the liver region for all groups at 0.5, 1, 2, and 4 h post injection. The signals in liver became positive at 0.5 h post injection, reached the brightest at 2 h, and partly recovered at 4 h, implying that NPs were degraded and excreted from the body, which is in agreement with former research [54, 55]. In accord with the result of T1 phantom imaging, spheres and cubes showed clear signal enhancement while cross exhibited little signal change due to its high r2/r1 ratio. Notably, octahedrons displayed significantly enhanced signal at 2 h, indicating their towering enhanced ability for in vivo T1 imaging. Moreover, for octahedrons, the liver region showed a distinct bright signal at 1 h and remained positive until 4 h. They provide hours of diagnostic time window after intravenous administration, which is able to provide more opportunities for gathering critical information for sensitive diagnosis and imaging mediated therapy.
We then analyzed signal-to-noise ratio (SNR) changes to quantify the enhanced effects of these MnO NPs. We calculated the SNRpost/SNRpre value for the liver region at the transverse plane for each group (Figure 6C). Their signal changes (∆SNR%) at 2 h were 23.6 ± 2.6, 28.7 ± 1.9, 51.4 ± 1.7 and 9.5 ± 2.6 for spheres, cubes, octahedrons and cross, respectively (Table S9). Consistent with their performance in in vitro and in vivo T1 imaging, the signal changes in liver from small to large were cross, spheres, cubes, and octahedrons. In particular, the maximal ΔSNR at 2 h of octahedrons was up to 51.4%, which is about 2.2 times of spheres, 1.8 times of cubes and 5.4 times of cross. They exhibited the optimal T1 enhanced effect, further demonstrating that the brilliant contrast ability is due to their high T1 relaxivity and low r2/r1 ratio. Therefore, the accumulation of NPs with this unique octahedron shape in the liver performed an eminent enhanced effect for T1 MRI.
In vivo behavior
Diverse surface coating ligands could influence NPs' distribution in tissues and in vivo fates [56-58]. Zwitterionic NPs are able to reduce the non-absorption of proteins in physiological environment [59], maximize tumor accumulation and cellular uptake due to their switchable charges based on the environmental stimulus [60, 61]. MnO NPs with zwitterionic ZDS coating exhibit charge switchable behavior, their negatively charged surface may reduce the nonspecific protein adsorption in blood and increase the accumulation in solid tumor sites through the enhanced permeability and retention (EPR) effect [62], and their charge can change to positive by diminishing the anionic part after arriving in tumoral acidic microenvironment, which promotes the tumor cellular uptake and hence increase the diagnosis accuracy [63].
To investigate pharmacokinetics and diagnosis efficiency, we studied the in vivo behavior of MnO NPs by analysis of biodistribution and blood circulation half-life. We noticed that octahedrons performed obvious T1 enhancement while cross displayed inconspicuous contrast effect. Hence octahedrons and cross were used for comparison to explore the potential reason for this discrepancy. We analyzed in vivo biodistribution of octahedrons and cross by detecting the concentration of Mn ions in major organs: heart, liver, spleen, lung and kidney (Figure 7A-B). As we previously expected, large part of octahedrons and cross apparently accumulated in the mononuclear phagocyte system such as liver and spleen. The accumulation of cross in liver, spleen and lung was higher while in heart and kidney was lower (Table S10), which is owing to the larger hydrodynamic diameters of cross than octahedrons [64]. Mononuclear phagocytic cells present in tissues of the liver, spleen, lungs [65], and Kupffer cells that line the hepatic sinusoids in the liver, together with marginal zone and red pulp macrophages in the spleen, rapidly sequester particles with larger hydrodynamic diameters [66]. In addition, the accumulation of octahedrons in liver was lower than that of cross, which suggests that the predominant enhanced effect in liver of octahedrons is due to their high T1 contrast ability.
In vivo behavior analysis. In vivo biodistribution of Mn ions in major organs of mice at 6 h after intravenous injection of (A) MnO octahedrons and (B) MnO cross (n = 3/group). Blood circulation curves of (C) MnO octahedrons and (D) MnO cross in mice. The concentrations of Mn ions were measured by ICP-MS (n = 3/group).
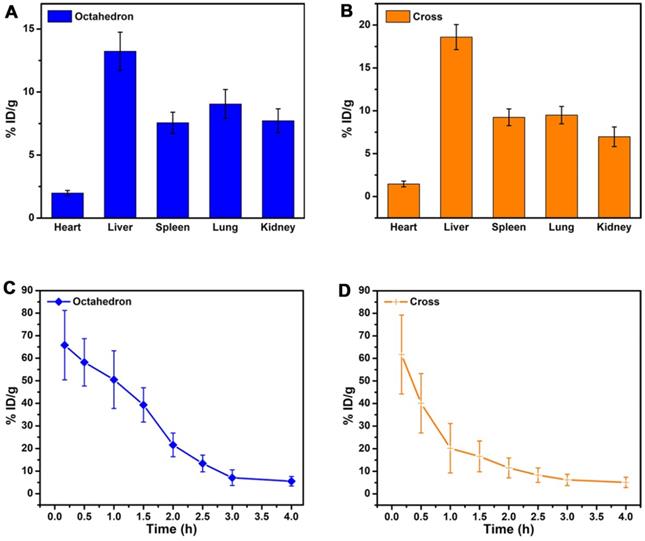
We further studied the blood circulation half-life of MnO octahedrons and cross (Figure 7C-D). The blood circulation half-life of octahedrons is about 1.54 h, which is 2.1 times as long as that of cross with a value of 0.73 h (Table S11). This result proves that both octahedrons and cross are stable during circulation because free Mn ions possess a short half-life of only several minutes in blood circulation. It is reported that smaller particles absorb less amounts of proteins in comparison with larger particles of the same material, hence the concentration of particles circulating in the blood decreases with the size increases, since larger particles are prone to be trapped by MPS [67]. Octahedrons hold a prolonged in vivo circulating half-life, which suggests that octahedrons have reduced nonspecific adsorption of proteins and agglomeration of particles in the blood circulation. This result certifies that MnO octahedrons are more appropriate for detecting tumors compared to MnO cross.
Sensitive detection of hepatic and subcutaneous tumors
On the basis of the above in vivo MRI results, MnO octahedrons performed superior MR enhancement, suggesting they are potential candidates for sensitive tumor diagnosis. To study their imaging ability for tumors, we conducted T1 CE-MRI of BALB/c mice bearing orthotopic hepatocellular carcinoma tumors at 7 T. Sagittal images were acquired before (0 h) and at 1, 2, and 4 h after intravenous injection of octahedrons, cross and Mn-DPDP (Figure 8A and Figure S11A). The injection dose of cross was 2.0 mg [Mn]/kg, the injection doses of octahedrons were 1.0 mg [Mn]/kg and 0.4 mg [Mn]/kg, and the injection dose of Mn-DPDP was 4.0 mg [Mn]/kg. The signals of hepatic tumors for all groups became positive at 1 h, reached the brightest at 2 h, and dimed gradually at 4 h. However, octahedrons showed brighter signals than cross at only a half and one-fifth of the injected dose, and displayed brighter signals than Mn-DPDP at even one-tenth of the injected dose. The remarkably enhanced signals with this ultralow dose affirm the high sensitivity of MnO octahedrons in detecting tumors. Moreover, notably, the dose of 0.4 mg [Mn]/kg for mouse is equal to a human dose of 0.03 mg/kg, which is about 1/10 of the clinical dose of 0.275 mg/kg for Mn-DPDP for human (based on an equivalent surface area dose) (details see Table S12) [63, 68, 69]. This ultralow dose used indicates less toxicity and side effects in clinical application.
Sensitive tumor imaging with ultralow dose. (A) In vivo T1-weighted MR images of orthotopic liver tumors (in red circles) of BALB/c mice in sagittal plane. (B) The corresponding quantitative CNR changes of tumors (*: 0.01 < p < 0.05, **: p < 0.01, n = 5/group, compared with the group of cross). (C) T1-weighted MR images of mice bearing subcutaneous tumors at 0 h and 2 h after intravenous injection (n = 3/group). (D) The related quantification of CNR post administration. (E) T1 imaging of H22 cells isolated from the mice treated with octahedrons and cross after 2 h intravenous injection. (F) Total amount analysis of Mn ions in H22 cells isolated from the mice treated with octahedrons and cross.
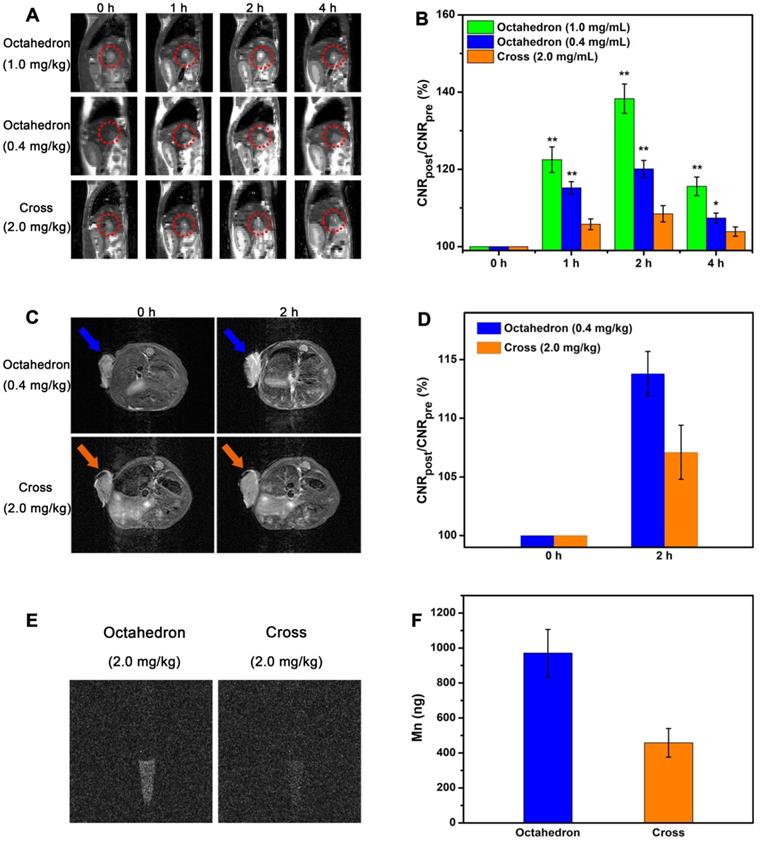
The MR contrast-to-noise ratio (CNR) changes of tumor (Figure 8B and Figure S11B) further validate their contrast abilities for tumor imaging. The ∆CNR% of octahedrons at a dose of 1.0 mg [Mn]/kg at 1, 2, and 4 h after intravenous injection were 22.5 ± 3.3, 38.3 ± 3.8 and 15.6 ± 2.4, respectively. The ∆CNR% of octahedrons at a dose of 0.4 mg [Mn]/kg at 1, 2, and 4 h after intravenous injection were 15.2 ± 1.6, 20.1 ± 2.2 and 7.4 ± 1.3, respectively. The ∆CNR% of cross at a dose of 2.0 mg [Mn]/kg at 1, 2, and 4 h after intravenous injection were 5.8 ± 1.4, 8.5 ± 2.1 and 3.9 ± 1.2, respectively. The ∆CNR% of Mn-DPDP at a dose of 4.0 mg [Mn]/kg at 1, 2, and 4 h after intravenous injection were 10.3 ± 1.5, 15.2 ± 2.3 and 5.8 ± 1.4, respectively (Table S13). The ∆CNR% of octahedrons at a dose of only 0.4 mg [Mn]/kg were evidently higher than that of cross at a dose of 2.0 mg [Mn]/kg and that of Mn-DPDP at a dose of 4.0 mg [Mn]/kg at 2 h after intravenous injection. This result indicates that the significantly enhanced effect is ascribed to their excellent T1 contrast ability of for liver tumors, suggesting MnO octahedrons is an efficient CA for sensitive diagnosis of hepatic tumor.
We also conducted T1 CE-MRI of BALB/c mice bearing subcutaneous tumors to investigate their imaging abilities. Considering their excellent T1 contast ability, we intravenously injected MnO octahedrons only at a dose of 0.4 mg [Mn]/kg to body weight. According to the previous fact that MR signals for mice reach the brightest at 2 h post injection (the best detection window), T1 CE-MR images were acquired before and at 2 h after intravenous injection (Figure 8C and Figure S12A). To evaluate their tumor targeting capabilities, we focused on tumors as interesting regions. The tumor showed a significant positive signal at 2 h than that at 0 h, indicating their excellent T1 contrast ability for subcutaneous tumors. This result confirms that MnO octahedrons with ZDS coating can effectively accumulate in tumor sites, result in obvious differentiation between the tumor and normal tissues in MR images, and thus are suitable in cancer diagnosis. Moreover, in comparison with the group of cross and the group of Mn-DPDP, octahedrons showed a brighter contrast enhanced signal at 2 h than that of cross with only 1/5 of the injected dose and that of Mn-DPDP with 1/10 of the injected dose.
To quantify their contrast enhancements, we measured SNR values of the three groups by analyzing the region of images corresponding to tumors (Figure S13). Compared with the SNR value of 107.5 ± 2.1% for the cross group and the SNR value of 109.1 ± 2.2% for the Mn-DPDP group, the octahedron group shows a higher SNR value of 112.9 ± 2.4% at 2 h. The high T1 signal enhancement in the octahedron group indicates that octahedrons is an efficient candidate for sensitive tumor diagnosis. Another key factor to evaluate the enhanced effect, the MR contrast-to-noise ratio (CNR) change of tumor (Figure 8D and Figure S12B), further confirms their contrast abilities for tumor imaging. Consistent with SNR analysis, the ∆CNR% of octahedrons at a dose of 0.4 mg [Mn]/kg was 13.8 ± 1.9, which is much higher than that of cross with a value of 7.1 ± 2.3 at a dose of 2.0 mg [Mn]/kg and that of Mn-DPDP with a value of 10.4 ± 2.3 at a dose of 4.0 mg [Mn]/kg.
In vivo tumor uptake
Since the T1 signal enhancement of tumor is proportional to the number of accumulated particles in tumor sites, we studied the tumor uptake of MnO octahedrons and MnO cross (Figure S14). The tumor uptake of octahedrons and cross was 2.19 ± 0.75% ID/g and 4.76 ± 1.08 % ID/g. It is noted that the injection dose of octahedron was merely 1/5 of that of cross, while the tumor uptake of octahedron was nearly half of that of cross, which indicates the high tumor uptake of octahedrons.
We also investigated the in vivo cellular uptake of tumor on mice bearing H22 tumors by the same injection dose of 2.0 mg [Mn]/kg octahedrons and cross. The cells were isolated from the mice and then conducted by T1-weighted MR imaging. The group treated by octahedrons exhibited a clear T1 signal, while the signal in the group treated by cross was obscure (Figure 8E). Agrees with the results of MR imaging, the amount of Mn ions in cells of the group treated by octahedrons with a value of 971 ± 135 ng is two times higher than that of the group treated by cross with a value of 458 ± 82 ng through ICP-MS analysis (Figure 8F). This result proves that MnO octahedrons can effectively accumulate in solid tumors and be taken by tumor cells, which is because that particle size also influences the cellular uptake of NPs via various pathways such as receptor-mediated or adsorptive endocytosis [70-72]. The above tumor uptake and signal change verify the excellent T1 enhanced effect of MnO octahedrons for tumors even at 1/10 of the clinical dose, which can be applied to achieve lower detection limit and less side effects with low dose. These results confirm that MnO octahedrons can improve the sensitivity of T1 imaging and this feature is crucially important for sensitive detection and early diagnosis of cancer.
Discussion and Conclusions
SBM theory reveals the relationships of rotation correlation time (τR), hydration number (q), proton residency time (τM) and relaxation time of electron spins (τs) with the T1 relaxivity for complex, but only the coordinating water molecular number q is applicative for the analysis of NPs. Besides, most of previous reports investigate one or two aspects that influence the enhanced effect of T1 imaging for nanomaterials. Hence, our work replenishes SBM theory and is complementary to former researches. It takes into account NPs of different shapes from 0D to 3D and also be feasible to other sophisticate shapes.
In summary, we studied critical factors that improved the sensitivity of T1 imaging by utilizing MnO NPs of different sizes and shapes with neutral charges as research subjects. We demonstrated that geometric volume, surface area, crystal face and r2/r1 ratio had a pivotal impact on the enhanced effect of T1 imaging. The sensitive T1 imaging has a positive relationship with surface area and occupancy rate of effect metal ions, while a negative correlation with geometric volume and r2/r1 ratio. This work figures out quantitative relationships of these factors that influence the enhanced effect of T1 imaging for the first time. With a systematical understanding, we believe this study would greatly contribute to more rational design and development of high-performance CA for early and precise diagnosis.
Compared with other reported MnO NPs, MnO octahedrons have a notable high r1 value with a low r2/r1 ratio and exhibit remarkable T1 enhanced effect, holding great promise as an outstanding T1 CA for sensitive imaging and diagnosis. Their extraordinary T1 enhanced ability is due to their specific crystal surface and surface area to volume ratio, which are highly related to the shape. Meanwhile, MnO cross maybe a promising candidate for T2 imaging owing to its large r2/r1 ratio. On this basis of these results, it is expected to realize better utilization of nanomaterials with optimal shape and make more breakthroughs in this field.
Moreover, the prominent contrast ability of MnO octahedrons endows an excellent enhanced effect in in vitro and in vivo liver T1 MRI. Zwitterionic ZDS coating with charge switchable behavior promotes tumor accumulation and cellular uptake, hepatic and subcutaneous tumors can be detected with an ultralow dose of MnO octahedrons, which is critical for early diagnosis and sensitive prognosis in cancer management. Furthermore, these MnO octahedrons could meet the diagnostic needs even at superb low doses, which is of great importance for reducing the medical costs and side effects in clinic.
Abbreviations
CAs: contrast agents; CE: contrast-enhanced; CNR: contrast-to-noise ratio; DLS: dynamic light scattering; EDX: energy-dispersive X-ray; EPR: enhanced permeability and retention; FDA: Food and Drug Administration; HRTEM: high-resolution transmission electron microscopy; ICP-MS: inductively coupled plasma mass spectroscopy; MnO: manganese oxide; MPS: mononuclear phagocyte system; MRI: magnetic resonance imaging; MSE: multislice spin-echo; NPs: nanoparticles; NSF: nephrogenic systemic fibrosis; PDI: polydispersity coefficient; SBM: Solomon, Bloembergen, and Morgan; SNR: signal-to-noise ratio; SQUID: superconducting quantum interference device; TEM: transmission electron microscopy; XPS: X-ray absorption spectra; XRD: X-ray powder diffraction; ZDS: zwitterionic dopamine sulfonate.
Supplementary Material
Supplementary figures and tables.
Acknowledgements
This work was supported by the National Natural Science Foundation of China (Nos. 21874024, 21771148, 82001806, and 21635002), the joint research projects of Health and Education Commission of Fujian Province (2019-WJ-20).
Competing Interests
The authors have declared that no competing interest exists.
References
1. Wahsner J, Gale EM, Rodríguez-Rodríguez A, Caravan P. Chemistry of MRI contrast agents: current challenges and new frontiers. Chem Rev. 2019;119:957-1057
2. Stabile A, Giganti F, Rosenkrantz AB, Taneja SS, Villeirs G, Gill IS. et al. Multiparametric MRI for prostate cancer diagnosis: current status and future directions. Nat Rev Urol. 2020;17:41-61
3. Rahbar H, Zhang Z, Chenevert TL, Romanoff J, Kitsch AE, Hanna LG. et al. Utility of diffusion-weighted imaging to decrease unnecessary biopsies prompted by breast MRI: a trial of the ECOG-ACRIN cancer research group (A6702). Clin Cancer Res. 2019;25:1756-65
4. Tseng YJ, Chou SW, Shyue JJ, Lin SY, Hsiao JK, Chou PT. A versatile theranostic delivery platform integrating magnetic resonance imaging/computed tomography, pH/cis-diol controlled release, and targeted therapy. ACS Nano. 2016;10:5809-22
5. Li F, Liang Z, Liu J, Sun J, Hu X, Zhao M. et al. Dynamically reversible iron oxide nanoparticle assemblies for targeted amplification of T1-weighted magnetic resonance imaging of tumors. Nano Lett. 2019;19:4213-20
6. Zhang M, Zheng T, Sheng B, Wu F, Zhang Q, Wang W. et al. Mn2+ complex-modified polydopamine- and dual emissive carbon dots based nanoparticles for in vitro and in vivo trimodality fluorescent, photothermal, and magnetic resonance imaging. Chem Eng J. 2019;373:1054-63
7. Ni D, Bu W, Ehlerding EB, Cai W, Shi J. Engineering of inorganic nanoparticles as magnetic resonance imaging contrast agents. Chem Soc Rev. 2017;46:7438-68
8. Zhou L, Yang T, Wang J, Wang Q, Lv X, Ke H. et al. Size-tunable Gd2O3@albumin nanoparticles conjugating chlorin e6 for magnetic resonance imaging-guided photo-induced therapy. Theranostics. 2017;7:764-74
9. Clough TJ, Jiang L, Wong KL, Long NJ. Ligand design strategies to increase stability of gadolinium-based magnetic resonance imaging contrast agents. Nat Commun. 2019;10:1420
10. Gale EM, Atanasova IP, Blasi F, Ay I, Caravan P. A manganese alternative to gadolinium for MRI contrast. J Am Chem Soc. 2015;137:15548-57
11. Hsu BYW, Ng M, Zhang Y, Wong SY, Bhakoo K, Li X. et al. A hybrid silica nanoreactor framework for encapsulation of hollow manganese oxide nanoparticles of superior T1 magnetic resonance relaxivity. Adv Funct Mater. 2015;25:5269-76
12. Lu S, Li X, Zhang J, Peng C, Shen M, Shi X. Dendrimer-stabilized gold nanoflowers embedded with ultrasmall iron oxide nanoparticles for multimode imaging-guided combination therapy of tumors. Adv Sci. 2018;5:1801612
13. Wei H, Bruns OT, Kaul MG, Hansen EC, Barch M, Wisniowska A. et al. Exceedingly small iron oxide nanoparticles as positive MRI contrast agents. Proc Natl Acad Sci USA. 2017;114:2325-30
14. Marckmann P, Skov L, Rossen K, Dupont A, Damholt M. B, Heaf, J. G, et al. Nephrogenic systemic fibrosis: suspected causative role of gadodiamide used for contrast-enhanced magnetic resonance imaging. J Am Chem Soc. 2006;17:2359-62
15. Gulani V, Calamante F, Shellock F. G, Kanal, E, Reeder, S. B, International Society for Magnetic Resonance in, M. Gadolinium deposition in the brain: summary of evidence and recommendations. Lancet Neurol. 2017;16:564-70
16. McDonald RJ, McDonald JS, Kallmes DF, Jentoft ME, Paolini MA, Murray DL. et al. Gadolinium deposition in human brain tissues after contrast-enhanced MR imaging in adult patients without intracranial abnormalities. Radiology. 2017;285:546-54
17. Bai C, Jia Z, Song L, Zhang W, Chen Y, Zang F. et al. Time-dependent T1-T2 switchable magnetic resonance imaging realized by c(RGDyK) modified ultrasmall Fe3O4 nanoprobes. Adv Funct Mater. 2018;28:1802281
18. Jia Z, Song L, Zang F, Song J, Zhang W, Yan C. et al. Active-target T1-weighted MR imaging of tiny hepatic tumor via RGD modified ultra-small Fe3O4 nanoprobes. Theranostics. 2016;6:1780-91
19. Dong P, Zhang T, Xiang H. Xu X, Lv Y, Wang Y, et al. Controllable synthesis of exceptionally small-sized superparamagnetic magnetite nanoparticles for ultrasensitive MR imaging and angiography. J Mater Chem B. 2021;9:958-68
20. Chen B, Guo Z, Guo C, Mao Y, Qin Z, Ye D. et al. Moderate cooling coprecipitation for extremely small iron oxide as a pH dependent T1-MRI contrast agent. Nanoscale. 2020;12:5521-32
21. Wang J, Jia Y, Wang Q, Liang Z, Han G, Wang Z. et al. An ultrahigh-field-tailored T1-T2 dual-mode MRI contrast agent for high-performance vascular imaging. Adv Mater. 2021;33:2004917
22. Lu Y, Zhang L, Li J, Su YD, Liu Y, Xu YJ. et al. MnO nanocrystals: a platform for integration of MRI and genuine autophagy induction for chemotherapy. Adv Funct Mater. 2013;23:1534-46
23. Zhu J, Li H, Xiong Z, Shen M, Conti PS, Shi X. et al. Polyethyleneimine-coated manganese oxide nanoparticles for targeted tumor PET/MR imaging. ACS Appl Mater Interfaces. 2018;10:34954-64
24. Feng L, Xie R, Wang C, Gai S, He F, Yang D. et al. Magnetic targeting, tumor microenvironment-responsive intelligent nanocatalysts for enhanced tumor ablation. ACS Nano. 2018;12:11000-12
25. Xu J, Han W, Yang P, Jia T, Dong S, Bi H. et al. Tumor microenvironment-responsive mesoporous MnO2-coated upconversion nanoplatform for self-enhanced tumor theranostics. Adv Funct Mater. 2018;28:1803804
26. Sun Q, Wang Z, Liu B, Jia T, Wang C, Yang D. et al. Self-generation of oxygen and simultaneously enhancing photodynamic therapy and MRI effect: An intelligent nanoplatform to conquer tumor hypoxia for enhanced phototherapy. Chem Eng J. 2020;390:124624
27. Solomon I. Relaxation processes in a system of two spins. Phys Rev. 1955;99:559-65
28. Bloembergen N, Morgan LO. Proton relaxation times in paramagnetic solutions. Effects of electron spin relaxation. J Chem Phys. 1961;34:842-50
29. Caravan P. Protein-targeted gadolinium-based magnetic resonance imaging (MRI) contrast agents: design and mechanism of action. Acc Chem Res. 2009;42:851-62
30. Caravan P. Strategies for increasing the sensitivity of gadolinium based MRI contrast agents. Chem Soc Rev. 2006;35:512-23
31. Villaraza AJL, Bumb A, Brechbiel MW. Macromolecules, dendrimers, and nanomaterials in magnetic resonance imaging: the interplay between size, function, and pharmacokinetics. Chem Rev. 2010;110:2921-59
32. Ding B, Zheng P, Ma P, Lin J. Manganese oxide nanomaterials: synthesis, properties, and theranostic applications. Adv Mater. 2020;32:e1905823
33. Lee J, Kumari N, Kim SM, Kim S, Jeon KW, Im GH. et al. Anchoring ligand-effect on bright contrast-enhancing property of hollow Mn3O4 nanoparticle in T1-weighted magnetic resonance imaging. Chem Mater. 2018;30:4056-64
34. Yang L, Wang Z, Ma L, Li A, Xin J, Wei R. et al. The roles of morphology on the relaxation rates of magnetic nanoparticles. ACS Nano. 2018;12:4605-14
35. Yang L, Ma L, Xin J, Li A, Sun C, Wei R. et al. Composition tunable manganese ferrite nanoparticles for optimized T2 contrast ability. Chem Mater. 2017;29:3038-47
36. An K, Park M, Yu JH, Na HB, Lee N, Park J. et al. Synthesis of uniformly sized manganese oxide nanocrystals with various sizes and shapes and characterization of their T1 magnetic resonance relaxivity. Eur J Inorg Chem. 2012;2012:2148-55
37. Cheon J, Kang NJ, Lee SM, Lee JH, Yoon JH, Oh SJ. Shape evolution of single-crystalline iron oxide nanocrystals. J Am Chem Soc. 2004;126:1950-1
38. Kim D, Lee N, Park M, Kim BH, An K, Hyeon T. Synthesis of uniform ferrimagnetic magnetite nanocubes. J Am Chem Soc. 2009;131:454-5
39. Zhao Z, Bao J, Fu C, Lei M, Cheng J. Controllable synthesis of manganese oxide nanostructures from 0-D to 3-D and mechanistic investigation of internal relation between structure and T1 relaxivity. Chem Mater. 2017;29:10455-68
40. Fu Y, Wei Q, Zhang G, Wang X, Zhang J, Hu Y. et al. High-performance reversible aqueous Zn-ion battery based on porous MnOx nanorods coated by MOF-derived N-doped carbon. Adv Energy Mater. 2018;8:1801445
41. Schladt TD, Graf T, Tremel W. Synthesis and characterization of monodisperse manganese oxide nanoparticles-evaluation of the nucleation and growth mechanism. Chem Mater. 2009;21:3183-90
42. Schladt TD, Shukoor MI, Schneider K, Tahir M, Natalio F, Ament I. et al. Au@MnO nanoflowers: hybrid nanocomposites for selective dual functionalization and imaging. Angew Chem Int Ed. 2010;49:3976-80
43. Walkey CD, Olsen JB, Guo H, Emili A, Chan WCW. Nanoparticle size and surface chemistry determine serum protein adsorption and macrophage uptake. J Am Chem Soc. 2012;134:2139-47
44. Cho EC, Xie J, Wurm PA, Xia Y. Understanding the role of surface charges in cellular adsorption versus internalization by selectively removing gold nanoparticles on the cell surface with a I2/KI etchant. Nano Lett. 2009;9:1080-4
45. Verma A, Stellacci F. Effect of surface properties on nanoparticle-cell interactions. Small. 2010;6:12-21
46. Ling D, Lee N, Hyeon T. Chemical synthesis and assembly of uniformly sized iron oxide nanoparticles for medical applications. Acc Chem Res. 2015;48:1276-85
47. Snyder EM, Asik D, Abozeid SM, Burgio A, Bateman G, Turowski SG. et al. A class of feIII macrocyclic complexes with alcohol donor groups as effective T1 MRI contrast agents. Angew Chem Int Ed. 2020;59:2414-9
48. Kuang Q, Wang X, Jiang Z, Xie Z, Zheng L. High-energy-surface engineered metal oxide micro- and nanocrystallites and their applications. Acc Chem Res. 2014;47:308-18
49. Zhou K, Li Y. Catalysis based on nanocrystals with well-defined facets. Angew Chem Int Ed. 2012;51:602-13
50. Cui TL, Ke WY, Zhang WB, Wang HH, Li XH, Chen JS. Encapsulating palladium nanoparticles inside mesoporous MFI zeolite nanocrystals for shape-selective catalysis. Angew Chem Int Ed. 2016;55:9178-82
51. Lee JH, Huh YM, Jun Yw, Seo Jw, Jang Jt, Song HT. et al. Artificially engineered magnetic nanoparticles for ultra-sensitive molecular imaging. Nat Med. 2007;13:95-9
52. Starsich FHL, Sotiriou GA, Wurnig MC, Eberhardt C, Hirt AM, Boss A. et al. Silica-coated nonstoichiometric nano Zn-ferrites for magnetic resonance imaging and hyperthermia treatment. Adv Healthcare Mater. 2016;5:2698-706
53. Walkey CD, Chan WC. Understanding and controlling the interaction of nanomaterials with proteins in a physiological environment. Chem Soc Rev. 2012;41:2780-99
54. Levy M, Luciani N, Alloyeau D, Elgrabli D, Deveaux V, Pechoux C. et al. Long term in vivo biotransformation of iron oxide nanoparticles. Biomaterials. 2011;32:3988-99
55. Longmire M, Choyke PL, Kobayashi H. Clearance properties of nano-sized particles and molecules as imaging agents: considerations and caveatn. Nanomedicine. 2008;3:703-17
56. Albanese A, Tang PS, Chan WC. The effect of nanoparticle size, shape, and surface chemistry on biological systems. Annu Rev Biomed Eng. 2012;14:1-16
57. Walkey CD, Olsen JB, Guo H, Emili A, Chan WC. Nanoparticle size and surface chemistry determine serum protein adsorption and macrophage uptake. J Am Chem Soc. 2012;134:2139-47
58. Black KC, Wang Y, Luehmann HP, Cai X, Xing W, Pang B. et al. Radioactive 198Au-doped nanostructures with different shapes for in vivo analyses of their biodistribution, tumor uptake, and intratumoral distribution. ACS Nano. 2014;8:4385-94
59. Wei H, Insin N, Lee J, Han HS, Cordero JM, Liu W. et al. Compact zwitterion-coated iron oxide nanoparticles for biological applications. Nano Lett. 2011;12:22-5
60. Yuan YY, Mao CQ, Du XJ, Du JZ, Wang F, Wang J. Surface charge switchable nanoparticles based on zwitterionic polymer for enhanced drug delivery to tumor. Adv Mater. 2012;24:5476-80
61. Blanco E, Shen H, Ferrari M. Principles of nanoparticle design for overcoming biological barriers to drug delivery. Nat Biotechnol. 2015;33:941-51
62. Fang J, Nakamura H, Maeda H. The EPR effect: unique features of tumor blood vessels for drug delivery, factors involved, and limitations and augmentation of the effect. Adv Drug Deliv Rev. 2011;63:136-51
63. Lei M, Fu C, Cheng X, Fu B, Wu N, Zhang Q. et al. Activated surface charge-reversal manganese oxide nanocubes with high surface-to-volume ratio for accurate magnetic resonance tumor imaging. Adv Funct Mater. 2017;27:1700978
64. Veiseh O, Gunn JW, Zhang M. Design and fabrication of magnetic nanoparticles for targeted drug delivery and imaging. Adv Drug Deliv Rev. 2010;62:284-304
65. Chow A, Brown BD, Merad M. Studying the mononuclear phagocyte system in the molecular age. Nat Rev Immunol. 2011;11:788-98
66. Devadasu VR, Bhardwaj V, Kumar MNVR. Can controversial nanotechnology promise drug delivery? Chem Rev. 2012;113:1686-735
67. García KP, Zarschler K, Barbaro L, Barreto JA, O'Malley W, Spiccia L. et al. Zwitterionic-coated “stealth” nanoparticles for biomedical applications: recent advances in countering biomolecular corona formation and uptake by the mononuclear phagocyte system. Small. 2014;10:2516-29
68. Freireich EJ, Gehan EA, Rall DP, Schmidt LH, Skipper HE. Quantitative comparison of toxicity of anticancer agents in mouse, rat, hamster, dog, monkey, and man. Cancer Chemother Rep. 1966;50:219-44
69. Greaves P, Williams A, Eve M. First dose of potential new medicines to humans: how animals help. Nat Rev Drug Discov. 2004;3:226-36
70. Ma X, Wu Y, Jin S, Tian Y, Zhang X, Zhao Y. et al. Gold nanoparticles induce autophagosome accumulation through size-dependent nanoparticle uptake and lysosome impairment. ACS Nano. 2011;5:8629-39
71. Geng Y, Dalhaimer P, Cai S, Tsai R, Tewari M, Minko T. et al. Shape effects of filaments versus spherical particles in flow and drug delivery. Nat Nanotechnol. 2007;2:249-55
72. Canton I, Battaglia G. Endocytosis at the nanoscale. Chem Soc Rev. 2012;41:2718-39
Author contact
![]() Corresponding authors: E-mail: llchenedu.cn; jhgaoedu.cn; jibinsongedu.cn.
Corresponding authors: E-mail: llchenedu.cn; jhgaoedu.cn; jibinsongedu.cn.