Impact Factor
- Issue 14; 2026
- Issue 13; 2026
- Issue 12; 2026
- Issue 11; 2026
- Issue 10; 2026
- Volume 16; 2026
- Advance Articles
- Past Issues
- Cover Images
- Cover Suggestion
- Index & Coverage
- Special Issues
Introduction
Materials and Methods
Results
Discussion
Abbreviations
Supplementary Material
Acknowledgements
References
International Journal of Biological Sciences
International Journal of Medical Sciences
 Global reach, higher impact

Theranostics 2021; 11(19):9217-9233. doi:10.7150/thno.60679 This issue Cite
Research Paper
Tryptophan metabolism is inversely regulated in the tumor and blood of patients with glioblastoma
Verena Panitz1,2*, Saša Končarević3*, Ahmed Sadik1,4*, Dennis Friedel1,4, Tobias Bausbacher5, Saskia Trump6, Vadim Farztdinov3#, Sandra Schulz5, Philipp Sievers7,8, Stefan Schmidt5, Ina Jürgenson1,2, Stephan Jung3, Karsten Kuhn3, Irada Pflüger9, Suraj Sharma10, Antje Wick2, Pauline Pfänder1,4, Stefan Selzer3, Philipp Vollmuth9, Felix Sahm7,8, Andreas von Deimling7,8, Ines Heiland10, Carsten Hopf5, Peter Schulz-Knappe3§, Ian Pike11, Michael Platten12,13, Wolfgang Wick2,14, Christiane A. Opitz1,2 ![]()
1. DKTK Brain Cancer Metabolism Group, German Cancer Research Center (DKFZ), 69120 Heidelberg, Germany.
2. Department of Neurology and National Center for Tumor Diseases, Heidelberg University Hospital, 69120 Heidelberg, Germany.
3. Proteome Sciences R&D GmbH & Co. KG, Altenhöferallee 3, 60438 Frankfurt/Main, Germany.
4. Faculty of Bioscience, Heidelberg University, 69120 Heidelberg, Germany.
5. Center for Mass Spectrometry and Optical Spectroscopy (CeMOS), Mannheim University of Applied Sciences, 68163 Mannheim, Germany.
6. Molecular Epidemiology Unit, Berlin Institute of Health at Charité - Universitätsmedizin Berlin, 10117 Berlin, Germany.
7. Department of Neuropathology, Institute of Pathology, Heidelberg University Hospital, 69120 Heidelberg, Germany.
8. Clinical Cooperation Unit Neuropathology, German Consortium for Translational Cancer Research (DKTK), German Cancer Research Center (DKFZ), 69120 Heidelberg, Germany.
9. Department of Neuroradiology, Heidelberg University Hospital, 69120 Heidelberg, Germany.
10. Department of Arctic and Marine Biology, UiT, The Arctic University of Norway, 9037 Tromsø, Norway.
11. Proteome Sciences plc, 5 Dashwood Lang Road, Bourne Business Park, Addlestone, Surrey KT15 2HJ, United Kingdom.
12. Department of Neurology, Medical Faculty Mannheim, University of Heidelberg, 68167 Mannheim, Germany.
13. DKTK Clinical Cooperation Unit Neuroimmunology and Brain Tumor Immunology, German Cancer Research Center (DKFZ), 69120 Heidelberg, Germany.
14. Clinical Cooperation Unit Neurooncology, German Cancer Research Center (DKFZ), 69120 Heidelberg, Germany.
*These authors contributed equally to this work.
#Current address: Core Facility - High-Throughput Mass Spectrometry, Charité - Universitätsmedizin Berlin, corporate member of Freie Universität Berlin, Humboldt-Universität zu Berlin and Berlin Institute of Health (BIH), 10117 Berlin, Germany.
§Current address: Mittelorbroich 125, 47839 Krefeld, Germany.
Received 2021-3-20; Accepted 2021-8-6; Published 2021-9-3
Abstract

Tryptophan (Trp)-catabolic enzymes (TCEs) produce metabolites that activate the aryl hydrocarbon receptor (AHR) and promote tumor progression and immunosuppression in glioblastoma. As therapies targeting TCEs or AHR become available, a better understanding of Trp metabolism is required.
Methods: The combination of LC-MS/MS with chemical isobaric labeling enabled the simultaneous quantitative comparison of Trp and its amino group-bearing metabolites in multiple samples. We applied this method to the sera of a cohort of 43 recurrent glioblastoma patients and 43 age- and sex-matched healthy controls. Tumor volumes were measured in MRI data using an artificial neural network-based approach. MALDI MSI visualized Trp and its direct metabolite N-formylkynurenine (FK) in glioblastoma tissue. Analysis of scRNA-seq data was used to detect the presence of Trp metabolism and AHR activity in different cell types in glioblastoma.
Results: Compared to healthy controls, glioblastoma patients showed decreased serum Trp levels. Surprisingly, the levels of Trp metabolites were also reduced. The decrease became smaller with more enzymatic steps between Trp and its metabolites, suggesting that Trp availability controls the levels of its systemic metabolites. High tumor volume associated with low systemic metabolite levels and low systemic kynurenine levels associated with worse overall survival. MALDI MSI demonstrated heterogeneity of Trp catabolism across glioblastoma tissues. Analysis of scRNA-seq data revealed that genes involved in Trp metabolism were expressed in almost all the cell types in glioblastoma and that most cell types, in particular macrophages and T cells, exhibited AHR activation. Moreover, high AHR activity associated with reduced overall survival in the glioblastoma TCGA dataset.
Conclusion: The novel techniques we developed could support the identification of patients that may benefit from therapies targeting TCEs or AHR activation.
Keywords: Glioblastoma, tryptophan, AHR, mass spectrometry, MALDI MSI
Introduction
Glioblastoma is the most common and most aggressive primary brain cancer in adults. Despite standard of care, comprising maximal safe surgical resection and subsequent radio-chemotherapy with the alkylating agent temozolomide, patients with glioblastoma have a dismal prognosis with a median overall survival of only 15 months and less than 5% of patients being alive five years after primary diagnosis [1-3]. Recent controlled clinical trials exploring targeted and immune therapies have not been demonstrated to improve overall survival [3]. The high intertumoral [4] and intratumoral heterogeneity [5, 6], the plasticity of glioblastoma cells [7, 8] and a highly immunosuppressive tumor microenvironment (TME) [9] consisting of macrophages, microglia and MDSCs [10-22] all contribute to the high therapy resistance of this cancer entity.
Tryptophan (Trp) metabolism represents an important mechanism mediating therapy resistance in glioblastoma and other tumor entities [23]. The Trp-catabolic enzymes (TCEs), indoleamine-2,3-dioxygenase 1 and 2 (IDO1 and IDO2) and tryptophan-2,3-dioxygenase (TDO2), which mediate the first step of the kynurenine pathway (KP), are upregulated in diverse cancer entities. IDO1 and TDO2 expression have previously been shown in glioblastoma cell lines [24-29], and in glioblastoma tissue [26, 27, 30-33]. Two mechanisms by which these TCEs contribute to immunosuppression and tumor progression have been proposed: On the one hand, the degradation of Trp can deplete cells and their environment of this essential amino acid thereby mediating immunosuppressive effects in the TME. On the other hand, Trp degradation produces bioactive downstream metabolites. These metabolites, such as kynurenine (Kyn) and kynurenic acid, can activate the aryl hydrocarbon receptor (AHR), a ligand-activated transcription factor that induces the transcription of AHR target genes [34]. In glioblastoma, high TDO2 expression leads to the production of Kyn, which activates the AHR, thereby enhancing cancer cell motility and limiting the proliferation and function of immune cells in the TME [27]. New treatment options targeting IDO1, TDO2 and the AHR [35] are currently tested in clinical trials in diverse tumor entities. Clinical trials of IDO1 inhibitors in glioblastoma are in phase I and II [36]. A non-randomized phase I clinical trial in 17 recurrent glioma patients with the IDO1 inhibitor PF-06840003 showed no responses but disease stabilization in 47% of the patients [37]. In general, TDO2 inhibitors are in preclinical development and combined IDO1/TDO2 inhibitors are in phase I studies. Phase I clinical trials assess AHR inhibitors in advanced solid tumors [35, 38, 39]. Of note, also other therapies modulate Trp catabolism: Radiation and chemotherapy can induce IDO1 expression [40, 41] and immune checkpoint blockade (ICB) with nivolumab increases the Kyn/Trp ratio [42] and induces IDO1 [43].
Thus, a better understanding of Trp metabolism in glioblastoma is required to address therapy resistance and to select the patients that will benefit from treatments targeting TCEs and AHR.
In this study, we investigated Trp metabolism in glioblastoma. Multiple label-free methods have been employed to measure Trp and its metabolites [44, 45]. Here, we introduce a novel multiplex method to measure the levels of Trp and its amino group-bearing downstream metabolites in the sera of recurrent glioblastoma patients and healthy controls. By using amino-reactive isobaric labeling reagents, this novel multiplex method enabled monitoring and comparison of Trp and its metabolites simultaneously in multiple samples in a single liquid chromatography tandem mass spectrometry (LC-MS/MS) run. Trp and surprisingly also its downstream metabolites were decreased in the sera of patients with glioblastoma. In contrast, MALDI mass spectrometry imaging (MSI) demonstrated heterogeneous Trp catabolism in glioblastoma tumor tissues and single cell RNA-sequencing (scRNA-seq) analysis detected Trp metabolism in all cell types present in glioblastoma.
Materials and Methods
TCGA and GTEx datasets
TCGAbiolinks [46] was used to download the harmonized HT-Seq counts and fragments per kilobase of transcript per million mapped reads (FPKM) and the clinical information of The Cancer Genome Atlas (TCGA) glioblastoma (GBM) datasets from Genomic Data Commons (GDC) (https://gdc.cancer.gov/). Patient samples characterized as “primary tumor” were retained (n = 156). Additional assignment of TCGA GBM patients to their transcriptional subtypes was retrieved from Wang et al. [8]. The FPKM values were converted to transcripts per million (TPMs) [47]. TPM data of normal brain tissues (n = 1671) were downloaded from the Genotype-Tissue Expression (GTEx) dataset (https://gtexportal.org/home/). All TPM values were log2 transformed. RNA-seq counts were saved in DGELists [48], and then the expression matrices were filtered to retain genes that had at least 10 counts across all samples. The filtered expression matrices were normalized by trimmed mean of M values (TMM) normalization [49], followed by variance modeling using voom [50].
The correlation between the expression of selected AHR target genes and that of IDO1 or TDO2, using the normalized count matrix of the TCGA GBM dataset, was determined by calculating Pearson's correlation coefficient.
scRNA-seq data
The smart-seq2 glioblastoma dataset GSE131928 was directly downloaded from the Gene Expression Omnibus (GEO), and the respective metadata was obtained from Neftel et al. [7]. All pediatric samples were filtered out resulting in a total number of 20 adult patients and a total of 5742 cells. The TPM expression matrix and the metadata were saved into a SingleCellExperiment object [51]. The expression matrix and metadata matrix were further analyzed using scanpy [52]. In brief, the expression matrix was log transformed (log(TPM+1)), and the top 5000 highly variable genes (HVGs) were selected as described by Satija et al. [53]. Principle component analysis was performed on the HVGs and the first six principle components were used to create the embedded neighborhood graph. Clustering of the neighborhood graph was performed by the Louvain algorithm [54, 55], followed by partition-based graph abstraction (PAGA) [56]. PAGA generates a simpler representation of the manifold data that remains faithful to the data topology, which is used for the uniform manifold approximation and projection (UMAP) representation [57, 58]. Marker genes described for oligodendrocytes, macrophages and T cells were used to define the malignant and different non-malignant cell populations [7].
Biological process activity scores
The Kyoto Encyclopedia of Genes and Genomes (KEGG) [59] gene set of the tryptophan metabolic pathway (hsa00380) was downloaded from the MSigDb database (v6) [60], in addition to the gene sets describing the six different cell states described in Neftel et al. [7], and the AHR gene signature from Sadik et al. [43]. The gene sets were used to estimate a normalized enrichment score for their respective biological process activity (BPA) score [61, 62] in the bulk or scRNA data. For comparing the state of activity of Trp metabolism or AHR activity, the BPA scores were grouped and compared across the TCGA GBM-defined clusters (classical, mesenchymal, and proneural) [8]. For the Louvain-defined cell populations the median BPA score was estimated and used for the comparison of Trp metabolism, the different cell states and AHR activity. BPA scores were generated using the macrophage signatures described in Newman et al. [63] to characterize the macrophage populations of the scRNA dataset.
Software and statistics
The association between AHR activity and patient survival was analyzed by applying a univariate Cox regression model and a multivariate Cox regression model of AHR activity and patient age at diagnosis. For bioinformatics analysis of TCGA, GTEx and scRNA-seq data, unless stated otherwise, all pairwise comparisons were performed using Kruskal-Wallis and Wilcoxon rank-sum tests. All analyses were run in R, version 3.6.1 (https://cran.r-project.org/), and Bioconductor version 3.9 (https://bioconductor.org/). All graphical representations were generated using ggplot2, ggpubr, corrplot, gplots, gridExtra, and RcolorBrewer.
Mathematical modeling of Trp metabolism
To simulate Trp metabolism in healthy brain tissue and glioblastoma tissue, we used the mathematical model of human Trp metabolism previously published by Stavrum et al. [64]. RNA-seq expression data generated from the GTEx and TCGA databases were integrated into the mathematical model as described in Schäuble et al. [65]. The steady state calculation of metabolite concentrations and reaction fluxes was done using COPASI 4.28 [66]. Samples that had missing expression values for genes represented in the mathematical model of Trp metabolism were removed. An additional outlier correction using robust regression and outlier removal (ROUT) [67] was performed with GraphPad Prism software (Version 8.0, GraphPad Software, Inc.). The concentration of extracellular Trp was set to 0.01 mM, corresponding to the upper bound of free Trp concentrations measured in blood [68]. Graphical and statistical analyses of model calculated metabolite concentrations were performed with GraphPad Prism software (Version 8.0). Data are mean +/- SEM. Data were analyzed with two-tailed unpaired Student's t test.
Human serum and tissue samples
Blood samples from patients with recurrent glioblastoma or from healthy controls were taken after informed consent and approval of the local regulatory authorities (ethics board approval S-496/2014). Blood was centrifuged at 4 °C for 10 min at 2000 g to obtain serum. Collected serum was directly transferred on dry ice and was stored at -80 °C until further analysis.
Tissue specimens of patients diagnosed with glioblastoma were obtained from the Institute of Neuropathology, Heidelberg University Hospital, according to the regulations of the Tissue Bank of the National Center for Tumor Diseases (NCT), Heidelberg University Hospital, under the ethics board approvals S-207/2005 and S-322/2019.
Metabolite measurements with liquid chromatography tandem mass spectrometry (LC-MS/MS) combined with isobaric chemical labeling
Tandem mass tag (TMT®)-labeling of tryptophan and its metabolites
L-tryptophan (Trp), 5-hydroxy (OH)-L-tryptophan (OH-Trp), kynurenine (Kyn), 3-OH-kynurenine (OH-Kyn), anthranilic acid (AA), and 3-OH-anthranilic acid (OH-AA) (Sigma-Aldrich), and N-formylkynurenine (FK) (ChemCruz) were labeled with TMT® reagent 127 (Proteome Sciences) at a concentration of 15 mM in 100 mM triethylammonium bicarbonate (TEAB; Fluka) for 1 h and the labeling reaction was stopped by addition of hydroxylamine (Sigma-Aldrich) to 0.25%. Analytes were diluted as appropriate in 2% acetonitrile (ACN; LichroSolv, VWR), 0.1% formic acid (FA; VWR) and used for mass spectrometry (MS) measurements.
Protein precipitation
60 µL of each human serum sample and aliquots of a mixed pooled reference sample made by pooling aliquots of 34 individual samples were precipitated with 9.8 µL of 72% trichloroacetic acid (TCA; Merck) and centrifuged at 14000 rpm at room temperature in the Eppendorf centrifuge 5417R for 10 min. All supernatants were taken off (~50 µL) and neutralized with 15 µL of 1M sodium hydroxide (NaOH; Kraft). Then 1M TEAB (Sigma) was added to a final concentration of 100 mM. Neutralized samples were stored at -80 °C until labeling.
TMT®-labeling
TMT®-labeling was performed in four batches of each six TMT® sixplexes on two days. The mixed reference serum samples were labeled with TMT® 131. TMT® 127 was reserved for spiking TMT®-labeled pure substances OH-Trp, OH-Kyn, AA, and OH-AA, and FK to aid assignment of the peak signals where needed. Sera from tumor and control subjects were randomized over the remaining four channels 126, 128, 129, and 130 with two sera from tumor patients and two sera from controls per plex.
The respective TMT® reagent solved in ACN was added to 17.5 mM in the reaction and incubated for 1 h. Aqueous hydroxylamine solution was added to 0.25% and incubated for 30 min. Samples were combined and vials rinsed with 50 µL of 5% ACN, 0.1% trifluoroacetic acid (TFA; Merck) and added to the respective mixtures. The combined volumes were dried in a Speedvac to completion.
Purification of the mixed serum samples
Each dried TMT® sixplex analytical sample corresponds to a total equivalent of 300 µL of serum equivalent (5 x 60 µL). The dried samples were solved in 300 µL of water:ACN 95:5 with 0.1% TFA (buffer A) and 150 µL were used for purification by reversed phase chromatography (Nucleosil 120-5 C18 column, 250 mm x 4.6 mm, Macherey-Nagel) using a Waters 2695 HPLC with UV detection at 214 nm. After loading, the sample was washed 4 min with buffer A. Then, the substances were eluted by increasing the ACN content within 40 min to 55%. The flow rate was kept at 1.5 mL/min over the entire gradient. The fractions eluting from 18-30 min were collected, combined, dried and transferred to mass spectrometric analysis.
Liquid chromatography mass spectrometry (LC-MS)
Samples were measured on a triple quadrupole system coupled to a nano-LC-II (EASY-nLC II TSQ Vantage system; Thermo Fisher Scientific). The samples were resolved in 150 µL 2% ACN, 0.1% FA (1 µL sample = 1 µL mixed supernatant equivalent).
For MS analysis on the Triple Quadrupole TSQ Vantage system the TMT® sixplex samples were re-suspended in 150 µL 2% ACN/0.1% FA.
For analysis of Trp and Kyn, samples were diluted 1:20 and 2 µL (0.1 µL serum equivalent) were injected into the EASY-nLC II TSQ Vantage system while 10 µL of serum equivalent were used for the other, lower abundant, metabolites.
First, samples were loaded on a 2 cm long (OD 360 µm, ID 100 µm) capillary column filled with 5 µm ReproSil-Pur C18-AQ (Dr. Maisch GmbH) for trapping and clean-up. Then, analytes were separated through a 15 cm long (OD 360 µm, ID 75 µm) capillary column filled with 3 µm ReproSil-Pur C18-AQ (Dr. Maisch GmbH) using a 25 min gradient from 15 to 30% ACN in 0.1% FA at 300 nL/min.
Eluting analytes were ionized by nano electrospray at 1.6 kV. The Triple Quadrupole instrument was operated in positive and SRM mode. Capillary temperature was set to 220 °C. Transition parameters for the respective analytes were as stated in Table S1 to Table S7. Transition scan time was calculated at 24 ms. Peak width (FWHM (full width at half maximum)) for Q1 and Q3 were set to 0.5 and 0.7, respectively. Collision gas pressure was set to 1.8 mTorr, chromfilter peak width to 6.0 s and declustering voltage to 5 V. Mean technical coefficients of variation (CV) for the metabolites measured are shown in Table S8.
Processing of SRM data
Data was analyzed in Skyline 3.1 (https://skyline.ms/project/home/software/Skyline/begin.view) [69] using its small molecule capabilities. Fragment ion signals were used for identification verification. Peak integration of TMT® reporter channels was manually edited and areas were exported for further analysis.
Statistical analysis of LC-MS generated data
Data integration and statistical analysis was conducted using internally developed software written in R statistical programming language (Version 3.5.2, http://www.R-project.org).
Data quality control
The data output of skyline contains the peak area for each analyte and the respective TMT® channel. This “raw” data was used for a bioinformatic quality control. For each analyte the areas of the respective channels of each individual sample or reference were plotted against the median areas of the TMT® sixplexes. In an ideal case the plot is linear and has a linear coefficient of ~1. Low quality reference values were replaced using the median values of channels 126, 128, 129, and 130 for each of the respective analytes.
Application of reference design and production of ratio matrix
As to the reference design of the study, ratios of sample/reference were calculated for each analyte of the individual samples. Clinical information of the samples was combined with this analyte matrix.
Exploratory analysis
Exploratory analysis was carried out using principal component analysis, heatmaps and unsupervised clustering of samples (http://www.R-project.org, [70, 71]). The influence of clinical factors on the data was investigated.
Statistical analysis
Prior to statistical analysis 5 pairs of patients and controls had to be excluded due to technical problems or IDH status of patients being mutant. Statistical analysis was conducted using proprietary software FeaST (Proteome Sciences) and was based on linear modeling [72]. To evaluate significance of metabolite regulation we applied moderated t-statistics [73, 74] with option for robust empirical Bayes procedure [74]. The analysis was carried out using the R package LIMMA [73].
The following linear model was used to identify regulated features among 7 metabolites (Trp, OH-Trp, Kyn, OH-Kyn, AA, OH-AA, FK):
logRatio ~ Class + TMTPlex + channel
Here logRatio(i,j) is a matrix of log base 2 ratios log2[X(i,j)/X(ref,j)] of sample i feature j abundance to abundance of reference sample feature j. Factor Class describes the influence of disease and has two levels: control and tumor. To account for technical variance (individual samples have been processed and analyzed in different TMT® sixplex experiments) the linear model was extended by inclusion of TMTPlex factor and factor TMT channel. Significance criterion α was set to 0.05.
Plotting of individual metabolite values
Graphical analyses of individual sample/reference metabolite values were performed using GraphPad Prism software (Version 8.0). Boxplots represent median, 25th and 75th percentile and whiskers maximum and minimal values.
MALDI mass spectrometry imaging (MSI)
Glioblastoma tumor tissue samples were cut into 10 μm thick sections, mounted onto ITO slides (Bruker Daltonik) and stored at -80 °C until further processing. For normalization, eleven layers of 5 µM deuterated tryptophan (Trp-D5) dissolved in 50% methanol were deposited with a flow rate of 10 µL/min onto the slides using a SunCollect sprayer (SunChrom). Subsequently, 2,5-dihydroxybenzoic acid (DHB) matrix was prepared at a concentration of 60 mg/mL in ACN/H2O/TFA (50:49.5:0.5, v/v/v) and matrix coating was performed with a SunCollect sprayer (SunChrom) in five layers in ascending flow rates (10, 15, 20, 20, 20 μL/min). Data acquisition was performed on a 7T Fourier-transform ion cyclotron resonance (FT-ICR) mass spectrometer (MS) (solariX, Bruker Daltonik). The m/z range was set to 150 - 3000 and spectra were acquired at a raster size of 50 µm in positive ion mode by accumulating 200 laser shots per pixel and using a 1 M transient. Spectra were normalized to trp-D5 [75] (normalization to peak maximum at m/z 210.1285 ± 5 ppm) and visualized using SCiLS Lab Version 2021c Pro (Bruker Daltonik).
HE-stainings and annotation of tissue regions
Glioblastoma tumor tissue directly adjacent to the tissue mounted for MALDI MSI was cut into 10 μm sections, mounted on Superfrost PLUS slides (Thermo Scientific) and stored at -80 °C until further processing. Hematoxylin-and-eosin (HE)-stainings were performed. Slides were scanned on an Aperio AT2 Scanner (Aperio Technologies) and photographed using Aperio ImageScope software (v12.2.2.5015, Aperio Technologies). Annotation of tissue regions other than tumor tissue, namely highly vascularized tumor tissue or blood, necrosis, infiltration zone, artefacts was performed using QuPath v0.2.3 [76] by a clinically experienced neuropathologist.
Computational analysis of brain tumor volume
The volumetric measurements of MRI data were performed using an artificial neural network (ANN)-based approach, as described previously [77]. Briefly, this included brain extraction, followed by image registration and segmentation of contrast-enhanced tumor parts and non-contrast-enhanced T2 weighted/fluid attenuated inversion recovery (FLAIR) signal alterations on MRI. Due to lower data quality like incomplete or corrupt data, 7 of the 43 MRI datasets were analyzed via manual tumor segmentation by a radiologist with 4 years of experience in image processing using ITK-SNAP (www.itksnap.org) [78]. Finally, visual inspection was performed for all tumor segmentations to exclude segmentation errors. For each patient, the MRI scan closest to blood sampling was chosen for analysis. Data analysis was approved by the ethics board approvals S-784/2018 and S-496/2014.
Statistical analyses of clinical characteristics and metabolite levels
To determine whether serum metabolite levels were associated with tumor volumes determined by MRI or the cumulative bevacizumab dose received prior to blood collection regression analyses were applied. Metabolite levels were analyzed separately for their relationship with tumor volume or cumulative bevacizumab dose received before blood draw and considered as dependent variables. Analyses were performed in Statistica version 14.0.0 (Tibco Software Inc.). Based on the standardized b-value and its standard error (SE) derived from Statistica, mean ratios (MR) and 95% confidence intervals (CI) were calculated as follows: MR = eb, CI 95% = [e((b-(2x SEb))), e((b+(2x SEb)))]. Data were plotted using Graph Pad Prism software (Version 8.0).
Two-tailed unpaired Student's t tests were used to analyze potential differences in serum metabolite levels related to molecular features of glioblastoma (MGMT promotor methylation status, EGFR amplification status, PTEN loss) or in association to prior treatment with bevacizumab.
Data availability
This study includes no data deposited in external repositories.
Results
Upregulated Trp metabolism associates with AHR activity in glioblastoma tissue
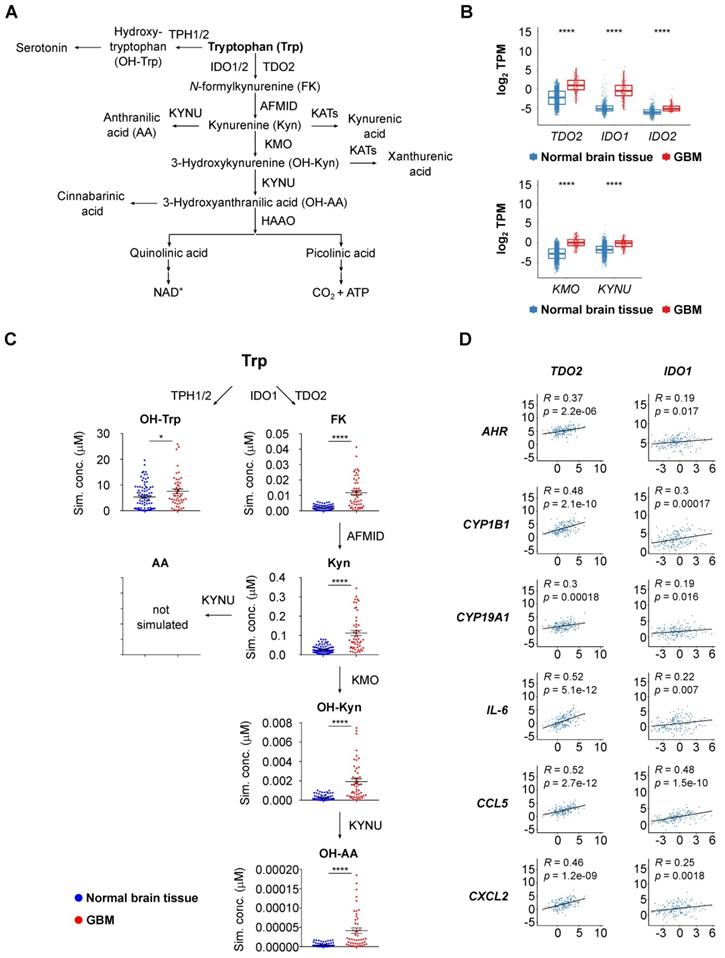
To obtain a first insight into the activity of Trp metabolism in glioblastoma, we analyzed enzyme expression and predicted metabolite abundance in glioblastoma tissue. We found an enhanced transcript expression of TCEs and KP-enzymes in glioblastoma tissue compared to healthy brain tissue (Figure 1A,B, Figure S1A). We next integrated the GTEx normal brain tissue and TCGA glioblastoma (GBM) gene expression data into an extended version of a previously published mathematical model of Trp metabolism that is based on existing kinetic data for the enzymatic conversions and transporters [64]. In line with the results above, the mathematical modeling predicted increased levels of Trp-derived metabolites in glioblastoma tissue (Figure 1C). Trp catabolites activate the AHR and AHR activity can be assessed by induction of AHR target genes. The expression of select AHR target genes, including AHR itself, positively correlated with TDO2 expression (Figure 1D) and to a lesser extent with IDO1 expression (Figure 1D), pointing towards TCE-mediated AHR activation in glioblastoma.
Upregulated Trp metabolism correlates with AHR activity in glioblastoma. (A) Schematic representation of Trp metabolism. (B) Boxplot representation of the expression of select Trp metabolism-associated enzymes in normal brain tissue (blue) (GTEx data) and in glioblastoma (GBM) tissue (red) (TCGA data) represented as log2 transcripts per million (log2 TPM) (Wilcoxon rank-sum test, **** P < 0.0001). (C) RNA-seq data from the GTEx and TCGA databases were integrated into a mathematical model of Trp metabolism to predict the metabolite concentrations in healthy brain or GBM tissue for: OH-Trp, FK, Kyn, OH-Kyn, OH-AA. Data are mean +/- SEM, outliers were excluded with ROUT. Data were analyzed with two-tailed unpaired Student's t test. *P < 0.05, ****P < 0.0001. (D) Pearson's correlation coefficient (R) estimated for the expression of the Trp-degrading enzymes TDO2 or IDO1, and the expression of select AHR target genes in GBM tissue (TCGA data). P values are given as numbers. See also Figure S1. Abbreviations: AA: anthranilic acid; AFMID: arylformamidase; AHR: aryl hydrocarbon receptor; FK: N-formylkynurenine; GBM: glioblastoma; GTEx: Genotype-Tissue Expression; HAAO: 3-hydroxy-anthranilic acid-3,4-dioxygenase; IDO1: indoleamine-2,3-dioxygenase 1; KATs: kynurenine aminotransferases; KMO: kynurenine 3-monooxygenase; Kyn: kynurenine; KYNU: kynureninase; NAD+: nicotinamide adenine dinucleotide; OH-AA: hydroxy-anthranilic acid; OH-Kyn: hydroxy-kynurenine; OH-Trp: hydroxy-tryptophan; R: Pearson's correlation coefficient; RNA-seq: RNA-sequencing; ROUT: robust regression and outlier removal; SEM: Standard error of mean; Sim. conc.: simulated concentrations; TCA: trichloroacetic acid; TCGA: The Cancer Genome Atlas; TDO2: tryptophan-2,3-dioxygenase; TPH1/2: tryptophan hydroxylase 1/2; TPM: transcripts per million; Trp: tryptophan.
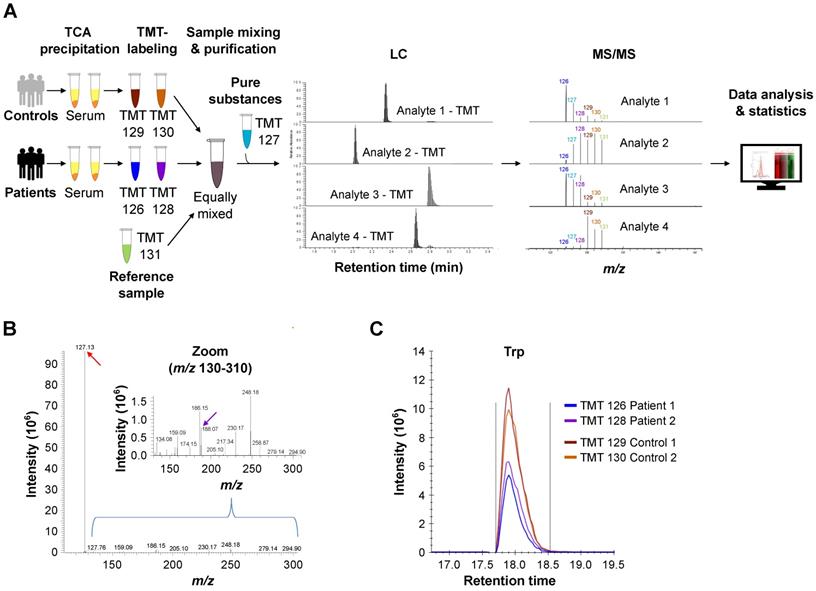
Multiplexed LC-MS/MS combined with isobaric labeling enables sensitive and high-throughput measurement of Trp and its metabolites in human serum
To explore if also systemic Trp metabolism is altered in glioblastoma patients compared to healthy age- and sex-matched controls, we measured Trp and its derivatives in serum. To this end, we developed an innovative multiplexing approach based on the combination of LC-MS/MS with chemical isobaric labeling using tandem mass tags (TMT®) [79] (Figure S1B). The TMT® reagent is composed of an amine-reactive NHS-ester group, a spacer arm and a mass reporter moiety. The different TMT® reagents have the same mass and structure, but contain different numbers of heavy isotopes in the mass reporter region. The fragmentation of the TMT®-labeled analyte produces unique reporter ions, which are used for multiplexed sample quantitation. TMT® reagents are commonly applied in proteomics [79] and have been used to measure amino acids in cell culture [80]. To analyze Trp metabolism in human serum we adapted this approach for a multiplexed relative quantification of Trp and its amino group-containing metabolites, namely hydroxy (OH)-Trp, N-formylkynurenine (FK), Kyn, OH-Kyn, anthranilic acid (AA) and OH-AA. To compare metabolite levels in patients and controls, we measured sixplexes containing two patient and two control serum samples each, as well as a mixture of the pure compounds. In addition, a reference sample was included in each sixplex to enable comparison across different sixplexes. Each sample was labeled with one of six different TMT® sixplex reagents. The mixture of these six samples was subjected to LC-MS/MS analysis, in which the analytes were separated by retention time and mass (Figure 2A). MS/MS fragmentation of the labeled analytes produced reporter ions that allowed for their relative quantitation in each of the six samples (Figure 2A). Of note, the TMT® reporter ions show significantly higher intensities than the (non-labeled) structural fragments of the analyte (Figure 2B), proving that an efficient fragmentation is achieved and that the TMT® reporter ions are ideal for quantitative purposes. This methodic setup further facilitated the distinction of metabolite levels in patient and control sera (Figure 2C). In conclusion, this novel approach enabled us to compare the levels of Trp and its metabolites in the sera of patients and healthy controls with high throughput, sensitivity and accuracy.
Multiplex metabolite measurements applying tandem mass spectrometry in combination with isobaric chemical labeling enable efficient and sensitive measurement of Trp and its downstream metabolites in human sera. (A) Workflow for multiplex measurements of Trp and its downstream metabolites in the sera of patients and controls in sixplexes by tandem mass spectrometry in combination with isobaric chemical labeling employing tandem mass tag (TMT®) reagents. Six individual samples, comprising two control serum samples, two glioblastoma patient samples, one reference serum sample and one sample with a mix of the pure substances, were labeled with six different TMT® reagents, mixed and analyzed by LC-MS/MS. For labeled analytes, reporter ion intensities reflect relative concentrations of the analytes. Spectrum processing was performed with Skyline. (B) Representative MS/MS-spectrum showing a higher TMT® reporter ion intensity (red arrow) in comparison to the (non-labeled) structural fragment intensities (exemplarily m/z 188.07 (violet arrow)) from L-Trp. (C) Representative image of the reporter fragment ion intensities of one plex showing the higher intensities of two control samples (orange and red line) in comparison to two patient samples (blue and violet line). See also Figure S1. Abbreviations: LC-MS/MS: liquid chromatography tandem mass spectrometry; TCA: trichloroacetic acid; TMT®: tandem mass tag; Trp: tryptophan.
The levels of Trp and its metabolites are decreased in the sera of patients with glioblastoma
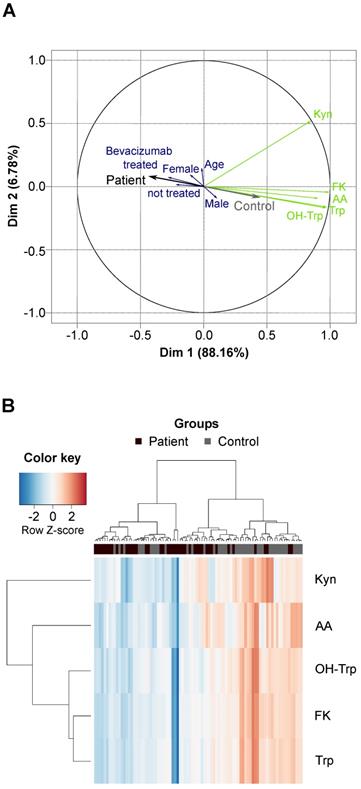
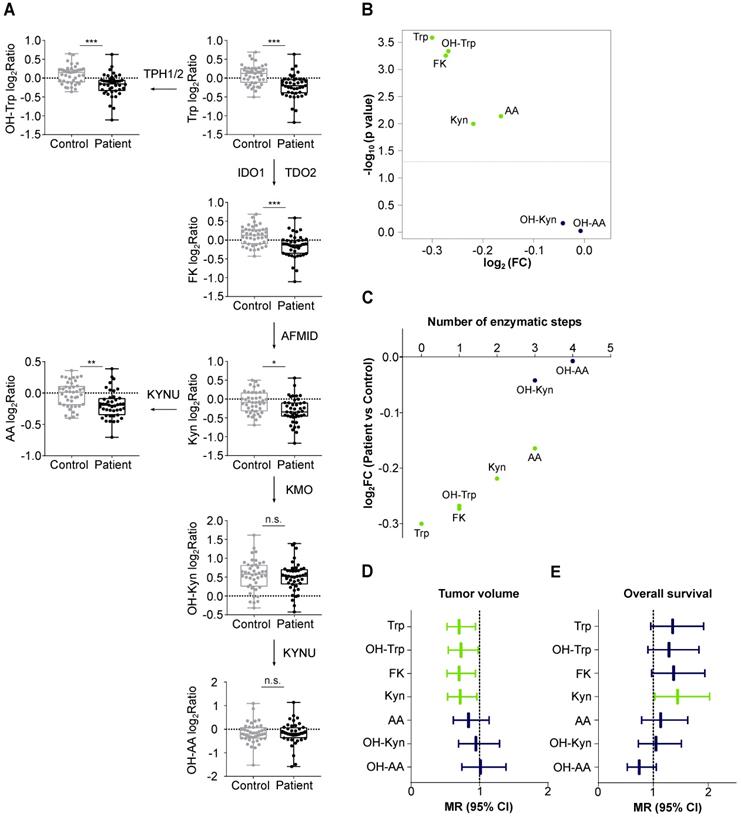
We compared Trp and its metabolites in the sera of 43 patients with recurrent glioblastoma and 43 age- and sex-matched healthy controls (Table S9, Table S10). The high variation of the serum levels of Trp, OH-Trp, FK, Kyn and AA was the main driver of the difference between the patient and control cohorts, while other covariates (e.g. age, sex and prior bevacizumab treatment (bevacizumab treated/not treated)) showed minor contribution to the cohort differences (Figure 3A). An association analysis confirmed that prior bevacizumab intake (Table S11) and the cumulative dose of bevacizumab prior to the study blood draw did not affect metabolite levels (Figure S2). Also, MGMT promotor methylation status, EGFR amplification and PTEN loss showed no effect on metabolite levels (Table S12-S14). Clustering of the sera revealed that the majority of glioblastoma patients displayed lower metabolite levels than the controls (Figure 3B). Only few patients displayed a metabolite profile that clustered better with control profiles, which generally showed slightly higher metabolite levels (Figure 3B). We had expected a decrease of Trp, but an increase of its metabolites. Surprisingly, however, the levels not only of Trp but also of its metabolites OH-Trp, FK, Kyn and AA were significantly lower in patients' sera than in control sera (Figure 3B, Figure 4A,B). Trp levels showed the highest reduction in patients compared to control sera. The more enzymatic steps there were between the metabolites and Trp, the smaller the decrease in the metabolite levels in the patient sera became (Figure 4C, Table S15) pointing towards a prominent role of Trp in controlling the systemic levels of its metabolites. Next, we asked whether the tumor volume affects the systemic levels of Trp and its metabolites. Trp, OH-Trp, FK and Kyn levels in the peripheral blood showed a negative relationship with the tumor volumes determined by MRI analyses (Figure 4D), indicating that a higher tumor volume associated with reduced systemic metabolite levels. In addition, high Kyn levels associated with increased overall survival and there was also a trend for high Trp, OH-Trp and FK levels to associate with better survival (Figure 4E).
Glioblastoma patients and healthy controls separate based on the serum levels of Trp and its metabolites. (A) Principal component analysis bi-plot depicting the contribution of different factors to the variance of the metabolite measurement data. The influence of prior treatment with bevacizumab is depicted as “Bevacizumab treated” or “not treated”. (B) Unsupervised clustering of Trp and four Trp metabolites in patient (n = 43) and control (n = 43) serum samples. See also Figure S2, Table S9-S14. Abbreviation: AA: anthranilic acid; Dim: dimension; FK: N-formylkynurenine; Kyn: kynurenine; OH-Trp: hydroxy-tryptophan; Trp: tryptophan.
Levels of Trp and its metabolites are decreased in the sera of glioblastoma patients and associate with tumor volume. (A) Metabolite abundance of Trp, OH-Trp, FK, Kyn, AA, OH-Kyn, OH-AA in sera of age- and sex-matched controls (grey, n = 43) and glioblastoma patients (black, n = 43) relative to reference sample depicted as log2Ratio. Boxplots show median, 25th and 75th percentile, and whiskers maximal and minimal values. *P < 0.05, **P < 0.01, ***P < 0.001. n.s. not significant. (B) Volcano plot showing log2FC of metabolite levels (x-axis) in patient (n = 43) versus control (n = 43) samples and corresponding -log10 p values (y-axis). Metabolites highlighted in green were significantly decreased in patient versus control sera. (C) Same data depicted as in (B). Metabolite levels in patient versus control samples in log2FC (y-axis) are ordered according to enzymatic steps away from Trp (x-axis). Metabolites highlighted in green were significantly decreased in patient versus control sera. (D) Forest plot depicting the association of metabolite levels in peripheral blood of patients (n = 43) with tumor volume based on MRI analyses. Mean ratio (MR) and 95% confidence intervals (CI) are shown. Green bars represent significant relationships. (E) Forest plot depicting the association of metabolite levels in peripheral blood of patients (n = 32) with overall survival. Mean ratio (MR) and 95% confidence intervals (CI) are shown. Green bar represents significant relationship. See also Table S15. Abbreviations: AA: anthranilic acid; AFMID: arylformamidase; CI: confidence interval; FC: fold change; FK: N-formylkynurenine; IDO1: indoleamine-2,3-dioxygenase 1; KMO: kynurenine 3-monooxygenase; Kyn: kynurenine; KYNU: kynureninase; MR: mean ratio; MRI: magnetic resonance imaging; OH-AA: hydroxy-anthranilic acid; OH-Kyn: hydroxy-kynurenine; OH-Trp: hydroxy-tryptophan; TDO2: tryptophan-2,3-dioxygenase; TPH1/2: tryptophan hydroxylase 1/2; Trp: tryptophan.
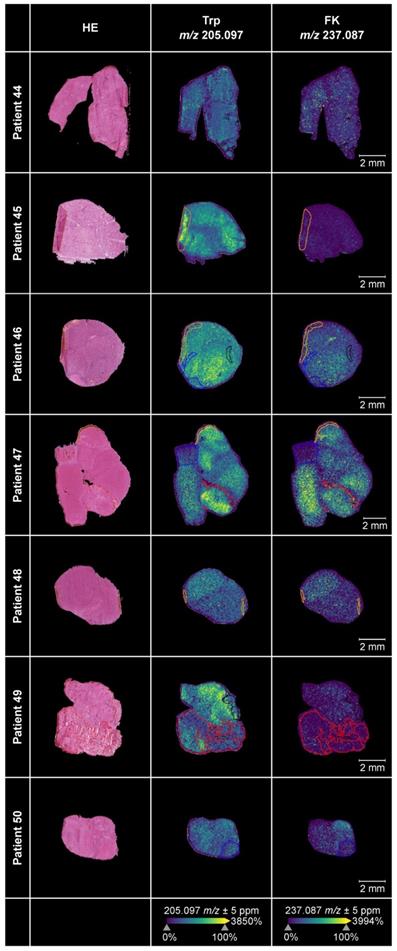
Visualization of the spatial distribution of Trp and its direct metabolite FK in glioblastoma
We employed MALDI MSI to obtain spatial information of the distribution of Trp and its direct downstream metabolite FK in 17 glioblastoma tissue sections. The median age of the glioblastoma patients (n = 6 female, n = 11 males) was 60.82 years and the molecular characteristics of their tumors are shown in Table S16.
For ten of these glioblastomas adjacent sections were available, which we stained with hematoxylin-and-eosin (HE). Projection of different areas identified by HE onto the tissue section used for MALDI MSI was possible in seven samples (Figure 5). This enabled us to confirm that we were indeed measuring vital glioblastoma tissue. Only small regions of the seven glioblastoma sections contained hypervascularized tumor tissue or blood, necrosis, infiltration zone or preparation artefacts. The sections in which projection of different areas was not feasible or the ones without adjacent sections are shown in Figure S3A-S3B. The annotations showed that Trp and its direct downstream metabolite FK, which we used as a marker for Trp catabolism down the KP, were highest in vital tumor tissue as necrotic or hypervascularized tumor tissue areas showed less abundance. Trp was present in all of the glioblastoma tissue samples. Further, many of the glioblastomas metabolized Trp to produce downstream FK. In these samples, Trp was not markedly reduced or consumed but still detectable. In other samples, despite the presence of Trp, hardly any FK was measurable. This hints to differences between glioblastomas that either metabolize Trp to FK or not.
Trp and its metabolite FK in glioblastoma tumor tissue. MALDI MSI of Trp and FK distribution in human glioblastoma samples (middle and right column) and corresponding annotated HE-stained adjacent tissue sections (left column) (n = 7). Displayed are Trp-D5 normalized ion density maps of Trp (m/z 205.097) and FK (m/z 237.087). Trp and FK were measured using a FT-ICR MS in positive ion mode at a raster size of 50 µm. Annotations were drawn in SCiLS Lab; black: necrosis; blue: infiltration zone; red: highly vascularized tumor tissue or blood; yellow: artefacts. See also Figure S3, Table S16. Abbreviations: FK: N-formylkynurenine; FT-ICR MS: Fourier-transform ion cyclotron resonance mass spectrometer; HE: hematoxylin-and-eosin; MSI: mass spectrometry imaging; Trp: tryptophan; Trp-D5: deuterated tryptophan.
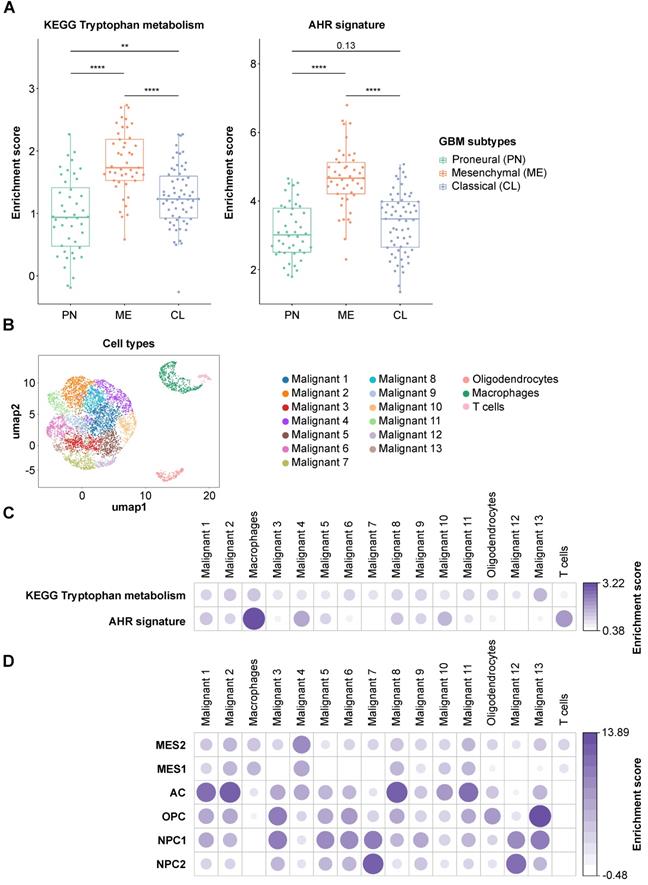
Trp metabolism and AHR activation are present in almost all the cell types in glioblastoma tissue
To assess the difference in Trp metabolism across glioblastoma subtypes, we analyzed the TCGA GBM RNA-seq expression data. The patient samples were grouped according to the transcriptional subtypes described by Wang et al. [8]. Using the KEGG [59] Trp metabolism genes, we generated a per-sample enrichment score reflecting the biological activity of the Trp metabolic pathway in the different glioblastoma subtypes. The mesenchymal subtype showed the highest enrichment of Trp metabolism while the proneural subtype displayed the lowest enrichment scores (Figure 6A, left). In agreement with a role of Trp metabolism in AHR activation, AHR activity, assessed by a pan-tissue signature based on AHR target gene expression [43], was also highest in the mesenchymal subtype (Figure 6A, right). As the mesenchymal subtype is highly infiltrated with immune cells, in particular myeloid cells including microglia and macrophages [81], we went on to analyze which cell types contribute to Trp metabolism and AHR activity in a publicly available scRNA-seq dataset of glioblastoma tissue [7]. The UMAP representation showed four distinct cell populations. Using specific marker genes, we characterized the distinct populations as malignant tumor cells, oligodendrocytes, macrophages and T cells (Figure 6B, Figure S4A). The macrophages present in the dataset primarily showed a strong M2 signature enrichment, almost no M1 signature enrichment and some M0 signature enrichment (Figure S4B). All cell populations present in glioblastoma tissue showed an enrichment of Trp metabolism (Figure 6C). Moreover, in particular macrophages and T cells, but also oligodendrocytes and most of the malignant tumor cell sub-populations showed AHR activation (Figure 6C). Next, we characterized the cell populations according to the cell states defined by Neftel et al. [7]: mesenchymal-like 1 and 2 (MES1/2), astrocyte-like (AC), oligodendrocytic precursor cell-like (OPC) and neural progenitor cell-like 1 and 2 (NPC1/2). Louvain clusters representing the sub-populations of malignant cells enriched with markers for MES1/2 and AC subsets showed rather high AHR activity (e.g. malignant cluster 4 and 10), while malignant cell clusters enriched with markers for NPC1/2 subsets showed no AHR activity (malignant cluster 7 and 12) (Figure 6D). Taken together, Trp metabolism and AHR activation are enriched in most cell populations present in glioblastoma tissue, with a particularly pronounced AHR activation in immune cells. Finally, analysis of the effect of AHR activation on overall survival using the GBM TCGA data revealed that glioblastoma patients showing high AHR activity are at a twofold higher risk of worse overall survival (Table S17).
Trp metabolism and AHR activity are upregulated in tumor cells and in immune cells in glioblastoma. (A) Boxplot representation of the biological process activity (BPA) score in TCGA glioblastoma (GBM) data across the three transcriptional subtypes defined by Wang et al. [8] using gene sets of the KEGG tryptophan metabolic pathway (left) and the AHR activation signature (right) [43]. Group comparisons were performed using Wilcoxon rank-sum test, p values are given as numbers or **P < 0.01, ****P < 0.0001. (B) UMAP representation of the Louvain-clustered cell populations from the scRNA-seq dataset (GSE131928). The scatter shows the different malignant cell clusters and three distinct non-malignant clusters, namely oligodendrocytes, macrophages and T cells. (C) Bubble heatmap representation of the median BPA score of the Louvain clusters defined in (B) for the KEGG tryptophan metabolism pathway and the AHR signature as in (A). (D) Bubble heatmap representation of the median BPA score of the Louvain clusters defined in (B) for the six different cell states of glioblastoma cells defined by Neftel et al. [7]: MES1/2, AC, OPC, NPC1/2. See also Figure S4. Abbreviations: AC: astrocyte-like; AHR: aryl hydrocarbon receptor; BPA: biological process activity; CL: classical; KEGG: Kyoto Encyclopedia of Genes and Genomes; Kyn: kynurenine; ME: mesenchymal; MES1/2: mesenchymal-like 1/2; NPC1/2: neural progenitor cell-like 1/2; OH-Kyn: hydroxy-kynurenine; OPC: oligodendrocytic precursor cell-like; PN: proneural; scRNA-seq: single cell RNA-sequencing; TCGA: The Cancer Genome Atlas; Trp: tryptophan; UMAP: uniform manifold approximation and projection.
Discussion
Immune suppression and escape are increasingly recognized as critical traits of malignancy [82]. During cancer progression, Trp metabolism may represent an important pathway for immune escape, while also promoting the malignant phenotype of cancer cells in an autocrine fashion. The increasing interest in Trp metabolism, which in addition to promoting cancer is involved in controlling autoimmune diseases, immune tolerance and chronic infection [23], prompted us to develop a method for the multiplexed measurement of Trp and its metabolites using tandem mass spectrometry in combination with chemical isobaric labeling using TMT® reagents [79] (Figure 2). Chemical isobaric labeling enabled us to measure multiple amino group-bearing metabolites simultaneously in six samples with high sensitivity, accuracy and efficiency (Figure 2). One key advantage of isobaric labeling over a label-free workflow is the capability of multiplexing and thus preparing and measuring multiple samples simultaneously. Measuring multiple samples in one LC-MS/MS run excludes run-to-run variation for the samples measured and also reduces the number of datasets that need to be processed. Generally, multiplexing reduces sample processing variability because from the moment when samples are mixed the quantitative pattern is conserved as all (unavoidable) variations in steps like e.g. purification, fractionation, solving, loading, and LC-separation affect the mixed samples equally. The current available isobaric chemical tags facilitate the simultaneous analysis of up to 18 experimental samples [83], which significantly enhances throughput and reduces turnaround time. Moreover, isobaric labeling can be easily adapted for high-throughput measurements as sample preparation can be parallelized and automated. Furthermore, absolute quantitation of Trp and its metabolites could be achieved by calibration with internal standards.
Analysis of glioblastoma sera using this novel multiplex method revealed that in patients with glioblastoma systemic Trp availability is limited to a degree that leads to a reduction of its metabolites. Of note, we were able to measure reduced levels of Trp and its metabolites in the sera of glioblastoma patients compared to healthy controls (Figure 3, Figure 4), despite the fact that blood sampling from neither was controlled for time of blood draw or fasting before sampling. Hence, the observed effects appear to be rather robust and stable. Among the metabolites analyzed, Trp was most strongly reduced in the sera of glioblastoma patients. The low Trp levels in glioblastoma patients could potentially contribute to the poor response of glioblastoma patients to immune checkpoint blockade [84] as a recent study in mice showed that low systemic Trp levels decreased efficacy of anti-cancer therapy with immune checkpoint inhibitors [85]. Moreover, the decrease of the Trp metabolites was stronger the less enzymatic steps separated them from Trp (Figure 4C), suggesting that the availability of Trp as an enzyme substrate determined the systemic levels of its metabolites. While a reduction in Trp has previously been reported in the blood of patients with glioblastoma [27, 86, 87], only the analysis of Trp in combination with multiple of its metabolites enabled us to identify Trp as the limiting factor for the systemic levels of its metabolites in glioblastoma patients. This underscores the advantage of analyzing multiple constituents of a metabolic pathway rather than single metabolites.
Before performing this study, we had anticipated systemic Kyn levels to be a surrogate marker for high Kyn levels in the tumor. However, our results revealed that systemic Trp metabolites do not appear to derive from the tumor but that systemic Trp levels control the levels of its downstream metabolites including Kyn in the periphery. This may explain why high systemic Kyn levels associated with better overall survival in our glioblastoma patient cohort (Figure 4E). Moreover, regression analysis of tumor volumes and metabolite levels of glioblastoma patients revealed a negative correlation between these two parameters, indicating that larger tumors are associated with a stronger systemic reduction in Trp and its metabolites (Figure 4D). This is in line with the observation that Trp and Kyn levels increase after surgery in glioblastoma patients [86] and suggests a link between the tumor and systemic metabolite levels. Measurement of Trp and its metabolites could be of clinical interest if their systemic levels enabled the selection and monitoring of patients for treatment with drugs interfering with Trp catabolism or AHR activation. By enabling the precise comparison of Trp and its metabolites in different samples, while being time efficient with up to 18 samples measurable in a single experiment, the novel Trp multiplex method we developed would be ideally suited for this application.
Using MALDI MSI we spatially visualized the distribution of Trp and FK in glioblastoma tissue. Trp was present in all glioblastoma sections, and its direct metabolite FK was detectable in many but not all glioblastomas (Figure 5, Figure S3). Trp was not reduced in glioblastomas that degraded Trp to FK, while in other samples, despite the presence of Trp, hardly any FK was measurable. This heterogeneity, that may also underlie the outliers observed in our serum measurements (Figure 3), prompted us to analyze Trp metabolism across different types of glioblastoma. As we initially had observed an association between the expression of Trp-degrading enzymes and AHR activity, we made use of the pan-tissue AHR signature we previously developed [43] to also assess AHR activity. Confirming and expanding the results of others and us [25, 29, 88], we found that in addition to Trp metabolism also AHR activity is highest in the mesenchymal subtype of glioblastoma (Figure 6A). The increased activity of AHR in mesenchymal glioblastoma is of particular interest, as this subtype does not differ in AHR expression from the other glioblastoma subtypes [89], suggesting that it is not the abundance of the transcription factor, but that of its potentially Trp-derived agonists that leads to the increase in AHR activity in mesenchymal glioblastoma. As mesenchymal glioblastoma is characterized by high infiltration with immune cells, we went on to analyze publicly available single cell RNA-seq data of glioblastoma [7] for Trp metabolism and AHR activity in order to identify the cell types contributing to these processes. Our analysis of this dataset revealed that all the cell types identified in glioblastoma in the single cell analysis showed enriched Trp metabolism, including immune cells, namely macrophages and T cells, oligodendrocytes as well as all the malignant cell clusters (Figure 6C). These results suggested that Trp metabolism could activate the AHR in an autocrine or paracrine manner. However, the presence of transcripts of Trp-metabolizing enzymes does not indicate if sufficient concentrations of metabolites accumulate to activate the AHR. AHR activity in glioblastoma was upregulated particularly in macrophages and T cells, but to a lesser extent also in oligodendrocytes and all but two malignant cell clusters. In agreement with the results of the bulk RNA-seq data, Louvain clusters of the malignant cells with high enrichment for astrocyte-like markers and mesenchymal-like markers in the scRNA-seq dataset were the ones that showed high AHR activity, while in those enriched for neural progenitor cell-like markers AHR activity was absent (Figure 6D). As AHR activity in tumor-associated macrophages and in T cells has previously been shown to promote tumor progression by diverse mechanisms including the upregulation of adenosine production [89] and immune checkpoint molecule expression [90], these results suggest that Trp metabolism and AHR activation in glioblastoma may contribute to glioblastoma immune evasion. However, AHR activation does not always necessarily promote cancer as it also exerts tumor-suppressive effects and has been shown to inhibit tumor formation [91-93] and metastasis [94-96]. These divergent effects of the AHR in cancer likely stem from the complexity of its activation and effects, which are cell type-, ligand- and context-specific [43, 97].
In conclusion, the novel techniques we developed to characterize Trp metabolism in biological fluids as well as tumor tissue could support the identification and monitoring of patients that may benefit from therapies altering the generation of Trp metabolites or AHR activation.
Abbreviations
AA: anthranilic acid; AC: astrocyte-like; ACN: acetonitrile; AFMID: arylformamidase; AHR: aryl hydrocarbon receptor; ANN: artificial neural network; BPA: biological process activity; CCBL: cysteine conjugate beta lyase; CE: collision energy; CI: confidence intervals; CL: classical; Coef.: coefficient; CV: coefficient of variation; DHB: 2,5-dihydroxybenzoic acid; Dim: dimension; EGFR: epidermal growth factor receptor; F: female; FA: formic acid; FC: fold change; FK: N-formylkynurenine; FLAIR: fluid attenuated inversion recovery; FPKM: fragments per kilobase of transcript per million mapped reads; FT-ICR: Fourier-transform ion cyclotron resonance; FWHM: full width at half maximum; GBM: glioblastoma; GEO: Gene Expression Omnibus; GTEx: Genotype-Tissue Expression; HAAO: 3-hydroxy-anthranilic acid-3,4-dioxygenase; HE: hematoxylin-and-eosin; HVGs: highly variable genes; ICB: immune checkpoint blockade; IDH: isocitrate dehydrogenase; IDO1/2: indoleamine-2,3-dioxygenase 1 and 2; KATs: kynurenine aminotransferases; KEGG: Kyoto Encyclopedia of Genes and Genomes; KMO: kynurenine 3-monooxygenase; KP: kynurenine pathway; Kyn: kynurenine; KYNU: kynureninase; LC: liquid chromatography; M: male; ME: mesenchymal; MES1/2: mesenchymal-like 1 and 2; MGMT: O6-methylguanine-DNA methyltransferase; MR: mean ratio; MS: mass spectrometry; MSI: mass spectrometry imaging; MS/MS: tandem mass spectrometry; n.a.: not applicable, clinical data not available; NAD+: nicotinamide adenine dinucleotide; NaOH: sodium hydroxide; NPC1/2: neural progenitor cell-like 1 and 2; OH-AA: hydroxy-anthranilic acid; OH-Kyn: hydroxy-kynurenine; OH-Trp: hydroxy-tryptophan; OPC: oligodendrocytic precursor cell-like; PAGA: partition-based graph abstraction; PN: proneural; PTEN: phosphatase and tensin homolog; R: Pearson's correlation coefficient; RNA-seq: RNA-sequencing; scRNA-seq: single cell RNA-sequencing; ROUT: robust regression and outlier removal; RT: radiotherapy; SD: standard deviation; SE: standard error; Se.coef.: standard error of the coefficient; SEM: standard error of mean; Sim. conc.: simulated concentrations; TCA: trichloroacetic acid; TCEs: tryptophan-catabolic enzymes; TCGA: The Cancer Genome Atlas; TDO2: tryptophan-2,3-dioxygenase; TEAB: triethylammonium bicarbonate; TFA: trifluoroacetic acid; TME: tumor microenvironment; TMM: trimmed mean of M values; TMT®: tandem mass tag; TMZ: temozolomide; TPH1/2: tryptophan hydroxylase 1/2; TPM: transcripts per million; Trp: tryptophan; Trp-D5: deuterated tryptophan; UMAP: uniform manifold approximation and projection; vs: versus; WT: wild type; Z: Wald test z score, which is the coefficient divided by its standard error.
Supplementary Material
Supplementary figures and tables.
Acknowledgements
We thank the patients and healthy controls for blood donation and we thank the patients and the Department of Neuropathology at Heidelberg University Hospital for the glioblastoma tissue.
We thank Andrea Dormann and Marcela Tanase for their kind support in the clinic and Susanne Spohn and Anja Schumann for their support with clinical data annotation. We thank Katharina Sahm, Mona Laible, Christina Geisbüsch, Anne Berberich and Jonabelle Jansen for patient recruitment.
We thank Jutta Korder, Gitte Böhm, Harald Legner, and Claudia Höhle for technical support. We thank Juliane Weißer for helpful discussions. We thank Laura Dörner and Hai Yen Nguyen for their support with MALDI and HE slide preparation.
We thank Mirja Tamara Prentzell for critical discussions of data.
Data generated by TCGA, and the GTEx project, supported by the Common Fund of the Office of the Director of the NIH was used.
This work was supported by grants from the BMBF e:Med initiative (GlioPATH, 01ZX1402) to S.T. and C.A.O., the Deutsche Forschungsgemeinschaft (DFG, German Research Foundation)-Project-ID 404521405, SFB 1389-UNITE Glioblastoma to P.P., P.V., F.S., A.D., C.H., M.P., W.W. and C.A.O., and 406052676; PL-315/5-1 to M.P., the European Union's Horizon 2020 research and innovation program under grant agreement No. 754688 (MESI-STRAT) to A.S., S.Sh., I.H. and C.A.O., the BMBF and EU frame-work program Horizon 2020 (TRANSCAN-2 ERA-NET, PROMETOV) to S.K., I.P. and C.A.O. V.P. was supported by the DKFZ Clinician Scientist Program and the Dieter Morszeck Foundation, and A.S. by the DAAD.
Author Contributions
V.P. annotated clinical data, analyzed and interpreted data, performed art work and wrote the manuscript. S.K. designed, analyzed and interpreted metabolite measurements, and wrote the manuscript. A.S. collected blood samples, designed, performed and interpreted bioinformatics analyses and wrote the manuscript. D.F. and V.F. designed and performed bioinformatics analyses. T.B., Sa.Sch., St.Sch. and C.H. performed MALDI MSI measurements and analyses. S.T. performed statistical analyses. P.S. annotated and analyzed tissue specimen and molecular data. I.J. collected blood samples. S.J., K.K., S.Se., P.S.K. and I.P. performed metabolite measurements and analysis. I.Pf. and P.V. analyzed MRI data. S.Sh. and I.H. performed mathematical metabolite modeling. A.W. provided clinical data and advice. P.P. analyzed data and performed art work. F.S. and A.D. provided tissue specimens for MALDI MSI. M.P. and W.W. provided blood samples, clinical data and advice. C.A.O. conceived and supervised the study and wrote the manuscript. All the authors read, reviewed and revised the manuscript.
Competing Interests
A.S., S.T. and C.A.O. are listed as inventors on WO/2020/201825, C.A.O., M.P. and W.W. are listed as inventors on WO/2013/034685, S.K., M.P., P.S.K., I.P. and C.A.O. are listed as inventors on WO/2017/072368. S.K., V.F., S.J., K.K., S.Se., P.S.K. and I.P. have been employed or are employed by Proteome Sciences. W.W. receives trial funding from Apogenix, Boehringer Ingelheim, Pfizer and Roche to the institution. He serves on advisory boards for Agios, Bayer, MSD, Novartis, Roche with compensation paid to the institution. The authors not listed above declare that they have no competing interests.
References
1. Wick W, Osswald M, Wick A, Winkler F. Treatment of glioblastoma in adults. Ther Adv Neurol Disord. 2018;11:1756286418790452
2. Ostrom QT, Patil N, Cioffi G, Waite K, Kruchko C, Barnholtz-Sloan JS. CBTRUS statistical report: primary brain and other central nervous system tumors diagnosed in the United States in 2013-2017. Neuro Oncol. 2020;22:iv1-iv96
3. Weller M, van den Bent M, Preusser M, Le Rhun E, Tonn JC, Minniti G. et al. EANO guidelines on the diagnosis and treatment of diffuse gliomas of adulthood. Nat Rev Clin Oncol. 2021;18:170-186
4. Verhaak RG, Hoadley KA, Purdom E, Wang V, Qi Y, Wilkerson MD. et al. Integrated genomic analysis identifies clinically relevant subtypes of glioblastoma characterized by abnormalities in PDGFRA, IDH1, EGFR, and NF1. Cancer Cell. 2010;17:98-110
5. Sottoriva A, Spiteri I, Piccirillo SG, Touloumis A, Collins VP, Marioni JC. et al. Intratumor heterogeneity in human glioblastoma reflects cancer evolutionary dynamics. Proc Natl Acad Sci U S A. 2013;110:4009-14
6. Patel AP, Tirosh I, Trombetta JJ, Shalek AK, Gillespie SM, Wakimoto H. et al. Single-cell RNA-seq highlights intratumoral heterogeneity in primary glioblastoma. Science. 2014;344:1396-401
7. Neftel C, Laffy J, Filbin MG, Hara T, Shore ME, Rahme GJ. et al. An integrative model of cellular states, plasticity, and genetics for glioblastoma. Cell. 2019;178:835-49 e21
8. Wang Q, Hu B, Hu X, Kim H, Squatrito M, Scarpace L. et al. Tumor evolution of glioma-intrinsic gene expression subtypes associates with immunological changes in the microenvironment. Cancer Cell. 2017;32:42-56 e6
9. Lim M, Xia Y, Bettegowda C, Weller M. Current state of immunotherapy for glioblastoma. Nat Rev Clin Oncol. 2018;15:422-42
10. De Leo A, Ugolini A, Veglia F. Myeloid cells in glioblastoma microenvironment. Cells. 2020;10:18
11. Gabrusiewicz K, Rodriguez B, Wei J, Hashimoto Y, Healy LM, Maiti SN. et al. Glioblastoma-infiltrated innate immune cells resemble M0 macrophage phenotype. JCI Insight. 2016;1:e85841
12. Gielen PR, Schulte BM, Kers-Rebel ED, Verrijp K, Petersen-Baltussen HM, ter Laan M. et al. Increase in both CD14-positive and CD15-positive myeloid-derived suppressor cell subpopulations in the blood of patients with glioma but predominance of CD15-positive myeloid-derived suppressor cells in glioma tissue. J Neuropathol Exp Neurol. 2015;74:390-400
13. Mi Y, Guo N, Luan J, Cheng J, Hu Z, Jiang P. et al. The emerging role of myeloid-derived suppressor cells in the glioma immune suppressive microenvironment. Front Immunol. 2020;11:737
14. Müller S, Kohanbash G, Liu SJ, Alvarado B, Carrera D, Bhaduri A. et al. Single-cell profiling of human gliomas reveals macrophage ontogeny as a basis for regional differences in macrophage activation in the tumor microenvironment. Genome Biol. 2017;18:234
15. Lakshmanachetty S, Cruz-Cruz J, Hoffmeyer E, Cole AP, Mitra SS. New insights into the multifaceted role of myeloid-derived suppressor cells (MDSCs) in high-grade gliomas: from metabolic reprograming, immunosuppression, and therapeutic resistance to current strategies for targeting MDSCs. Cells. 2021;10:893
16. Bayik D, Zhou Y, Park C, Hong C, Vail D, Silver DJ. et al. Myeloid-derived suppressor cell subsets drive glioblastoma growth in a sex-specific manner. Cancer Discov. 2020;10:1210-25
17. Otvos B, Silver DJ, Mulkearns-Hubert EE, Alvarado AG, Turaga SM, Sorensen MD. et al. Cancer stem cell-secreted macrophage migration inhibitory factor stimulates myeloid derived suppressor cell function and facilitates glioblastoma immune evasion. Stem Cells. 2016;34:2026-39
18. Gabriely G, Quintana FJ. Role of AHR in the control of GBM-associated myeloid cells. Semin Cancer Biol. 2020;64:13-8
19. Hambardzumyan D, Gutmann DH, Kettenmann H. The role of microglia and macrophages in glioma maintenance and progression. Nat Neurosci. 2016;19:20-7
20. Hara T, Chanoch-Myers R, Mathewson ND, Myskiw C, Atta L, Bussema L. et al. Interactions between cancer cells and immune cells drive transitions to mesenchymal-like states in glioblastoma. Cancer Cell. 2021;39:779-92.e11
21. Darmanis S, Sloan SA, Croote D, Mignardi M, Chernikova S, Samghababi P. et al. Single-cell RNA-seq analysis of infiltrating neoplastic cells at the migrating front of human glioblastoma. Cell Rep. 2017;21:1399-410
22. Klemm F, Maas RR, Bowman RL, Kornete M, Soukup K, Nassiri S. et al. Interrogation of the microenvironmental landscape in brain tumors reveals disease-specific alterations of immune cells. Cell. 2020;181:1643-60.e17
23. Platten M, Nollen EAA, Rohrig UF, Fallarino F, Opitz CA. Tryptophan metabolism as a common therapeutic target in cancer, neurodegeneration and beyond. Nat Rev Drug Discov. 2019;18:379-401
24. Miyazaki T, Moritake K, Yamada K, Hara N, Osago H, Shibata T. et al. Indoleamine 2,3-dioxygenase as a new target for malignant glioma therapy. Laboratory investigation. J Neurosurg. 2009;111:230-7
25. Kesarwani P, Prabhu A, Kant S, Chinnaiyan P. Metabolic remodeling contributes towards an immune-suppressive phenotype in glioblastoma. Cancer Immunol Immunother. 2019;68:1107-20
26. Pilotte L, Larrieu P, Stroobant V, Colau D, Dolusic E, Frederick R. et al. Reversal of tumoral immune resistance by inhibition of tryptophan 2,3-dioxygenase. Proc Natl Acad Sci U S A. 2012;109:2497-502
27. Opitz CA, Litzenburger UM, Sahm F, Ott M, Tritschler I, Trump S. et al. An endogenous tumour-promoting ligand of the human aryl hydrocarbon receptor. Nature. 2011;478:197-203
28. Mohapatra SR, Sadik A, Tykocinski LO, Dietze J, Poschet G, Heiland I. et al. Hypoxia inducible factor 1alpha inhibits the expression of immunosuppressive tryptophan-2,3-dioxygenase in glioblastoma. Front Immunol. 2019;10:2762
29. Kudo T, Prentzell MT, Mohapatra SR, Sahm F, Zhao Z, Grummt I. et al. Constitutive expression of the immunosuppressive tryptophan dioxygenase TDO2 in glioblastoma is driven by the transcription factor C/EBPβ. Front Immunol. 2020;11:657
30. Uyttenhove C, Pilotte L, Theate I, Stroobant V, Colau D, Parmentier N. et al. Evidence for a tumoral immune resistance mechanism based on tryptophan degradation by indoleamine 2,3-dioxygenase. Nat Med. 2003;9:1269-74
31. Guastella AR, Michelhaugh SK, Klinger NV, Fadel HA, Kiousis S, Ali-Fehmi R. et al. Investigation of the aryl hydrocarbon receptor and the intrinsic tumoral component of the kynurenine pathway of tryptophan metabolism in primary brain tumors. J Neurooncol. 2018;139:239-49
32. Hoffmann D, Dvorakova T, Stroobant V, Bouzin C, Daumerie A, Solvay M. et al. Tryptophan 2,3-dioxygenase expression identified in human hepatocellular carcinoma cells and in intratumoral pericytes of most cancers. Cancer Immunol Res. 2020;8:19-31
33. Du L, Xing Z, Tao B, Li T, Yang D, Li W. et al. Both IDO1 and TDO contribute to the malignancy of gliomas via the Kyn-AhR-AQP4 signaling pathway. Signal Transduct Target Ther. 2020;5:10
34. Gutierrez-Vazquez C, Quintana FJ. Regulation of the immune response by the aryl hydrocarbon receptor. Immunity. 2018;48:19-33
35. Opitz CA, Somarribas Patterson LF, Mohapatra SR, Dewi DL, Sadik A, Platten M. et al. The therapeutic potential of targeting tryptophan catabolism in cancer. Br J Cancer. 2020;122:30-44
36. Platten M, Friedrich M, Wainwright DA, Panitz V, Opitz CA. Tryptophan metabolism in brain tumors - IDO and beyond. Curr Opin Immunol. 2021;70:57-66
37. Reardon DA, Desjardins A, Rixe O, Cloughesy T, Alekar S, Williams JH. et al. A phase 1 study of PF-06840003, an oral indoleamine 2,3-dioxygenase 1 (IDO1) inhibitor in patients with recurrent malignant glioma. Invest New Drugs. 2020;38:1784-1795
38. U.S. National Library of Medicine. ClinicalTrials.gov. NCT04069026. Accessed 05 July 2021. https://clinicaltrials.gov/ct2/show/NCT04069026
39. US National Library of Medicine. ClinicalTrials.gov. NCT04200963. Accessed 05 July 2021. https://clinicaltrials.gov/ct2/show/NCT04200963
40. Choudhary S, Burns SC, Mirsafian H, Li W, Vo DT, Qiao M. et al. Genomic analyses of early responses to radiation inglioblastoma reveal new alterations at transcription,splicing, and translation levels. Sci Rep. 2020;10:8979
41. Creelan BC, Antonia S, Bepler G, Garrett TJ, Simon GR, Soliman HH. Indoleamine 2,3-dioxygenase activity and clinical outcome following induction chemotherapy and concurrent chemoradiation in stage III non-small cell lung cancer. Oncoimmunology. 2013;2:e23428
42. Li H, Bullock K, Gurjao C, Braun D, Shukla SA, Bosse D. et al. Metabolomic adaptations and correlates of survival to immune checkpoint blockade. Nat Commun. 2019;10:4346
43. Sadik A, Somarribas Patterson LF, Ozturk S, Mohapatra SR, Panitz V, Secker PF. et al. IL4I1 is a metabolic immune checkpoint that activates the AHR and promotes tumor progression. Cell. 2020;182:1252-70 e34
44. Fuertig R, Ceci A, Camus SM, Bezard E, Luippold AH, Hengerer B. LC-MS/MS-based quantification of kynurenine metabolites, tryptophan, monoamines and neopterin in plasma, cerebrospinal fluid and brain. Bioanalysis. 2016;8:1903-17
45. Sadok I, Gamian A, Staniszewska MM. Chromatographic analysis of tryptophan metabolites. J Sep Sci. 2017;40:3020-45
46. Colaprico A, Silva TC, Olsen C, Garofano L, Cava C, Garolini D. et al. TCGAbiolinks: an R/Bioconductor package for integrative analysis of TCGA data. Nucleic Acids Res. 2016;44:e71
47. Li B, Dewey CN. RSEM: accurate transcript quantification from RNA-seq data with or without a reference genome. BMC Bioinformatics. 2011;12:323
48. Robinson MD, McCarthy DJ, Smyth GK. edgeR: a Bioconductor package for differential expression analysis of digital gene expression data. Bioinformatics. 2010;26:139-40
49. Robinson MD, Oshlack A. A scaling normalization method for differential expression analysis of RNA-seq data. Genome Biol. 2010;11:R25
50. Law CW, Chen Y, Shi W, Smyth GK. voom: Precision weights unlock linear model analysis tools for RNA-seq read counts. Genome Biol. 2014;15:R29
51. Amezquita RA, Lun ATL, Becht E, Carey VJ, Carpp LN, Geistlinger L. et al. Orchestrating single-cell analysis with Bioconductor. Nat Methods. 2020;17:137-45
52. Wolf FA, Angerer P, Theis FJ. SCANPY: large-scale single-cell gene expression data analysis. Genome Biol. 2018;19:15
53. Satija R, Farrell JA, Gennert D, Schier AF, Regev A. Spatial reconstruction of single-cell gene expression data. Nat Biotechnol. 2015;33:495-502
54. Levine JH, Simonds EF, Bendall SC, Davis KL, Amir el AD, Tadmor MD. et al. Data-driven phenotypic dissection of AML reveals progenitor-like cells that correlate with prognosis. Cell. 2015;162:184-97
55. Blondel VD, Guillaume JL, Lambiotte R, Lefebvre E. Fast unfolding of communities in large networks. J Stat Mech. 2008;2008:P10008
56. Wolf FA, Hamey FK, Plass M, Solana J, Dahlin JS, Göttgens B. et al. PAGA: graph abstraction reconciles clustering with trajectory inference through a topology preserving map of single cells. Genome Biol. 2019;20:59
57. Becht E, McInnes L, Healy J, Dutertre CA, Kwok IWH, Ng LG. et al. Dimensionality reduction for visualizing single-cell data using UMAP. Nat Biotechnol. 2019;37:38-44
58. McInnes L, Healy J, Melville J. UMAP: uniform manifold approximation and projection for dimension reduction. ArXiv. 2018 1802.03426
59. Kanehisa M, Goto S. KEGG: kyoto encyclopedia of genes and genomes. Nucleic Acids Res. 2000;28:27-30
60. Liberzon A, Subramanian A, Pinchback R, Thorvaldsdottir H, Tamayo P, Mesirov JP. Molecular signatures database (MSigDB) 3.0. Bioinformatics. 2011;27:1739-40
61. Ding H, Blair A, Yang Y, Stuart JM. Biological process activity transformation of single cell gene expression for cross-species alignment. Nat Commun. 2019;10:4899
62. Alvarez MJ, Shen Y, Giorgi FM, Lachmann A, Ding BB, Ye BH. et al. Functional characterization of somatic mutations in cancer using network-based inference of protein activity. Nat Genet. 2016;48:838-47
63. Newman AM, Liu CL, Green MR, Gentles AJ, Feng W, Xu Y. et al. Robust enumeration of cell subsets from tissue expression profiles. Nat Methods. 2015;12:453-7
64. Stavrum AK, Heiland I, Schuster S, Puntervoll P, Ziegler M. Model of tryptophan metabolism, readily scalable using tissue-specific gene expression data. J Biol Chem. 2013;288:34555-66
65. Schauble S, Stavrum AK, Bockwoldt M, Puntervoll P, Heiland I. SBMLmod: a Python-based web application and web service for efficient data integration and model simulation. BMC Bioinformatics. 2017;18:314
66. Hoops S, Sahle S, Gauges R, Lee C, Pahle J, Simus N. et al. COPASI-a complex pathway simulator. Bioinformatics. 2006;22:3067-74
67. Motulsky HJ, Brown RE. Detecting outliers when fitting data with nonlinear regression - a new method based on robust nonlinear regression and the false discovery rate. BMC Bioinformatics. 2006;7:123
68. Pardridge WM. The role of blood-brain barrier transport of tryptophan and other neutral amino acids in the regulation of substrate-limited pathways of brain amino acid metabolism. J Neural Transm Suppl. 1979;15:43-54
69. Pino LK, Searle BC, Bollinger JG, Nunn B, MacLean B, MacCoss MJ. The Skyline ecosystem: informatics for quantitative mass spectrometry proteomics. Mass Spectrom Rev. 2020;39:229-44
70. Le S, Josse J, Husson F. FactoMineR: An R package for multivariate analysis. J Stat Softw. 2008;25:1-18
71. Jolliffe IT. Principal component analysis. 2 ed. New York, USA: Springer, New York, NY. 2002
72. Hastie T, Tibshirani R, Friedman J. The elements of statistical learning: data mining, inference, and prediction. 2 ed. New York, USA: Springer-Verlag New York. 2009
73. Ritchie ME, Phipson B, Wu D, Hu YF, Law CW, Shi W. et al. limma powers differential expression analyses for RNA-sequencing and microarray studies. Nucleic Acids Res. 2015;43:e47
74. Phipson B, Lee S, Majewski IJ, Alexander WS, Smyth GK. Robust hyperparameter estimation protects against hypervariable genes and improves power to detect differential expression. Ann Appl Stat. 2016;10:946-63
75. Schulz S, Gerhardt D, Meyer B, Seegel M, Schubach B, Hopf C. et al. DMSO-enhanced MALDI MS imaging with normalization against a deuterated standard for relative quantification of dasatinib in serial mouse pharmacology studies. Anal Bioanal Chem. 2013;405:9467-76
76. Bankhead P, Loughrey MB, Fernández JA, Dombrowski Y, McArt DG, Dunne PD. et al. QuPath: open source software for digital pathology image analysis. Sci Rep. 2017;7:16878
77. Kickingereder P, Isensee F, Tursunova I, Petersen J, Neuberger U, Bonekamp D. et al. Automated quantitative tumour response assessment of MRI in neuro-oncology with artificial neural networks: a multicentre, retrospective study. Lancet Oncol. 2019;20:728-40
78. Yushkevich PA, Piven J, Hazlett HC, Smith RG, Ho S, Gee JC. et al. User-guided 3D active contour segmentation of anatomical structures: significantly improved efficiency and reliability. Neuroimage. 2006;31:1116-28
79. Thompson A, Schafer J, Kuhn K, Kienle S, Schwarz J, Schmidt G. et al. Tandem mass tags: a novel quantification strategy for comparative analysis of complex protein mixtures by MS/MS. Anal Chem. 2003;75:1895-904
80. Murphy JP, Everley RA, Coloff JL, Gygi SP. Combining amine metabolomics and quantitative proteomics of cancer cells using derivatization with isobaric tags. Anal Chem. 2014;86:3585-93
81. Engler JR, Robinson AE, Smirnov I, Hodgson JG, Berger MS, Gupta N. et al. Increased microglia/macrophage gene expression in a subset of adult and pediatric astrocytomas. PLoS One. 2012;7:e43339
82. Hanahan D, Weinberg RA. Hallmarks of cancer: the next generation. Cell. 2011;144:646-74
83. Li J, Cai Z, Bomgarden RD, Pike I, Kuhn K, Rogers JC. et al. TMTpro-18plex: the expanded and complete set of TMTpro reagents for sample multiplexing. J Proteome Res. 2021;20:2964-72
84. Medikonda R, Dunn G, Rahman M, Fecci P, Lim M. A review of glioblastoma immunotherapy. J Neurooncol. 2021;151:41-53
85. Schramme F, Crosignani S, Frederix K, Hoffmann D, Pilotte L, Stroobant V. et al. Inhibition of tryptophan-dioxygenase activity increases the antitumor efficacy of immune checkpoint inhibitors. Cancer Immunol Res. 2020;8:32-45
86. Zhai L, Dey M, Lauing KL, Gritsina G, Kaur R, Lukas RV. et al. The kynurenine to tryptophan ratio as a prognostic tool for glioblastoma patients enrolling in immunotherapy. J Clin Neurosci. 2015;22:1964-8
87. Adams S, Teo C, McDonald KL, Zinger A, Bustamante S, Lim CK. et al. Involvement of the kynurenine pathway in human glioma pathophysiology. PLoS One. 2014;9:e112945
88. Kesarwani P, Prabhu A, Kant S, Kumar P, Graham SF, Buelow KL. et al. Tryptophan metabolism contributes to radiation-induced immune checkpoint reactivation in glioblastoma. Clin Cancer Res. 2018;24:3632-43
89. Takenaka MC, Gabriely G, Rothhammer V, Mascanfroni ID, Wheeler MA, Chao CC. et al. Control of tumor-associated macrophages and T cells in glioblastoma via AHR and CD39. Nat Neurosci. 2019;22:729-40
90. Liu Y, Liang X, Dong W, Fang Y, Lv J, Zhang T. et al. Tumor-repopulating cells induce PD-1 expression in CD8(+) T cells by transferring kynurenine and AhR activation. Cancer Cell. 2018;33:480-94 e7
91. Jin UH, Karki K, Cheng Y, Michelhaugh SK, Mittal S, Safe S. The aryl hydrocarbon receptor is a tumor suppressor-like gene in glioblastoma. J Biol Chem. 2019;294:11342-53
92. Jin UH, Michelhaugh SK, Polin LA, Shrestha R, Mittal S, Safe S. Omeprazole inhibits glioblastoma cell invasion and tumor growth. Cancers (Basel). 2020;12:2097
93. Wu PY, Yu IS, Lin YC, Chang YT, Chen CC, Lin KH. et al. Activation of aryl hydrocarbon receptor by kynurenine impairs progression and metastasis of neuroblastoma. Cancer Res. 2019;79:5550-62
94. Sári Z, Mikó E, Kovács T, Boratkó A, Ujlaki G, Jankó L. et al. Indoxylsulfate, a metabolite of the microbiome, has cytostatic effects in breast cancer via activation of AHR and PXR receptors and induction of oxidative stress. Cancers (Basel). 2020;12:2915
95. Jin UH, Lee SO, Pfent C, Safe S. The aryl hydrocarbon receptor ligand omeprazole inhibits breast cancer cell invasion and metastasis. BMC Cancer. 2014;14:498
96. Nothdurft S, Thumser-Henner C, Breitenbücher F, Okimoto RA, Dorsch M, Opitz CA. et al. Functional screening identifies aryl hydrocarbon receptor as suppressor of lung cancer metastasis. Oncogenesis. 2020;9:102
97. Rothhammer V, Quintana FJ. The aryl hydrocarbon receptor: an environmental sensor integrating immune responses in health and disease. Nat Rev Immunol. 2019;19:184-97
Author contact
![]() Corresponding author: Christiane A. Opitz, E-mail: c.opitzde.
Corresponding author: Christiane A. Opitz, E-mail: c.opitzde.