Impact Factor
- Issue 14; 2026
- Issue 13; 2026
- Issue 12; 2026
- Issue 11; 2026
- Issue 10; 2026
- Volume 16; 2026
- Advance Articles
- Past Issues
- Cover Images
- Cover Suggestion
- Index & Coverage
- Special Issues
Introduction
Methods
Results
Discussion
Conclusions
Abbreviations
Supplementary Material
Acknowledgements
References
International Journal of Biological Sciences
International Journal of Medical Sciences
 Global reach, higher impact

Theranostics 2022; 12(3):1012-1029. doi:10.7150/thno.64734 This issue Cite
Research Paper
Simultaneous imaging of calcium and contraction in the beating heart of zebrafish larvae
Jussep Salgado-Almario1, Manuel Vicente1, Yillcer Molina1, Antonio Martinez-Sielva1, Pierre Vincent2 ![]() , Beatriz Domingo1
, Beatriz Domingo1 ![]() , Juan Llopis1
, Juan Llopis1 ![]()
1. Physiology and Cell Dynamics, Centro Regional de Investigaciones Biomédicas (CRIB) and Facultad de Medicina de Albacete, Universidad de Castilla-La Mancha, C/Almansa 14, 02006 Albacete, Spain.
2. Sorbonne Université, CNRS, Biological Adaptation and Ageing, UMR 8256, F-75005 Paris, France.
Received 2021-7-8; Accepted 2021-11-22; Published 2022-1-1
Abstract

In vivo models of cardiac function maintain the complex relationship of cardiomyocytes with other heart cells, as well as the paracrine and mechanoelectrical feedback mechanisms. We aimed at imaging calcium transients simultaneously with heart contraction in zebrafish larvae.
Methods: To image calcium in beating hearts, we generated a zebrafish transgenic line expressing the FRET-based ratiometric biosensor Twitch-4. Since emission ratioing canceled out the motion artifacts, we did not use myosin inhibitors or tnnt2a morpholinos to uncouple contraction from changes in calcium levels. We wrote an analysis program to automatically calculate kinetic parameters of the calcium transients. In addition, the ventricular diameter was determined in the fluorescence images providing a real-time measurement of contraction correlated with calcium.
Results: Expression of Twitch-4 did not affect the force of contraction, the size of the heart nor the heart rate in 3- and 5-days post-fertilization (dpf) larvae. Comparison of 3 and 5 dpf larvae showed that calcium levels and transient amplitude were larger at 5 dpf, but the fractional shortening did not change. To validate the model, we evaluated the effect of drugs with known effects on cardiomyocytes. Calcium levels and the force of contraction decreased by the L-type calcium channel blocker nifedipine, whereas they increased with the activator Bay-K 8644. Caffeine induced bradycardia, markedly decreased ventricular diastolic calcium levels, increased the size of the calcium transients, and caused an escape rhythm in some larvae.
Conclusions: The Tg(myl7:Twitch-4) line provides a physiological approach to image systolic and diastolic calcium levels in the heart of zebrafish larvae. Since the heart is beating, calcium levels and contraction can be correlated. This line will be a useful tool to address pathophysiological mechanisms in diseases like heart failure and arrhythmia, in cardiotoxicity studies and for drug screening.
Keywords: imaging, calcium, contraction, heart, zebrafish
Introduction
In the heart, electrical excitation triggers a transient Ca2+ influx (ICa,L) through L-type voltage-dependent calcium channels (LTCC). This influx elicits Ca2+ release from the sarcoplasmic reticulum (SR) through ryanodine receptors (RyR). The binding of Ca2+ to myofilaments results in the systolic contraction and ejection of blood. The amplitude and duration of the Ca2+ transient is highly controlled by channels, transporters, and numerous regulatory proteins, and determines the strength of the contraction and overall cardiac performance [1, 2]. Besides, the adrenergic input enhances the heart rate and the response of myofibrils to Ca2+. Systemic factors like blood volume and peripheral resistance, affecting preload and afterload, also influence the cardiac output.
Ca2+ dysregulation in the heart is involved in the pathogenesis of inherited and acquired arrhythmias [3-5]. In heart failure, mishandling of myocyte Ca2+ can occur through several mechanisms: decreased Ca2+ uptake by SR Ca2+ ATPase (SERCA), increased Ca2+ leak from the SR and increased activity of the Na+/ Ca2+ exchanger (NCX1), all reducing SR Ca2+ content [6], or lack of synchronicity due to orphaned RyRs [7]. A common consequence of these disbalances is a blunted Ca2+ transient and systolic dysfunction [6, 7]. The effects of Ca2+ sensitizers (as opposed to Ca2+ mobilizers) as a therapeutic approach to treat congestive heart failure sometimes go beyond their inotropism, acting on other organs with additional benefits for the patients [8]. The study of the interrelation of Ca2+ levels with force is key to evaluate cardiac contractile dysfunction, reserve capacity and the efficiency of therapies. In turn, relaxation and ventricular filling depend on the rate of Ca2+ decay, the sensitivity of myofilaments to Ca2+, the passive mechanical properties of the ventricular walls and the atrio-ventricular pressure difference. Accordingly, altered regulation of diastolic and/or resting Ca2+ seems to be an important factor involved in heart failure with preserved ejection fraction (diastolic dysfunction) [9, 10]. However, little is known about the mechanisms that determine end-diastolic Ca2+, as most methods to measure Ca2+ rely on the fluorescence change in systole relative to diastole. A second reason is that many studies were performed at artificially low pacing rate, when only sarcolemmal fluxes influence diastolic and resting Ca2+ [9].
Given the pivotal role of Ca2+ in the heart, numerous studies mostly in isolated cardiomyocytes have provided a detailed insight of the Ca2+ handling mechanisms in physiology [1] and disease [10]. In vivo models do not allow investigating cellular mechanisms with such precision but preserve the interaction between cardiomyocytes and other cell types in the heart, maintaining their paracrine regulation [11]. They also retain the link of the heart with the circulation and with other organs and allow measurement of cardiac endpoints such as the ejection fraction, stroke volume and cardiac output. Thus, in vivo models of heart function are complementary to studies in the isolated perfused organ and in cells.
Zebrafish embryos, larvae and adults are widely used as in vivo animal models in cardiology [12, 13] despite their morphological differences with humans. Studies of development, pathophysiology, drug screening or toxicology are feasible in this small vertebrate, constituting an attractive alternative to mammalian models and facilitating the goal of reduction in their use in research. Heart rate and the ECG, in particular the QT interval, are similar in zebrafish and human [14, 15]. The ventricular action potential in zebrafish also possesses a long plateau phase and many channels responsible for the action potential in humans are present in zebrafish, particularly for repolarization [14-18]. However, differences in excitation-contraction coupling with the human have also been found [18]. In particular, the contribution of Ca2+ release from the SR to contraction in adult zebrafish cardiomyocytes is controversial. Since the ICa,L current density was found to be about 5-fold larger than in pig or human cardiomyocytes [19], the SR contribution to the Ca2+ transient is probably less than in mammalians. In another study, only 20% of the action potential-induced Ca2+ transient was mediated by release from SR [20]. However, a study in heart slices from adult zebrafish found a substantial role (52 to 54%) of SR Ca2+ release in force generation [21]. To overcome the differences between the fish model and human, steps have been proposed to 'humanize' zebrafish [18, 22].
Many cardiomyopathies and arrhythmias have a genetic base. The zebrafish genome has 70% similarity to human [23] and gene editing techniques can be easily applied [22]. Thus, zebrafish is a suitable model to test in vivo disease gene candidates and to unveil the link between genotype and phenotype, for instance, in post-GWAS functional studies [24]. Several pathophysiological mechanisms elucidated in zebrafish have been confirmed in human induced pluripotent stem cell-derived cardiomyocytes [25]. Furthermore, cardiovascular toxicity is an important cause of drug attrition during drug discovery and withdrawal in clinical phases. Zebrafish has been proposed as an in vivo model in early drug discovery and in cardiotoxicity studies since it is amenable to high throughput screening [22, 26-28]. In one study, zebrafish larvae were found to predict better cardiovascular liabilities in humans than cellular systems [27].
Zebrafish are advantageous to image cardiac function with optical probes, as the heart develops rapidly while the larva is still translucent [29]. Thus, several studies have applied non-invasive Ca2+ imaging techniques in the heart under physiological conditions and pathological modelling. This approach involves the expression of a genetically encoded Ca2+ indicator (GECI), like the single-fluorophore GCaMPs [30], which have been successfully used to image Ca2+ dynamics in embryonic hearts [31, 32]. Although GCaMP imaging is technically simple, the measurement is highly sensitive to movements. Therefore, it required the use of morpholino oligomers against myosin II to stop heart beating. However, since morpholinos are degraded in cells, this limits imaging to 3- or 4-days post-fertilization (dpf), time after which the heart restarts beating. An alternative is the use of myosin II inhibitors like blebbistatin [33] or its analogs to uncouple contraction from Ca2+ transients, an approach not devoid of limitations due to its photosensitivity and degradation. Importantly, the inhibition of contraction prevents the study of the mechanical parameters outlined above and may potentially affect heart physiology and development. We reasoned that a ratiometric Ca2+ biosensor, by acquiring two wavelength bands simultaneously, could allow assessment of Ca2+ levels in moving hearts, since the ratio is able to cancel out what is common in the two images (motion) while preserving what is different (Ca2+) [34-36]. Moreover, this approach would allow correlating Ca2+ levels with motion and contraction during the cardiac cycle, preserving mechano-electrical feedback [37], normal development and ionic expression.
In an earlier report, we screened several ratiometric Ca2+ biosensors with different affinity and kinetic properties to validate their use in the zebrafish larva heart in transient expression experiments [36]. Twitch-4 [38], an Opsanus troponin-C-derived biosensor, provided the largest ratio change during the cardiac cycle with good signal-to-noise. In this work, we have established a transgenic line, Tg(myl7:Twitch-4), to characterize the Ca2+ transients and contraction in beating hearts. We validated this model by testing drugs with known effects in the heart at two developmental stages, 3 and 5 dpf.
Methods
Zebrafish husbandry
Zebrafish were kept in the Center for Animal Experimentation of the Albacete School of Medicine with a light/dark cycle of 14/10 h. Fertilized zebrafish eggs were obtained following standard procedures and maintained in E3 medium (5 mM NaCl, 0.17 mM KCl, 0.33 mM MgSO4, 0.33 mM CaCl2, pH 7.4 in double distilled water) at 28.5 ºC. No methylene blue was added to E3 medium to decrease larva autofluorescence. All animal procedures were carried out in compliance with national and EU regulations (approval document dated 16 March 2020, Consejería de Agricultura, Agua y Desarrollo Rural, Junta de Comunidades de Castilla-La Mancha, Spain).
Generation of transgenic zebrafish lines
The Ca2+ biosensor Twitch-4 [38] and the Ca2+-insensitive FRET construct ECFP-16aa-EYFP [39] were cloned into the pT2A-Tol2-myl7 transposon vector as previously described [36]. To generate stable transgenic zebrafish, single-cell wild-type AB embryos were injected with a mixture of pTol2- myl7:Twitch-4 or pTol2-myl7:ECFP-16aa-EYFP cDNA and transposase mRNA, each at a concentration of 12.5 ng/µL. For transposase mRNA production, the pCS-zT2TP construct [40] was linearized via ApaΙ digestion and in vitro transcription was carried out using the mMESSAGE mMACHINE SP6 kit (Ambion Inc., TX, USA). Injected embryos (F0) were screened by fluorescence in the heart and grown to adulthood. Adult F0 fish were outcrossed to wild-type AB zebrafish to identify founders with insertions in the germline by the cardiac fluorescence in the F1 offspring. To generate the Tg(myl7:Twitch-4) line, fluorescent F1 fish were outcrossed to wild-type AB zebrafish, and F2 embryos expressing Twitch-4 were raised to adulthood and intercrossed to generate the F3 generation. Adult F3 Tg(myl7:Twitch-4) fish were crossed with adult translucent Casper zebrafish (roy-/-; nacre-/-) [41] to obtain F4 embryos. F1 Tg(myl7:ECFP-16aa-EYFP) and F4 Tg(myl7:Twitch-4) heterozygous larvae were used for imaging.
Mounting of larvae for microscopy
Non-anesthetized larvae were embedded in 100 µL of 0.3% low melting point agarose in E3 medium, preheated to 42 ºC, and gelled on 96-well plates with square wells and flat clear bottom (ibidi, Germany) (one larva per well). Larvae at 3 dpf were mounted ventral-side down and 5 dpf larvae right-side down (Figure 1B) to visualize better atrium and ventricle at these two stages. Once the agarose solidified, 100 µL of E3 medium at 28 ºC was added. After mounting, the larvae were incubated on the microscope stage for 30 min at 28 ºC to get a stable heart rate (HR). Where indicated, larvae were treated with 75 µM of the myosin inhibitor para-amino blebbistatin (Optopharma, Hungary) for 2 h before mounting for microscopy.
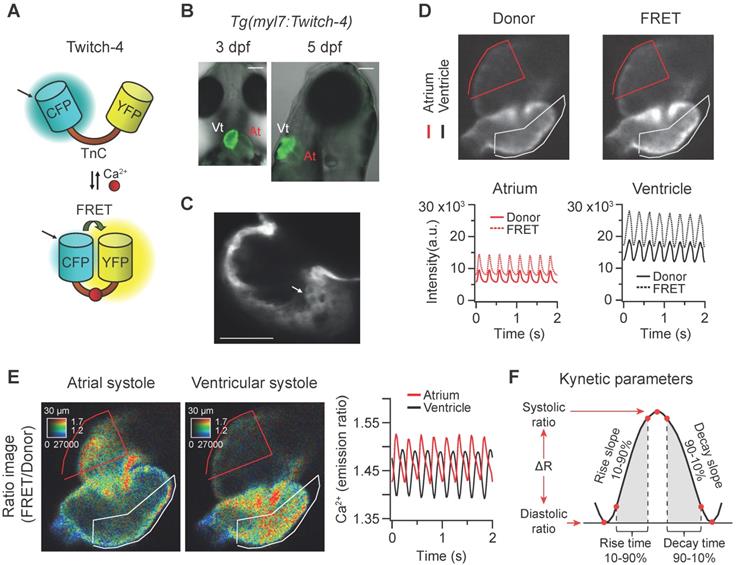
In vivo recording of Ca2+ dynamics in the beating heart of Tg(myl7:Twitch-4) zebrafish larvae. (A) Schematic structure of the Ca2+ biosensor Twitch-4 and its principle of action (FRET, Förster resonance energy transfer). (B) Overlay of transmitted light and fluorescence images of 3 and 5 dpf larvae showing the ventral and lateral orientation of the heart after mounting (At - atrium, Vt - ventricle). The scale bar represents 100 μm. (C) Confocal image of a 3 dpf larva showing the cytoplasmatic localization of Twitch-4 in the cardiomyocytes. The scale bar represents 50 μm. (D) Fluorescence intensity images of the donor and FRET channels of a 3 dpf larva heart in ventricular systole. Regions-of-interest (ROI) were manually drawn on the atrium and ventricle and their mean pixel value was obtained at each timepoint. The traces show the time course of fluorescence intensity of the donor and FRET channels. (E) Emission ratio images (FRET image/donor image) in pseudo color of atrial and ventricular systoles in a 3 dpf larva. The calibration squares show the distance in µm, whereas the hue codes for the emission ratio and intensity codes for the fluorescence intensity. The traces show the atrial and ventricular Ca2+ levels (emission ratios) over time. (F) Kinetic parameters calculated from the ratio time course data (see Methods for their definition).
Ratiometric fluorescence imaging
We acquired fluorescence images of the heart of 3 dpf Tg(myl7:ECFP-16aa-EYFP) larvae, and 3 and 5 dpf Tg(myl7:Twitch-4) larvae with a wide-field fluorescence microscope (DMIRE-2, Leica Microsystems, Germany) equipped with a sCMOS camera (2048 × 2048 pixels, ORCA-Flash 4.0, Hamamatsu Photonics, Japan), controlled by the software Aquacosmos 2.6 (Hamamatsu Photonics, Japan). The image acquisition rate was 50 Hz (20 ms integration per image) during 5-10 s; some larvae were imaged at 100 Hz. Larvae under the microscope stage were kept at 28ºC in a chamber incubator (PeCon GmbH, Germany). To excite the fluorophores, light from a LED source (Lambda TLED+, Sutter Instrument, CA, USA) was applied continuously for 5-10 s using a 440AF21 nm bandpass filter (Chroma, VT, USA) and a beamsplitter 455DLRP (Omega Optical, VT, USA). A 10x air objective (HC PlanApo 0.45 NA, Leica Microsystems, Germany) was used. The donor (CFP) and acceptor (FRET) images were acquired simultaneously with an image splitter (W-View Gemini, Hamamatsu Photonics, Japan), which divided the camera field in two halves corresponding to donor and acceptor emission. Fluorescence emission was separated with beamsplitter (509-FDi01, Semrock, NY, USA) and passed through 483/32 nm and 542/27 nm emission filters (Semrock, NY, USA). Images were acquired in 16 bits with 2 × 2 binning. With this configuration, the resolution of the images was 1.45 µm × 1.45 µm/pixel. The FRET image corresponds to the cpCitrine174 or EYFP emission (542/27 nm) at the donor excitation (440AF21 nm), and the donor image corresponds to the ECFP emission (483/32 nm) at the donor excitation (440AF21 nm).
Drug treatment
For drug response experiments, stock solutions of nifedipine (Sigma-Aldrich N7634), (±)-Bay K8644 (Tocris 1544) and ryanodine (Tocris 1329) were made in dimethyl sulfoxide (DMSO) at concentrations of 10, 20 and 25 mM, respectively. A stock solution of caffeine (Sigma-Aldrich N7634) was made in water at a concentration of 50 mM. Drug stocks were diluted in E3 medium at 28 ºC. After recording the basal images, 100 µL of the drugs were added to the wells, reaching a final concentration of 100 µM for nifedipine, (±)-Bay K 8644 and ryanodine, and 3 mM for caffeine. New sets of images were recorded after the incubation with the drugs, as indicated.
Image processing and data analysis
Ratiometric images and ratio data were processed and analyzed with an analysis program (Ratioscope) written in the IGOR Pro environment (WaveMetrics, OR, USA). We corrected for pixel shift between FRET and donor images. The ratio FRET image/donor image was calculated pixel-by-pixel for each time point. Regions of interest (ROI) were drawn over the atrium and the ventricle walls in diastole. The ratio value for a ROI was calculated by averaging all the pixels' values weighted by the average intensity of donor and FRET channels [34, 35]. Since the ratio for pixels close to background can reach infinite values, pixels with values smaller than the minimum displayed ratio/4 or larger than the maximum displayed ratio×4 were clipped. If necessary, the Savitzky-Golay smoothing filter was applied to reduce the noise in the raw ratio traces. Several kinetic parameters were automatically calculated from the ratio traces: diastolic ratio (the lowest ratio in the cardiac cycle), systolic ratio (the highest ratio in the cardiac cycle), ratio amplitude (ΔR, systolic minus diastolic ratio), heart rate (HR, in bpm), rise time (time from 10 to 90% of systolic Ca2+ rise), decay time (time from 90 to 10% of diastolic Ca2+ decay), rise slope (ΔR from 10 to 90% value, divided by the rise time) and decay slope (ΔR from 90 to 10% value, divided by the decay time) (Figure 1F). The Ca2+ transients and the points of interest indicated in Figure 1F were detected automatically using the edge detection functions provided in the Igor Pro (WaveMetrics) environment and implemented in a custom-made analysis module (“Pulse” module in the “Ratioscope” package) (Figure S1). Data shown for each larva represent the average of all the cardiac cycles in 5 or 10 s of continuous recording. To monitor contractile parameters in Tg(myl7:Twitch-4), we wrote an analysis program in IGOR Pro that automatically detects contraction events (Figure S1) and records changes in the ventricular diameter during the cardiac cycle (Figure 4A). A line drawn through the ventricle in the fluorescence images tracks the movement of the wall and the displacement of the ventricular walls is represented in a kymogram. The FS was calculated as the difference between the end-diastolic and end-systolic diameters, divided by the end-diastolic diameter. The external wall was used to measure the ventricular diameter since the inner wall did not provide sufficient contrast. The program used to calculate all these measurements in the Igor Pro environment is publicly available as “Ratioscope 8.31” on a data repository site at the link: https://doi.org/10.25493/5G5V-HBC.
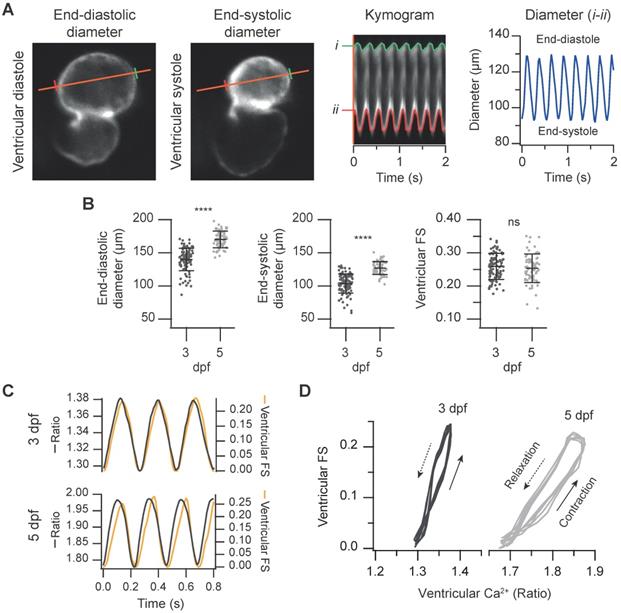
Simultaneous measurement of the ventricular Ca2+ levels and contractile function in 3 and 5 dpf zebrafish larvae. (A) FRET channel images of a representative 3 dpf Tg(myl7:Twitch-4) larva showing end-systolic and end-diastolic ventricular diameters. The kymogram displays the changes of diameter along time (the distance between red and green lines). The trace shows the ventricular diameter extracted from the kymogram. (B) Ventricular end-diastolic and end-systolic diameters, and the ventricular FS of 3 (n = 100, N = 12) and 5 dpf (n = 68, N = 7) Tg(myl7:Twitch-4) larvae. Data are shown as mean ± SD. Statistical analysis was performed as indicated in Supplementary data 1 (**** p < 0.0001). (C) FS and ventricular Ca2+ changes of representative 3 and 5 dpf Tg(myl7:Twitch-4) larvae over time. (D) Diagrams of the ventricular FS vs. ventricular Ca2+ level of the larvae in C during several cardiac cycles. The arrows indicate the direction of time.
Transmitted light images were analyzed manually in ImageJ [42] as previously described [36] to calculate FS, fractional area change (FAC) and HR, where indicated. The FAC was calculated as the difference between the end-diastolic and end-systolic areas, divided by the end-diastolic area.
GCaMP fluorescence imaging
Tg(myl7:GCaMP)s878 adult zebrafish were outcrossed to wild-type strain and fertilized eggs at 1-cell stage were injected with 2 ng of the morpholino oligomer tnnt2a (5'-CATGTTTGCTCTGATCTGACACGCA-3'). Embryos from 24 hours post-fertilization (hpf) were maintained in 0.003% N-phenylthiourea to prevent pigmentation. Larvae were embedded in 1% low melting point agarose and transferred to an 8-well glass bottom plate (ibidi, Germany). Fluorescence images were acquired at a rate of 200 Hz with a CSU X1 spinning disc confocal microscope (Carl Zeiss, Germany) equipped with a Hamamatsu ORCA Flash4.0 sCMOS camera (Hamamatsu Photonics, Japan) in 16 bits with 2 x 2 binning. For image analysis, ROIs were drawn in the atrium and in the ventricle to obtain mean intensity values. An exponentially weighted moving average smoothing with a smoothing factor of 0.7 was applied and data was transformed into ΔF/F0 = (Ft - F0)/F0; where Ft is the fluorescence at a given time and F0 is the minimum diastolic fluorescence value. For characterization of the Ca2+ transients, ΔF/F0 data were analyzed with Clampfit 10.7 (Molecular Devices, CA, USA) to determine rise time 10% to 90% and decay time 90% to 10%.
Cardioluminescence
The zebrafish line Tg(myl7:GFP-Aequorin) was used to compare averaged Ca2+ in 3 and 5 dpf larvae with a luminescence-based method described in Vicente et al [43].
Confocal microscopy
Tg(myl7:Twitch-4) larvae at 3 dpf were euthanized by incubation in 0.3% MS-222 (Sigma-Aldrich A5040) for 5 min. Larvae were embedded in agarose as done for ratiometric imaging and were imaged in an inverted Axio Observer LSM710 confocal microscope (Carl Zeiss, Germany) with a PlanApo 20x/0.8 NA objective. Laser excitation was at 488 nm and the emission bandwidth was 520-560 nm.
Statistics
Statistical analysis was done with GraphPad Prism 8 (Graphpad Software, CA, USA) and Igor Pro (WaveMetrics, OR, USA). The number of independent experiments (experimental days, N) and the number of larvae (n) are indicated in each figure. The Shapiro-Wilk test was used to test for normality. Differences between two groups were analyzed using the unpaired Student's t-test for parametric data or the Mann-Whitney test for non-parametric data, as indicated. Comparisons between experimental groups were analyzed by one-way repeated measures ANOVA with Dunnett's multiple comparisons post-test for parametric data or the Friedman test with Dunn's multiple comparisons post-test for non-parametric data, as indicated. Data are shown as the mean ± SD. A p < 0.05 was considered statistically significant and significances are indicated as * for p < 0.05, ** p < 0.01, *** p < 0.001, **** p < 0.0001, ns p > 0.05. The Supplementary Data 1 file shows the details of the statistical analysis used throughout.
Results
Generation of a transgenic line expressing Twitch-4 in the zebrafish heart
The ratiometric Ca2+ biosensor Twitch-4 belongs to a family of GECIs based on the C-terminal domain of the toadfish Opsanus tau troponin C as the Ca2+-binding domain, with a Kd of 2.8 µM and a decay time constant of 0.5 s determined in vitro [38]. It contains the fluorescent proteins ECFP as the FRET donor at the N-terminal end, and cpCitrine174, a YFP, as the FRET acceptor at the C-terminal end (Figure 1A). We generated a transgenic zebrafish line expressing Twitch-4 under the control of the myl7 promoter, Tg(myl7:Twitch-4). This promoter drives specific expression in myocardial cells of the atrium, ventricle, and the atrioventricular canal, excluding endocardial and epicardial cells [44]. Fish expressing Twitch-4 developed normally and embryos showed specific heart fluorescence starting at 24 hpf. The ventricle was more fluorescent than the atrium due to its thicker wall (Figure 1B). Larvae were mounted ventral-side down (3 dpf) or right-side down (5 dpf) to see atrium and ventricle in the same plane. Confocal microscopy images of 3 dpf Tg(myl7:Twitch-4) larvae confirmed the expected cytoplasmic localization of the biosensor (Figure 1C).
Chemical Ca2+ indicators and GECIs can act as exogenous buffers and potentially alter the Ca2+ dynamics and downstream events [45]. Therefore, we determined whether the expression of Twitch-4 affected some functional parameters in the heart of zebrafish larvae. The ventricular fractional shortening (FS) and fractional area change (FAC) represent the relative change of diameter and ventricular area during systole (see Methods for their definition). The FS and FAC of 3 and 5 dpf Tg(myl7:Twitch-4) larvae, measured by transmitted light, were similar to those of their non-expressing siblings (Figure S2A). Moreover, we found no differences in the ventricular end-diastolic and end-systolic areas (Figure S2B), as well as in the HR (Figure S2C). Thus, the expression of Twitch-4 in the embryonic zebrafish heart did not appear to affect the cardiac contractility, the size of the heart nor the HR.
Ratiometric Ca2+ imaging in the beating heart of zebrafish larvae
To study Ca2+ kinetics in the moving heart, we performed ratiometric imaging of 3 dpf Tg(myl7:Twitch-4) larvae acquiring simultaneously the fluorescence of the donor ECFP and FRET channels (both with donor excitation; see channel definition in Methods). The fluorescence intensity in both emission channels showed fluctuations, which were positively correlated, increasing during systole, and decreasing during diastole (Figure 1D), due to the movement of the heart. The FRET channel had two components that increased fluorescence in systole: the movement and the increased Ca2+ (high FRET); in the donor channel the heart movement increased the fluorescence, but high Ca2+ (high FRET) decreased it. Therefore, the relative fluorescence change was larger in the FRET channel than in the donor channel. Ratioing these channels (FRET/donor) cancelled out the effect of motion and augmented the effect of the Ca2+ rise (the reciprocal component). The ratiometric images and the ratio traces were generated with an intensity weighted method. Thus, pixel average ratios were computed without the need to set intensity thresholds [34-36] (Figure 1E). The emission ratio values in atrium and ventricle oscillated synchronously with the heart contractions (Figure 1E). Several parameters were calculated from the ratio traces to characterize the kinetics of the Ca2+ transients: diastolic and systolic ratio, amplitude (∆R), as well as rise and decay times and slopes (Figure 1F; see Methods).
Ratiometric imaging with Twitch-4 corrects motion artifacts
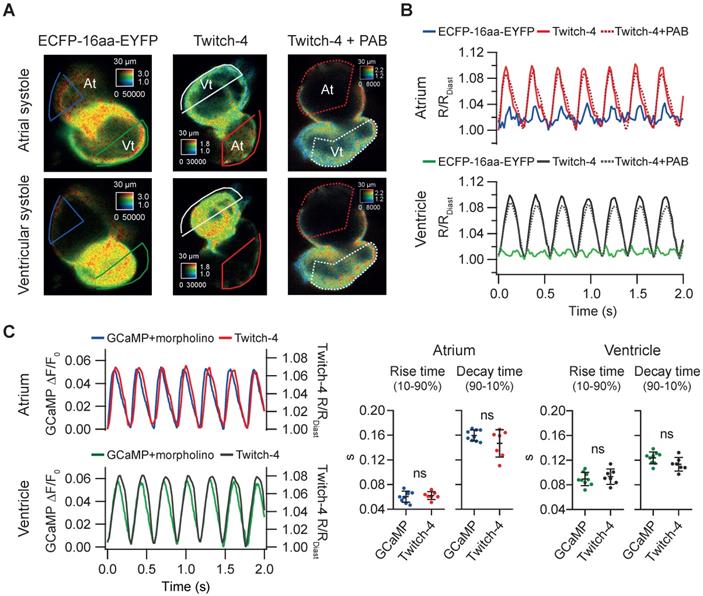
We wanted to determine whether the change in ratio observed in Tg(myl7:Twitch-4) larvae was indeed reporting cardiac Ca2+ fluctuations and to what extent it was affected by motion of the heart. We generated a zebrafish transgenic line that expresses in the heart a FRET construct with no Ca2+-binding domain, composed of an ECFP and an EYFP joined by a flexible linker of 16 amino acid residues [39]. In Tg(myl7:ECFP-16aa-EYFP) all the fluorescence fluctuations must be entirely due to motion and therefore this artifact should be cancelled in the emission ratio. We observed a small periodic ratio change in Tg(myl7:ECFP-16aa-EYFP) compared to Tg(myl7:Twitch-4) (Figure 2A-B). It was due to autofluorescence of the yolk under the heart (Figure S3) and it affected mostly the atrium since it was dimmer than the ventricle. We compared the variance of the emission ratio of both constructs to estimate the contribution of motion to the recorded ratios. In 3 dpf larvae the emission ratio variance of ECFP-16aa-EYFP was 18% and 2.3% of the variance of Twitch-4 in the atrium and ventricle, respectively (n = 9 larvae, N = 2 experiments for ECFP-16aa-EYFP; n = 9, N = 4 for Twitch-4). Thus, motion affected the atrium but hardly influenced Twitch-4 emission ratios in the ventricle, where the specific Twitch-4 fluorescence was dominant and autofluorescence was negligible. The effect of motion should be reduced in 5 dpf embryos since the yolk sac is smaller and does not overlap with the heart. As yolk autofluorescence was heterogeneous in space (Figure S3) it was not subtracted in Twitch-4 imaging. In support of the above contention, there was no difference in Twitch-4 ratio changes between moving hearts and hearts stopped with the myosin inhibitor para-amino blebbistatin (Figure 2A-B). The kinetics of Twitch-4 ratio changes in moving hearts were also compared to those obtained with the intensiometric GECI GCaMP in hearts stopped with tnnt2a morpholinos (Figure 2C). In larvae with matching HR, the rise time and decay time in atrium and ventricle were similar between both biosensors, as was the shape of the Ca2+ transients. In conclusion, the ratiometric measurements with Twitch-4 largely corrected the motion artifacts and reflected the variations in Ca2+ levels in the beating heart.
Tg(myl7:Twitch-4) reports cardiac Ca2+ oscillations and corrects motion artifacts in 3 dpf larvae. (A) Emission ratio images of Tg(myl7:ECFP-16aa-EYFP) and Tg(myl7:Twitch-4) moving hearts, and Tg(myl7:Twitch-4) heart stopped with 75 µM para-amino blebbistatin (PAB) (representative experiments). The atrial (At) and ventricular (Vt) systoles are shown. (B) Normalized emission ratio traces over time (R/RDiast) calculated from larvae in A. The lowest diastolic ratio value (RDiast) in each register was used for normalization. (C) Representative atrial and ventricular Ca2+ transients of a Tg(myl7:GCaMP)s878 non-contracting heart (tnnt2a mopholinos) and a Tg(myl7:Twitch-4) beating heart. The plots show the rise and decay times of the atrial and ventricular Ca2+ transients (n = 9 larvae for Tg(myl7:GCaMP)s878 from N = 2 experiments, and n = 7 for Tg(myl7:Twitch-4) from N = 5 experiments). Data are shown as the mean ± SD. A two-tailed unpaired Student's t-test was used.
Characterization of cardiac Ca2+ kinetics in 3 and 5 dpf zebrafish larvae
We used the Tg(myl7:Twitch-4) line to characterize cardiac Ca2+ kinetics at two stages of development, 3 and 5 dpf. The ratio levels and amplitude were higher at 5 dpf than at 3 dpf (Figure 3A and B and Movie S1), suggesting differences in the cardiac Ca2+ levels. We attempted to calibrate the emission ratios in terms of intracellular free Ca2+ concentration by incubating the larvae with ionomycin in high Ca2+ in the E3 medium, or zero Ca2+ with EGTA, but the results were not conclusive, probably because the ionophore did not fully reach the cardiomyocyte membrane. Nevertheless, as Twitch-4 emission ratio is proportional to Ca2+ levels, our results suggest an increase in the cardiac Ca2+ levels at 5 dpf. This was confirmed with an independent method using GFP-Aequorin, a bioluminescent Ca2+ indicator, in a Tg(myl7:GA) zebrafish line that we have generated [43]. The L/Lmax value, which is proportional to Ca2+ levels, was higher in the ventricle of 5 dpf larvae than in 3 dpf larvae (Figure 3C).
Basal cardiac Ca2+ kinetics of 3 and 5 dpf zebrafish larvae. (A) Emission ratio images of atrial and ventricular systoles of 3 and 5 dpf Tg(myl7:Twitch-4) representative larvae. (B) Atrial and ventricular Ca2+ levels (emission ratio) over time calculated from larvae in A. (C) Ventricular Ca2+ levels (L/Lmax) of 3 (n = 22, N = 8) and 5 dpf (n = 13, N = 5) Tg(myl7:GFP-Aequorin) larvae measured with a luminescence method. (D) Lissajous diagrams of the ventricular vs. atrial Ca2+ in several cardiac cycles from the 3 dpf larva traces in B. The arrows indicate the phases of the cardiac cycle. (E) Diagrams of the ventricular vs. atrial Ca2+ levels of the 3 and 5 dpf larvae in B (one cardiac cycle). The distance between arrowheads in these loops represents 20 ms, showing the direction of time and the relative speed of each phase. (F) Kinetic parameters extracted from atrial and ventricular Ca2+ traces of 3 (n = 100, N = 12) and 5 dpf (n =68, N = 7) Tg(myl7:Twitch-4) larvae (see Methods for parameter definition). Statistical analysis was performed as indicated in Supplementary data 1. Data are shown as mean ± SD (*** p < 0.001, **** p < 0.0001).
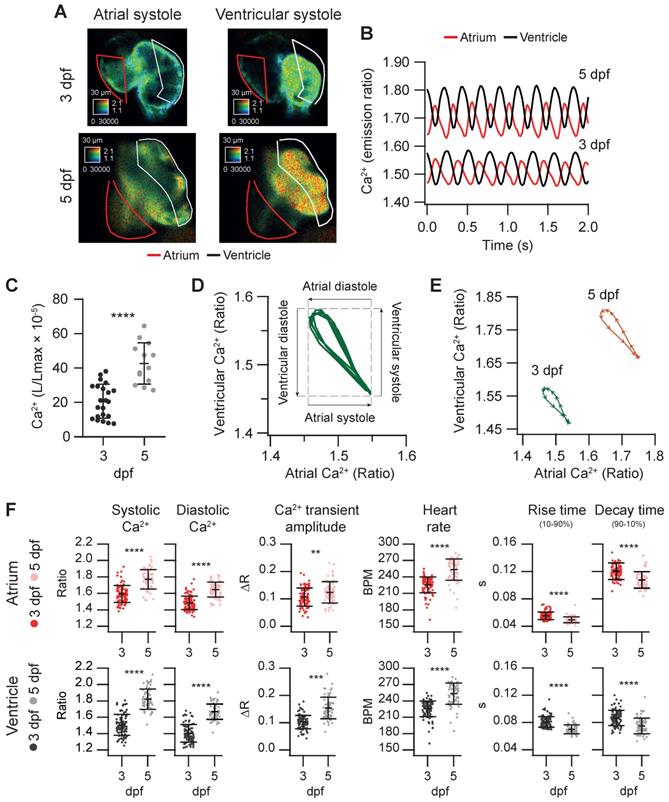
The electrical excitation starts in the sinoatrial node and is propagated to the ventricle with a delay to allow atrium and ventricle to contract and relax alternately, allowing ventricular filling. This asynchrony was observed in atrial and ventricular Ca2+ changes (Figure 3B and Movie S1). We correlated ventricular and atrial Ca2+ using Lissajous diagrams (Figure 3D). When atrial Ca2+ levels increased, ventricular Ca2+ levels decreased and vice versa. After ventricular Ca2+ reached a peak, the levels in both chambers decreased simultaneously for a brief time, showing a hysteresis in the loop. Figure 3E shows these loops for 3 and 5 dpf larvae in one cardiac cycle. The arrowheads were spaced 20 ms (each represents one image), showing the direction of time and the relative speed of each phase. Regarding the kinetic parameters of the Ca2+ transients, at 5 dpf the amplitude was larger, the HR was faster, and rise and decay times were shorter (Figure 3E-F). At both developmental stages atrial rise time was shorter than the decay time, whereas in the ventricle they were comparable, in agreement with previous reports [31, 36].
Simultaneous measurement of cardiac Ca2+ levels and contractile function
Since ratiometric imaging of Tg(myl7:Twitch-4) was performed on moving hearts, we measured simultaneously ventricular Ca2+, the ventricular diameter and the FS, as a proxy of the contractility. The same FRET channel images used to measure Ca2+ were used to monitor continuously changes in ventricle shape. To this end, we wrote an analysis program that automatically tracks the ventricular wall in the fluorescence images to construct kymograms and obtain the diameter over time (see Methods). Thus, we obtained a continuous recording of ventricle diameter (Figure S1) so that FS could be calculated continuously (Figure 4A and C). As expected, the larvae displayed larger end-diastolic and end-systolic diameters at 5 dpf than at 3dpf, but no statistical differences were found in the FS (25.9 ± 3.9% for 3 dpf and 25.3 ± 4.3% for 5 dpf, Figure 4B). Plotting together Ca2+ and FS over time showed that the Ca2+ rise was followed by the contraction with a short delay (Figure 4C). The interval between the systolic Ca2+ peak and maximal FS was significantly longer at 5 dpf than at 3 dpf (44 ± 15 ms at 5 dpf vs. 17 ± 6 ms at 3 dpf, average ± SD, p < 0.0001 in images acquired at 100 Hz). However, there is some uncertainty in these values due to the kinetics of Twitch-4 (see Discussion). Plotting the FS vs. Ca2+ (Ca2+-contraction curves) showed a loop with a contraction limb and a relaxation limb (Figure 4D). The delay between the Ca2+ rise and heart shortening resulted in a larger hysteresis of these loops at 5 dpf. In addition, the slope of the contraction-Ca2+ loop was lower at 5 dpf suggesting that Ca2+ levels changed more to obtain the same FS. These results illustrate a further advantage of Twitch-4 compared to intensiometric Ca2+ biosensors: the ability to correlate Ca2+ changes and the heart's mechanical function in real time.
Effect of an LTCC blocker and an LTCC activator on cardiac Ca2+ and ventricular shortening in zebrafish larvae
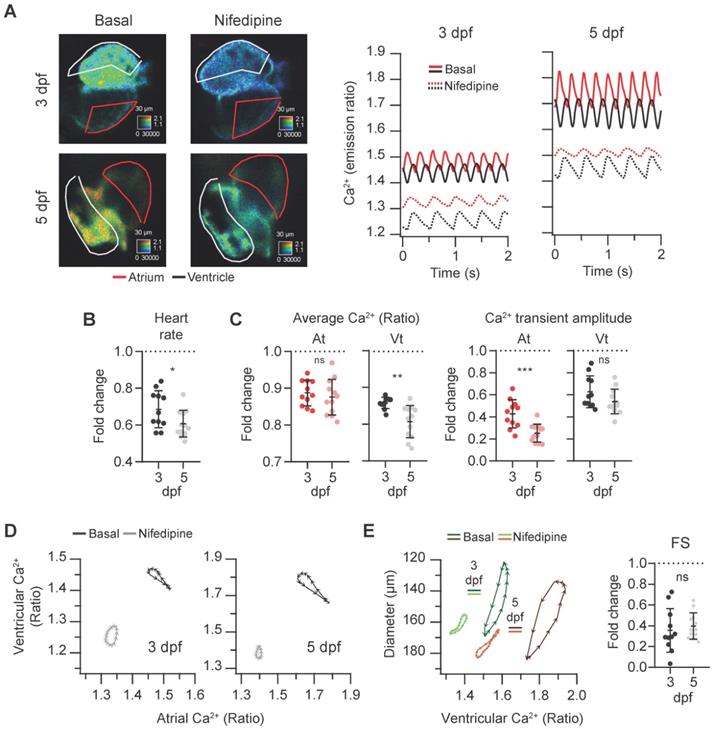
To assess the sensitivity of the Tg(myl7:Twitch-4) line to detect changes in Ca2+ levels we tested the effects of a blocker and an activator of LTCC on Ca2+ kinetics and heart contractility. Since drugs added to the bath have to diffuse through the agarose layer and the skin to reach the internal medium, nifedipine was tested at 1, 10 and 100 µM. It decreased the HR and Ca2+ levels at all doses and we compared the effect of 100 µM nifedipine at 3 and 5 dpf. The atrial and ventricular Ca2+ levels and the HR decreased, particularly at 5 dpf, and the amplitude of the Ca2+ transients decreased more in atrium than in ventricle (Figure 5A-C and Movie S2). The altered Ca2+ kinetics changed the shape of the loop in the ventricular vs. atrial Ca2+ plots (Figure 5D). In addition, the end-systolic diameters increased (less shortening) concomitantly with the reduced Ca2+ levels (Figure 5E). Thus, nifedipine markedly reduced the contractility: the FS was 35% and 40% of its basal value at 3 and 5 dpf, respectively (Figure 5E).
Effect of the L-type Ca2+ channel blocker nifedipine on cardiac Ca2+ levels and ventricular shortening of 3 and 5 dpf zebrafish larvae. Tg(myl7:Twitch-4) larvae at 3 (n = 11, N = 4) and 5 dpf (n = 12, N = 4) were treated with 100 µM nifedipine for 1 h. (A) Emission ratio images of a ventricular systole of representative larvae before (basal) and after the incubation with nifedipine. The traces show the atrial (red) and ventricular (black) Ca2+ levels (emission ratio) of these larvae. (B) Fold change over the basal HR of larvae treated with nifedipine. (C) Fold change of the average Ca2+ levels and amplitude of Ca2+ transients over their basal values in the atrium (At) and ventricle (Vt) (D) Diagrams of the ventricular vs. atrial Ca2+ levels (one cardiac cycle) of representative larvae before (basal) and after the incubation with nifedipine (note the different scale for 3 and 5 dpf). (E) Diagrams of the ventricular diameter vs. ventricular Ca2+ level (one cardiac cycle) of representative larvae before (basal) and after addition of nifedipine. The plot shows the fold change over the basal FS. All data are shown as the mean ± SD. A two-tailed unpaired Student's t-test was used (* p < 0.05, ** p < 0.01, *** p < 0.001).
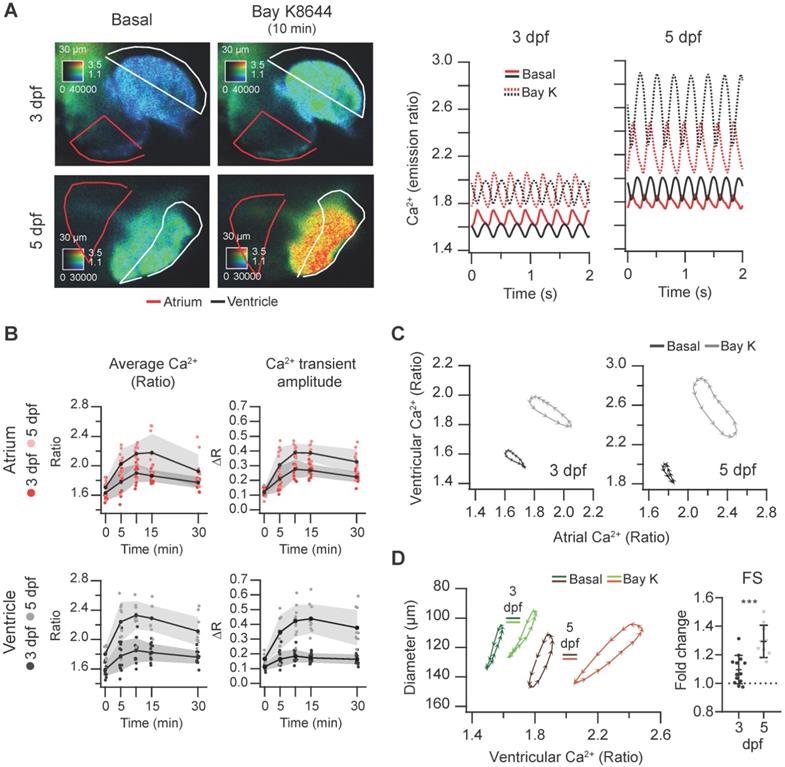
In contrast with nifedipine, the LTCC activator Bay K8644 at 100 µM markedly increased the Ca2+ levels of 3 and 5 dpf Tg(myl7:Twitch-4) larvae (Figure 6A and Movie S3), reaching the maximum effect after 10 min (Figure 6B). These changes were more pronounced at 5 dpf in both chambers (Figure S4A). The amplitude and hysteresis of ventricular vs. atrial Ca2+ loops increased (Figure 6C). The Ca2+-contraction curves of 3 and 5 dpf larvae showed shorter end-systolic diameters, in line with the rise in Ca2+ levels (Figure 6D and S4B). However, the end-diastolic diameter decreased 6% at 3 dpf but not at 5 dpf (Figure S4B), and the FS increased more at 5 dpf (Figure 6D). In zebrafish atrial contraction is the main determinant of ventricular filling, rather than passive filling from the veins. Since Bay K8644 also increased atrial Ca2+ levels (Figure 6A), stronger atrial contraction may contribute to larger FS in 5 dpf larvae. In summary, Bay K8644 increased Ca2+ transient amplitude, heart shortening and contractility.
Effect of the L-type Ca2+ channel activator Bay K8644 on cardiac Ca2+ levels and ventricular shortening of 3 and 5 dpf zebrafish larvae. Tg(myl7:Twitch-4) larvae at 3 (n = 13, N = 3) and 5 dpf (n = 10, N = 3) were treated with 100 µM Bay K8644. (A) Emission ratio images of a ventricular systole of representative larvae before (basal) and after 10 min incubation with Bay K8644. The traces show their atrial (red) and ventricular (black) Ca2+ levels (emission ratio). (B) Effect of Bay K8644 on the average Ca2+ levels and Ca2+ transient amplitude in the atrium and ventricle. Data are shown as the mean (black line) ± SD (gray stripe). (C) Diagrams of the ventricular vs. atrial Ca2+ levels (one cardiac cycle) of representative larvae before (basal) and after 10 min incubation with Bay K8644. (D) Diagrams of the ventricular diameter vs. ventricular Ca2+ level (one cardiac cycle) of representative larvae before (basal) and after 10 min incubation with Bay K8644. The plot shows the fold change over the basal FS of larvae treated with Bay K8644 for 10 min. A two-tailed unpaired Student's t-test was used (*** p < 0.001).
Effect of ryanodine and caffeine on cardiac Ca2+ levels and ventricular shortening of zebrafish larvae
We examined the effects of compounds acting on RyR on Ca2+ levels and heart shortening. First, we tested the response of 3 and 5 dpf Tg(myl7:Twitch-4) larvae to the inhibition of RyR by incubation with 1, 10 and 100 µM ryanodine. Effects were observed only with 100 µM and were maximal at 2 h. The amplitude of the Ca2+ transients decreased in the ventricle of 3 and 5 dpf larvae compared to larvae treated with DMSO for 2 h (Figure S5A-C) but the FS did not change significantly (Figure S5D). Ryanodine slightly decreased Ca2+ levels with no difference in the ventricular diameters (Figure S5A and E and Supplementary data 1). It is possible that the relatively small effects found with ryanodine are due to the reported minor contribution of the SR to the Ca2+ transient in zebrafish, compared to mammals [19, 20]. However, since we do not know the degree of ryanodine receptor inhibition in our experiments, no conclusion can be drawn regarding this controversy.
Caffeine is structurally related to adenosine and acts as an A1 and A2A adenosine receptor antagonist and as a non-selective competitive inhibitor of phosphodiesterases, raising intracellular cAMP concentration. Although it has been used in isolated cardiomyocytes to release Ca2+ from the sarcoplasmic reticulum [1], it may act on several targets and organs in zebrafish larvae, including the central nervous system. We tested the effect of caffeine on the spontaneous cardiac Ca2+ transients and heart contractions at 3 and 5 dpf. Caffeine at 0.1 mM showed minor effects and at 1 mM it induced mild bradycardia after 1 hr (Figure S6 and Supplementary Data 1). At 3 mM, there was a marked time-dependent decrease of the HR and a large decrease of the diastolic Ca2+ levels mostly in the ventricle, whereas systolic Ca2+ levels were less affected (Figure 7A-B and Movie S4). The amplitude of the Ca2+ transients increased, particularly in the ventricle (Figure 7B). The changes in HR and amplitude were patent in the diagram of ventricular vs. atrial Ca2+ (Figure 7C). Before caffeine, as in control larvae (Figure 3B-D) atrial and ventricular Ca2+ were out of phase. At 30 min of treatment, the phase of simultaneous decrease of Ca2+ in atrium and ventricle was prolonged due to the lower HR, widening the loop (asterisk in Figure 7C). After one hour incubation, the duration of a cardiac cycle increased even more and the rise in atrial Ca2+ was followed shortly by a rise in ventricular Ca2+. Finally, both atrial and ventricular Ca2+ levels decreased in parallel in a prolonged relaxation phase (Figure 7A and C; Movie S4).
Effect of caffeine on cardiac Ca2+ levels and ventricular shortening in 3 and 5 dpf zebrafish larvae. Tg(myl7:Twitch-4) larvae at 3 (n = 12, N = 3) and 5 dpf (n = 11, N = 4) were treated with 3 mM caffeine. (A) Emission ratio images of ventricular diastoles of a representative larva before (basal) and after 0.5 and 1 h incubation with caffeine (representative experiment). The traces show the corresponding atrial and ventricular Ca2+ levels (emission ratio). (B) Systolic and diastolic Ca2+ levels, Ca2+ transient amplitude and heart rate before and after 0.5 and 1 h treatment with caffeine (C) Diagram of the ventricular vs. atrial Ca2+ levels (one cardiac cycle) from the larva in A (3 dpf). (D) Ventricular diameters and FS before and after 0.5 and 1 h incubation with caffeine. (E) Diagram of the ventricular diameter vs. ventricular Ca2+ level (one cardiac cycle) of a representative 3 dpf larva before and after 0.5 and 1 h incubation with caffeine. The red arrows mark the start of the atrial systole and ventricular filling. Data in (B) and (D) are shown as the mean (black line) ± SD (gray stripe). Statistical analysis was performed as indicated in Supplementary data 1 (* p < 0.05; ** p < 0.01; *** p < 0.001, **** p < 0.0001).
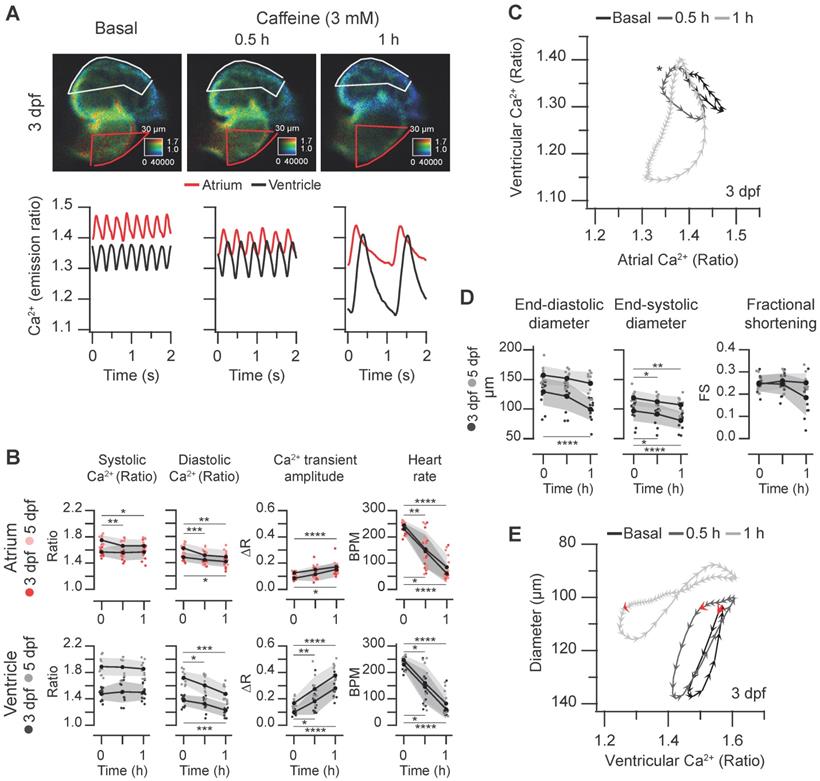
Regarding the effects of caffeine on heart contraction, the ventricular diameters decreased, but no significant change in the FS was observed (Figure 7D). In keeping with the slower HR, the contraction phase and, particularly, the relaxation phase slowed down (Movie S4); in the representative larva of Figure 7E, the systole before caffeine addition lasted 120 ms (6 arrowheads), while after 1 hour caffeine it lasted 260 ms. During the decay of the Ca2+ transient, the ventricular diameter did not increase much until the onset of atrial contraction (marked by red arrows in Figure 7E), which gave rise to ventricular filling in diastole. End-diastolic volume in zebrafish is known to depend largely on atrial contraction [13].
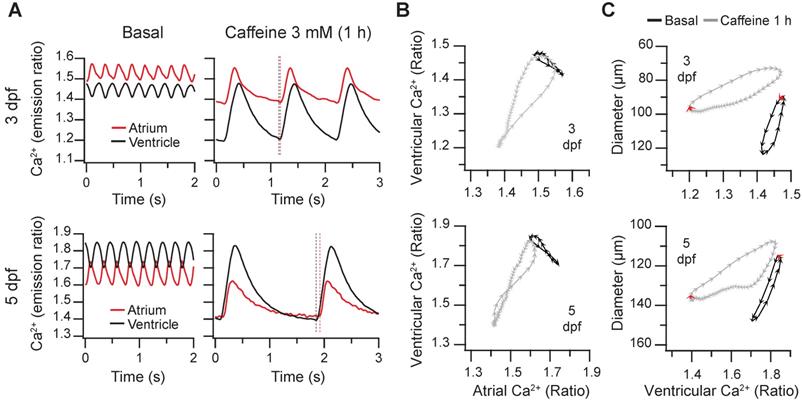
In 4 larvae out of 12 (3 dpf) and 2 out of 11 (5 dpf) treated with 3 mM caffeine, the normal atrioventricular direction of excitation was altered (Figure 8A and Movie S5). The Ca2+ rise in atrium and ventricle was simultaneous (at 3 dpf, both systoles were in phase), or even it started earlier in the ventricle (at 5 dpf, vertical dashed lines in Figure 8A and Movie S5) suggesting failure of the sinoatrial pacemaker and an escape rhythm. Therefore, the slope of the atrial vs. ventricular Ca2+ loops changed by about 90º showing that Ca2+ rise was in phase in both chambers. In these larvae atrial contraction (red arrows in Figure 8C) occurred together with ventricular Ca2+ rise and shortening and did not contribute to ventricular filling. This kind of analysis will be useful to identify altered patterns caused by drugs or mutations.
Altered excitation in 3 and 5 dpf zebrafish larvae caused by caffeine. Some Tg(myl7:Twitch-4) larvae treated with 3 mM caffeine showed an altered pattern of atrial and ventricular Ca2+ transients. (A) Atrial and ventricular Ca2+ levels (emission ratio) before (basal) and after 1 h incubation with 3 mM caffeine in 3 and 5 dpf larvae (representative experiments). The vertical dotted lines show that ventricular Ca2+ increased before atrial Ca2+ in the 5 dpf larva. (B) Diagrams of the ventricular vs. atrial Ca2+ levels (one cardiac cycle) of the larvae in A before (basal) and after 1 h incubation with caffeine. (C) Diagrams of the ventricular diameter vs. ventricular Ca2+ level (one cardiac cycle) of the same larvae. The red arrows indicate the start of the atrial systole. Each arrowhead in B and C corresponds to one image: they are separated from each other by 20 ms.
Discussion
Detailed electrophysiological and mechanobiological studies have been reported in cardiomyocytes mostly derived from rodents and from human induced pluripotent stem cells [46]. For videomicroscopy studies in cardiomyocytes, a goal has been to automate image analysis, generating readouts like HR, beat duration and amplitude, beat-to-beat variation, and sarcomere contraction and relaxation parameters [47, 48]. In reports of cardiac performance in zebrafish, several methods based on bright-field [49-51] and wide-field or light-sheet fluorescence microscopy [52, 53] have provided estimates of mechanical and contractile function of the heart, such as the HR, end-systolic and end-diastolic volumes, ejection fraction, stroke volume and cardiac output. Moreover, zebrafish lines of fluorescent biosensors have been generated to provide a readout of voltage and/or Ca2+ levels in the heart [31, 54, 55]. In this study, we obtained simultaneously mechanical performance endpoints and Ca2+ dynamics parameters in zebrafish larvae stably expressing the GECI Twitch-4.
The response kinetics of a biosensor is essential to analyze dynamic Ca2+ concentration changes. The kinetics of GECIs is slower than that of synthetic Ca2+ indicators [38, 56-58]. In the Twitch series, an expected inverse relationship was seen between Ca2+ affinity and kinetics. Thus, biosensors with decreasing Ca2+ affinity (Twitch-2B, -3, -4 and -5) showed decay time constants of 2.8, 1.5, 0.5 and 0.16 s, respectively [45]. Hence our choice of Twitch-4, with relatively fast kinetics and low Ca2+ affinity (Kd of 2.8 µM) to minimize kinetics dampening.
The in vitro kinetics is difficult to compare between Ca2+ biosensors because measurements in the literature are done in different experimental conditions, like ionic strength and temperature. In addition, the cell milieu differs considerably from the in vitro conditions. The kon of Twitch-4 can be calculated from the published Kd and koff. It is 7 × 10⁵ M-1 s-1, compared to ~107 M-1 s-1 for various GCaMP variants that are considered fast GECIs. The koff of Twitch-4 and GCaMPs is more similar (2 s-1 and 3-4 s-1, respectively) [56]. In view of these in vitro parameters, GCaMP fluorescence should report the start of the Ca2+ transient more accurately than Twitch-4 emission ratio. Yet, we show here that Twitch-4 was able to track systolic Ca2+ transients like GCaMP, a widely used biosensor in zebrafish heart studies. Figure 2C shows that the rise and decay time of Twich-4 in atrium and ventricle (in beating hearts) were identical to those recorded for GCaMP (in MO-arrested hearts). Since our experiments were done at 28 °C, it is likely that Twitch-4 and GCaMP had faster kinetics than in vitro at a lower temperature.
The Kd of Twitch-4 determined in vitro (2.8 µM) [38] was well suited to detect both rises and decreases of Ca2+ levels (Figures 5 and 6). When intensiometric Ca2+ biosensors are employed, fluorescence along time is usually normalized to the diastolic or the lowest fluorescence of the recording (F/F0), so no inference can be made on the diastolic levels across experiments or larvae. It has been argued that this is a reason why relatively little is known about the regulation of diastolic Ca2+ levels in the heart [9]. In contrast, with Twitch-4, differences in Ca2+ levels were seen not only during the cardiac cycle or after addition of drugs, but also among larvae. The ratio changes were suggestive of different Ca2+ levels at 3 and 5 dpf, and we confirmed this contention with an independent method based on GFP-aequorin bioluminescence [43].
Within the ample toolbox of GECIs [30, 45, 59], ratiometric biosensors have distinct advantages over intensiometric ones for imaging a motile organ like the heart. As we showed in an earlier study [36] and here in Figure 2, ratiometric imaging with FRET biosensors largely corrected the motion artifacts and allowed imaging Ca2+ changes in beating hearts. These results agree with Tsutsui et al. [55], who reported voltage mapping with a ratiometric genetically encoded biosensor in beating hearts of zebrafish larvae. The positively correlated fluctuations of the two fluorescence channels due to focusing and defocusing and motion of the heart cancelled well in the ratio, whereas the reciprocal components due to the voltage-dependent FRET were amplified. An alternative to FRET biosensors is to co-express an intensiometric GECI like GCaMP with a static reference (DsRed): their emission ratio cancels out the motion and defocusing artifacts, leaving only the Ca2+-dependent changes [60]. A technical detail allowed us to quantify Ca2+ with static ROIs, in spite of the lateral movement of the atrium and ventricle in the focal plane and to a lesser extent in the z axis. The contribution of each pixel to the average ratio was weighted by its fluorescence intensity [34, 35], so that dim pixels had negligible influence and the ROIs did not need to match the shape of the heart chambers in each video frame.
In keeping with the contention that motion artifacts were cancelled in our study, the temporal shapes and rates of the Twitch-4 ratio changes in beating hearts were consistent with those of hearts stopped with a myosin inhibitor or tnnt2a morpholino (Figure 2B, Twitch-4+PAB; Figure 2C, GCaMP+morpholino) and with those in previous reports [31, 32]. Although zebrafish larvae can survive without circulation up to 5 dpf, it has been shown that preventing blood flow with tnnt2a morpholinos caused endothelial cell apoptosis in vascular plexus of zebrafish embryos [61]. Furthermore, in a patch-clamp study it was found that mechanical load may affect the action potential duration, Ca2+ signaling and contractility of mouse ventricular myocytes [62], which underlines the importance of mechano-transduction in cardiomyocytes. Therefore, in our study no myosin inhibitors or morpholinos were used to stop heart beating, so the heart mechano-electrical feedback mechanisms were intact. A key aspect of this work was the automatic extraction of Ca2+ and contraction parameters from the Twitch-4 fluorescence images with a custom written analysis program. We tracked contraction of the ventricle alongside with Ca2+ in each experiment. Since the biochemical trigger (Ca2+) and its mechanical outcome were gathered in real time at 50 or 100 Hz (fps), analysis of their phase-plane trajectories (Lissajous diagrams) provided a visual snapshot of the changes occurring during development (Figure 4D) or as a result of drug addition (Figures 5E, 6D, 7E and 8C). The correlation of Ca2+ with contraction has been studied in isolated cardiomyocytes [19, 63, 64] but, to our knowledge, this is the first demonstration in vivo.
A limitation in our study and similar reports in zebrafish is that the internal concentration in larvae of the drugs added to the bath is generally unknown. Often, higher concentrations must be used to see effects, compared to in vitro studies. In our experiments the layer of agarose over the larvae was 1.9 mm thick and over this distance diffusion is slow. It is possible to remove part of the agarose to increase drug access but, as this must be done manually, it may introduce a source of variability between larvae. In addition, drugs must cross the skin to reach internal organs. In one report, Parker et al. measured the concentration in larvae by liquid chromatography with tandem mass spectrometry and compared it to the bath concentration of various compounds [50]. They found 0.004-fold internal vs. external concentration for some drugs (adrenaline and ouabain), 0.07 for theophylline, 1- to 2-fold for verapamil and terfenadine, and yet 20-fold for cisapride and haloperidol, highlighting the importance of bioanalysis to interpret results, especially if effects are not observed [50]. To follow the effects of slow-acting drugs, we repeated measurements every 5 to 15 min (i.e. Figure 6B). An alternative method by cardioluminescence with GFP-aequorin allows non-stop imaging for extended periods (hours) [43].
Caffeine is known to increase the Ca2+ leak of the SR by sensitizing the RyR to the luminal Ca2+ level [1], but in our experiments in vivo, it may act on several targets. The major effects observed with caffeine were a marked decrease in HR, reduced diastolic Ca2+ levels and an increase in the size of the Ca2+ transients (Figure 7). These effects, observed 1 hr after caffeine addition, are compatible with the regulation of diastolic Ca2+ by the HR and with the maintenance of flux balance at steady state [1, 9]. At the spontaneous HR of zebrafish larvae of about 4 Hz, diastolic Ca2+ levels were elevated, since Ca2+ transients did not have enough time to decay before the next Ca2+ transient occurred. Concurrently, the amplitude of the Ca2+ transient was small, likely due to a decrease in the LTCC current. Thus, Zhang et al. reported in zebrafish cardiomyocytes that ICa,L decreased with shorter stimulation intervals (from 2 to 0.33 s), due to inactivation of ICa,L by Ca2+, since it was associated with an increase in the diastolic Ca2+ levels (see Figure 5 in [19]). In our results, the HR after caffeine fell to less than 1 Hz, the diastolic Ca2+ levels decreased, likely approaching resting Ca2+ (the level observed in the absence of stimulation), and the amplitude of the Ca2+ transients increased (Figure 7 and Movie S4). We have also seen large ventricular Ca2+ transients associated with low HR provoked by drugs like dofetilide and astemizole (manuscript in preparation).
Caffeine in vivo has a complex pharmacology. In the literature there are reports of bradycardia induced by caffeine in humans [65]. Although the mechanism is unclear, there is evidence that inhibition of adenosine receptors by caffeine leads to high blood pressure, which induces an autonomous reflex and bradycardia. In addition, previous reports in zebrafish of 2 and 3 dpf showed a dose-dependent decrease in heart rate by caffeine [66]. As discussed above, the embryo/bath concentration of theophylline reported by Parker et al. was 0.07 [50]. Caffeine and theophylline have very similar structures, only differing in a methyl group; their XLogP values are 1.55 and 1.68, respectively. If we assume that they would have similar embryo/bath ratios, 1 mM caffeine in the bath should result in an embryo concentration of about 70 µM, consistent with an effect on adenosine receptors at 10-100 µM (pKi 4 to 5) [67].
Automaticity in cardiac muscle is believed to be regulated by voltage-gated calcium channels, in addition to HCN channels (If current) [68]. An additional mechanism for pacemaker depolarization involves the rhythmic Ca2+ release from SR that triggers an inward current through the NCX1. The loss of this current specifically in the atrium in KO mice abolished the sinus pacemaker activity and caused an idioventricular escape rhythm, although atrial tissue remained excitable [69]. In our study, in some larvae treated with caffeine, an escape rhythm appeared (Figure 8). Leak of Ca2+ from the SR of sinoatrial cells in these larvae by caffeine could eliminate the local Ca2+ release, the ensuing inward current through the NCX and sinus pacemaker activity. The characterization of caffeine effects on Ca2+ levels (Figure 7 and 8) underscores the potential of this method to investigate drug-induced and familial arrhythmias and their functional consequences in zebrafish larvae.
Conclusions
The Tg(myl7:Twitch-4) line offers a physiological, non-invasive approach to image Ca2+ in the heart of zebrafish embryos and larvae, allowing estimation of systolic and diastolic Ca2+ levels, while keeping intact the electromechanical and paracrine regulatory mechanisms. Measurement of changes in contractility is critical for appraisal of cardiac function and this method affords simultaneous registration and correlation of Ca2+ and contraction. In the last years several models of heart failure and cardiomyopathy have been reported in zebrafish, and gene-editing by CRISPR-Cas9 allows to humanize zebrafish models by introducing the normal or mutated human orthologue genes [18, 22]. The current line expressing Twitch-4 will be a valuable tool to characterize their pathophysiology, whether Ca2+ fluxes are involved and their impact on heart contractility. In addition, cardiotoxicity studies and screening for new drugs could be performed. The applicability of this approach for drug screening is currently limited by the handling and positioning of embryos in agarose in multi-well plates. Automation of this step [26, 27] would allow for the sampling of about 60 larvae per hour. Integration of in vivo data from zebrafish models with the extensive literature in cardiomyocytes and isolated hearts will likely contribute to unravel the mechanisms of heart disease progression and to identify therapeutical targets.
Abbreviations
At: atrium; bpm: beats per minute; dpf: days post-fertilization; ECG: electrocardiogram; FAC: fractional area change; fps: frames per second; FRET: Förster resonance energy transfer; FS: fractional shortening; GECI: genetically encoded Ca2+ indicator; HCN channels: Hyperpolarization-activated cyclic nucleotide-gated channels; hpf: hours post-fertilization; HR: heart rate; ICa,L: L-type Ca2+ current; LTCC: L-type voltage-dependent Ca2+ channel; NCX: sodium-calcium exchanger; PAB: para-amino blebbistatin; ROI: region of interest; RyR: ryanodine receptor; SR: sarcoplasmic reticulum; Vt: ventricle.
Supplementary Material
Supplementary figures and movie legends.
Supplementary information.
Supplementary movie 1.
Supplementary movie 2.
Supplementary movie 3.
Supplementary movie 4.
Supplementary movie 5.
Acknowledgements
We acknowledge grant PID2019-111456RB-100 funded by MCIN/AEI/ 10.13039/501100011033; grants BFU2015-69874-R and EQC-2019-006102-P funded by MCIN/AEI/ 10.13039/501100011033 and by “ERDF A way of making Europe”, by the “European Union”; grant SBPLY/19/180501/000223 funded by Consejería de Educación, Cultura y Deportes, Junta de Comunidades de Castilla-La Mancha and “ERDF A way of making Europe”, European Union; grants 2019-GRIN-27019, 2020-GRIN-29186 and 2021-GRIN-31151 funded by University of Castilla-La Mancha and “ERDF A way of making Europe”, European Union. J.S.-A. held a predoctoral fellowship from UCLM. M.V. obtained a fellowship from UCLM to visit the Max Planck Institute for Heart and Lung Research, Bad Nauheim, Germany. We thank Michelle Collins for help with the GCaMP experiments. Oliver Griesbeck is gratefully acknowledged for the gift of Twitch-4. We thank Liliana de Castro for critical reading of the manuscript, and Carmen Cifuentes for expert technical assistance.
Competing Interests
The authors have declared that no competing interest exists.
References
1. Eisner DA, Caldwell JL, Kistamas K, Trafford AW. Calcium and Excitation-Contraction Coupling in the Heart. Circ Res. 2017;121:181-95
2. Eisner DA. Ups and downs of calcium in the heart. J Physiol. 2018;596:19-30
3. Brunello L, Slabaugh JL, Radwanski PB, Ho HT, Belevych AE, Lou Q. et al. Decreased RyR2 refractoriness determines myocardial synchronization of aberrant Ca2+ release in a genetic model of arrhythmia. Proc Natl Acad Sci U S A. 2013;110:10312-7
4. Nemec J, Kim JJ, Salama G. The link between abnormal calcium handling and electrical instability in acquired long QT syndrome-Does calcium precipitate arrhythmic storms? Prog Biophys Mol Biol. 2016;120:210-21
5. Landstrom AP, Dobrev D, Wehrens XHT. Calcium Signaling and Cardiac Arrhythmias. Circ Res. 2017;120:1969-93
6. Bers DM. Cardiac sarcoplasmic reticulum calcium leak: basis and roles in cardiac dysfunction. Annu Rev Physiol. 2014;76:107-27
7. Song LS, Sobie EA, McCulle S, Lederer WJ, Balke CW, Cheng H. Orphaned ryanodine receptors in the failing heart. Proc Natl Acad Sci U S A. 2006;103:4305-10
8. Pollesello P, Papp Z, Papp JG. Calcium sensitizers: What have we learned over the last 25 years? Int J Cardiol. 2016;203:543-8
9. Eisner DA, Caldwell JL, Trafford AW, Hutchings DC. The Control of Diastolic Calcium in the Heart: Basic Mechanisms and Functional Implications. Circ Res. 2020;126:395-412
10. Kilfoil PJ, Lotteau S, Zhang R, Yue X, Aynaszyan S, Solymani RE. et al. Distinct features of calcium handling and beta-adrenergic sensitivity in heart failure with preserved versus reduced ejection fraction. J Physiol. 2020;598:5091-108
11. Rohr S. Arrhythmogenic implications of fibroblast-myocyte interactions. Circ Arrhythm Electrophysiol. 2012;5:442-52
12. Bowley G, Kugler E, Wilkinson R, Lawrie A, van Eeden F, Chico TJA. et al. Zebrafish as a tractable model of human cardiovascular disease. Br J Pharmacol. 2021:1-18 bph.15473
13. Genge CE, Lin E, Lee L, Sheng X, Rayani K, Gunawan M. et al. The Zebrafish Heart as a Model of Mammalian Cardiac Function. Rev Physiol Biochem Pharmacol. 2016;171:99-136
14. Milan DJ, Jones IL, Ellinor PT, MacRae CA. In vivo recording of adult zebrafish electrocardiogram and assessment of drug-induced QT prolongation. Am J Physiol Heart Circ Physiol. 2006;291:H269-73
15. Liu CC, Li L, Lam YW, Siu CW, Cheng SH. Improvement of surface ECG recording in adult zebrafish reveals that the value of this model exceeds our expectation. Sci Rep. 2016;6:25073
16. Nemtsas P, Wettwer E, Christ T, Weidinger G, Ravens U. Adult zebrafish heart as a model for human heart? An electrophysiological study. J Mol Cell Cardiol. 2010;48:161-71
17. Vornanen M, Hassinen M. Zebrafish heart as a model for human cardiac electrophysiology. Channels (Austin). 2016;10:101-10
18. van Opbergen CJM, van der Voorn SM, Vos MA, de Boer TP, van Veen TAB. Cardiac Ca(2+) signalling in zebrafish: Translation of findings to man. Prog Biophys Mol Biol. 2018;138:45-58
19. Zhang PC, Llach A, Sheng XY, Hove-Madsen L, Tibbits GF. Calcium handling in zebrafish ventricular myocytes. Am J Physiol Regul Integr Comp Physiol. 2011;300:R56-66
20. Bovo E, Dvornikov AV, Mazurek SR, de Tombe PP, Zima AV. Mechanisms of Ca(2)+ handling in zebrafish ventricular myocytes. Pflugers Arch. 2013;465:1775-84
21. Haustein M, Hannes T, Trieschmann J, Verhaegh R, Koster A, Hescheler J. et al. Excitation-contraction coupling in zebrafish ventricular myocardium is regulated by trans-sarcolemmal Ca2+ influx and sarcoplasmic reticulum Ca2+ release. PLoS One. 2015;10:e0125654
22. Cornet C, Di Donato V, Terriente J. Combining Zebrafish and CRISPR/Cas9: Toward a More Efficient Drug Discovery Pipeline. Front Pharmacol. 2018;9:703
23. Howe K, Clark MD, Torroja CF, Torrance J, Berthelot C, Muffato M. et al. The zebrafish reference genome sequence and its relationship to the human genome. Nature. 2013;496:498-503
24. Vishnolia KK, Hoene C, Tarhbalouti K, Revenstorff J, Aherrahrou Z, Erdmann J. Studies in Zebrafish Demonstrate That CNNM2 and NT5C2 Are Most Likely the Causal Genes at the Blood Pressure-Associated Locus on Human Chromosome 10q24.32. Front Cardiovasc Med. 2020;7:135
25. Akerberg AA, Trembley M, Butty V, Schwertner A, Zhao L, Beerens M. et al. RBPMS2 is a conserved regulator of alternative splicing that promotes myofibrillar organization and optimal calcium handling in cardiomyocytes. bioRxiv. 2021. 2021 03.08.434502
26. Letamendia A, Quevedo C, Ibarbia I, Virto JM, Holgado O, Diez M. et al. Development and validation of an automated high-throughput system for zebrafish in vivo screenings. PLoS One. 2012;7:e36690
27. Dyballa S, Minana R, Rubio-Brotons M, Cornet C, Pederzani T, Escaramis G. et al. Comparison of zebrafish larvae and hiPSC cardiomyocytes for predicting drug induced cardiotoxicity in humans. Toxicol Sci. 2019;171:283-295
28. Pott A, Rottbauer W, Just S. Streamlining drug discovery assays for cardiovascular disease using zebrafish. Expert Opin Drug Discov. 2020;15:27-37
29. Staudt D, Stainier D. Uncovering the molecular and cellular mechanisms of heart development using the zebrafish. Annu Rev Genet. 2012;46:397-418
30. Chen TW, Wardill TJ, Sun Y, Pulver SR, Renninger SL, Baohan A. et al. Ultrasensitive fluorescent proteins for imaging neuronal activity. Nature. 2013;499:295-300
31. van Opbergen CJM, Koopman CD, Kok BJM, Knopfel T, Renninger SL, Orger MB. et al. Optogenetic sensors in the zebrafish heart: a novel in vivo electrophysiological tool to study cardiac arrhythmogenesis. Theranostics. 2018;8:4750-64
32. Weber M, Scherf N, Meyer AM, Panakova D, Kohl P, Huisken J. Cell-accurate optical mapping across the entire developing heart. Elife. 2017;6:e28307
33. Kovacs M, Toth J, Hetenyi C, Malnasi-Csizmadia A, Sellers JR. Mechanism of blebbistatin inhibition of myosin II. J Biol Chem. 2004;279:35557-63
34. Tsien RY, Harootunian AT. Practical design criteria for a dynamic ratio imaging system. Cell Calcium. 1990;11:93-109
35. Polito M, Vincent P, Guiot E. Biosensor imaging in brain slice preparations. Methods Mol Biol. 2014;1071:175-94
36. Salgado-Almario J, Vicente M, Vincent P, Domingo B, Llopis J. Mapping Calcium Dynamics in the Heart of Zebrafish Embryos with Ratiometric Genetically Encoded Calcium Indicators. Int J Mol Sci. 2020 21
37. Quinn TA, Kohl P. Cardiac Mechano-Electric Coupling: Acute Effects of Mechanical Stimulation on Heart Rate and Rhythm. Physiol Rev. 2021;101:37-92
38. Thestrup T, Litzlbauer J, Bartholomaus I, Mues M, Russo L, Dana H. et al. Optimized ratiometric calcium sensors for functional in vivo imaging of neurons and T lymphocytes. Nat Methods. 2014;11:175-82
39. Domingo B, Sabariegos R, Picazo F, Llopis J. Imaging FRET standards by steady-state fluorescence and lifetime methods. Microsc Res Tech. 2007;70:1010-21
40. Urasaki A, Morvan G, Kawakami K. Functional dissection of the Tol2 transposable element identified the minimal cis-sequence and a highly repetitive sequence in the subterminal region essential for transposition. Genetics. 2006;174:639-49
41. White RM, Sessa A, Burke C, Bowman T, LeBlanc J, Ceol C. et al. Transparent adult zebrafish as a tool for in vivo transplantation analysis. Cell Stem Cell. 2008;2:183-9
42. Schneider CA, Rasband WS, Eliceiri KW. NIH Image to ImageJ: 25 years of image analysis. Nat Methods. 2012;9:671-5
43. Vicente M, Salgado-Almario J, Collins MM, Martinez-Sielva A, Minoshima M, Kikuchi K. et al. Cardioluminescence in Transgenic Zebrafish Larvae: A Calcium Imaging Tool to Study Drug Effects and Pathological Modeling. Biomedicines. 2021;9:1294
44. Huang CJ, Tu CT, Hsiao CD, Hsieh FJ, Tsai HJ. Germ-line transmission of a myocardium-specific GFP transgene reveals critical regulatory elements in the cardiac myosin light chain 2 promoter of zebrafish. Dev Dyn. 2003;228:30-40
45. Rose T, Goltstein PM, Portugues R, Griesbeck O. Putting a finishing touch on GECIs. Front Mol Neurosci. 2014;7:88
46. Blair CA, Pruitt BL. Mechanobiology Assays with Applications in Cardiomyocyte Biology and Cardiotoxicity. Adv Healthc Mater. 2020;9:e1901656
47. Maddah M, Heidmann JD, Mandegar MA, Walker CD, Bolouki S, Conklin BR. et al. A non-invasive platform for functional characterization of stem-cell-derived cardiomyocytes with applications in cardiotoxicity testing. Stem Cell Reports. 2015;4:621-31
48. Toepfer CN, Sharma A, Cicconet M, Garfinkel AC, Mucke M, Neyazi M. et al. SarcTrack. Circ Res. 2019;124:1172-83
49. Fink M, Callol-Massot C, Chu A, Ruiz-Lozano P, Izpisua Belmonte JC, Giles W. et al. A new method for detection and quantification of heartbeat parameters in Drosophila, zebrafish, and embryonic mouse hearts. Biotechniques. 2009;46:101-13
50. Parker T, Libourel PA, Hetheridge MJ, Cumming RI, Sutcliffe TP, Goonesinghe AC. et al. A multi-endpoint in vivo larval zebrafish (Danio rerio) model for the assessment of integrated cardiovascular function. J Pharmacol Toxicol Methods. 2014;69:30-8
51. Kurnia KA, Saputra F, Roldan MJM, Castillo AL, Huang J-C, Chen KH-C. et al. Measurement of Multiple Cardiac Performance Endpoints in Daphnia and Zebrafish by Kymograph. Inventions. 2021;6:8
52. Akerberg AA, Burns CE, Burns CG, Nguyen C. Deep learning enables automated volumetric assessments of cardiac function in zebrafish. Dis Model Mech. 2019;12:dmm040188
53. Gierten J, Pylatiuk C, Hammouda OT, Schock C, Stegmaier J, Wittbrodt J. et al. Automated high-throughput heartbeat quantification in medaka and zebrafish embryos under physiological conditions. Sci Rep. 2020;10:2046
54. Hou JH, Kralj JM, Douglass AD, Engert F, Cohen AE. Simultaneous mapping of membrane voltage and calcium in zebrafish heart in vivo reveals chamber-specific developmental transitions in ionic currents. Front Physiol. 2014;5:344
55. Tsutsui H, Higashijima S, Miyawaki A, Okamura Y. Visualizing voltage dynamics in zebrafish heart. J Physiol. 2010;588:2017-21
56. Perez Koldenkova V, Nagai T. Genetically encoded Ca(2+) indicators: properties and evaluation. Biochim Biophys Acta. 2013;1833:1787-97
57. Kaestner L, Scholz A, Tian Q, Ruppenthal S, Tabellion W, Wiesen K. et al. Genetically encoded Ca2+ indicators in cardiac myocytes. Circ Res. 2014;114:1623-39
58. Broyles CN, Robinson P, Daniels MJ. Fluorescent, Bioluminescent, and Optogenetic Approaches to Study Excitable Physiology in the Single Cardiomyocyte. Cells. 2018;7:51
59. Shen Y, Nasu Y, Shkolnikov I, Kim A, Campbell RE. Engineering genetically encoded fluorescent indicators for imaging of neuronal activity: Progress and prospects. Neurosci Res. 2020;152:3-14
60. Voleti V, Patel KB, Li W, Perez Campos C, Bharadwaj S, Yu H. et al. Real-time volumetric microscopy of in vivo dynamics and large-scale samples with SCAPE 2.0. Nat Methods. 2019;16:1054-62
61. Serbanovic-Canic J, de Luca A, Warboys C, Ferreira PF, Luong LA, Hsiao S. et al. Zebrafish Model for Functional Screening of Flow-Responsive Genes. Arterioscler Thromb Vasc Biol. 2017;37:130-43
62. Hegyi B, Shimkunas R, Jian Z, Izu LT, Bers DM, Chen-Izu Y. Mechanoelectric coupling and arrhythmogenesis in cardiomyocytes contracting under mechanical afterload in a 3D viscoelastic hydrogel. Proc Natl Acad Sci U S A. 2021;118:e2108484118
63. Spurgeon HA, duBell WH, Stern MD, Sollott SJ, Ziman BD, Silverman HS. et al. Cytosolic calcium and myofilaments in single rat cardiac myocytes achieve a dynamic equilibrium during twitch relaxation. J Physiol. 1992;447:83-102
64. Soppa GK, Lee J, Stagg MA, Felkin LE, Barton PJ, Siedlecka U. et al. Role and possible mechanisms of clenbuterol in enhancing reverse remodelling during mechanical unloading in murine heart failure. Cardiovasc Res. 2008;77:695-706
65. Kennedy MD, Galloway AV, Dickau LJ, Hudson MK. The cumulative effect of coffee and a mental stress task on heart rate, blood pressure, and mental alertness is similar in caffeine-naive and caffeine-habituated females. Nutr Res. 2008;28:609-14
66. Rana N, Moond M, Marthi A, Bapatla S, Sarvepalli T, Chatti K. et al. Caffeine-induced effects on heart rate in zebrafish embryos and possible mechanisms of action: an effective system for experiments in chemical biology. Zebrafish. 2010;7:69-81
67. IUPHAR/BPS Guide to pharmacology. Caffeine - Biological activity. Revised 15 October 2021. https://www.guidetopharmacology.org/GRAC/LigandDisplayForward?tab=biology&ligandId=407
68. Mesirca P, Torrente AG, Mangoni ME. Functional role of voltage gated Ca(2+) channels in heart automaticity. Front Physiol. 2015;6:19
69. Groenke S, Larson ED, Alber S, Zhang R, Lamp ST, Ren X. et al. Complete atrial-specific knockout of sodium-calcium exchange eliminates sinoatrial node pacemaker activity. PLoS One. 2013;8:e81633
Author contact
![]() Corresponding authors: Pierre Vincent, Tel: +33 1 44 27 25 88, E-mail: pierre.vincentfr; Beatriz Domingo, Tel: +34 926052988 extension 2686, E-mail: beatriz.domingoes; Juan Llopis, Tel: +34 967599315, E-mail: juan.llopises
Corresponding authors: Pierre Vincent, Tel: +33 1 44 27 25 88, E-mail: pierre.vincentfr; Beatriz Domingo, Tel: +34 926052988 extension 2686, E-mail: beatriz.domingoes; Juan Llopis, Tel: +34 967599315, E-mail: juan.llopises