Impact Factor
- Issue 14; 2026
- Issue 13; 2026
- Issue 12; 2026
- Issue 11; 2026
- Issue 10; 2026
- Volume 16; 2026
- Advance Articles
- Past Issues
- Cover Images
- Cover Suggestion
- Index & Coverage
- Special Issues
Introduction
Material and methods
Results
Discussion
Supplementary Material
Acknowledgements
References
International Journal of Biological Sciences
International Journal of Medical Sciences
 Global reach, higher impact

Theranostics 2023; 13(15):5483-5500. doi:10.7150/thno.85106 This issue Cite
Research Paper
Nanobody-mediated SPECT/CT imaging reveals the spatiotemporal expression of programmed death-ligand 1 in response to a CD8+ T cell and iNKT cell activating mRNA vaccine
Thomas Ertveldt1,#, Sofie Meulewaeter2,3,#, Yannick De Vlaeminck1, Oscar Olarte4, Katrijn Broos1, Serge Van Calenbergh5, Stephanie Bourgeois6, Joke Deprez2,3, Yves Heremans7, Cleo Goyvaerts1, Willem Staels6,8, Stefaan De Smedt2,3, Heleen Dewitte2,3, Nick Devoogdt9, Marleen Keyaerts9,10, Rein Verbeke2,3, Kurt Barbé4, Ine Lentacker2,3,*, ![]() , Karine Breckpot1,*,
, Karine Breckpot1,*, ![]()
1. Laboratory for Molecular and Cellular Therapy, Vrije Universiteit Brussel, Laarbeeklaan 103, B-1090 Brussels, Belgium.
2. Ghent research Group on Nanomedicines, Laboratory of Physical Pharmacy and General Biochemistry, Department of Pharmaceutics, Ghent University, Ottergemsesteenweg 460, B-9000 Gent, Belgium.
3. Cancer Research Institute Ghent (CRIG), Ghent University Hospital, Ghent University, Ghent B-9000, Belgium.
4. Biostatistics and Medical Informatics Research Group, Vrije Universiteit Brussel, Laarbeeklaan 103, B-1090 Brussels, Belgium.
5. Laboratory of Medicinal Chemistry, Department of Pharmaceutics, Ghent University, Ottergemsesteenweg 460, B-9000, Belgium.
6. Beta Cell Neogenesis (BENE), Vrije Universiteit Brussel, Laarbeeklaan 103, Brussels, Belgium.
7. Visual and Spatial Tissue Analysis (VSTA) Core Facility, Vrije Universiteit Brussel, Laarbeeklaan 103, 1090 Brussels, Belgium
8. Universitair Ziekenhuis Brussel (UZ Brussel), Department of Pediatrics, Division of Pediatric Endocrinology, Brussels, Belgium.
9. Medical Imaging department, In Vivo Cellular and Molecular Imaging Laboratory, Vrije Universiteit Brussel, Laarbeeklaan 103, B-1090 Brussels, Belgium.
10. Nuclear Medicine Department, UZ Brussel, Laarbeeklaan 101, B-1090 Brussels, Belgium.
# The co-first authors contributed equally to this work.
* The co-last authors contributed equally to this work.
Received 2023-4-8; Accepted 2023-9-6; Published 2023-10-9
Abstract

Rationale: Although promising responses are obtained in patients treated with immune checkpoint inhibitors targeting programmed death ligand 1 (PD-L1) and its receptor programmed death-1 (PD-1), only a fraction of patients benefits from this immunotherapy. Cancer vaccination may be an effective approach to improve the response to immune checkpoint inhibitors anti-PD-L1/PD-1 therapy. However, there is a lack of research on the dynamics of PD-L1 expression in response to cancer vaccination.
Methods: We performed non-invasive whole-body imaging to visualize PD-L1 expression at different timepoints after vaccination of melanoma-bearing mice. Mice bearing ovalbumin (OVA) expressing B16 tumors were i.v. injected with the Galsome mRNA vaccine: OVA encoding mRNA lipoplexes co-encapsulating a low or a high dose of the atypical adjuvant α-galactosylceramide (αGC) to activate invariant natural killer T (iNKT) cells. Serial non-invasive whole-body immune imaging was performed using a technetium-99m (99mTc)-labeled anti-PD-L1 nanobody, single-photon emission computerized tomography (SPECT) and X-ray computed tomography (CT) images were quantified. Additionally, cellular expression of PD-L1 was evaluated with flow cytometry.
Results: SPECT/CT-imaging showed a rapid and systemic upregulation of PD-L1 after vaccination. PD-L1 expression could not be correlated to the αGC-dose, although we observed a dose-dependent iNKT cell activation. Dynamics of PD-L1 expression were organ-dependent and most pronounced in lungs and liver, organs to which the vaccine was distributed. PD-L1 expression in lungs increased immediately after vaccination and gradually decreased over time, whereas in liver, vaccination-induced PD-L1 upregulation was short-lived. Flow cytometric analysis of these organs further showed myeloid cells as well as non-immune cells with elevated PD-L1 expression in response to vaccination. SPECT/CT imaging of the tumor demonstrated that the expression of PD-L1 remained stable over time and was overall not affected by vaccination although flow cytometric analysis at the cellular level demonstrated changes in PD-L1 expression in various immune cell populations following vaccination.
Conclusion: Repeated non-invasive whole-body imaging using 99mTc-labeled anti-PD-L1 nanobodies allows to document the dynamic nature of PD-L1 expression upon vaccination. Galsome vaccination rapidly induced systemic upregulation of PD-L1 expression with the most pronounced upregulation in lungs and liver while flow cytometry analysis showed upregulation of PD-L1 in the tumor microenvironment. This study shows that imaging using nanobodies may be useful for monitoring vaccine-mediated PD-L1 modulation in patients and could provide a rationale for combination therapy. To the best of our knowledge, this is the first report that visualizes PD-L1 expression upon cancer vaccination.
Keywords: melanoma, mRNA vaccine, programmed death-ligand 1, nanobody, single-photon emission computerized tomography/computed tomography
Introduction
The treatment of patients with advanced metastatic melanoma has been revolutionized since the development of antibodies that block the inhibitory immune checkpoints programmed death ligand 1 (PD-L1) and its receptor programmed death-1 (PD-1) [1]. These antibodies remove the brake that PD-1 enforces on T cell proliferation and anti-tumor activity and show clinical benefit in approximately 40% of the patients [2]. Despite this success, up to 60% of patients are not surviving five years after treatment.
Cancer vaccination may be an effective approach to improve the response to anti-PD-L1/PD-1 therapy [3]. Several cell-based vaccination studies have been performed focusing primarily on dendritic cells (DCs) as these cells are indispensable for antigen presentation to and activation of melanoma-specific CD8+ T cells [4]. Furthermore, crosstalk of DCs with T cells is vital for effective anti-PD-1 therapy [5]. However, the preparation of these patient-specific DC vaccines is time-consuming, expensive and the outcome of DC vaccination is variable [6,7]. Therefore, viral and non-viral strategies to deliver tumor antigens with or without adjuvants to fully activate the T cell stimulatory capacity of DCs in situ have been explored [8,9]. Of these, mRNA-based vaccines are of major interest as the experience with COVID-19 mRNA-vaccines has proven their worth as a cost-effective, widely adoptable vaccine platform [10].
Galsomes, the mRNA vaccination platform used in this work, consist of cationic lipid-based lipoplexes co-encapsulating tumor antigen encoding mRNA and the glycolipid adjuvant α-galactosylceramide (αGC). After i.v. administration, Galsomes are taken up by DCs which subsequently present tumor antigen-derived peptides in class I major histocompatibility (MHC-I) complexes to CD8+ T cells. Furthermore, due to the inclusion of the atypical adjuvant αGC, another T cell with anti-tumor properties, namely invariant natural killer T (iNKT) cells, will get activated as a consequence of the presentation of the glycolipid antigen in the context of CD1d complexes by DCs [11]. iNKT cells are innate-like T cells that can exert direct cytotoxic effects on cells upon stimulation of their natural killer activating receptor or by interaction with CD1d-expressing cells. Hence, iNKT cells can kill dedicated tumor cells and modulate the immunosuppressive tumor microenvironment (TME), e.g., by killing alternatively activated immunosuppressive macrophages [12,13]. Additionally, activation of iNKT cells results in a rapid burst of interferon-gamma (IFN-γ), which is a pleiotropic cytokine that enhances antigen presentation by DCs and further stimulates activation of CD8+ T cells. Furthermore, IFN-γ produced by iNKT cells, but also by CD8+ T cells, is indispensable for tumor cell killing [14]. Paradoxically, IFN-γ and other cytokines such as IL-6 orchestrate the expression of PD-L1 to dampen immune responses and avoid collateral damage [15,16]. As a consequence, PD-L1 can be upregulated in cancer cells, but also in immune cells such as DCs, shortly after immune activation, impairing T cell priming [17,18]. We have previously shown that combination therapy of Galsomes with anti-PD-L1 therapy is synergistic and not only improves the therapeutic outcome, but also strengthens immune cell activation upon repeated Galsome vaccination [11]. Thus, PD-L1 is not only a barrier that hampers the immune response during the T cell effector phase at the tumor site but also during the T cell activation phase.
Though the opposing antitumor activities of IFN-γ seem contradictory at first glance, this opens avenues to set up effective combination therapies of cancer vaccines with anti-PD-1/PD-L1 therapy, as demonstrated in several clinical trials [19,20]. However, most studies combining immune checkpoint blockade with other therapies, operate on a trial-and-error basis and lack the ability to properly gauge PD-L1 expression levels. To optimally set up a treatment regimen based on Galsome vaccination and PD-1/PD-L1 therapy and avoid unneeded administration of immune checkpoint inhibitors in combination with cancer vaccination, it is key to study the onset and dynamics of PD-L1 expression upon Galsome vaccination. This allows to further rationalize and optimize immune checkpoint blockade combination therapy to improve therapeutic outcome whilst minimizing immune-related adverse events (irAE). In this manuscript, we evaluated whole body imaging to provide information on the spatial distribution of PD-L1 expression as well as gain more fundamental insights into the dynamics of PD-L1 expression upon vaccination. Nuclear imaging of PD-L1 using single-photon emission computerized tomography (SPECT) or positron emission tomography (PET) in combination with computed tomography (CT) can be achieved using radiolabeled nanobodies, small yet robust and easy-to-radiolabel antigen binding moieties that are derived from heavy chain-only antibodies that are found in camelids [21-23]. Due to its non-invasiveness, this technique allows repeated imaging and can visualize heterogeneity within and between different cancer lesions, in stark contrast to immunohistochemistry of tumor biopsies. We applied a technetium-99m (99mTc)-labeled anti-PD-L1 nanobody [23] to image the dynamic expression of PD-L1 in a mouse melanoma model after Galsome vaccination. Moreover, we assessed the effect of the iNKT cell-ligand αGC on PD-L1 expression by varying the αGC-dose included in the Galsome-vaccine. We generated serial high-resolution images allowing quantification of PD-L1 expression in peripheral organs and tumors. Ex vivo analysis using flow cytometry confirmed the results of the quantified images and showed that both non-immune and myeloid cells contributed to PD-L1 expression in the organs that were studied. In conclusion, our data show that PD-L1 imaging could be a useful tool to stratify patients and gauge therapies' eligibility for PD-L1 blockade.
Material and methods
Mice
Female C57BL/6 and OT-I mice (6-12 weeks) were purchased from Charles River (France) and handled according to institutional guidelines. Experiments were approved by the ethical committee for use of laboratory animals at Vrije Universiteit Brussel (19-272-1) and Ghent University (20/07).
Generation and quality control of B16-OVA cells
Murine B16 melanoma cells (ATCC) were lentivirally engineered to express ovalbumin (OVA), resulting in B16-OVA cells. Briefly, the expression cassette of the pLenti-CMV-GFP-Puro transfer plasmid (Addgene), consisting of the cytomegalovirus promotor (CMV) driving the expression of green fluorescent protein (GFP), was replaced with an expression cassette, consisting of the EF1α promotor driving the expression of OVA (pLenti-EF1α-OVA). To that end, the CMV promotor was excised using ClaI-XbaI (Thermo Scientific) and replaced by an EF1α gBlock with matching overhangs (IDT), while GFP was excised using BamHI-SalI (Thermo Scientific) and replaced by an OVA gBlock with matching overhangs (IDT). Second-generation, VSV.G pseudotyped lentiviral particles were produced using pLenti-EF1α-OVA, the packaging plasmid pCMV∆R8.9 and envelope plasmid pMD.G (kind gifts from D. Trono, Geneva) [24]. B16 cells were transduced with lentiviral particles at a multiplicity of infection of 10, after which transduced cells were selected using 0.4 mg mL-1 puromycin (Sigma-Aldrich) in Dulbecco's modified Eagle's medium (DMEM, Sigma-Aldrich) containing 10% heat-inactivated fetal bovine serum (FBS, Life Technologies), 2 mmol L-1 L-glutamine (Sigma-Aldrich), 100 U mL-1 penicillin and 0.1 mg mL-1 streptomycin (Sigma-Aldrich). Cells were grown at 37°C in a humidified atmosphere with 5% CO2. The MycoSEQ mycoplasma detection assay, based on polymerase chain reaction (ThermoFisher Scientific), was used to screen the B16-OVA cell line for mycoplasma contamination.
CD8+ T cell activation assay
B16 cells, B16 cells pulsed with 10 µg mL-1 of the OVA-derived peptide SIINFEKL (Anaspec) and B16-OVA cells were co-cultured at a 1:10 ratio with 105 CD8+ T cells that were enriched from the spleen of OT-I mice using the CD8α+ T cell isolation kit II (Miltenyi Biotec). As controls, CD8+ T cells were cultured without further stimulation or with addition of anti-CD3/CD28 antibody coated beads (1/800 dilution) (Gibco). On day 6 of co-culture, supernatants were collected and analyzed via ELISA for IFN-γ production (eBioScience), while cells were analyzed for IFN-γ production by means of flow cytometry.
mRNA
The genetic code of the fusion protein consisting of the first 80 amino acids of the invariant chain (Ii80) fused to a truncated and non-secreted variant of OVA (tOVA) was cloned into the pGEM-plasmid [25]. The pGEM-Ii80tOVA plasmid and pLMCT-fLuc (for synthesis of a thermostable firefly luciferase (fLuc)) were linearized with the restriction enzymes SpeI (Thermo Fisher Scientific) and BfuAI (New England Biolabs, Frankfurt am Main, Germany) respectively and were used as a template for in vitro transcription (IVT) of mRNA using the T7 MegaScript kit (Thermo Fisher Scientific) and the Clean CAP AG reagent (TriLink Biotech). The chemically modified nucleotide N1-methylpseudouridine-5'-triphosphate (1-mѰU, Tebu-Bio) was used instead of uridine. The yield, purity, and integrity of the mRNA were analysed as previously described [26].
Vaccine formulation - Galsomes
Galsomes were prepared by mixing chloroform-dissolved 1,2-dioleoyl-3-trimethylammonium-propane (DOTAP), cholesterol (both from Avanti Polar Lipids), and αGC (synthesized in-house) at a molar ratio of 40:60:0.015 (high αGC-dose) or 40:60:0.0015 (low αGC-dose) in a round-bottom flask. After evaporation of the chloroform under a nitrogen stream, the resulting lipid film was rehydrated in HEPES buffer (20 mM, pH 7.4, Sigma Aldrich) to generate liposomes at a final lipid concentration of 12.5 mM. Liposomes were sonicated in a Branson sonication bath until the dispersion cleared. Complexation with Ii80tOVA mRNA (10 µg) to formulate Galsomes was performed at an NP-ratio of 3 (N referring to the positive charges on the lipids, P referring to the negative charges on the nucleic acids) in an isotonic HEPES buffer containing 5% glucose. In case Galsomes (high dose) were prepared to study biodistribution, 1.2 mol% of the total lipid amount was replaced by the lipophilic dye DiR (Molecular Probes™, Thermo Fisher Scientific) and Galsomes were complexed with fLuc mRNA. Quality controls on the generated Galsomes were done by measuring size, polydispersity, and charge using a Malvern Zetasizer nano-ZS [11].
Vaccination of melanoma-bearing mice
A total of 3×10⁵ B16-OVA cells were implanted subcutaneously (s.c) into the right thigh of mice that were sedated with 2.5% isoflurane and 1 L.min-1 oxygen flow rate (Abbott). Monitoring of tumor growth was performed daily. A caliper was used to measure the dimensions (length and width) of palpable tumors. Tumor volumes were calculated as follows: (width × length2)/2. Before treatment, animals were randomized based on tumor volume and were intravenously (i.v.) injected when the tumors reached a size of 166±137 mm3 (11 days post inoculation) with a low or a high dose Galsomes containing both 10 µg Ii80tOVA mRNA with 2 or 20 ng αGC, respectively. Mice allocated to the control group received phosphate-buffered saline (PBS, Sigma-Aldrich).
In vivo Galsome distribution
Female C57BL/6 mice (6 weeks old) were purchased from Envigo (Gannat, France) and housed in an SPF facility. A total of 3×10⁵ B16-OVA cells were implanted s.c into the right thigh of mice that were sedated with 2.5% isoflurane and 1 L.min-1 oxygen flow rate (Abbott). Monitoring of tumor growth was performed daily. A caliper was used to measure the dimensions (length and width) of palpable tumors. Mice received a dose of 10 µg fLuc mRNA DiR-labeled Galsomes (high dose) in a total volume of 200 μl via i.v. injection in the tail vein 11 days after inoculation. 24 h after the injection, mice were anesthetized in a ventilated anesthesia chamber with 3% isoflurane in oxygen, and the chest, abdomen and right hind leg were depilated with hair removal cream. Subsequently, VivoGlo Luciferin (Promega) was administered intraperitoneally (i.p.). After 10 min, bioluminescence and fluorescence images were acquired by the IVIS lumina II system (PerkinElmer, Waltham, MA, USA). Images were quantitatively analysed using LivingImage software (PerkinElmer).
Labeling of nanobodies with 99mTc-pinhole SPECT/microCT imaging and analysis
Repeated non-invasive imaging of PD-L1 was performed on days 1, 4, 7, 10 and 14 after treatment of B16-OVA-bearing mice with PBS or Galsomes. Nanobody C3 that specifically binds mouse PD-L1 was coupled via its carboxyl-terminal histidine (HIS6)-tag with a 99mTc-tricarbonyl intermediate [99mTc][Tc(H2O)3(CO)3]+ that was synthesized using the Isolink® labeling kit (Mallinckrodt Medical BV) [20]. The solution of radiolabeled nanobodies was purified on a NAP5 column (GE Healthcare) pre-equilibrated with PBS to remove unbound [99mTc][Tc(H2O)3(CO)3]+. Filtration over a 0.22 μm filter (Millipore) was performed to remove aggregates. The labeling efficiency was determined directly after labeling and after purification by radioactive instant thin layer chromatography with 100% acetone as the mobile phase. Mice were i.v. injected with radiolabeled nanobodies with a radiochemical purity of >95% and a specific activity of 12.5±2.2 MBq/µg and on average 62.4±11.0 MBq of injected activity. Pinhole SPECT/microCT imaging was performed on anesthetized mice (Ketamidor, Richter Pharma AG) using a Vector+/CT scanner (MILabs). Image reconstruction was performed after which 15×18×17 mm³, 3.5×2.5×3.5 mm³ or 7×4×6 mm³ ellipsoid regions of interests (ROIs) were positioned on tumor tissue, lungs and liver, respectively to quantify uptake of the radiolabeled nanobodies. For lung and liver uptake concentration, a smaller ROI was positioned within the organ, and the relative uptake concentration was obtained directly from the imposed ROI in the AMIDE imaging software (Medical Image Data Examiner software, version 1.0.4) using the injected activity and the camera calibration factor as input parameters. Tumor uptake was calculated by the use of a large ROI positioned over the total tumor and surrounding non-tissue containing areas, and subsequently dividing total activity by the callipered tumor volume. The results obtained in AMIDE were corrected for decay, calculated and expressed as percentage of injected activity per cubic centimeter of callipered tumor volume (%IA/cc). Representative SPECT/CT images are overlays of SPECT and CT signals and were generated using three-dimensional maximum intensity projection (3D MIP) SPECT.
Preparation of single cell suspensions from organs
Single cell suspensions were prepared from lungs, liver, and tumor. Lungs, liver, and tumor were digested using enzymatic digestion kits and an OctoMACS tissue dissociator (Miltenyi Biotec) according to the manufacturer's specifications. Red blood cells were removed by addition of a red blood cell lysis buffer (Biolegend).
Flow cytometry
To study expression of MHC-I (H2-Kb) and MHC-I/OVA (H2-Kb/SIINFEKL) complexes on B16 and B16-OVA cells, cultured for 24 h in the absence or presence of 50 ng recombinant murine IFN-γ (Immunotools), cells were stained with a FITC-conjugated anti-H2-Kb antibody (clone AF6-88.5.5.3, eBioscience) or an APC-conjugated anti-H2-Kb/SIINFEKL antibody (clone 25-D1.16, RRID: AB_11219595). Cells were acquired on the LSR Fortessa and analyzed using FACS Diva software (Becton Dickinson [BD]). Gating of viable cells was performed on FSC/SSC characteristics, unstained cells were used to gate for MHC-I positivity, while B16 cells were used to gate for H2-Kb/SIINFEKL positivity.
Analysis of CD8+ T cells (OT-I) that produce IFN-γ upon recognition of H2-Kb/SIINFEKL by their T cell receptor (TCR) was performed by staining the T cells with a PerCP-Cy5.5-conjugated anti-CD8α antibody (clone 53-6.7, RRID: AB_394081) after which the cells were fixed and permeabilized using the Cytofix/Cytoperm kit (BD) for intracellular staining of IFN-γ by the APC-conjugated anti-IFN-γ antibody (clone 554413, RRID: AB_398551). Cells were acquired on the LSR Fortessa and analyzed with FlowJo™ software (BD, RRID:SCR_008520). Gating of viable cells was performed on FSC/SSC characteristics, unstained cells were used to gate for CD8 positivity, while unstimulated CD8+ T cells were used to gate for IFN-γ positivity.
Single cell suspensions were used to analyse the immune cell composition and expression of PD-1 and PD-L1 in selected organs. Cells were incubated with anti-CD16/32 antibodies (Biolegend, RRID: AB_312801) and stained with Live/Dead marker (LIVE/DEAD™ Fixable Green Dead Cell Stain Kit, Thermo Fisher Scientific). The following antibodies were used to stain (i) conventional T cells: anti-CD45.2-APC-eF780 (clone 104, RRID:AB_1727492), anti-CD3ε-BV605 (clone 145-2C11, RRID: AB_2737945), anti-CD4-AF700 (clone RM4-5, RRID: AB_396956), anti-CD8α-PerCP-Cy5.5 (clone, 53-6.7, RRID: AB_394081), and anti-PD-L1-BV421 (clone MIH5, RRID:AB_2738911); (ii) myeloid cells: anti-CD45.2-APC-eF780 (clone 104, RRID: AB_1727492), anti-CD11b-AF700 (clone M1/70, RRID: AB_396960), anti-Ly6G-AF647 (clone 1A8, RRID: AB_1727560), anti-MHC-II-PE/Dazzle594 (clone M5/114.15.2, RRID: AB_2565979), anti-CD11c-BV650 (clone HL3, RRID: AB_2725779), anti-F4/80-BB700 (clone T45-2342, RRID:AB_2743450), and anti-PD-L1-BV421; (iii) iNKT cells: anti-CD45.2-APC-eF780, anti-TCRβ-APC (clone H57-597). All antibodies were obtained from BD except for anti-MHC-II antibodies that were obtained from Biolegend. To study iNKT cells and OVA-specific CD8+ T cells, samples were additionally stained with PE-labeled mCD1d-PBS57 tetramer (kindly provided by the NIH tetramer core facility) and APC-conjugated OVA dextramer (Immudex), respectively. Cells were acquired on a FACS Celesta and analyzed using FlowJo™ software (BD, RRID: SCR_008520). Gating strategy is shown in Figure S1.
Statistical analysis
Kaplan-Meier curves that show the time-to-reach humane endpoints were statistically analysed using Log-Rank (Mantel-Cox) tests. All other statistical tests are described in figure legends. All statistical analyses, except for statistical prediction models, were conducted in Graphpad™ Prism 9.3.1. The identification and figures for the regression models were developed using the Linear and Nonlinear Mixed effects Models [27] and Graphics for Data Analysis [28] in software R (R Core Team 2021). Given the no linear behavior of PD-L1 along time for the different conditions (PBS, low and high doses) the regression models were done over the transformed data  . Respectively, the obtained regression models for the PD-L1 signal in lung, liver and tumor are:
+
+

+
+
+
With t the days after vaccination,  the low αGC-dose and
  the high αGC-dose.
The number of times experiments were repeated (n) as well as the number of mice per condition (mpc) are indicated in the figure legends. The asterisks in the figures indicate the level of statistical significance: *, p<0.05; **, p<0.01, ***, p<0.001, ****, p<0.0001.
Results
Galsome vaccination induces an αGC-dose-dependent immune response
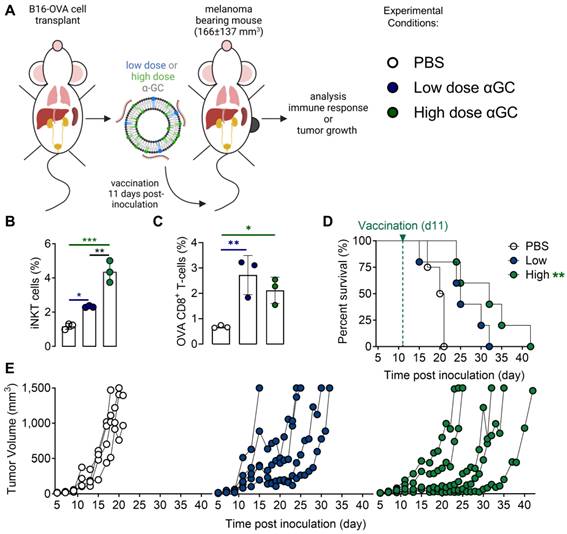
A therapeutic vaccination study with OVA-encoding mRNA Galsomes in an OVA-expressing melanoma tumor model was performed (Figure 1A). To this end, B16-OVA cells were generated through the transduction of melanoma B16 cells with lentiviral vectors encoding OVA (B16-OVA), which allowed to evaluate therapy response to Galsome-induced OVA-specific T cell responses as shown in Figure S2. To study the impact of the αGC-dose on the induction of therapeutic immune responses, we prepared two Galsome-formulations containing a fixed dose of 10 µg OVA mRNA and either a low (2 ng) or high (20 ng) dose of αGC. Low and high doses were selected based on an earlier study performed by Verbeke et al. making use of mRNA-Galsomes with the high αGC-dose (20ng) [11] Modified mRNA (1-mѰU) was used to achieve maximal mRNA expression and to assure a high antigen presentation to CD8+ T cells. We showed that the αGC-dose did not impact the size, polydispersity, and charge of mRNA Galsomes (Figure S3). Subsequently, C57BL/6 mice were subcutaneously (s.c.) implanted with a B16-OVA tumor and vaccinated with two different Galsome formulations (low and high αGC-dose) or PBS when tumors reached a size of 166±137 mm3 (11 days post inoculation), as shown in Figure 1A. The immune response was evaluated by measuring the number of anti-tumor immune effector cells (iNKT cells and OVA-specific CD8+ T cells) in the spleen 4 days after vaccination, showing a significant increase in iNKT cells and OVA-specific CD8+ T cells upon vaccination of both αGC-doses (Figure 1B-C). We also studied the therapeutic outcome by monitoring tumor growth and registering the time-to-reach humane endpoints, i.e., a tumor volume of 1500 mm3 or weight loss exceeding 20% of initial weight. Mice vaccinated with Galsomes containing a low or high dose of αGC showed a delay in tumor growth resulting in an increased time to reach humane endpoints (Figure 1D-E). Compared to mice treated with PBS, only mice vaccinated with the high aGC-Galsomes showed a significant therapeutic effect (p= 0.005062), although a dose-dependent delay in tumor growth was observed.
Galsome vaccination induces αGC-dose-dependent therapeutic anti-melanoma immune responses. (A) Schematic overview of the Galsome vaccination regimen. (B-C) Mean percentage ± SD of (B) iNKT cells and (C) OVA-specific CD8+ T cells detected in the spleen 4 days after vaccination within the CD45+ and CD45+CD3+ populations respectively. Symbols represent individual data points. Statistical analysis was performed by one-way ANOVA with Holm-Sidak's multiple comparison test (n=1, mpc=3). (D) Kaplan-Meier plot showing the time to reach humane endpoints and statistically analysed using Log-Rank (Mantel-Cox) tests. (E) Tumor growth kinetics showing the progression of tumors per mouse until day 42. The data are representative of one out of 2 independent experiments (n=2, mpc=4-6).
PD-L1 is rapidly and systemically upregulated after Galsome vaccination
Both iNKT cells and CD8+ T cells that are activated upon Galsome vaccination produce IFN-γ, a driving force for PD-L1 expression [29,30]. Therefore, PD-L1 expression is expected to be upregulated upon vaccination. We studied the spatiotemporal expression of PD-L1 by serial SPECT/microCT imaging on days 1, 4, 7, 10 and 14 after injection of mice with Galsomes or PBS as schematically represented in Figure 2A. Since previous results showed a dose-dependent proliferation of iNKT cells (Figure 1B), we studied the effect of two αGC-doses on PD-L1 upregulation. As a tracer for PD-L1 detection we used a nanobody that we previously developed and specifically binds mouse PD-L1 [23].
Galsome vaccination alters PD-L1 expression. (A) Schematic overview of the in vivo imaging experiment. (B) Representative coronal view images of 3D MIP SPECT/microCT scans showing the accumulation of anti-PD-L1 99mTc-nanobodies in B16-OVA-bearing mice that were treated 1, 4, 7, 10 or 14 days prior with PBS or Galsomes containing a low or a high αGC-dose (n=2, mpc=4-5). BAT = Brown adipose tissue, LN = Lymph node.
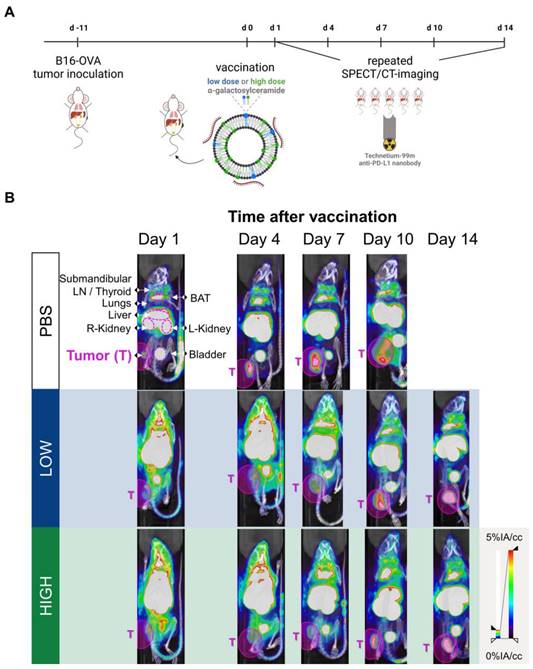
We showed that Galsome vaccination, irrespective of the dose of αGC, induced a strong systemic upregulation of PD-L1 over a period of several days compared to untreated mice (Figure 2B). A high accumulation of the 99mTc-labeled PD-L1-specific nanobody was observed in kidneys and bladder in all mice (Figure 2B), which was expected as nanobodies are filtered from the system via the kidneys due to their small size (13kDa). Furthermore, a high accumulation of the anti-PD-L1 nanobody was observed in brown adipose tissue (BAT), lymph nodes and liver of both untreated and treated mice (Figure 2B), which is in line with the anti-PD-L1 nanobody distribution described in earlier experiments [23]. BAT and lymph nodes were shown to have a high basal PD-L1 expression which corresponds with the high accumulation of 99mTc-nanobodies. The large activity deposit in liver has been partially ascribed due to non-specific uptake of this nanobody [23] Noteworthy, the bladder of vaccinated mice contained less activity compared to untreated mice (PBS) 1 day upon vaccination, highlighting the high systemic uptake of the radioactive tracer in treated mice.
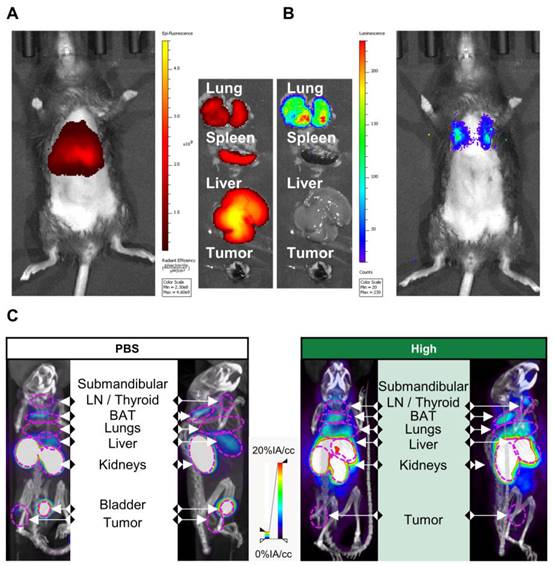
To link these PD-L1 expression maps to mRNA Galsomes biodistribution, we labeled Galsomes, containing mRNA encoding fLuc, with the lipophilic dye DiR. This allowed us to visualize both the biodistribution of the mRNA Galsomes and fLuc expression with whole animal imaging. Figure 3A-B shows that DiR-loaded Galsomes strongly accumulated in lung, spleen and liver while mRNA expression was limited to lungs 24 h post vaccination [11,31]. This discrepancy in mRNA lipid nanoparticle biodistribution and expression of mRNA has been observed by other authors and is possibly a consequence of the uptake of mRNA lipid by different cell types [32]. Interestingly, analogous to the biodistribution of Galsomes, lungs and liver displayed an increased radiotracer uptake one day after administration of Galsomes containing a high αGC-dose compared to untreated mice (PBS), indicating increased PD-L1 expression in these organs where the vaccine accumulated (Figure 3C). Due to the small anatomical distance between spleen and kidney, it was impossible to quantify the radiotracer uptake in the spleen.
PD-L1 expression 24 h after vaccination in part overlaps with the biodistribution of Galsomes. (A, B) Representative image of (A) Galsome distribution using near-infrared fluorescence and (B) bioluminescence in B16-OVA-tumor bearing mice 24 h after administration of DiR-loaded Galsome particles complexed with fLuc mRNA. (C) Representative image of systemic anti-PD-L1 99mTc-nanobody distribution 1 hour post injection via 3D MIP SPECT/CT overlay (coronal [left] and sagittal [right] view) 24 h after administration of PBS or Galsomes containing a high αGC-dose (High) in B16-OVA bearing mice. BAT = Brown adipose tissue, LN = Lymph node.
PD-L1 radiotracer uptake kinetics in lungs and liver differ but drop to baseline levels a few days after vaccination
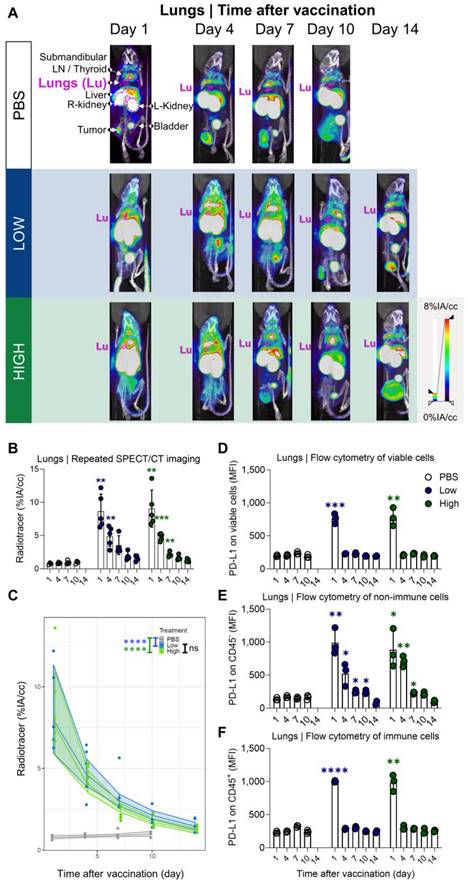
Our results showed a strong and rapid upregulation of PD-L1 after vaccination, which was most pronounced in liver and lung and corresponded with Galsome biodistribution. Therefore, we decided to further analyse the upregulation of PD-L1 by positioning ROIs over these organs and quantifying the accumulation of the 99mTc-labeled PD-L1-specific nanobody as a percentage of injected activity over tissue volume. We showed that PD-L1 expression was strongly upregulated in both organs (liver and lung) as early as one day after vaccination (Figure 4A-B and 5A-B). PD-L1 expression levels gradually decreased to baseline over a period of 7 days in the lung (Figure 4A-B), whereas PD-L1 expression in the liver already receded to baseline levels by the next time point of the analysis (4 days after vaccination) (Figure 5A-B). Subsequently, a statistical regression model was applied to evaluate if PD-L1 is dose-dependently upregulated in vaccinated mice and if there is a time-dependent effect on the expression levels (Figure 4C and 5C and Tables S1-4). The regression model indicated that PD-L1 expression in liver and lung of control mice did not significantly change over time, while it was significantly upregulated in liver and lungs of vaccinated mice. However, no significant differences in PD-L1 were found between the two αGC-doses in Galsomes (Tables S2 and S4).
Quantification of radiotracer uptake in lungs shows a gradual decrease after vaccination and corresponds with PD-L1 expression on non-immune cells in flow cytometry. (A) Representative 3D MIP SPECT/microCT images (coronal view) showing the systemic accumulation of anti-PD-L1 99mTc-nanobodies. B16-OVA-bearing mice were imaged 1, 4, 7, 10 or 14 days after treatment with PBS or Galsomes containing a low or a high dose αGC. (B) Radiotracer accumulation in lung tissue, as quantified by imaging. Data are shown as mean ± SD of one out of two independent experiments. Statistical analysis was performed by unpaired multiple t-test with Welch correction (n=2, mpc=4-5). (C) Regression model with confidence intervals and raw data points. The curve and the intervals are obtained by inverse transformation of the proposed model (see statistical analysis and Tables S1 and S2). Flow cytometry results represented as mean fluorescence intensity (MFI) of the viable (D), non-immune (CD45-) (E) and immune (CD45+) (F) cell population in lung tissue (n=1, mpc=3). Data are shown as mean ± SD. Statistical analysis was performed by unpaired multiple t-tests. Lu = Lungs, LN = Lymph node.
Galsome vaccination induces rapid, short-lasting expression of PD-L1 in liver. (A) Representative 3D MIP SPECT/microCT images (sagittal view) showing the whole-body accumulation of anti-PD-L1 99mTc-nanobodies in chronological order after vaccination. B16-OVA-bearing mice were treated 1, 4, 7, 10 or 14 days prior with PBS or Galsomes containing a low or a high αGC-dose (mpc=4-5). (B) Radiotracer accumulation in liver tissue, as quantified by imaging. Data are shown as mean ± SD of one out of two independent experiments. Statistical analysis was performed by unpaired multiple t-test with Welch correction (n=2, mpc=4-5). (C) Regression model with confidence intervals and raw data points. The curve and the intervals are obtained by inverse transformation of the proposed model (see statistical analysis and Tables S3 and S4). Flow cytometry results represented as MFI of the viable (D), non-immune (CD45-) (E) and immune (CD45+) (F) cell population in liver tissue. (n=1, mpc=3) Data are shown as mean ± SD. Statistical analysis was performed by unpaired multiple t-test. Li = Liver, LN = Lymph node.)
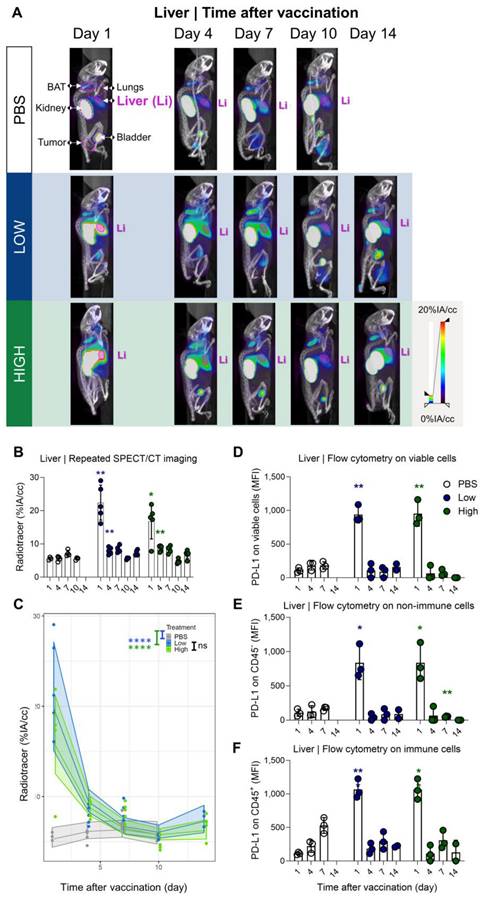
To corroborate the observations obtained with SPECT/microCT imaging at the single cell level, additional mice were included in the study and sacrificed on days 1, 4, 7, 10 and 14. Lung and liver tissue were processed to single cell suspensions and analysed with flow cytometry. Strikingly, we observed clear differences between the data obtained with SPECT/CT imaging and flow cytometry (Figure 4D). This could possibly be attributed to the organ digestion protocol, which focused on the conservation of immune cells and consequently led to selective enrichment of these cells, while partly losing non-immune cells which make up the majority of the total lung (e.g., 89% epithelial cells) [33]. Therefore, we analysed the PD-L1 expression within the immune (CD45+) subpopulation and non-immune (CD45-) subpopulation, which represented 90% and 10% of the viable population respectively. Indeed, while PD-L1 expression in immune cells (Figure 4F) showed a rapid PD-L1 upregulation and subsequent downregulation, a different PD-L1 expression pattern was observed for non-immune cells (Figure 4E). Here, a rapid PD-L1 upregulation was followed by a gradual decrease in PD-L1 expression as a function of time consistent with the whole-body imaging data. These findings suggest that in the lungs, non-immune cells contribute to PD-L1 expression after vaccination to a larger extent which dominates the whole body images. In the liver, both, non-immune (Figure 5E) and immune cells (Figure 5F) showed the same PD-L1 expression pattern as the whole viable cell population (Figure 5D), which corresponded to the whole-body imaging results. For both organs, we also evaluated the number of PD-L1+ cells in these cell populations as this obviously also contributes to the overall PD-L1 expression. (Figure S4A-F) shows that both variables (MFI of PD-L1+ cells and amount of PD-L1+ cells) showed the same trends strengthening our conclusions.
Myeloid cells as well as non-immune cells contribute to vaccination-induced upregulation of PD-L1 in liver and lungs
To gain more insight into the effect of vaccination on PD-L1 expression at the cellular level, we performed flow cytometry analysis of different immune cell types in lung and liver tissue. This analysis was performed 1 day after vaccination, as for both organs the highest PD-L1 expression levels were measured at this timepoint. We studied the prevalence and the number of PD-L1 expressing cells of several immune cell types and non-immune (CD45-) cells in the lung and liver (Figure 6).
PD-L1 expression in lung and liver is elevated in myeloid cells and non-immune cells but also in T cells in liver. (A,C) The fraction of PD-L1+ non-immune cells (CD45-), DCs, macrophages (Mφ), granulocytes, monocytes, CD4+ and CD8+ T cells 1 day after vaccination with Galsomes containing a low (blue) or high (green) αGC-dose or PBS (grey) in (A) lung and (C) liver. (B,D) The fraction of non-immune cells and different immune cell types within viable cells 1 day after vaccination in (B) lung and (D) liver. Symbols represent individual data points and mean is indicated by a line. Statistical analysis was performed by two-way ANOVA followed by Tukey's post hoc test. (n=1, mpc=3).
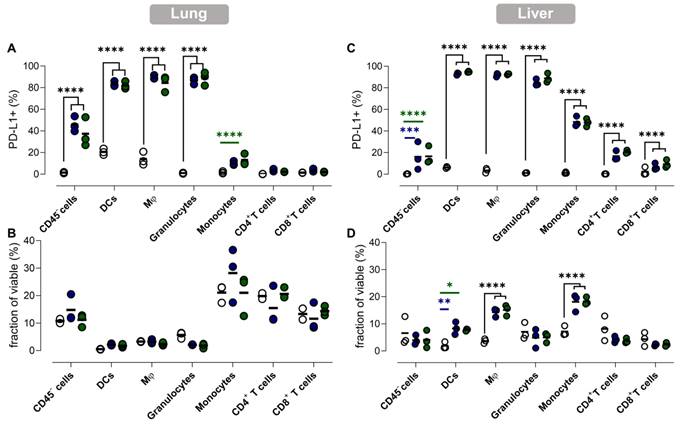
In accordance with the previous observations, dynamics of PD-L1 expression in lungs and liver were dissimilar. We observed a drastic upregulation of PD-L1 on non-immune and myeloid cells in lung tissue after vaccination (Figure 6A), while no significant influx of immune cells or other cell types in lungs was observed (Figure 6B). In contrast, we observed a significant increase of myeloid cells (except granulocytes) in the liver of vaccinated mice, which coincided with a rising fraction of PD-L1+ myeloid cells (Figure 6D). Remarkably, PD-L1 was also upregulated on T cells in the liver (Figure 6C). Note that increasing the αGC-dose from low to high did not result in a significant increase of PD-L1+ cells or in a higher influx of immune cells one day after vaccination.
The high radiotracer uptake observed in liver and lung by in vivo imaging combined with the uptake of Galsomes in the liver and lung, made us question whether this PD-L1 expression could be the result of activation and thus presence of iNKT cells and OVA-specific CD8+ T cells [31]. Lung tissue was of special interest since we also observed transfection in this organ, which is crucial for antigen presentation. We showed a significantly higher number of OVA-specific CD8+ T cells in the lung, which peaked 4 to 10 days after Galsome treatment (Figure. S5A). iNKT cells were peaking at an earlier timepoint, more specifically 4 days after vaccination with a high αGC-dose Galsomes (Figure S5B). In liver, similar kinetics of OVA-specific CD8+ T cells and iNKT cells were observed upon vaccination, albeit less pronounced (Figure S5C and D). As we observed a discrepancy between cellular responses and PD-L1 expression, these data suggest that PD-L1 expression and effector cell proliferation were not correlated.
Administration of Galsomes with a high dose of αGC coincides with a modest and transiently elevated expression of PD-L1 in tumors
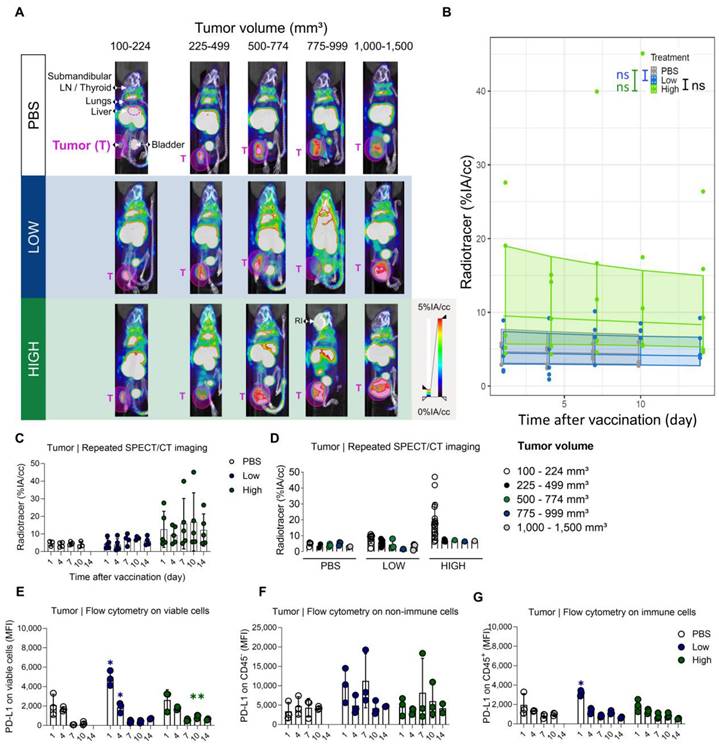
Evidently, we were also interested in the time-dependent PD-L1 expression in the tumor after vaccination. Therefore, SPECT/microCT images obtained on days 1, 4, 7, 10, and 14 after Galsomes vaccination were used to quantify the upregulation of PD-L1 in tumors using ROIs positioned over the entire tumor and compared to control mice. Tumor uptake was analysed over time and in accordance with tumor size as this can also influence PD-L1 expression and as such represent a confounding factor. We observed that as tumors grew, the accumulation of the PD-L1 radiotracer was visibly increased upon vaccination yet displayed a heterogenous distribution in tumor tissue on the SPECT/microCT images (Figure 7A-C). However, when we corrected for tumor volume by quantifying the accumulation of the PD-L1 radiotracer per calipered tumor volume (cc), we observed that small tumors in mice treated with Galsomes containing a high αGC-dose showed the highest levels of PD-L1 tracer uptake (Figure 7D). The regression model did not detect any change in PD-L1 radiotracer uptake upon vaccination, despite the p-value approximating 0.05 and curves showing an elevated PD-L1 radiotracer uptake for mice treated with Galsomes containing a high αGC-dose (Figure 7B, Tables S5 and S6). In addition, a moderate time-dependency of PD-L1 expression was observed for mice treated with Galsomes containing a high dose αGC, but not for mice treated with a low dose and PBS (Table S6). This is in stark contrast with flow cytometry data, displaying a significantly increased expression of PD-L1 in the tumor of mice injected with Galsomes with a low αGC-dose on day 1 after vaccination Figure 7E-G).
An elevated PD-L1 expression in tumors of mice upon vaccination with Galsomes. (A) Representative 3D MIP SPECT/microCT images (coronal view) showing the whole-body accumulation of anti-PD-L1 99mTc-nanobodies. Images were stratified in function of tumor volume. B16-OVA bearing mice were treated 1, 4, 7, 10 or 14 days prior with PBS or Galsomes containing a low or a high αGC-dose (n=1, mpc=4-5). (B) Regression model with confidence intervals and raw data points. The curve and the intervals are obtained by inverse transformation of the proposed model (see statistical analysis and Tables S5 and S6). (C,D) Radiotracer accumulation in tumor tissue, as quantified by imaging. Data are shown as mean ± SD and displayed in function of (C) time and (D) tumor size. Symbols represent individual data points. This confidence intervals are indicative. Flow cytometry results represented as MFI of the viable (E), non-immune (CD45-) (F) and immune (CD45+) (G) cell population in tumor tissue (n=1, mpc=3). Data are shown as mean ± SD. Statistical analysis was performed by unpaired multiple t-test. T = Tumor, LN = Lymph node, RI = Retro-orbital injection of 99mTc-anti-PD-L1 nanobodies (upon incomplete tail vein injection).
The tumor microenvironment shows high baseline PD-L1 expression which is shifted in various immune cell populations in response to vaccination
Analogous to lung and liver, we analysed the cellular composition of the tumor and evaluated PD-L1 expression of the individual cell types with flow cytometry 1 and 7 days after vaccination with PBS or Galsomes.
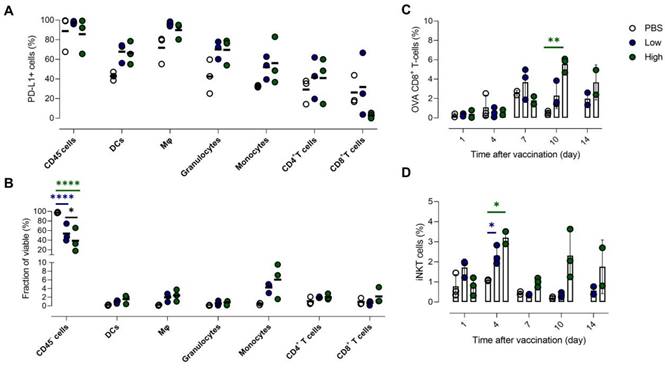
One day after vaccination, we could only detect a significantly higher PD-L1 expression in granulocytes (Figure S6A). However, in the remaining immune cell types (myeloid cells and CD4+ T cells) we also noticed a trend of elevated PD-L1 expression. In addition, we observed a slight reduction of the myeloid cell fraction in the TME 1 day after vaccination (Figure S6B) and a seemingly increased number of non-immune cells, which is a consequence of a shift in the balance of both cell types. Interestingly, we observed a dose-dependent influx of monocytes 7 days after vaccination (Figure 8B). All myeloid cell types that were analysed showed an increasing trend of PD-L1 expression (Figure 8A). We also addressed whether PD-L1 expression in tumors coincided with infiltration of iNKT cells and OVA-specific CD8+ T cells. We showed that mice treated with Galsomes had a higher percentage of OVA-specific CD8+ T cells 10 days after vaccination (Figure 8C). In contrast to peripheral organs, only a high αGC-dose was sufficient to recruit a significantly increased amount of OVA-specific CD8+ T cells to the tumor. We also showed that the percentage of iNKT cells in mice treated with Galsomes containing a high αGC-dose increased by day 4 yet failed to further increase over time (Figure 8D). As also seen in liver and lung, we did not observe a correlation between the number of OVA-specific CD8+ T cells or iNKT cells in the tumor and the image-based PD-L1 expression in tumors.
High baseline expression of PD-L1 in tumor is slightly increased in various immune cell populations upon Galsome vaccination. (A) Fraction of PD-L1+ non-immune (CD45-) cells, DCs, macrophages (Mφ), granulocytes, monocytes, CD4+ and CD8+ T cells 7 days after vaccination with Galsomes containing a low (blue) or high (green) αGC-dose or PBS (white) in tumor. (B) Fraction of non-immune cells and different immune cell types within viable cells 7 days after vaccination. (C, D) Percentage of OVA-specific CD8+ T cells (C) and iNKT cells (D) within the CD45+ population in the tumor detected on days 1, 4, 7, 10 and 14 after vaccination. Symbols represent individual data points and mean is indicated by a line. Statistical analysis was performed by two-way ANOVA followed by Tukey's post hoc test. (n=1, mpc=3).
Discussion
Designing vaccines that allow in situ activation of the immune system has been a major focus in cancer immunotherapy. We previously developed mRNA Galsomes, an mRNA cancer vaccine consisting of a lipid carrier incorporating nucleoside-modified tumor antigen encoding mRNA and the glycolipid antigen αGC. Vaccination with Galsomes activates two types of effector cells: CD8+ cytotoxic T lymphocytes (CTLs) and iNKT cells. To fully capitalize on these cells' ability to eradicate cancer cells, it is critical to understand which barriers within the tumor-bearing host might impede their activity. PD-L1 is such a barrier that can act on CTLs and iNKT cells both at the time of activation and at the time of their effector function. Here, we investigated the therapeutic effect of Galsomes as well as the dynamics of PD-L1 upon vaccination using SPECT/microCT imaging of a 99mTc-radiolabeled anti-murine PD-L1 nanobody. Furthermore, two doses of the iNKT cell stimulating compound, αGC, were included in the study to assess its contribution to anti-tumoral responses as well as to PD-L1 expression.
In accordance with a previous study, we observed an anti-tumor immune response upon mRNA Galsome vaccination, as evidenced by an increase in iNKT cells and tumor-specific CD8+ T cells in systemic organs and tumor [11]. The increase in iNKT cells correlated with the dose, which was expected as the presentation of αGC results in the activation and proliferation of iNKT cells, as previously shown ex vivo in peripheral blood cells [34]. Although activation of iNKT cells results in a burst release of immune-stimulating cytokines and CD40/CD40L cross-talk with DCs, we did not detect elevated numbers of OVA-specific CD8+ T cells in the spleen using increasing αGC-doses [35]. Fujii et al. previously evaluated the upregulation of maturation markers on DCs upon administration of increasing αGC-doses and observed that a strong shift in expression occurred at the lowest dose whereas higher doses only marginally increased the expression of maturation markers [36]. Besides immune activation, we also evaluated the therapeutic potential of mRNA Galsomes containing increasing αGC-doses. We demonstrated that mRNA Galsomes attenuated tumor development and significantly increased the time to reach a humane endpoint in an αGC-dose-dependent manner. It should be noted that B16-OVA is a CD1d-negative tumor model, hence the malignant cells could not directly have been killed by iNKT cells [36]. Although we did not observe a dose-dependent increase of OVA-specific CD8+ T cells in the spleen, lung and liver, analysis of tumor tissue revealed a dose-dependent increase of CTLs starting 10 days after vaccination, potentially explaining the therapeutic benefit of including higher αGC-doses.
A 99mTc-labeled anti-PD-L1 nanobody was employed for noninvasive and repeated visualization of PD-L1 expression in mice. SPECT/CT images showed a strong and systemic upregulation of PD-L1 as early as 1 day after vaccination. As ligation of PD-L1 to PD-1 interferes with TCR signaling and attenuates the effector function of anti-tumoral T cells [18,37], these results provide a rationale for early PD-L1 blockade in combination with cancer vaccination. PD-L1 imaging also revealed that mice treated with a higher αGC-dose did not show higher expression of PD-L1 compared to mice treated with a lower dose. We hypothesize that, despite the higher cytokine secretion associated with higher doses of αGC, a threshold in PD-L1 expression was reached using the low αGC-dose. Furthermore, aGC resulted in iNKT activation in places where Galsomes accumulated as opposed to low fLuc mRNA expression outside of the lungs. Hence we compared PD-L1 upregulation and DiR based distribution of Galsomes. Interestingly, PD-L1 expression did not correlate to the prevalence of cytokine-secreting effector cells (iNKT and OVA-specific CD8+ T cells) as we observed that these cell types were only peaking later in the experiment. Although this finding suggests that PD-L1 expression is not correlated to the activity of these cells, it should be noted that iNKT cells secrete cytokines (e.g., IFN-γ) as early as a few h after stimulation, long before their proliferation is detectable [38]. Consequently, the rapid upregulation of PD-L1 could be attributed to cytokine release by iNKT cells. Additionally, even though nucleoside-modified mRNA was used, immunogenic effects of mRNA and/or the lipid carrier could also have induced cytokine release by cells that phagocytosed the mRNA lipoplexes. Indeed, it was shown that vaccination with lipid nanoparticles (LNPs) containing N1 methyl pseudo-uridine-modified mRNA results in a rapid secretion of cytokines (e.g., IFN-γ, IFN-α and IL-6) [39]. It has not been elucidated how mRNA vaccines trigger the innate immune system, both mRNA and the lipid carrier could possibly be involved [40]. In this context, it is important to consider that here, mRNA was modified with m1Ѱ but not purified and consequently could have contained components (e.g., dsRNA) that trigger certain pattern recognition receptors. To add on this, also the DOTAP-based cationic lipid nanocarrier that was used has the potential to stimulate innate immune sensors [41].
We observed that both lungs and liver, organs where uptake of Galsomes was shown, displayed a significantly higher uptake of 99mTc-labeled anti-PD-L1 nanobodies, in comparison with untreated mice. Unfortunately, due to overlapping signals from liver and kidney, we were not able to visualize PD-L1 expression in the spleen, although this organ was also targeted by Galsomes. Interestingly, the data indicated that PD-L1 in the lungs is mainly elevated in non-immune cells upon vaccination. Cheng et al. reported that positively charged LNPs are targeted to the lungs and are massively taken up by non-immune cells (endothelial (66%) and epithelial (39%) cells), which possibly correlates with our observations that mainly non-immune cells contribute to PD-L1 expression in the lungs [31]. However, it should be noted that PD-L1 expression is typically induced by secreted cytokines which could also act on more distant cells as well. In liver, vaccination-induced PD-L1 expression was short-lived, whereas in lungs the signal persisted and only gradually receded over time. Possibly, as we observed a higher prevalence of OVA-specific CD8+ T cells in the lungs compared to the liver, the prolonged signal observed in the lungs could be the result of the activation of T cells and thus prolonged secretion of cytokines. In addition, we showed that liver CD8+ and CD4+ T cells also upregulated PD-L1 expression only one day after vaccination. As PD-L1 is upregulated in stimulated T cells, we hypothesize that activation of T cells proceeded differently in both organs, possibly as a consequence of the variation in the cell types that internalize Galsomes in both organs [42] Furthermore, we observed that there was a pronounced infiltration of myeloid cells in the liver after vaccination. As we also observed systemic upregulation of PD-L1 shortly after vaccination, it is possible that PD-L1 expression observed in the liver could partially be attributed to infiltrating PD-L1-expressing cells. Indeed, Loacker et al. recently reported elevated PD-L1 expression in blood granulocytes and monocytes after COVID mRNA vaccination [43]. In this light, it should also be noted that organs were not perfused before flow cytometry analysis, which could also influence the results as no discernment can be made between the activity in circulating blood and/or tissue upon imaging.
The tumor PD-L1-signal was particularly obvious in tumors that are 'small', i.e., which are kept in control by the immune system [44]. In tumors, radiotracer uptake is related to the vaccination showing some level of upregulation in mice treated with a high dose of αGC. Yet, there is no marked increase or decrease in time and appears to remain stable within the observation span of this experiment. This study shows that nanobody-mediated imaging of PD-L1 is beneficial and realistic for providing a rationale to not only act on PD-1/PD-L1 interactions during the effector phase but also during the priming phase. These results demonstrate the importance of the spatiotemporal evaluation of PD-L1 expression upon immune intervention (e.g., vaccination) but could also be relevant for other treatment approaches. This study however argues to be cautious when interpreting images. Results obtained in lung and liver were confirmed by ex vivo analysis. Yet, this is not the case for tumor. Initial high PD-L1 expression in the periphery might act as a sink, capturing the nanobody radiotracer before it can penetrate the tumor. This argument is strengthened by the tracer activity found in bladder, which acts as a reservoir of radiolabeled nanobodies upon clearance via the urinary tract. In general, the amount of activity is much lower in the bladder of vaccinated mice compared to untreated mice at early timepoints, suggesting more tracer remains in either the blood circulation or peripheral tissue. Nonetheless, high resolution signals obtained with the nanobody-based PD-L1 radiotracer could allow a trained physician to correctly interpret the images, thereby opening perspectives to evaluate response to therapy based on high peripheral and tumor PD-L1 signals early after vaccination, and to propose an optimal combination regimen. To facilitate clinical translation, development of a PET anti-PD-L1 radiotracer would be warranted due to higher clinical value than SPECT tracers as this allows easier quantification of signals and comes with a higher spatial resolution and higher sensitivity.
In conclusion, we present a method to visualize PD-L1 expression upon mRNA vaccination in melanoma-tumor bearing mice via SPECT/CT imaging using a 99mTc-labeled anti-PD-L1 nanobody. We showed that PD-L1 is rapidly and systemically upregulated upon vaccination with mRNA Galsomes and that mainly lung and liver were showing strong expression of this immune checkpoint. In these organs, both myeloid and non-immune cells showed higher expression of PD-L1 after vaccination. We also showed increased PD-L1 expression in tumor tissue which was mostly higher in mice with small tumors. To our knowledge, this is the first study that visualizes PD-L1 expression after mRNA vaccination and as such provides a rationale for combination therapy.
Supplementary Material
Supplementary figures and tables.
Acknowledgements
We thank Petra Roman and Elsy Vaeremans for the production and QC of mRNA. We would also like to thank Cindy Peleman and Kevin De Jonghe for their expertise involving animal handling, 99mTc-radiolabeling of sdAbs and SPECT/CT. Next, we extend our gratitude towards Ann Demarre, Emmy De Blay and Gunter Leuckx for their technical assistance.
Furthermore, we would also like to show our appreciation towards the numerous funding agencies listed hereinafter. Marleen Keyaerts and Willem Staels are senior clinical investigators of the Research Foundation-Flanders (FWO-V, grant no. 1801619N and 1806421N, respectively). Sofie Meulewaeter, Stephanie Bourgeois and Thomas Ertveldt are doctoral fellows from the FWO-V with grant numbers 1S73120N, 1S89823N and 1S06622N (FWO-SB), respectively. Rein is a postdoctoral fellow from the Research Foundation-Flanders (FWO-V) (grant number 1275023N). This research was performed with the financial support of the Research Foundation-Flanders (grant no. I001618N), the strategic research program 48 of the Research Council of VUB and the Scientific Fund Willy Gepts. Yannick De Vlaeminck was supported as a doctoral fellow by FWO-V during the execution of this work (grant no. 1S24817N). Katrijn Broos was supported as a doctoral fellow by Agency of Innovation by Science and Technology (IWT) during the execution of this work (grant no. IWT711). Ine Lentacker, Karine Breckpot, Rein Verbeke and Stefaan De Smedt acknowledge support from Ghent University Concerted Research Action grant BOF21/GOA/033 and from European Union's Horizon Europe research and innovation program under grant agreement No 101080544 (Baxerna2.0). Ine Lentacker, Rein Verbeke and Stefaan De Smedt would equally like to acknowledge the Research Foundation “Kom op Tegen Kanker” (grant No. FAF-C/2018/1213), Ghent University Concerted Research Action (grant No. BOF21/GOA/033).
Competing Interests
Nick Devoogdt and Marleen Keyaerts are founders and shareholders in Abscint. Nick Devoogdt is a consultant for Precirix and reports grants, personal fees, and non-financial support from Precirix, and non-financial support from Abscint. Marleen Keyaerts and Karine Breckpot have ongoing collaborations with Precerix for which they receive non-financial support. Karine Breckpot, Katrijn Broos, Nick Devoogdt and Marleen Keyaerts hold a patent on 'Human pd-l1-binding immunoglobulins' (WO2019166622A1). Ine Lentacker, Stefaan De Smedt, Rein Verbeke and Heleen Dewitte have a patent application on 'Therapeutic nanoparticles and methods of use thereof”. (WO2020/058239).
References
1. Placke J-M, Soun C, Bottek J. et al. Digital Quantification of Tumor PD-L1 Predicts Outcome of PD-1-Based Immune Checkpoint Therapy in Metastatic Melanoma. Front Oncol. 2021;11:741993
2. Larkin J, Chiarion-Sileni V, Gonzalez R. et al. Five-Year Survival with Combined Nivolumab and Ipilimumab in Advanced Melanoma. N Engl J Med. 2019;381:1535-46
3. Ascierto PA, Blank C, Dummer R. et al. Perspectives in Melanoma: meeting report from the Melanoma Bridge (December 3rd-5th, 2020, Italy). J Transl Med. 2021;19:278
4. Dillman RO, Nistor GI, Cornforth AN. Dendritic cell vaccines for melanoma: past, present and future. Melanoma Manag. 2016;3:273-89
5. Garris CS, Arlauckas SP, Kohler RH. et al. Successful Anti-PD-1 Cancer Immunotherapy Requires T Cell-Dendritic Cell Crosstalk Involving the Cytokines IFN-γ and IL-12. Immunity. 2018;49:1148-1161.e7
6. Anguille S, Smits EL, Lion E, van Tendeloo VF, Berneman ZN. Clinical use of dendritic cells for cancer therapy. Lancet Oncol. 2014;15:e257-67
7. Wilgenhof S, Van Nuffel AMT, Corthals J. et al. Therapeutic Vaccination With an Autologous mRNA Electroporated Dendritic Cell Vaccine in Patients With Advanced Melanoma. J Immunother. 2011;34:448-56
8. Goyvaerts C, Breckpot K. The Journey of in vivo Virus Engineered Dendritic Cells From Bench to Bedside: A Bumpy Road. Front Immunol. 2018;9:2052
9. Van Lint S, Renmans D, Broos K. et al. The ReNAissanCe of mRNA-based cancer therapy. Expert Rev Vaccines. 2015;14:235-51
10. Verbeke R, Lentacker I, De Smedt SC, Dewitte H. The dawn of mRNA vaccines: The COVID-19 case. J Control Release. 2021;333:511-20
11. Verbeke R, Lentacker I, Breckpot K. et al. Broadening the Message: A Nanovaccine Co-loaded with Messenger RNA and α-GalCer Induces Antitumor Immunity through Conventional and Natural Killer T Cells. ACS Nano. 2019;13:1655-69
12. Li Y-R, Wilson M, Yang L. Target tumor microenvironment by innate T cells. Front Immunol. 2022;13:999549
13. Díaz-Basabe A, Strati F, Facciotti F. License to Kill: When iNKT Cells Are Granted the Use of Lethal Cytotoxicity. Int J Mol Sci. 2020;21:3909
14. Castro F, Cardoso AP, Gonçalves RM, Serre K, Oliveira MJ. Interferon-Gamma at the Crossroads of Tumor Immune Surveillance or Evasion. Front Immunol. 2018;9:847
15. Garcia-Diaz A, Shin DS, Moreno BH. et al. Interferon Receptor Signaling Pathways Regulating PD-L1 and PD-L2 Expression. Cell Rep. 2017;19:1189-201
16. Ju X, Zhang H, Zhou Z, Wang Q. Regulation of PD-L1 expression in cancer and clinical implications in immunotherapy. Am J Cancer Res. 2020;10:1-11
17. Qin W, Hu L, Zhang X. et al. The Diverse Function of PD-1/PD-L Pathway Beyond Cancer. Front Immunol. 2019;10:2298
18. Peng Q, Qiu X, Zhang Z. et al. PD-L1 on dendritic cells attenuates T cell activation and regulates response to immune checkpoint blockade. Nat Commun. 2020;11:4835
19. Liao J-Y, Zhang S. Safety and Efficacy of Personalized Cancer Vaccines in Combination With Immune Checkpoint Inhibitors in Cancer Treatment. Front Oncol. 2021;11:663264
20. Merck and co. Moderna and Merck Announce mRNA-4157/V940, an Investigational Personalized mRNA Cancer Vaccine, in Combination With KEYTRUDA® (pembrolizumab), Met Primary Efficacy Endpoint in Phase 2b KEYNOTE-942 Trial. News release on Merck homepage. 2022.
21. Broos Lecocq, Xavier et al. Evaluating a Single Domain Antibody Targeting Human PD-L1 as a Nuclear Imaging and Therapeutic Agent. Cancers (Basel). 2019;11:872
22. Bridoux J, Broos K, Lecocq Q. et al. Anti-Human PD-L1 Nanobody for Immuno-PET Imaging: Validation of a Conjugation Strategy for Clinical Translation. Biomolecules. 2020;10:1388
23. Broos K, Keyaerts M, Lecocq Q. et al. Non-invasive assessment of murine PD-L1 levels in syngeneic tumor models by nuclear imaging with nanobody tracers. Oncotarget. 2017;8:41932-46
24. Goyvaerts C, De Groeve K, Dingemans J. et al. Development of the Nanobody display technology to target lentiviral vectors to antigen-presenting cells. Gene Ther. 2012;19:1133-40
25. Van Meirvenne S, Straetman L, Heirman C. et al. Efficient genetic modification of murine dendritic cells by electroporation with mRNA. Cancer Gene Ther. 2002;9:787-97
26. Van Lint S, Goyvaerts C, Maenhout S. et al. Preclinical Evaluation of TriMix and Antigen mRNA-Based Antitumor Therapy. Cancer Res. 2012;72:1661-71
27. Pinheiro J, Bates D, R Core Team. nlme: Linear and Nonlinear Mixed Effects Models. 2022.
28. Wickham H. Package `ggplot2`: Elegant Graphics for Data Analysis. Springer-Verlag New York. 2016.
29. Gato-Cañas M, Zuazo M, Arasanz H. et al. PDL1 Signals through Conserved Sequence Motifs to Overcome Interferon-Mediated Cytotoxicity. Cell Rep. 2017;20:1818-29
30. Yamazaki T, Akiba H, Iwai H. et al. Expression of Programmed Death 1 Ligands by Murine T Cells and APC. J Immunol. 2002;169:5538-45
31. Cheng Q, Wei T, Farbiak L, Johnson LT, Dilliard SA, Siegwart DJ. Selective organ targeting (SORT) nanoparticles for tissue-specific mRNA delivery and CRISPR-Cas gene editing. Nat Nanotechnol. 2020;15:313-20
32. Dilliard SA, Cheng Q, Siegwart DJ. On the mechanism of tissue-specific mRNA delivery by selective organ targeting nanoparticles. Proc Natl Acad Sci U S A. 2021 118
33. Deprez M, Zaragosi L-E, Truchi M. et al. A Single-Cell Atlas of the Human Healthy Airways. Am J Respir Crit Care Med. 2020;202:1636-45
34. Fernandez CS, Cameron G, Godfrey DI, Kent SJ. Ex-vivo α-Galactosylceramide activation of NKT cells in humans and macaques. J Immunol Methods. 2012;382:150-9
35. Nishimura T, Kitamura H, Iwakabe K. et al. The interface between innate and acquired immunity: glycolipid antigen presentation by CD1d-expressing dendritic cells to NKT cells induces the differentiation of antigen-specific cytotoxic T lymphocytes. Int Immunol. 2000;12:987-94
36. Shimizu K, Goto A, Fukui M, Taniguchi M, Fujii S. Tumor Cells Loaded with α-Galactosylceramide Induce Innate NKT and NK Cell-Dependent Resistance to Tumor Implantation in Mice. J Immunol. 2007;178:2853-61
37. Karwacz K, Arce F, Bricogne C, Kochan G, Escors D. PD-L1 co-stimulation, ligand-induced TCR down-modulation and anti-tumor immunotherapy. Oncoimmunology. 2012;1:86-8
38. Oki S, Chiba A, Yamamura T, Miyake S. The clinical implication and molecular mechanism of preferential IL-4 production by modified glycolipid-stimulated NKT cells. J Clin Invest. 2004;113:1631-40
39. Li C, Lee A, Grigoryan L. et al. Mechanisms of innate and adaptive immunity to the Pfizer-BioNTech BNT162b2 vaccine. Nat Immunol. 2022;23:543-55
40. Verbeke R, Hogan MJ, Loré K, Pardi N. Innate immune mechanisms of mRNA vaccines. Immunity. 2022;55:1993-2005
41. Lonez C, Bessodes M, Scherman D, Vandenbranden M, Escriou V, Ruysschaert J-M. Cationic lipid nanocarriers activate Toll-like receptor 2 and NLRP3 inflammasome pathways. Nanomedicine. 2014;10:775-82
42. Fanelli G, Romano M, Nova-Lamperti E. et al. PD-L1 signaling on human memory CD4+ T cells induces a regulatory phenotype. Oliver PM, Ed. PLoS Biol. 2021;19:e3001199
43. Loacker L, Kimpel J, Bánki Z, Schmidt CQ, Griesmacher A, Anliker M. Increased PD-L1 surface expression on peripheral blood granulocytes and monocytes after vaccination with SARS-CoV2 mRNA or vector vaccine. Clin Chem Lab Med. 2022;61:e17-9
44. Pardoll DM. The blockade of immune checkpoints in cancer immunotherapy. Nat Rev Cancer. 2012;12:252-64
Author contact
![]() Corresponding authors: Karine.Breckpotbe; Ine.Lentackerbe.
Corresponding authors: Karine.Breckpotbe; Ine.Lentackerbe.