Impact Factor
- Issue 14; 2026
- Issue 13; 2026
- Issue 12; 2026
- Issue 11; 2026
- Issue 10; 2026
- Volume 16; 2026
- Advance Articles
- Past Issues
- Cover Images
- Cover Suggestion
- Index & Coverage
- Special Issues
Introduction
Materials and Methods
Results
Discussion
Supplementary Material
Abbreviations
Acknowledgements
References
International Journal of Biological Sciences
International Journal of Medical Sciences
 Global reach, higher impact

Theranostics 2014; 4(8):845-857. doi:10.7150/thno.8343 This issue Cite
Research Paper
MRI of Breast Tumor Initiating Cells Using the Extra Domain-B of Fibronectin Targeting Nanoparticles
Yujin Sun1, 2*, Hoe Suk Kim1*, Jinho Park3*, Mulan Li1, Lianji Tian1, YoonSeok Choi1, Byung Ihn Choi1, Sangyong Jon3 ![]() , Woo Kyung Moon1
, Woo Kyung Moon1 ![]()
1. Department of Radiology, Seoul National University Hospital, 101 Daehak-ro, Jongno-gu, Seoul 110-744, Korea
2. Department of Radiology, Yanbian University Hospital, 1327 JuZi Street, Yanji City, JiLin Province 133000, China
3. KAIST Institute for the BioCentury, Department of Biological Sciences, Korea Advanced Institute of Science and Technology, 291 Daehak-ro, Yuseong-gu, Daejeon 305-701, Korea
*These authors contributed equally to this work.
Received 2013-12-12; Accepted 2014-4-19; Published 2014-6-10
Abstract
The identification of breast tumor initiating cells (BTICs) is important for the diagnosis and therapy of breast cancers. This study was undertaken to evaluate whether the extra domain-B of fibronectin (EDB-FN) could be used as a new biomarker for BTICs and whether EDB-FN targeting superparamagnetic iron oxide nanoparticles (SPIONs) could be used as a magnetic resonance imaging (MRI) contrast agent for BTIC imaging in vitro and in vivo. BTICs (NDY-1) exhibited high EDB-FN expression, whereas non-BTICs (MCF-7, BT-474, SUM-225, MDA-MB-231) did not exhibit EDB-FN expression. Furthermore, Cy3.3-labeled EDB-FN specific peptides (APTEDB) showed preferential binding to the targeted NDY-1 cells. To construct an EDB-FN targeted imaging probe, APTEDB was covalently attached to a thermally cross-linked SPION (TCL-SPION) to yield APTEDB-TCL-SPION. In the in vitro MRI of cell phantoms, selective binding of APTEDB-TCL-SPION to NDY-1 cells was evident, but little binding was observed in MCF-7 cells. After the intravenous injection of APTEDB-TCL-SPION into the NDY-1 mouse tumor xenograft model, a significant decrease in the signal within the tumor was observed in the T2*-weighted images; however, there was only a marginal change in the signal of non-targeting SPIONs such as APTscramble-TCL-SPION or TCL-SPION. Taken together, we report for the first time that EDB-FN was abundantly expressed in BTICs and may therefore be useful as a new biomarker for identifying BTICs. Our study also suggests that APTEDB-TCL-SPION could be used as an MRI contrast agent for BTIC imaging.
Keywords: Breast tumor initiating cells, Extra domain-B of fibronectin, Aptides, Superparamagnetic iron oxide nanoparticles, Magnetic resonance imaging.
Introduction
Breast tumor initiating cells (BTICs) self-renew and asymmetrically divide into differentiated cancer cells; they are also believed to be responsible for breast cancer progression, recurrence, and therapeutic resistance [1-3]. BTICs that exhibit the CD44+/CD24- signature and high aldehyde dehydrogenase 1 (ALDH1) activity are linked to many signaling pathways that regulate in vivo tumorigenicity, including invasiveness and metastasis, and are considered a major obstacle for curative treatments [1, 4]. However, these biomarkers are insufficient for the identification of BTICs, and additional characteristic biomarkers are needed to develop new strategies for treating breast cancer and preventing recurrence.
Fibronectin (FN) is a ubiquitous component of the extracellular matrix that plays major roles in cell adhesion, migration, and proliferation; it also seems to play an important role in tumor progression [5]. Molecular variants of FN are generated by the alternative splicing of pre-messenger RNA at three distinct sites: extra domain-A (EDA), extra domain-B (EDB), and type III homology connecting segment (IIICS) [6]. EDB-FN is not found in normal adult tissues, but it is highly expressed in the blood vessels and extracellular matrices of aggressive solid tumors, which makes it a promising tumor-associated biomarker [7-10]. In human breast tissues, EDB-FN is only expressed in fetal breasts, during the wound healing process, and in carcinomas [11, 12]. Based on these findings, we hypothesized that EDB-FN expression may also be associated with BTICs.
Superparamagnetic iron oxide nanoparticles (SPIONs) have been extensively used as magnetic resonance imaging (MRI) contrast agents for cancer imaging [13]. Furthermore, SPIONs can be used to detect the expression levels of specific biomarkers in tumors or on cancer cells with the aid of specific ligands located on the SPION surface [14]. We have previously reported that thermally cross-linked SPIONs (TCL-SPIONs) are suitable MRI contrast agents for cancer imaging because they have a higher transverse relaxivity and better biocompatibility compared with the commercially available SPION MION-47 [15, 16]. We have also demonstrated that TCL-SPIONs could be used as multifunctional nanoparticles, thus enabling simultaneous cancer imaging and therapy by loading therapeutic drugs and conjugating specific targeting moieties such as peptides and aptamers to these nanoparticles [17-19]. We have further reported a technology that enables us to screen and identify a novel class of high-affinity peptides ('aptides') for various biological targets [20]. Using this platform technology, we have identified a high-affinity high-specificity peptide ligand for EDB-FN, which we designated APTEDB, that is 26 amino acids long and has several tens of nM affinity for the EDB-FN protein [21, 22].
In this study, we evaluated whether EDB-FN could be used as a new biomarker for BTICs and whether an EDB-FN targeting SPION could be used as an MRI contrast agent for BTIC imaging in vitro and in vivo. To this end, a TCL-SPION conjugated to an EDB-FN specific peptide ligand (APTEDB-TCL-SPION) was constructed. We investigated whether APTEDB-TCL-SPIONs could detect EDB-FN overexpressing BTICs (NDY-1) in vitro and in vivo using a 3 Tesla (3T) clinical MRI scanner.
Materials and Methods
Cell culture and reagents
SUM-225 cells were purchased from Asterand, Inc. (Detroit, MI, USA), and MCF-7, BT-474, and MDA-MB-231 cells were obtained from the Korean Cell Line Bank (Seoul, Korea). SUM-225 is a luminal subtype non-invasive cancer cell line, MCF-7 is a luminal subtype estrogen-dependent invasive cancer cell line, BT-474 is a luminal subtype invasive cancer cell line with ERBB amplification and MDA-MB-231 is a basal subtype invasive cancer cell line with metastatic potential [23]. These breast cancer cell lines were cultured in Dulbecco's modified Eagle medium (WelGENE, Daegu, Korea) supplemented with 10% fetal bovine serum (WelGENE) and a 1% antibiotic solution containing penicillin and streptomycin. NDY-1 cells display tumor-initiating abilities and drug resistance and were isolated from the cancerous tissue of a breast cancer patient; these cells were kindly supplied by Dr. Noh of Seoul National University [24, 25] and were grown under non-adherent mammosphere culture conditions in serum-free Dulbecco's modified Eagle's medium (DMEM): F12 = 3:1 medium supplemented with B27 (Invitrogen, Carlsbad, CA, USA), antibiotic-antimycotic solution (Invitrogen), 20 ng/ml epidermal growth factor (EGF; Invitrogen), 10 ng/ml leukemia inhibitory factor (LIF, Millipore, Temecula, CA, USA), and 20 ng/ml basic fibroblast growth factor (bFGF; Millipore). The medium was replenished every 3-4 days. All cells were passaged weekly and cultured in a 5% CO2 incubator at 37°C.
RT-PCR analysis
Total RNA was isolated from cells using the RNeasy Mini Kit (QIAGEN, Valencia, CA, USA). cDNA was synthesized using M-MLV reverse transcriptase (New England Biolabs, Ipswich, MA, USA) and random primers. The EDB-FN mRNA levels in breast cancer cell lines (SUM-225, MCF-7, BT-474, MDA-MB-231, and NDY-1) were evaluated using conventional RT-PCR. The specific primers used to amplify CD44, CD24, ALDH1A1, ALDH1A2, ALDH1A3, Nanog, Oct4, KLF4, EDB-FN, and β-actin are shown in Table 1. Each target gene was amplified using a thermocycler (BioRad, Hercules, CA, USA). PCR products were analyzed using electrophoresis on 2% ethidium bromide-stained agarose gels, and the gene levels were normalized to that of β-actin.
Specific primer sequences used in RT-PCR experiments to detect the self-renewal genes and marker gene expression in breast tumor initiating cells.
| Primer | Sequence | Size (bp) |
|---|---|---|
| CD44 | (forward)5'-TCCAACACCTCCCAGTATGACA-3' (reverse)5'-GGCAGGTCTGTGACTGATGTACA-3' | 60 |
| CD24 | (forward)5'- TATTTGGGAAGTGAAGACTGGAA-3' (reverse)5'- TCTAAATGTGGCTATTCTGATCCA-3' | 96 |
| ALDH1A1 | (forward)5'-TGTTAGCTGATGCCGACTTG-3' (reverse)5'-TTCTTAGCCCGCTCAACACT-3' | 135 |
| ALDH1A2 | (forward)5'-CTGGCAATAGTTCGGCTCTC-3' (reverse)5'-TGATCCTGCAAACACTGCTC-3' | 130 |
| ALDH1A3 | (forward)5'-TCTCGACAAAGCCCTGAAGT-3' (reverse)5'-TATTCGGCCAAAGCGTATTC-3' | 130 |
| Nanog | (forward)5'-CCTGTGATTTGTGGGCCTG-3' (reverse)5'-GACAGTCTCCGTGTGAGGCAT-3' | 200 |
| Oct4 | (forward)5'-ACCGAGTGAGAGGCAACC-3' (reverse)5'-TGAGAAAGGAGACCCAGCAG-3' | 183 |
| KLF4 | (forward)5'-TATGACCCACACTGCCAGAA-3' (reverse)5'-TGGGAACTTGACCATGATTG-3' | 90 |
| EDB-FN | (forward)5'-CCAGGTACAGGGTGACCTAC-3' (reverse)5'-CTCTCCATATCATCGTGCAA-3' | 154 |
| β-actin | (forward)5'-ATCATGTTTGAGACCTTCAA-3' (reverse)5'-CATCTCTTGCTCGAAGTCCA-3' | 208 |
ALDEFLUOR assay to measure ALDH1 activity
The ALDEFLUOR reagent system (Stem Cell Technologies, Vancouver, Canada) was used in all experiments and served as an immunofluorescence method to detect the intracellular enzymatic activity of ALDH1. BODIPY-aminoacetaldehyde diethyl acetal (BAAA-DA) is converted into BODIPY-aminoacetaldehyde (BAAA), which is a fluorescent substrate for ALDH1. In this study, we treated the cells as follows: 0.2-1.0 × 10⁶ cells were kept in 1 ml of ALDEFLUOR assay buffer with a BAAA concentration of 1.5 μM for 45 min at 37°C. For each experiment, a sample of cells was stained under identical conditions with 50 μmol/l of the specific ALDH1 enzyme inhibitor diethylaminobenzaldehyde (DEAB; Sigma, St. Louis, MO, USA), which served as a negative control. Flow cytometry analysis was performed.
Flow cytometry analysis
Flow cytometry was performed using a FACScan instrument (BD Biosciences, San Jose, CA, USA). NDY-1 cells were dissociated and washed once in phosphate buffered saline (PBS) containing 1-2% bovine serum albumin and 5 mM EDTA; they were subsequently stained with anti-CD24-FITC (Invitrogen) and anti-CD44-PE (Invitrogen) at a concentration of 10 μl of antibody per 106 cells before being incubated at 4°C for 15-30 min. Cells were washed once with PBS buffer, and flow cytometry was performed to detect CD44+CD24- cells using each fluorescence channel. Gates were determined by analyzing the unstained cells and single stains. ALDEFLUOR fluorescence was detected using the green fluorescence channel (530 ± 15). Data for 10,000 cells were collected and analyzed using the Cell Quest software version 3.3 (BD Biosciences).
In vitro EDB-FN target imaging and immunocytochemistry
To test the EDB-FN targeting ability of the APTEDB (AnyGen, Gwangju, Korea), cells were grown on 8-well chamber slides and treated with Cy3.3-labeled APTEDB (6 μg/ml) in Opti-MEM (Invitrogen) for 6 h. After incubation, the cells were rinsed in PBS three times and fixed with 2% (w/v) paraformaldehyde. To detect EDB-FN protein, the fixed cells were incubated with primary antibodies directed towards EDB-FN and visualized with Alex 488-conjugated secondary antibodies (Invitrogen). 4'6-diamidino-2-phenylindole (DAPI, Invitrogen) was used to visualize the cell nuclei. The fluorescence images were scanned and analyzed using a confocal laser microscope (LSM 5 META, Carl Zeiss, Jena, Germany).
Synthesis and characterization of EDB-FN aptide-conjugated TCL-SPION
Carboxyl-TCL-SPION was synthesized as previously reported [15]. 1-ethyl-3-(3-dimethylaminopropyl) carbodiimide hydrochloride (15 mg) and sulfo-NHS (4 mg) were suspended in 200 μl of PBS and added to 1 ml of carboxyl-TCL-SPION in PBS (8 mg Fe/ml in PBS) and mixed by vigorously vortexing the sample. After 15 min, maleimide-PEG1000-amine (4 mg in 100 μl dimethylformamide) was added to the solution and stirred at ambient temperature for 4 h. After the reaction was complete, the Mal-PEG1000-TCL-SPION solution was passed through a 50 kDa centrifugal filter (Millipore) and dialyzed against distilled water (MW cut-off 100 kDa, Millipore) for 36 h to remove the unconjugated Mal-PEG1000-amine from the carboxyl-TCL-SPION. Then, cysteinylated APTEDB or APTscramble (0.1 mg) dissolved in dimethyl sulfoxide (100 μl) was added to Mal-PEG1000-TCL-SPION (20 mg Fe/ml) dispersed in distilled water (0.5 ml). The solution was stirred for 4 h under ambient conditions; the reaction mixture was subsequently concentrated by filtration using a centrifugal filter (MW cut-off 50 kDa, Millipore) and washed with distilled water to yield APTEDB or APTscramble-conjugated TCL-SPION (APTEDB-TCL-SPION or APTscramble-TCL-SPION). The iron concentrations of APTEDB-TCL-SPION or APTscramble-TCL-SPION were measured using inductively coupled plasma-atomic emission spectrometry (ICP-AES, Perkin-Elmer, Waltham, MA, USA). The hydrodynamic particle size and zeta potential of each SPION were measured using a Zetasizer ZS90 instrument (Malvern Instruments Ltd, Malvern, Worcestershire, UK). The magnetite core size and nanoparticle distribution were examined by transmission electron microscopy (TEM) using a Tecnai G2 F30 instrument operated at 300 kV (FEI company, Hillsboro, OR, USA).
Measurement of the amount of EDB-FN aptide (APTEDB) on TCL-SPION
To quantify the amount of aptide conjugated to the TCL-SPION, the amount of unreacted aptide remaining in the filtrate after the reaction between cysteinylated APTEDB and Mal-TCL-SPION was measured using a UV-Vis spectrometer (SCINCO, Seoul, Korea). In this way, the amount of conjugated aptide was indirectly calculated using the following equation: [APTEDB]conjugated = [APTEDB]initial - [APTEDB]remained. The same procedure was performed using a mixture of cysteinylated APTEDB and TCL-SPION lacking the maleimide functional group (no conjugation occurs). Then, the amount of APTEDB in the filtrate was measured to assess the level of nonspecific physical binding of the aptide to the TCL-SPIONs, which was approximately 20%. Finally, the actual amount of the conjugated aptide on TCL-SPION was revised by considering the extent of the nonspecific binding.
Animals and xenograft tumor model
All animal experiments were approved by the Seoul National University Hospital Biomedical Research Institute Animal Care and Use Committee (IACUC). A total of 27 female BALB/c nude mice (4-5 week old) were used for MRI and histological studies. Eighteen tumor-bearing-mice were randomly assigned to one of 3 experimental groups, with each group containing 6 mice: group 1, TCL-SPION; group 2, APTEDB-TCL-SPION; group 3, APTscramble-TCL-SPION. Non-tumor-bearing mice were also used to investigate the biodistribution of APTEDB-TCL-SPION and APTscramble-TCL-SPION in several tissues after intravenous injection. Nine non-tumor-bearing mice were randomly assigned to one of 3 experimental groups, with each group containing 3 mice: group 1, No injection; group 2, APTEDB-TCL-SPION; group 3, APTscramble-TCL-SPION.
To develop the tumor model, 2 x 10⁶ viable NDY-1 cells were suspended in 0.1 ml matrigel (BD Biosciences) and subcutaneously injected into the back right flank of BALB/c nude mice. Tumor formation was monitored for 4-5 weeks after implantation. To determine the volumes of the NDY-1 xenograft tumors, a modified ellipsoidal formula for volume (volume = 1/2[length × width2]) was used, in which the length was the measurement of the greatest longitudinal diameter of the tumor and the width was the greatest transverse diameter of the tumor.
In vitro MRI
The transverse relaxivities (r2) of TCL-SPION, APTEDB-TCL-SPION, and APTscramble-TCL-SPION were evaluated using a spin echo sequence on a 3T clinical MRI scanner (Magnetom Trio; Siemens Healthcare, Erlangen, Germany). SPIONs dispersed in water were prepared, and multiecho T2-weighted images were acquired using the following parameters: repetition time (TR) = 5000 msec; Flip angle = 90˚/180˚; echo times (TEs) = 16, 32, 48, 64 msec and, 20, 40, 60, 80 msec; bandwidth = 310 Hz/pixel; matrix size = 320 x 320; field of view (FOV) = 84 x 120 mm2; number of excitations (NEX) = 2; number of slices = 10; slice thickness = 2.0. The transverse relaxation rate (R2=1/T2) was calculated using a linear fit of the logarithmic signal amplitudes versus TE.
To measure the R2 values of the cell phantoms, MCF-7 and NDY-1 cells were seeded at a density of 2 × 10⁶ cells / well in 100 mm tissue culture plates and incubated for 2 days. Following incubation at 5% CO2 and 37°C, cells were treated with APTEDB-TCL-SPION or APTscramble-TCL-SPION (iron concentration, 11.2 μg Fe/ml) for 2 h, 4 h, and 12 h. To evaluate the selective binding of APTEDB-TCL-SPION with EDB-FN, cells were pretreated with free APTEDB (0.1 mg/ml) for 1 h and with APTEDB-TCL-SPIONs for 12 h. To evaluate the detection sensitivity for EDB-FN targeted BTIC imaging, cells consisting of 5 x 10², 5 x 10³, 5 x 10⁴, 5 x 10⁵, and 5 x 10⁶ BTICs were prepared and treated with APTEDB-TCL-SPION for 12 h. The collected cells were dispersed in 0.7% agarose, and cell phantoms were prepared. Multiecho T2-weighted images of the cell phantoms were acquired using the same imaging sequence and parameters used in the SPION solution phantoms, and the R2 values were measured as described above.
In vivo MRI
When the average tumor volume reached 200-300 mm3, coronal views of whole-body MRIs, including the head, thorax, abdomen, and hind legs, were obtained using a human wrist coil and a 3T clinical MRI scanner. Mice were anesthetized with isoflurane (1% in 100% oxygen). To stabilize the body temperature of the mice during MRI experiments, an animal warming system (Agilent, Santa Clara, CA, USA) containing a warm water (39°C) reservoir with a pump and hoses placed underneath the animal bed was used. T2*-weighted MRI images were obtained prior to injection and at 4 h and 24 h after the intravenous injection of 20 mg Fe/kg of SPIONs in a 5% glucose solution using a gradient echo sequence (TR/TE = 40/22 ms, FOV = 40 × 80 mm2, flip angle = 15°, matrix size = 256 × 128, NEX = 3, number of slices = 24, and section thickness = 0.8 mm).
To determine the signal intensity (SI) changes in the T2*-weighted images of the liver, spleen, kidney, and thigh muscles, regions of interest (ROI) were manually drawn to outline the outer boundaries of the organs. In addition, ROIs of the tumor were drawn just inside the outer margins of each tumor in the T2*-weighted images to avoid placing the ROIs over artifacts at the tissue-air interface. The SI changes were analyzed from all-slice images of each tumor and were subsequently defined as the tumor SI. For the quantitative analysis of the signal intensity changes induced by the accumulation of SPIONs in tumors, signal intensities from the muscle was used as a reference to calibrate the ROI signal in the tumors [26, 27]. The ratio of the SI changes for tumor versus muscle was calculated both prior to and after the injection of TCL-SPION, APTEDB-TCL-SPION or APTscramble-TCL-SPION according to the following formula: SI ratio = [SI tumor (post)) / SI muscle (post)] / [SI tumor (pre) / SI muscle (pre)]. The results of the in vivo MRI were analyzed by observing the differences between pre- and post-contrast SI.
Histological analysis
After MRI examination, histological analyses of several organs (brain, heart, liver, spleen, kidney, and thigh muscle) and tumors were performed. The tumors and organs were removed 24 h after the injection of APTEDB-TCL-SPION or APTscramble-TCL-SPION. The excised tissues were fixed with 10% buffered formalin and embedded in paraffin blocks. Tissues were sectioned into 4-µm-thick sections, and hematoxylin and eosin (H&E) staining was performed. The presence of APTEDB-TCL-SPION and APTscramble-TCL-SPION in each tissue section that was isolated from tumor-bearing and non-tumor-bearing mice was detected using Prussian blue staining to visualize ferric irons. Briefly, sectioned tissues were incubated for 60 min with 10% potassium ferrocyanide (Sigma) in 10% hydrochloric acid. Samples were then rewashed and counterstained with nuclear fast red (Sigma) for 7 min. EDB-FN protein expression and distribution of the vascular endothelium in tumors were investigated by immunostaining, using antibodies for BC-1 (Santa Cruz Biotechnology, Inc. Dallas, TX, USA) and CD31 (Abcam, Cambridge, MA, USA) and an appropriate secondary antibody. Tissue sections were subsequently stained with diaminobenzidine solution (Dako, Hamburg, Germany) for 2-5 min. Histological images of stained tissues were acquired using a microscope (Leica, Wetzlar, Germany) equipped with a CCD camera (Leica).
Statistical analysis
For both the in vitro and in vivo data, the means ± standard deviations were calculated from at least three independent experiments and statistically evaluated using a one-way ANOVA model followed by the Student-Newman-Keuls test. For all tests, p-values less than 0.05 were considered statistically significant.
Results
Assessment of EDB-FN expression in BTICs and differentiated breast cancer cells
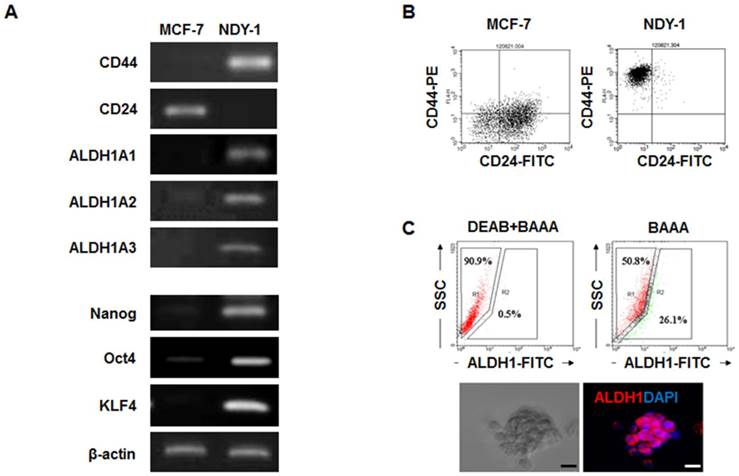
The expression levels of BTIC-characteristic genes related to self-renewal (Nanog, Oct4, and KLF4), surface marker genes (CD44 and CD24), and a putative gene (ALDH1) were analyzed in NDY-1 and MCF-7 cells (representing BTIC and differentiated breast cancer cells, respectively) using RT-PCR, flow cytometry and immunostaining. As expected, NDY-1 cells exhibited a phenotype associated with BTICs; they exhibited a high expression of CD44 and ALDH1A1-3 but low expression of CD24 (Figure 1A). Moreover, the expression of self-renewal genes that are characteristic markers of stem cells was also evident in NDY-1 cells. Flow cytometry analysis confirmed the expression of CD44+ and CD24- markers (Figure 1B). Approximately 26% of NDY-1 cells stained positive with the ALDEFLUOR reagent (Figure 1C upper); representative immunostaining of ALDH1 showed a high expression of ALDH1 proteins in the NDY-1 spheroids (Figure 1C lower).
Analysis of the genes expressed in breast tumor initiating cells (BTICs). (A) RT-PCR analysis of the self-renewal genes and surface marker genes in BTICs (NDY-1) and breast cancer cells (MCF-7). Specific markers of BTICs and self-renewal genes were highly expressed in NDY-1 cells but not in MCF-7 cells. (B) Flow cytometry analysis of the surface markers CD44 and CD24. NDY-1 exhibited a CD44+/CD24- BTIC phenotype. (C) ALDEFLUOR assay for ALDH1 activity and Immunostaining analysis for ALDH1 expression. Approximately 26% of the NDY-1 cells exhibited brightly fluorescent ALDH1 staining, indicating the presence of a putative BTIC marker. Immunostaining showed NDY-1 spheroids strongly expressed the ALDH1 protein. Scale bar: 20 μm
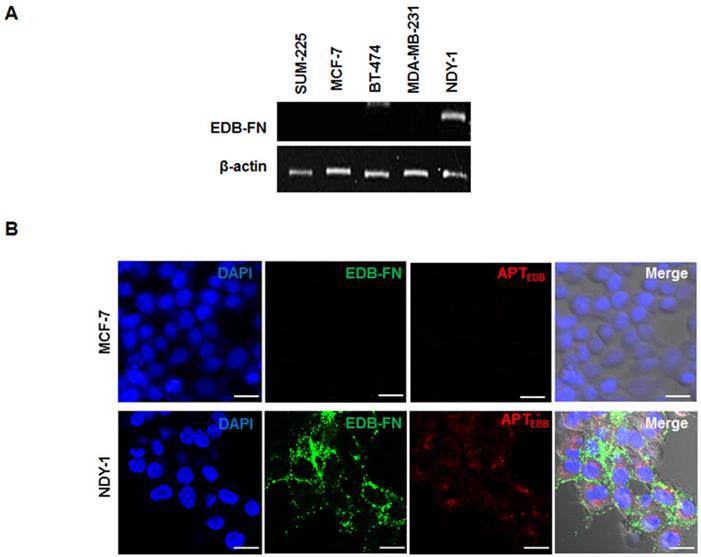
Once we confirmed the expression of BTIC-characteristic genes in NDY-1 cells, EDB-FN expression was examined using RT-PCR in diverse breast cancer cell lines, including SUM-225, MCF-7, BT-474, MDA-MB-231, and NDY-1. Interestingly, the abundant expression of EDB-FN mRNA was observed only in NDY-1 cells compared with all of the other breast cancer cells (Figure 2A). The expression of EDB-FN in NDY-1 cells was then examined using both an EDB-FN specific antibody (BC-1) and a dye-labeled EDB-FN specific aptide (Cy3.3-APTEDB). The aptide fluorescence signal was observed in NDY-1 cells but not in MCF-7 cells, the latter of which did not express EDB-FN (Figure 2B). The Cy3.3-APTEDB signal co-localized with the areas immunostained with the BC-1 antibody. NDY-1 cells expressed both BTIC-characteristic genes and high-levels of EDB-FN, which may serve as a new biomarker for the identification of BTICs.
Analysis of the expression of extra domain-B of fibronectin (EDB-FN) and its selective targeting with an EDB-FN aptide (APTEDB). (A) RT-PCR analysis of the EDB-FN mRNA in diverse breast cancer cell lines. EDB-FN was expressed in NDY-1 cells but not in SUM-225, MCF-7, BT-474 or MDA-MB-231 cells. (B) EDB-FN targeting images of the Cy3.3-labeled APTEDB (Cy3.3-APTEDB, red fluorescence) and immunostained EDB-FN (green fluorescence) images in breast cancer cells. Cy3.3-APTEDB specific signals were observed in EDB-FN overexpressing NDY-1 cells but not in MCF-7 cells. Scale bar: 20 μm
Preparation and characterization of EDB-FN targeting SPIONs
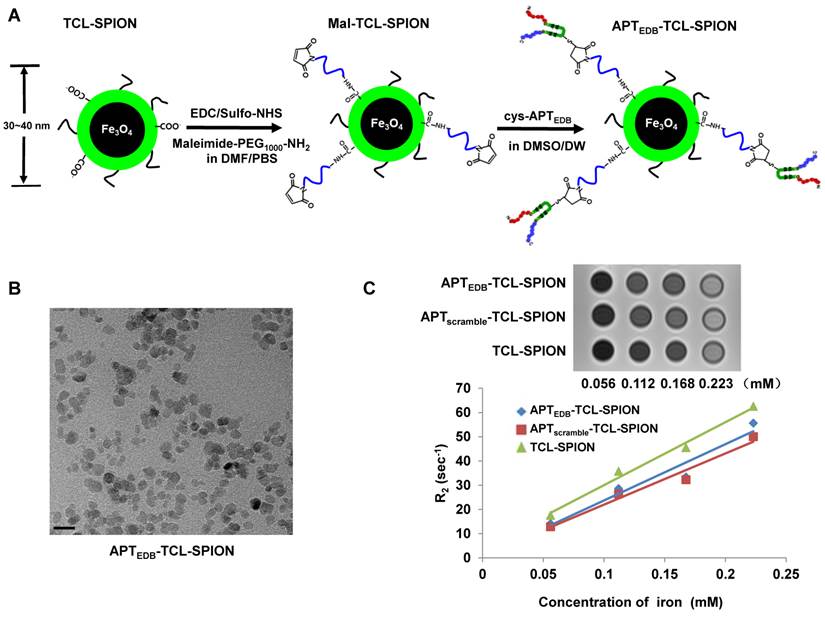
A schematic illustration for the preparation of APTEDB-TCL-SPIONs is shown in Figure 3A. As previously reported, aptides form unique pre-organized structures consisting of robust β-hairpin structures in the middle (shown in green) and variable amino acid chains at both the N- and C-termini (shown in red and blue, respectively), which are responsible for target binding [20]. To facilitate conjugation, we used a slightly modified APTEDB containing an additional cysteine residue at the lysine site of the hairpin scaffold region as indicated in Additional file 1: Supplementary Figure 1. The hydrodynamic size and zeta potential of TCL-SPIONs, Mal-TCL-SPIONs, and APTEDB-TCL-SPIONs were measured through dynamic light scattering (Table 2). As expected, the size of the TCL-SPIONs (34.7 ± 10.9 nm) increased with the attachment of Mal-PEG1000 (36.1 ± 10.8 nm) and further increased when the aptide was attached (38.1 ± 11.8 nm). Additionally, there was a distinct change in the zeta potential of each nanoparticle (-29.2 ± 0.4 mV for TCL-SPION versus -36.6 ± 0.7 mV for APTEDB-TCL-SPION). The size increase and change in zeta potential from the bare TCL-SPIONs suggest that the aptide was successfully conjugated. Furthermore, the amount of the aptide conjugated to the nanoparticle was calculated by indirectly measuring the amount of unreacted aptide remaining in the filtrate after centrifugal filtration using UV-Vis spectroscopy (Additional file 1: Supplementary Figure 2). In this way, the amount of APTEDB per mg Fe was calculated to be ~ 8 µg (2.2 nmol), which corresponded to ~0.8 wt%. The TEM image of the APTEDB-TCL-SPION indicates well-separated SPIONs with an average core size of ~10 nm (Figure 3B). We also monitored changes in the hydrodynamic size of APTEDB-TCL-SPIONs upon incubation in distilled water or cell culture medium containing 10% FBS to confirm colloidal stability. Only a slight change in the hydrodynamic size (< 10 nm) was observed in both solutions, even after incubating them for 6 days (Additional file 1: Supplementary Figure 3). The hypointense signals in the T2-weighted images of APTEDB-TCL-SPION, APTscramble-TCL-SPION, and TCL-SPION gradually increased in a dose-dependent manner (Figure 3C). The r2 values were derived at various iron concentrations. The three SPIONs showed r2 values of 232.1 ± 1.4 mM-1 sec-1 for APTEDB-TCL-SPION, 211.1 ± 2.1 mM-1 sec-1 for APTscramble-TCL-SPION, and 259.89 ± 3.2 mM-1 sec-1 for TCL-SPION.
Synthetic procedures and characterization of APTEDB-TCL-SPION. (A) Schematic illustration of the preparation of APTEDB-TCL-SPIONs. (B) A TEM image of APTEDB-TCL-SPION. Scale bar: 20 nm (C) T2-weighted images and plots of the relaxation rates (R2 =1/T2) of APTEDB-TCL-SPION, APTscramble-TCL-SPION, and TCL-SPION at various iron concentrations. The transverse relaxivities (r2) of APTEDB-TCL-SPION, APTscramble-TCL-SPION and TCL-SPION were 232.1 ± 1.4 mM-1 sec-1, 211.1± 2.1 mM-1 sec-1, and 259.9 ± 3.2 mM-1 sec-1, respectively.
Hydrodynamic size and zeta potential of each SPION.
| Hydrodynamic size (nm) | Zeta potential (mV) | |
|---|---|---|
| TCL-SPION | 34.7 ± 10.9 | - 29.2 ± 0.4 |
| Mal-TCL-SPION | 36.1 ± 10.8 | - 40.4 ± 2.1 |
| APTEDB-TCL-SPION | 38.1 ± 11.8 | - 36.6 ± 0.7 |
| APTscramble-TCL-SPION | 37.3 ± 9.6 | - 45.0 ± 0.8 |
Assessment of the cell binding specificity of APTEDB-TCL-SPION
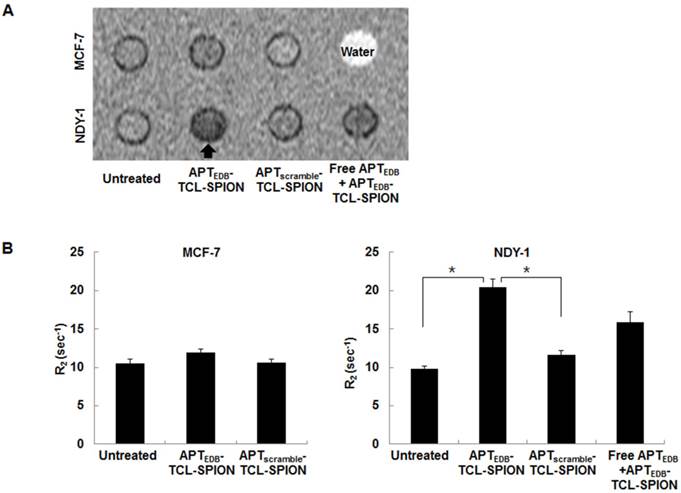
We next examined whether APTEDB-TCL-SPION could specifically bind to BTICs (NDY-1 cells) using in vitro MRI of cell phantoms. A hypointense signal was evident in the representative T2-weighted images of the cell phantoms for NDY-1 cells treated with APTEDB-TCL-SPION for 12 h (Figure 4A). The R2 values of untreated, APTscramble-TCL-SPION-, and APTEDB-TCL-SPION-treated NDY-1 cells were 9.84 ± 0.34 sec-1, 11.67 ± 0.54 sec-1, and 20.40 ± 1.07 sec-1, respectively. There was a significant increase in the R2 values of APTEDB-TCL-SPION-treated NDY-1 cells compared with those of untreated and APTscramble-TCL-SPION-treated NDY-1 cells (Figure 4B, p = 0.003 and p = 0.002). Furthermore, when NDY-1 cells were pretreated with free APTEDB (0.1 mg/ml) for 1 h prior to treatment with APTEDB-TCL-SPIONs, the R2 values of NDY-1 cells treated with APTEDB-TCL-SPION for 12 h were remarkably diminished (Figure 4B, free APTEDB + APTEDB-TCL-SPION; 15.95 ± 1.39 sec-1; p=0.08). However, the R2 values of untreated, APTscramble-TCL-SPION-, and APTEDB-TCL-SPION-treated MCF-7 cells were not significantly different (Figure 4B, 10.58 ± 0.55 sec-1, 10.65 ± 0.41 sec-1, and 11.96 ± 0.50 sec-1, respectively; p > 0.05). These results suggest that the binding of APTEDB-TCL-SPION to NDY-1 cells is mediated by specific interactions between the APTEDB portion of the SPION and EDB-FN expression in the cells.
In vitro MRI analysis of cell phantoms. (A) Representative T2-weighted images of cell phantoms. Cells were treated with APTEDB-TCL-SPION and APTscramble-TCL-SPION (11.2 µg Fe/ml) for 12 h at 37°C. Blocking of specific binding of APTEDB-TCL-SPION was achieved by pretreatment with EDB-FN aptides (APTEDB, 0.1 mg/ml) for 1 h. Hypointense signals (arrow) were clearly detected in NDY-1 cells treated with APTEDB-TCL-SPIONs. (B) R2 values measured from the T2-weighted images obtained from cell phantoms. The R2 values significantly increased in the APTEDB-TCL-SPION-treated NDY-1 cells compared with the APTscramble-TCL-SPION-treated or untreated NDY-1 cells. Significantly different R2 values were not observed in APTEDB-TCL-SPION- and APTscramble-TCL-SPION- treated and untreated MCF-7 cells. Pre-incubation with free APTEDB inhibited the increase in R2 values observed for APTEDB-TCL-SPION-treated NDY-1 cells. All values are presented as the mean ± standard deviation of at least three independent experiments. Asterisks (*) indicate that the p value was statistically significant (<0.05).
We conducted an additional in vitro MRI of cell phantoms by varying the cell numbers to evaluate the detection sensitivity for the EDB-FN targeted BTIC imaging technique. The R2 values obtained for 5 × 10², 5 × 10³, 5 × 10⁴, 5 × 10⁵, and 5 × 10⁶ APTEDB-TCL-SPION-treated cells were 0.91 ± 0.06 sec-1, 0.93 ± 0.06 sec-1, 1.34 ± 0.08 sec-1, 7.58 ± 0.67 sec-1, and 29.73 ± 5.07 sec-1, respectively (Additional file 1: Supplementary Figure 4). We found that ~5 x 10⁵ BTICs could be sufficiently detected under these experimental conditions.
In vivo tumor imaging
To examine the feasibility of APTEDB-TCL-SPION as a targeted MRI contrast agent in vivo, we generated NDY-1 xenograft tumors in mice to model EDB-FN positive BTIC-derived tumors. After MR images of tumors were obtained, we calculated ratios of the SI for the pre- and post- images. At 4 h and 24 h after the injection of APTEDB-TCL-SPION, the T2*-weighted images showed distinct spots exhibiting decreased SI in tumors (Figure 5A). The SI ratio between the post- and pre-contrast images of the tumors obtained from the mice injected with APTEDB-TCL-SPION decreased to approximately 0.5 at both 4 h and 24 h (Figure 5B, *p<0.05). However, the apparent SI changes within the tumor were not observed after APTscramble-TCL-SPION or TCL-SPION injection (Figure 5B and Additional file 1: Supplementary Figure 5).
In vivo EDB-FN targeted tumor MRI. (A) T2*-weighted multi-slice images of the NDY-1 tumor in the mouse obtained prior to injection and at 4 h and 24 h after the injection of APTEDB-TCL-SPION or APTscramble-TCL-SPION (20 mg Fe/kg). The dotted line with circles indicates the engrafted tumor region. Multifocal hypointense spots were observed in tumors obtained from mice injected with APTEDB-TCL-SPION. (B) The signal intensity changes of the tumor areas, liver, spleen and kidney obtained from T2*-weighted images. An apparent signal intensity decrease within the tumor was detected only after APTEDB-TCL-SPION injection. All values are presented as the mean ± standard deviation of at least three independent experiments. Asterisks (*) indicate that the p value was statistically significant (<0.05).
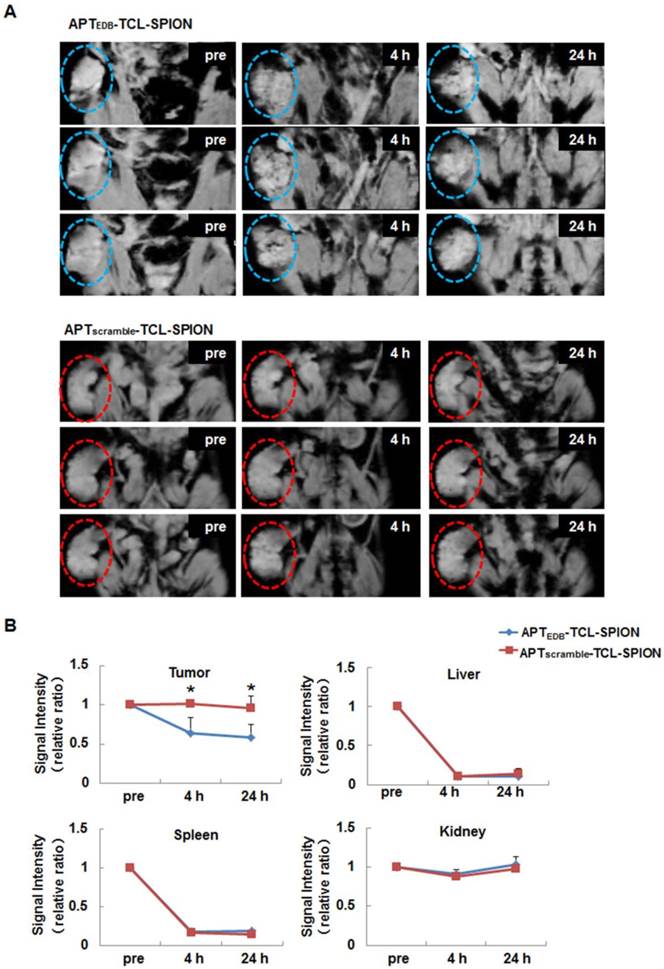
Liver and spleen exhibited marked changes in SI at 4 h and 24 h after the injection of APTEDB-TCL-SPION, APTscramble-TCL-SPION, or TCL-SPION compared with the tumors. In the kidney, a mild change in SI was detected at 4 h but it disappeared 24 h after the injection of APTEDB-TCL-SPION, APTscramble-TCL-SPION, or TCL-SPION; the SI of the thigh muscle did not change after the injection of APTEDB-TCL-SPION, APTscramble-TCL-SPION, or TCL-SPION (Figure 5B and Additional file 1: Supplementary Figure 5).
Histological analysis
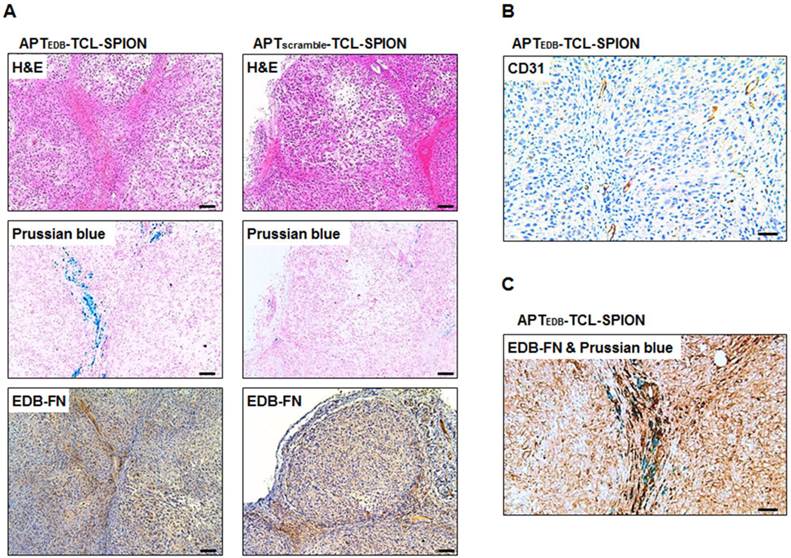
H&E staining was performed to investigate histological changes such as necrotic regions within tumors of mice injected with APTEDB-TCL-SPION and APTscramble-TCL-SPION. No necrotic areas within the tumors were detected in either group (Figure 6A, upper). We also evaluated the presence of APTEDB-TCL-SPION or APTscramble-TCL-SPION within tumor sections (Figure 6A, middle). As expected, a large number of blue dots were observed in the tumors obtained from mice injected with APTEDB-TCL-SPION. In contrast, fewer SPIONs were detected in the tumors obtained from mice injected with APTscramble-TCL-SPION. We further performed immunohistological analyses with an anti-EDB-FN antibody (BC-1) to evaluate the EDB-FN expression levels in tumors. A high level of EDB-FN expression was observed within the tumors obtained from mice of both groups (Figure 6A, lower). To investigate tumor vascularity, endothelial cells were stained with an anti-CD31 antibody. Figure 6B shows a large number of vessels in the extracellular matrix of the interstitial space of the tumor section. Furthermore, co-staining of the tumor section with anti-EDB-FN antibody and Prussian blue revealed that the APTEDB-TCL-SPIONs were mainly distributed in the EDB-FN positive extracellular matrix of the interstitial space, which also exhibited a highly vascular structure (Figure 6C).
Histological analysis of the tumors. (A) Hematoxylin and eosin (H&E) staining, Prussian blue staining and EDB-FN immunostaining. Prussian blue staining showed that a larger number of accumulated SPIONs were detected as blue dots in the tumors obtained from mice injected with APTEDB-TCL-SPION compared with APTscramble-TCL-SPION. Immunostaining of EDB-FN in NDY-1 tumor microsections was performed using the BC-1 antibody. EDB-FN proteins (dark brown) were abundantly detected in the NDY-1 tumors injected with APTEDB-TCL-SPION or APTscramble-TCL-SPION. (B) Immunostaining of CD31. Immunostaining of the platelet endothelial cell adhesion molecule (CD31) showing that vessels (dark brown) were observed in NDY-1 tumors obtained from mice injected with APTEDB-TCL-SPION. (C) Co-staining of an anti-EDB-FN antibody and Prussian blue. The accumulation of APTEDB-TCL-SPION (blue dots) was observed in EDB-FN positive areas of the tumor vasculature and interstitium. Scale bar: 100 μm
To evaluate and confirm the accumulation and distribution of intravenously administered APTEDB-TCL-SPION and APTscramble-TCL-SPION for several organs, Prussian blue staining was performed in tissues isolated from non-tumor-bearing mice at 24 h post-injection. While blue dots that represent stained iron particles were not detected in sections of brain, heart, kidney, and muscle, many blot dots were observed in liver and spleen, indicating that substantial amounts of the SPIONs were captured by the reticuloendothelial system (Additional file 1: Supplementary Figure 6). The histological findings observed with Prussian blue staining correlated with the in vivo MRI results.
Discussion
Current therapies such as a combination of surgery, chemotherapy, hormone therapy, and radiation therapy can eliminate the bulk of a breast tumor, but they fail to completely eradicate the BTICs responsible for the recurrence and metastasis of the cancers [28]. Therefore, screening and identifying characteristic BTIC biomarkers is important for distinguishing BTICs from differentiated tumor cells within the tumor mass. It has been shown that the BTICs found in breast cancer express characteristic biomarkers (CD44+/CD24-/ALDH1+) that are distinct from differentiated breast cancer cells [1, 4]. In this study, we found that NDY-1 cells, which are derived from the cancerous tissue of a breast cancer patient, highly expressed the self-renewal genes Oct-4, Nanog, and KLF4 in addition to the characteristic biomarkers of BTICs. We examined EDB-FN expression in various human breast cancer cells with different molecular subtypes and metastatic potentials and found that only NDY-1 cells specifically expressed abundant EDB-FN. To the best of our knowledge, this is the first report to document the relationship between EDB-FN expression and BTICs.
For the in vivo imaging studies using EDB-FN positive tumors in preclinical and clinical trials, EDB-FN specific antibodies or peptides labeled with fluorescent dyes or a radioisotope were examined using an optical system, positron electron tomography (PET), and single-photon emission computed tomography (SPECT) [7, 29, 30]. Antibodies have been widely used in the development of specifically targeted imaging probes due to their intrinsic high affinities and specificities; however, their large size is a primary cause of insufficient tissue penetration, which results in poor image quality [31, 32]. Therefore, alternatives to antibodies and the development of active biomarker conjugated-imaging probes are required for the specific diagnosis and treatment of tumors [13, 14, 33, 34]. Our previous studies have shown that the small size high-affinity peptide aptide (APTEDB) can easily extravasate and specifically bind to EDB-FN as a targeting ligand for the delivery of a drug-encapsulating liposome for cancer therapy [22]. To allow the selective detection of EDB-FN-expressing tumors via in vivo MRI, we recently synthesized oleic acid-stabilized SPIONs by conjugating them with APTEDB [21]. Previous reports have considered APTEDB a desirable moiety for the selective and effective detection of EDB-FN. Furthermore, APTEDB-conjugated nanoparticles can be useful for specific drug delivery and in vivo imaging by MRI of EDB-FN expressing tumors located in deep tissues.
Optical imaging reporter genes can visualize BTICs in the xenograft of living animals [3]. However, in vivo optical imaging has limited tissue penetration and the disadvantage of low spatial resolution. MRI can provide tomographic or volumetric imaging of internal organs at high anatomical resolutions and soft tissue contrast without using ionizing radiation, which is not possible using other imaging modalities. MRI has the potential to become a valuable imaging modality to accurately evaluate the response to chemotherapy and to determine whether to use surgery or irradiation for local tumor control [35]. We demonstrated that tagging BTICs with an MRI reporter is able to distinguish between dead and live BTICs within a tumor after chemotherapy [25]. Cell surface markers such as CD44 have been used to target BTICs and other TICs using hyaluronic acid (HA)-modified nanoparticles [36]; however, CD44 is expressed ubiquitously in a large number of mammalian cell types, including differentiated cancer cells. Because of the specific and high expression of EDB-FN in BTICs, we assume here that EDB-FN is the most reliable biomarker to selectively target and image BTICs. The development of EDB-FN ligand-conjugated SPIONs could provide information regarding the biological characteristics of individual tumors before and after treatment and an opportunity to test new targeted treatments of BTICs. We developed EDB-FN specific aptide-conjugated MRI contrast agents (APTEDB-TCL-SPION) to facilitate the better interpretation of in vitro and in vivo targeted MRI of EDB-FN-overexpressing BTICs. The use of APTEDB-TCL-SPION as an MRI contrast agent exhibits a much higher transverse relaxivity than the oleic acid SPION (230 mM-1 sec-1 versus 120 mM-1 sec-1 ) [21]. This implies that APTEDB-TCL-SPIONs can be utilized for the efficient EDB-FN targeted MRI at low concentrations, which may result in the reduction of harmful effects generated by the SPIONs. BTICs are thought to be a small population of cells with self-renewal capacity and therapeutic resistance in tumors [1]. Therefore, studies validating that MRI is sufficiently sensitive and suitable for the detection of the low population numbers of BTICs in the tumor may be critical. Our previous study showed that the viable CD44+/CD24- populations of BTICs within the tumor after chemotherapy can be quantitatively analyzed by non-invasive MRI [25]. The present study demonstrates that at least 5 x 10⁵ BTICs were sufficient for detection using this method and that BTICs within the tumor mass could be clearly detected using APTEDB-TCL-SPIONs and a 3T clinical MR scanner. We suggest that MRI using APTEDB-TCL-SPIONs is sufficiently sensitive and suitable for EDB-FN targeted imaging of BTICs. Furthermore, anticancer drugs such as doxorubicin can easily be loaded in the polymeric shell of the APTEDB-TCL-SPION to construct a theranostic system for combined cancer imaging and therapy of BTICs, as shown in our previous studies [18, 19]. The use of clinically applicable higher-field 7T MRI scanners and more sensitive susceptibility-weighted imaging sequences would improve the detection sensitivity of BTICs using APTEDB-TCL-SPION. EDB-FN targeted MRI has the potential to be used in clinical practice to identify and localize BTICs within the tumor mass before surgery and to monitor the response to treatment in breast cancer [37].
In conclusion, we report for the first time that EDB-FN is highly expressed in BTICs but not in differentiated breast cancer cells. These results suggest that EDB-FN can be used as a new characteristic biomarker for identifying BTICs. Furthermore, we developed an imaging probe that targets BTICs by covalently attaching EDB-FN specific high-affinity peptides to TCL-SPIONs, and it enables the visualization of BTICs within the tumor mass in vivo using a clinical 3T MRI scanner. Future studies will include the therapeutic feasibility of APTEDB-TCL-SPIONs combined with therapeutic drugs and EDB-FN RNAi as a novel theranostic system that allows for the simultaneous diagnosis and therapeutic treatment of the hard-to-treat BTICs found in breast cancers.
Supplementary Material
Additional File 1Supplementary Figures 1-6.
Abbreviations
MRI: magnetic resonance imaging; BTIC: Breast tumor initiating cell; SPION: Superparamagnetic iron oxide nanoparticles; TCL-SPION: thermally cross-linked-superparamagnetic iron oxide nanoparticle; APT: aptide; FN: fibronectin; EDB: extra domain-B; EDA: extra domain-A; APTEDB: EDB-FN aptide; ALDH1: aldehyde dehydrogenase 1; PET: positron electron tomography; SPECT: single-photon emission computed tomography.
Acknowledgements
This study was supported by a grant from the National R&D Program for Cancer Control, Ministry for Health, Welfare, and Family Affairs, Republic of Korea (0920030).
Competing Interests
The authors have declared that no competing interest exists.
References
1. Al-Hajj M, Wicha MS, Benito-Hernandez A. et al. Prospective identification of tumorigenic breast cancer cells. Proc Natl Acad Sci U S A. 2003;100:3983-8
2. Dean M, Fojo T, Bates S. Tumour stem cells and drug resistance. Nat Rev Cancer. 2005;5:275-84
3. Liu H, Patel MR, Prescher JA. et al. Cancer stem cells from human breast tumors are involved in spontaneous metastases in orthotopic mouse models. Proc Natl Aca Sci U S A. 2010;107:18115-20
4. Ginestier C, Hur MH, Charafe-Jauffret E. et al. ALDH1 is a marker of normal and malignant human mammary stem cells and a predictor of poor clinical outcome. Cell Stem Cell. 2007;1:555-67
5. Potts JR, Campbell ID. Fibronectin structure and assembly. Curr Opin Cell Biol. 1994;6:648-55
6. Birchler MT, Milisavlijevic D, Pfaltz M. et al. Expression of the extra domain B of fibronectin, a marker of angiogenesis, in head and neck tumors. Laryngoscope. 2003;113:1231-7
7. Santimaria M, Moscatelli G, Viale GL. et al. Immunoscintigraphic detection of the ED-B domain of fibronectin, a marker of angiogenesis, in patients with cancer. Clin Cancer Res. 2003;9:571-9
8. Mhawech P, Dulguerov P, Assaly M. et al. EB-D fibronectin expression in squamous cell carcinoma of the head and neck. Oral Oncol. 2005;41:82-8
9. Kosmehl H, Berndt A, Strassburger S. et al. Distribution of laminin and fibronectin isoforms in oral mucosa and oral squamous cell carcinoma. Br J Cancer. 1999;81:1071-9
10. Ricci E, Cavalot AL, Sanvito F. et al. Differential expression and topography of adhesion molecules in laryngeal and oropharyngeal carcinomas. Acta Otolaryngol. 2002;122:234-40
11. Koukoulis GK, Howeedy AA, Korhonen M. et al. Distribution of tenascin, cellular fibronectins and integrins in the normal, hyperplastic and neoplastic breast. J Submicrosc Cytol Pathol. 1993;25:285-95
12. Berndt A, Borsi L, Luo X. et al. Evidence of ED-B+ fibronectin synthesis in human tissues by non-radioactive RNA in situ hybridization. Investigations on carcinoma (oral squamous cell and breast carcinoma), chronic inflammation (rheumatoid synovitis) and fibromatosis (Morbus Dupuytren). Histochem Cell Biol. 1998;109:249-55
13. Thakor AS, Gambhir SS. Nanooncology: The future of cancer diagnosis and therapy. CA Cancer J Clin. 2013;63:395-418
14. Yu MK, Park J, Jon S. Targeting strategies for multifunctional nanoparticles in cancer imaging and therapy. Theranostics. 2012;2:3-44
15. Lee H, Yu MK, Park S. et al. Thermally cross-linked superparamagnetic iron oxide nanoparticles: synthesis and application as a dual imaging probe for cancer in vivo. J Am Chem Soc. 2007;129:12739-45
16. Li M, Kim HS, Tian L. et al. Comparison of Two Ultrasmall Superparamagnetic Iron Oxides on Cytotoxicity and MR Imaging of Tumors. Theranostics. 2012;2:76-85
17. Wang AZ, Bagalkot V, Vasilliou CC. et al. Superparamagnetic iron oxide nanoparticle-aptamer bioconjugates for combined prostate cancer imaging and therapy. ChemMedChem. 2008;3:1311-5
18. Yu MK, Kim D, Lee IH. et al. Image-guided prostate cancer therapy using aptamer-functionalized thermally cross-linked superparamagnetic iron oxide nanoparticles. Small. 2011;7:2241-9
19. Yu MK, Park J, Jeong YY. et al. Integrin-targeting thermally cross-linked superparamagnetic iron oxide nanoparticles for combined cancer imaging and drug delivery. Nanotechnology. 2010;21:415102
20. Kim S, Kim D, Jung HH. et al. Bio-inspired design and potential biomedical applications of a novel class of high-affinity peptides. Angew Chem Int Ed Engl. 2012;51:1890-4
21. Park J, Kim S, Saw PE. et al. Fibronectin extra domain B-specific aptide conjugated nanoparticles for targeted cancer imaging. J Control Release. 2012;163:111-8
22. Saw PE, Kim S, Lee IH. et al. Aptide-conjugated liposome targeting tumor-associated fibronectin for glioma therapy. J Mater Chem B. 2013;1:4723-6
23. Neve RM, Chin K, Fridlyand J. et al. A collection of breast cancer cell lines for the study of functionally distinct cancer subtypes. Cancer Cell. 2006;10:515-27
24. Lee KM, Han W, Kim JB. et al. The CD49d+/high subpopulation from isolated human breast sarcoma spheres possesses tumor-initiating ability. Int J Oncol. 2012;40:665-72
25. Choi Y, Kim HS, Cho KW. et al. Noninvasive identification of viable cell populations in docetaxel-treated breast tumors using ferritin-based magnetic resonance imaging. PloS One. 2013;8:e52931
26. Hauger O, Delalande C, Deminiere C. et al. Nephrotoxic nephritis and obstructive nephropathy: evaluation with MR imaging enhanced with ultrasmall superparamagnetic iron oxide-preliminary findings in a rat model. Radiology. 2000;217:819-26
27. Weissleder R, Stark DD, Engelstad BL. et al. Superparamagnetic iron oxide: pharmacokinetics and toxicity. AJR Am J Roentgenol. 1989;152:167-73
28. Eccles SA, Aboagye EO, Ali S. et al. Critical research gaps and translational priorities for the successful prevention and treatment of breast cancer. Breast Cancer Res. 2013;15:R92
29. Neri D, Carnemolla B, Nissim A. et al. Targeting by affinity-matured recombinant antibody fragments of an angiogenesis associated fibronectin isoform. Nat Biotechnol. 1997;15:1271-5
30. Birchler M, Neri G, Tarli L. et al. Infrared photodetection for the in vivo localisation of phage-derived antibodies directed against angiogenic markers. J Immunol Methods. 1999;231:239-48
31. Chames P, Van Regenmortel M, Weiss E. et al. Therapeutic antibodies: successes, limitations and hopes for the future. Br J Pharm. 2009;157:220-33
32. McCarthy JR, Bhaumik J, Karver MR. et al. Targeted nanoagents for the detection of cancers. Mol Oncol. 2010;4:511-28
33. Benachour H, Seve A, Bastogne T. et al. Multifunctional Peptide-conjugated hybrid silica nanoparticles for photodynamic therapy and MRI. Theranostics. 2012;2:889-904
34. Zheng Y, Liu Y, Jin H. et al. Scavenger receptor B1 is a potential biomarker of human nasopharyngeal carcinoma and its growth is inhibited by HDL-mimetic nanoparticles. Theranostics. 2013;3:477-86
35. Goscin CP, Berman CG, Clark RA. Magnetic resonance imaging of the breast. Cancer Control. 2001;8:399-406
36. Goodarzi N, Ghahremani MH, Amini M, Atyabi F, Ostad SN, Shabani Ravari N. et al. CD44-Targeted Docetaxel Conjugate for Cancer Cells and Cancer Stem-Like Cells: A Novel Hyaluronic Acid-Based Drug Delivery System. Chem Biol Drug Des. 2014 [Epub ahead of print]
37. McLaughlin R, Hylton N. MRI in breast cancer therapy monitoring. NMR Biomed. 2011;24:712-20
Author contact
![]() Corresponding authors: Sangyong Jon, Department of Biological Sciences, Korea Advanced Science and Technology (KAIST), 291 Daehak-ro, Yuseong-gu, Daejeon 305-701, Korea. Tel: 82-42-350-2634, Fax: 82-42-350-4450. syjonac.kr or Woo Kyung Moon, Department of Radiology, Seoul National University Hospital, 101 Daehak-ro, Jongno-gu, Seoul 110-744, Korea. Tel: 82-2-2072-3928, Fax: 82-2-743-6385, moonwkac.kr.
Corresponding authors: Sangyong Jon, Department of Biological Sciences, Korea Advanced Science and Technology (KAIST), 291 Daehak-ro, Yuseong-gu, Daejeon 305-701, Korea. Tel: 82-42-350-2634, Fax: 82-42-350-4450. syjonac.kr or Woo Kyung Moon, Department of Radiology, Seoul National University Hospital, 101 Daehak-ro, Jongno-gu, Seoul 110-744, Korea. Tel: 82-2-2072-3928, Fax: 82-2-743-6385, moonwkac.kr.