Impact Factor
- Issue 14; 2026
- Issue 13; 2026
- Issue 12; 2026
- Issue 11; 2026
- Issue 10; 2026
- Volume 16; 2026
- Advance Articles
- Past Issues
- Cover Images
- Cover Suggestion
- Index & Coverage
- Special Issues
Introduction
Materials and Methods
Results and Discussion
Conclusions
Abbreviations
Supplementary Material
Acknowledgements
References
International Journal of Biological Sciences
International Journal of Medical Sciences
 Global reach, higher impact

Theranostics 2015; 5(3):251-266. doi:10.7150/thno.10396 This issue Cite
Research Paper
Three-Photon Luminescence of Gold Nanorods and Its Applications for High Contrast Tissue and Deep In Vivo Brain Imaging
Shaowei Wang1, Wang Xi2, Fuhong Cai1, Xinyuan Zhao3, Zhengping Xu3, Jun Qian1 ![]() , Sailing He1
, Sailing He1 ![]()
1. State Key Laboratory of Modern Optical Instrumentations, Centre for Optical and Electromagnetic Research, Zhejiang Provincial Key Laboratory for Sensing Technologies, JORCEP (Sino-Swedish Joint Research Center of Photonics), Zhejiang University, Hangzhou, Zhejiang, 310058, China;
2. Department of Neurobiology, Key Laboratory of Medical Neurobiology of Ministry of Health of China, Zhejiang Province Key Laboratory of Neurobiology, School of Medicine, Zhejiang University, Hangzhou, Zhejiang, 310058, China;
3. Bioelectromagnetics Laboratory, School of Medicine, Zhejiang University, Hangzhou, Zhejiang, 310058, China.
Received 2014-8-23; Accepted 2014-11-5; Published 2015-1-1
Abstract

Gold nanoparticles can be used as contrast agents for bio-imaging applications. Here we studied multi-photon luminescence (MPL) of gold nanorods (GNRs), under the excitation of femtosecond (fs) lasers. GNRs functionalized with polyethylene glycol (PEG) molecules have high chemical and optical stability, and can be used as multi-photon luminescent nanoprobes for deep in vivo imaging of live animals. We have found that the depth of in vivo imaging is dependent upon the transmission and focal capability of the excitation light interacting with the GNRs. Our study focused on the comparison of MPL from GNRs with two different aspect ratios, as well as their ex vivo and in vivo imaging effects under 760 nm and 1000 nm excitation, respectively. Both of these wavelengths were located at an optically transparent window of biological tissue (700-1000 nm). PEGylated GNRs, which were intravenously injected into mice via the tail vein and accumulated in major organs and tumor tissue, showed high image contrast due to distinct three-photon luminescence (3PL) signals upon irradiation of a 1000 nm fs laser. Concerning in vivo mouse brain imaging, the 3PL imaging depth of GNRs under 1000 nm fs excitation could reach 600 μm, which was approximately 170 μm deeper than the two-photon luminescence (2PL) imaging depth of GNRs with a fs excitation of 760 nm.
Keywords: gold nanorods, three-photon luminescence, deep in vivo imaging, high contrast, tumor tissue.
Introduction
With the fusion of nanotechnology, biotechnology, and optical technology, various types of nanomaterials (e.g. carbon nanotubes [1], magnetic nanoparticles [2], and gold nanoparticles [3]) with unique optical properties have been applied in bio-imaging, bio-sensing and biotherapy. In particular, gold nanorods (GNRs) with well-defined shapes and sizes are very attractive, due to their ease of preparation and surface functionalization, low cytotoxicity, fine biocompatibility, and excellent surface plasmon resonance (SPR) properties in the near-infrared (NIR) region [4,5]. All these features make GNRs very promising in biological applications, such as biomedical imaging and sensing, gene delivery, drug delivery and therapy [5, 6].
GNRs have two SPR bands: a strong longitudinal band which can be tuned by controlling the aspect ratio (length/diameter) of the GNRs, and a weak transverse band, which is located around 520 nm [4]. The peak wavelength and intensity of the longitudinal SPR band of GNRs are very sensitive to the local refractive index, and can be used as excellent biosensors to detect molecules which are bonded with or close to the surface of the GNRs [7, 8]. Their SPR property also makes GNRs very useful in surface-enhanced Raman spectroscopy (SERS) [9, 10]. In addition, due to their strong plasmon resonant absorption band, which is tunable from the visible range to NIR, as well as their enhanced scattering cross section, GNRs have been well-developed for in vitro and in vivo bio-imaging, including plasmon-enhanced near-infrared imaging [9,11], dark-field scattering imaging [12], optical coherence tomography (OCT) [13], photoacoustic tomography (PAT) [14,15], two-photon luminescence imaging [16-18], etc.
During the past two decades, multi-photon luminescence microscopy has been developed and well suited for cell and tissue imaging. The upconverted MPL signals can be spectrally separated from the downconverted autofluorescence of biological samples very easily [19-22]. A multi-photon absorption/luminescence process has a nonlinear dependence on excitation intensity. This can help improve the spatial resolution of imaging and reduce the photobleaching of the sample outside the beam focus, as only the site where the laser beam is focused can be efficiently excited [21]. In addition, deep in vivo imaging is promising if the MPL excitation wavelength is selected in the spectral region of 650-1000 nm, which is considered as an "optical tissue window", since light with a wavelength in this window has minimal optical absorption and relatively small scattering in biological tissue. GNRs exhibit strong plasmon-enhanced multi-photon luminescence (MPL, three or two-photon luminescence), and its brightness is much stronger than that of many existing conventional organic chromophores [16]. So far, many studies have demonstrated the potential of GNRs in cellular and in vivo MPL imaging [16-18]. Most of these studies focused on the two-photon luminescence (2PL) of GNRs, excited by a femtosecond (fs) laser with a wavelength between 700-800 nm. The longitudinal band of the GNRs is also tuned to this spectral region to overlap with the MPL excitation wavelength. Hence, the 2PL efficiency of GNRs could be increased and the 2PL imaging depth could also be improved accordingly. However, in order to look deeper inside tissue, longer-wavelength fs excitation can be used [23]. Absorption loss of light increases when the excitation wavelength gets longer due to the absorption property of water, but scattering loss of light is reduced when longer-wavelength excitation is adopted, and thus the total light attenuation can be effectively reduced. Recently, several studies have demonstrated that longer-wavelength excited multi-photon luminescence can extend the maximum depth of in vivo imaging [23, 24]. In addition, under longer-wavelength (e.g. > 800 nm) fs excitation, three-photon luminescence (3PL) of GNRs can be excited, and its luminescence spectrum is located between one-third of the excitation wavelength and half of the excitation wavelength. A high-order nonlinear optical signal is helpful in improving the imaging contrast [25]. To achieve deeper and higher-contrast bio-imaging, the longitudinal band of the GNRs can be tuned to overlap with the MPL excitation wavelength in the longer-wavelength region of the optical tissue window (e.g. 1000 nm).
In this study, we demonstrated that PEGlylated GNRs can be employed as 3PL luminescent nanoprobes for high contrast tissue and deep in vivo mouse brain imaging. A conventional and an improved seed-mediated growth method were used to prepare GNRs with longitudinal LSPR peaks at 760 nm and 1000 nm (abbreviated as 760GNRs and 1000GNRs), respectively. The GNRs showed excellent MPL (2PL and 3PL) signals upon fs excitation at 760 nm and 1000 nm, and MPL in vitro and in vivo imaging experiments were performed by treating mice with PEGylated GNRs. 3PL of 1000GNRs, which accumulated in major organs and tumor tissue, showed strong contrast signals under 1000 nm-fs excitation. In addition, the in vivo 3PL brain imaging depth of 1000GNRs under 1000 nm-fs excitation could reach 600 μm, approximately 170 μm deeper than the 2PL imaging depth of 760GNRs with fs-excitation at 760 nm. Compared to 2PL imaging of 760GNRs excited at 760 nm fs, 3PL imaging of 1000GNRs excited at 1000 nm fs possesses several advantages, including weak background autofluorescence, high signal to noise ratio, low photobleaching and deep tissue penetration without causing photodamage.
Materials and Methods
Materials
All chemicals were obtained from commercial suppliers and used without further purification. Cetyltrimethylammonium bromide (CTAB>98.0%), hydrogen tetrachloroaurate (III) trihydrate (HAuCl4•3H2O), sodium borohydride (NaBH4, 99%), silver nitrate (AgNO3, >99%), L-ascorbic Acid (BioUltra, ≥99.5%) and hydrochloric acid (HCl, 37 wt.% in water) were purchased from Sigma-Aldrich. Sodium oleate (NaOL, >97.0%) was purchased from TCI America. SH-PEG-CH3 (methoxy PEG Thiol, MW5000) was purchased from JenKem Technology Co., Ltd. Deionized (DI) water was used in all experiments.
Synthesis of seeds for gold nanorods (GNRs)
GNRs with longitudinal LSPR peaks located at ~ 650-800 nm (short GNRs) and ~ 840-1100 nm (long GNRs) were synthesized using two protocols based on the seed-mediated method in an aqueous solution proposed by Nikoobakht [26] and Xingchen Ye [27], respectively. The synthesis of seeds for both methods is the same. 0.6 ml of 0.01 M ice-cold sodium borohydride was quickly injected into a 10 ml stirring (1200 rpm) aqueous solution containing 0.25 mM HAuCl4 and 0.1 M CTAB. The solution color changed from yellow to brownish yellow. After stirring the solution vigorously for 2 min, the solution was kept for 30 min at room temperature in order to allow the hydrolysis of NaBH4 before use.
Growth of short GNRs
The short GNR growth solution was prepared by adding 0.2 ml of 25 mM HAuCl4 to 5 ml of 0.2 M CTAB. Then, 16 mM of silver nitrate (AgNO3) and 80 mM of ascorbic acid were separately added to this solution to make a final mixture volume of about 10 ml. After the growth solution turned colorless, 12 μl of previously prepared seed solution was injected into it. Then it was left undisturbed at 37 °C for 18 h to let the GNRs grow. The GNR solution was centrifuged twice at 7200 rpm for 10 min to remove the excess reaction reagents and then redispersed into DI water. GNRs with different longitudinal plasmon bands could be acquired through controlling the aspect ratios by tuning the additions of AgNO3 and ascorbic acid. To make GNRs with the longitudinal LSPR peaks at 650 nm and 760 nm, the amount of AgNO3 was tuned to 40 μl and 90 μl and ascorbic acid was tuned to 60 μl and 75 μl, respectively.
Growth of long GNRs
A long GNR growth solution containing 3.5 g CTAB and 0.617 g NaOL was prepared in warm water (~ 30 °C) in a 500 ml Erlenmeyer flask. 12 ml of 4 mM AgNO3 solution and 125 ml of 1 mM HAuCl4 were added. After 60 min of stirring, when the mixture solution became colorless, 2.4 ml of HCl (37 wt. % in water) and 0.625 ml of 64 mM ascorbic acid were added, and the solution was vigorously stirred for 1 min. After that, 0.4 ml of seed solution was injected into the growth solution, which was stirred for 30 s and left undisturbed at 37 °C for 12 h to let the GNRs grow. The GNR solution was centrifuged twice at 6000 rpm for 10 min to remove the excess reaction reagents and then redispersed into DI water. The obtained GNRs have a longitudinal LSPR peak at about 1000 nm. For other peaks see details in Additional file 1: Table S1.
Surface modification of GNRs
For typical PEG modification of GNRs, 10 ml of the as-prepared GNRs were centrifuged twice at 6000 rpm (7200 rpm for short GNRs) for 10 min, and then the precipitate was dispersed in 5 ml of a 2 mg/ml aqueous solution of SH-PEG-CH3 (MW = 5000). The solution was immediately vortexed for 3 min for uniform mixing and stirred magnetically for 12 h. After that, the solution was centrifuged and the precipitate was redispersed in 5 ml of a 2 mg/ml PEG aqueous solution to perform the same procedure, making sure that the CTAB/NaOL molecules were completely displaced by PEG molecules. Successful surface modification with PEG was assessed using UV-vis-NIR spectroscopy and Zeta potentials (Additional file 1: Figure S1, S2). The final PEGylated GNR solution was washed twice and dispersed in a 1 × PBS solution for in vivo use.
Characterizations of GNRs
The absorption spectra of GNRs were measured by a Shimadzu UV3600 UV-vis-NIR scanning spectrophotometer. TEM images were captured by a JEOL JEM-1200EX microscope operated at 160 kV. TEM samples were prepared by casting 10 μl of GNR aqueous solution on copper grids and dried at room temperature. Zeta potentials were measured on a Zetasizer 3000 HAS instrument. The multi-photon luminescence spectra of GNRs excited by the 1000 nm and 760 nm fs laser were measured by a home-built cage system and collected by an optical fiber spectrometer (PG2000, Ideaoptics Instruments).
Cell viability analysis
The cytotoxicity of GNRs to HeLa cells was evaluated by following the instructions of cell counting kit-8 (CCK-8). 5000 cells/well in a 100 μl suspension were incubated in 96-well plates for 24 h. Then, a 100 μl fresh culture medium containing GNRs with various concentrations ranging from 0 to 200 pM was added into each well. After incubation for 24 h, the culture medium was removed and the cell well was washed three times with PBS. In the end, 100 μl culture medium containing CCK-8 (10%) was added into each well for 2 h, and the absorbance was measured at 450 nm by using a microplate reader (Thermo, USA).
Animals' preparation
All the animal experiments were performed strictly in compliance with the requirements and guidelines of the Institutional Ethical Committee of Animal Experimentation of Zhejiang University. The BALB/c mice (~ 20 g, male) and nude mice (~ 18 g, male) were obtained from the Laboratory Animal Center of Zhejiang University (Hangzhou, China). The mice were housed in cages at 24 °C with a 12 h light/dark cycle and were fed with standard laboratory water and chow. Tumor-bearing mice were prepared as follows. HeLa cells were cultured in the Dulbecco's minimum essential media (DMEM) containing 10% fetal bovine serum (FBS), 1% penicillin, and 1% amphotericin B under an atmosphere environment of 5% CO2 and 95% air at 37 °C. The incubated HeLa cells were injected subcutaneously into the abdomen of nude mice with a dose of 3×10⁶ cells in 200 μl of 1 × PBS. Tumor growth was monitored every 2 days until a tumor size of approximately 5 mm in diameter was observed.
Tissue slices preparation
PEG-760GNRs and PEG-1000GNRs (in 200 μl 1 × PBS, 25 nM) were intravenously injected into normal mice and tumor-bearing mice via the tail vein, respectively, and the two GNR samples (in 50 μl 1 × PBS, 5 nM) were intradermally injected into the left forepaw pad of the mice. After the intravenous injections, GNRs can be transported to the major organs via blood circulation [28]. The intradermal injections make it easy for GNRs to be transported to the sentinel lymph node via the lymph vessels [29, 30]. All the control mice (normal and tumor-bearing mice) were treated with an equal amount of saline. Major organs (liver, brain, & kidney) and the sentinel lymph node (SLN) were excised at 0.5 h and tumors were extracted 48 h after the injection. All the tissue samples were fixed in 4% paraformaldehyde to preserve the tissue architecture, and then transferred to 70% ethanol prior to processing. Then they were embedded in paraffin, sectioned at 50 μm thicknesses and mounted on slides. The slides were covered with coverslips and stored at 4 °C for imaging use.
In vitro MPL imaging of GNRs in tissue
The MPL images of GNRs accumulated in tissues were recorded by a commercial upright multi-photon scanning microscope (Olympus, FV1000). The fs laser beam was focused onto the sample by a 20 × objective (NA = 0.75), and the MPL signals were collected by a photomultiplier tube through non-descanned detection.
In vivo 3PL imaging of GNRs in mouse ear blood vessels
200 μl 1 × PBS solution of PEG-1000GNRs (25 nM) were intravenously injected into male BALB/c mice. The mice in the control group were intravenously injected with 200 μl saline. The mouse was anesthetized and placed on a Petri dish with one ear attached to the coverslip and prepared for in vivo imaging within 15 minutes [16]. An upright multi-photon scanning microscope was used to image the blood vessels. The 1000 nm fs laser beam was focused by a water-immersion objective lens (25 ×, NA = 1) onto the earlobe immersed by water, and the 3PL signals were collected by a photomultiplier tube through non-descanned detection with a filter within the 420-460 nm range. We acquired 80-μm-deep stacks for 3PL of PEG-1000GNRS taken with a 1 μm step depth.
In vivo MPL imaging of GNRs in mouse brain blood vessels
A cranial window microsurgery on the mouse brain was performed. Briefly, the mouse was anesthetized and a small piece of skull was excised using a dental drill. The surgery was operated under sterile conditions to avoid infections and any damage to the dura mater, and to ensure that the mice could live well after the imaging experiments. For in vivo experiments, the mice were injected with GNRs, and then anesthetized and placed on a home-made setup within 15 minutes for imaging, with their brain immobilized. To compare 1000 nm fs laser and 760 nm fs laser excited MPL, 200 μl 1 × PBS mixed solution of PEG-760GNRs (100 μl, 25 nM) and PEG-1000GNRs (100 μl, 25 nM) were intravenously injected into the mice. The dosage of PEG-GNRs used in our in vivo studies is reasonable compared with other literatures (200 μl of 50 mg/ml GNRs in [31] and 100 μl of 10 mg/mL in [32], our dosage is around 100 μl of 6 mg/mL). Meanwhile this dosage is safe for in vivo studies as the biocompatibility of PEG-GRNs had been verified by the histopathology test (Additional file 1: Figure S3). In addition, mice injected with 200 μl saline were also imaged as the control group. An upright multi-photon scanning microscope was used to image the blood vessels. For 1000 nm excitation, the fs laser beam was focused by a water-immersion objective lens (25 ×) onto the brain surface, which was immersed in water. The 3PL signals were collected by a photomultiplier tube through non-descanned detection with a filter within the 420-460 nm range. For 760 nm excitation, the 2PL signals were collected by the PMT with two filters within 500-540 nm and 575-630 nm ranges.
Histology
Tissue samples were harvested and fixed in 4% paraformaldehyde overnight at 4 °C. Then the samples were embedded in paraffin, sectioned, and stained with hematoxylin and eosin (H&E).
Results and Discussion
Synthesis and Characterizations of GNRs
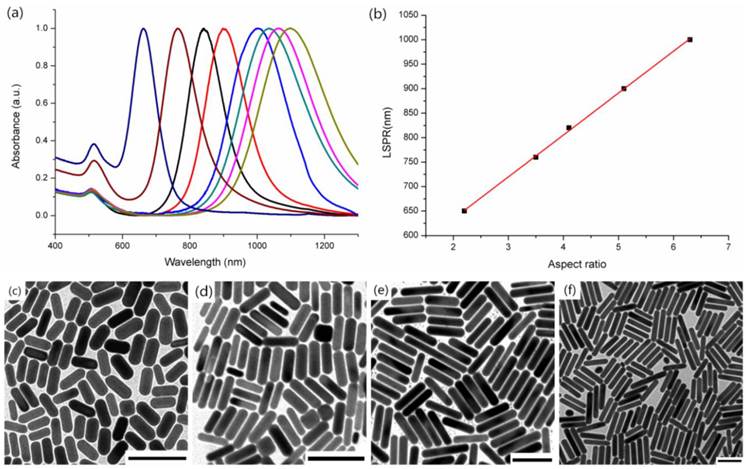
GNRs with low and high aspect ratios (corresponding to short and long GNRs) were synthesized using two different protocols based on seed-mediated methods in aqueous solution. The short GNRs were synthesized by a conventional method proposed by Nikoobakht [26], with the longitudinal LSPR peak tunable from 600 nm to 800 nm. However, it is a little bit difficult to use this approach to synthesize GNRs with a longitudinal LSPR peak longer than 800 nm. Thus, an improved technology using a binary surfactant mixture was adopted to tune the longitudinal LSPR peak of GNRs from 800 nm to 1100 nm [27]. Figure 1 showed the normalized absorption spectra (Figure 1a) and transmission electron microscopy (TEM) images (Figure 1b) of the GNRs with different aspect ratios. According to the conventional method, we prepared short GNRs with longitudinal LSPR peaks of 650 nm and 760 nm by tuning the amounts of AgNO3 and ascorbic acid (see Materials and Methods for details). By utilizing the improved method, we obtained long GNRs with longitudinal LSPR peaks of 840 nm, 900 nm, 1000 nm, 1036 nm, 1060 nm and 1100 nm. The improved new method used the combination of CTAB and sodium oleate (NaOL) as surfactants, in which the concentration of CTAB in the growth solution could be reduced to as low as 0.037 M. In the conventional method this concentration is 0.1 M. The improved method can achieve a narrow and uniform size distribution of GNRs. Furthermore, in the normalized absorption spectra (the peak intensities of longitudinal SPR bands of all the GNRs were normalized), the intensities of transverse SPR bands of long GNRs were much lower than those of short GNRs (as shown in Figure 1a), indicating that the improved synthesis method could also achieve a high yield of GNRs with very few byproducts (e.g. gold nanospheres). We chose two kinds of GNRs with longitudinal LSPR peaks at 760 nm (760GNRs) and 1000 nm (1000GNRs) for further imaging study. Representative TEM images showed that 760GNRs (Figure 1d) were ~ 20×65 nm with aspect ratio (AR) ~ 3.2, and 1000GNRs (Figure 1f) were ~ 15×100 nm, with aspect ratio (AR) ~ 6.5. As shown in Figure 1b, the longitudinal LSPR peak wavelengths had a linear relationship with the aspect ratios of GNRs, as previously reported [33].
Characterizations of gold nanorods. (a) Representative UV-vis-NIR absorption spectra of GNRs with the longitudinal localized surface plasmon resonance (LSPR) peaks at 650 nm, 760 nm, 840 nm, 900 nm, 1000 nm, 1036 nm, 1060 nm and 1100 nm (from left to right). (b) The relationship between the longitudinal LSPR peaks and calculated aspect ratios (based on TEM images). The straight line is a linear fitting of data points. (c-f) Representative TEM images of GNRs with the longitudinal LSPR peaks at (c) 650 nm, (d) 760 nm , (e) 920 nm , and (f) 1000 nm. Scale bars: 100 nm.
Surface modification of GNRs for bioimaging
The as-prepared GNRs were positively charged due to the presence of CTAB for short GNRs and a binary surfactant mixture composed of CTAB and NaOL for long GNRs. To graft PEG molecules on the surface of GNRs, a reaction was formed with CTAB/NaOL-coated GNRs and thiol-PEG under vigorous stirring in order to displace the CTAB/NaOL layer with PEG polymer through the strong Au-S binding (see Materials and Methods for details). A PEG polymer is a kind of biocompatible polymer, and it can keep GNRs chemically stable, as well as improve the long circulation of GNRs in an animal body during an in vivo experiment [34]. After PEG modification, the absorption spectra of PEG-GNRs were recorded, which were very similar with that of CTAB/NaOL-GNRs, and had little red-shift of the longitudinal LSPR peaks. This illustrates a successful displacement of CTAB/NaOL molecules by a PEG polymer on the surface of GNRs that was achieved without aggregation (Additional file 1: Figure S1). The Zeta-potential testing of the GNRs was performed to measure the surface charge of the GNRs, as well as to double check the coatings of the PEG molecules on the surface of the GNRs. Both CTAB-GNRs and CTAB/NaOL-GNRs showed positive charges, while for the PEGylated GNRs, the zeta-potential was nearly neutral (Additional file 1: Figure S2). The resulting GNRs were referred to as PEG-GNRs and utilized for the following studies.
Stability and Cytotoxicity of GNRs
Although the stability and cytotoxicity of PEG modified CTAB-GNRs have been studied by some previous works [9, 34], they have not been completely understood for PEG modified CTAB/NaOL-GNRs. Therefore, we first recorded the absorption spectra of PEG-GNRs in an aqueous solution with pH values varying from 1 to 13, as well as in an animal serum and PBS solution at the beginning. 48 h later, the absorption spectra of PEG-GNRs in different solutions were measured again, and various ratios could be obtained by dividing the intensities at longitudinal LSPR peaks of PEG-GNRs with those at the beginning (Figure 2a). We found that the ratios in all solutions were larger than 90%, indicating that the optical and chemical properties of PEG-GNRs were maintained very well in various extreme chemical and biological conditions.
(a) Absorption intensity ratios of the longitudinal LSPR wavelength of PEGylated GNRs, measured immediately after and 48 h after dispersion in solutions with different pH values, serums and PBS solutions. (b) Viability of HeLa cells after incubation with the CTAB/NaOL GNRs and PEGylated GNRs for 24 h. (*) P<0.05, (**) P<0.01, (***) P<0.001.
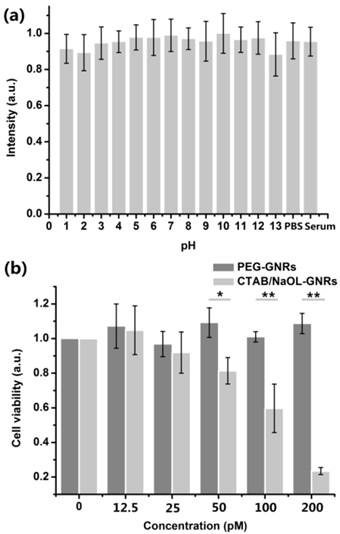
The cytotoxicity of PEG-GNRs towards cells was also examined by following the instructions of cell counting kit-8 (CCK-8). Figure 2b showed the relative viabilities of HeLa cells treated with PEG-GNRs or CTAB/NaOL-GNRs after 24 h. The cells treated with PEG-GNRs maintained very high viabilities, and it was still larger than 85% even when the concentration of PEG-GNRs was as high as 200 pM. However, CTAB/NaOL-GNRs exhibited high cytotoxicity 24 h after the cell treatment (only 25%), due to the existence of CTAB molecules [33]. Furthermore, in vivo biocompatibility of PEG-GNRs was assessed by using a histopathology test (Additional file 1: Figure S3). The results show that at 24 h, 48 h and 72 h post-administration of PEGylated GNRs, mice have no inflammation or abnormalities on their major organs during the GNRs accumulation via the blood circulation, suggesting that GNRs are highly biocompatible. The low cytotoxicity and high biocompatibility of PEG-GNRs make them excellent optical probes for various in vitro and in vivo bio-imaging applications.
MPL properties of GNRs
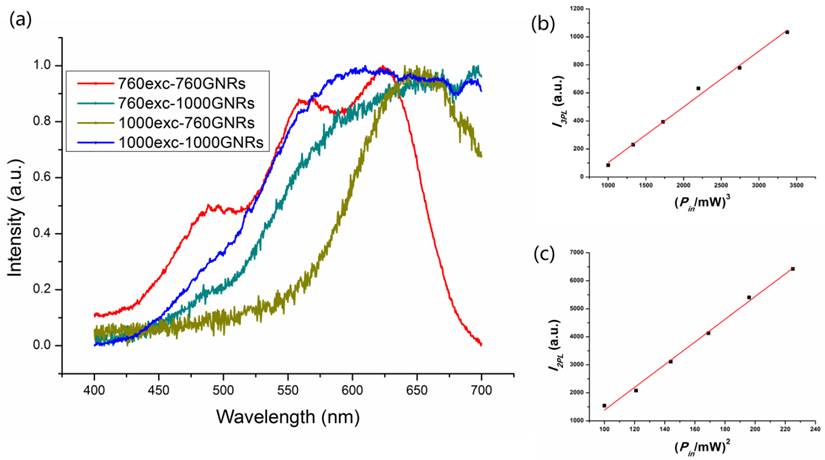
Three/two photon luminescence processes of GNRs occur when three/two photons are absorbed by a GNR and electron-hole pairs are generated by the exciting electrons from d-band to sp-band. The excited electrons then move to the Fermi level by losing energy, and recombination of the electron-hole pairs results in 3PL/2PL emission [16, 35, 36]. Multiphoton luminescence (3PL and 2PL) from GNRs can be excited by femtosecond lasers that have ultrashort pulses with high peak intensities [23]. When the GNRs were excited with a fs laser, we observed a broad MPL spectrum in the visible region (Figure 3a). From the emission spectra we can see that the peaks are around 550-650 nm, which are expected to originate from the interband transitions near the X and L symmetry points of the first Brillouin zone of gold crystal [35,36,37]. The MPL spectra of GNRs excited by 1000 nm and 760 nm fs lasers were consistent with the results in some previously reported works [16, 35]. For the 3PL of GNRs excited by a 1000 nm fs laser, the emission wavelength band locates between the 1/3 and 1/2 of the excitation wavelength, namely from around 330 nm to 500 nm. For the 2PL of GNRs excited by 1000 nm and 760 nm, their emission wavelengths are longer than 500 nm and 380 nm, respectively [25,38]. The 3PL and 2PL were confirmed by examination of the dependence of luminescence intensity on the excitation power in three spectral regions (420-460 nm, 500-540 nm and 575-630 nm). The multi-photon luminescence from 1000GNRs excited by the 1000 nm fs laser consists of both three-photon (420-460 nm, 3PL) and two-photon (500-540 nm and 575-630 nm, 2PL) emissions [25]. The emission intensity (integrated from 420 to 460 nm) of 1000GNRs is linearly proportional to the cube of the 1000 nm-fs laser excitation power (Figure 3b), and the emission intensity (integrated from 500 to 540 nm and from 575 to 630 nm) is linearly proportional to the square of the 1000 nm-fs laser excitation power (Figure 3c), confirming the three-photon and two-photon excitation processes. As for 760GNRs excited by the 760 nm fs laser, the luminescence was a two-photon excitation process (Additional file 1: Figure S4).
Three-photon luminescence (3PL) and two-photon luminescence (2PL) from GNRs. (a) Emission spectra from GNRs excited by a 1000 nm and 760 nm fs laser. (b) Cube dependence of 3PL from 1000GNRs on the excitation power of the 1000 nm fs laser. (c) Square dependence of 2PL from 1000GNRs on the excitation power of the 1000 nm laser.
High contrast 3PL imaging for evaluating distribution of GNRs in tissues
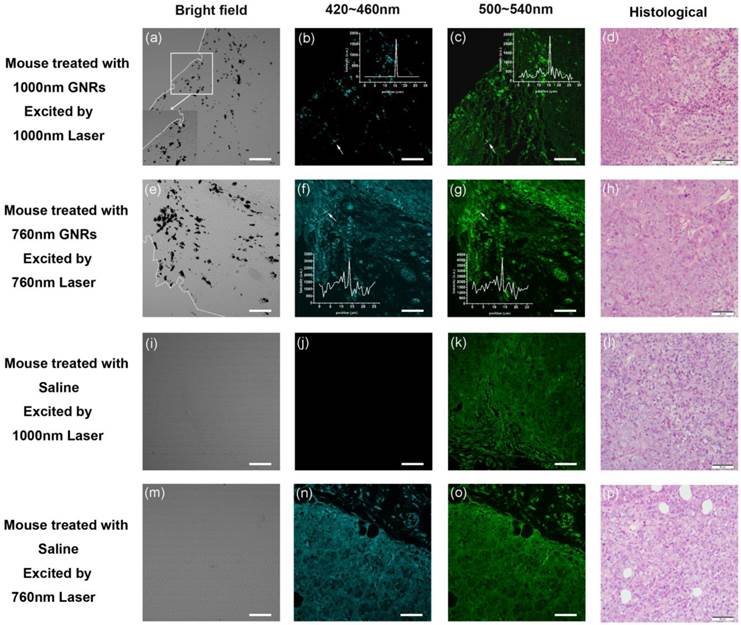
GNRs have been widely used in the nanomedicine field for diagnostic and therapeutic purposes [6, 39, 40]. For example, they can serve as carriers for the delivery of drugs and genetic materials, and they can also be used as a medicinal or diagnostic agent for the treatment of tumors [5, 6, 39-44]. However, the biodistribution behavior of GNRs still needs to be carefully assessed before practical clinical applications. Herein, 3PL imaging was utilized to evaluate the accumulation and distribution of intravenously injected GNRs in tissues of normal and tumor-bearing mice.
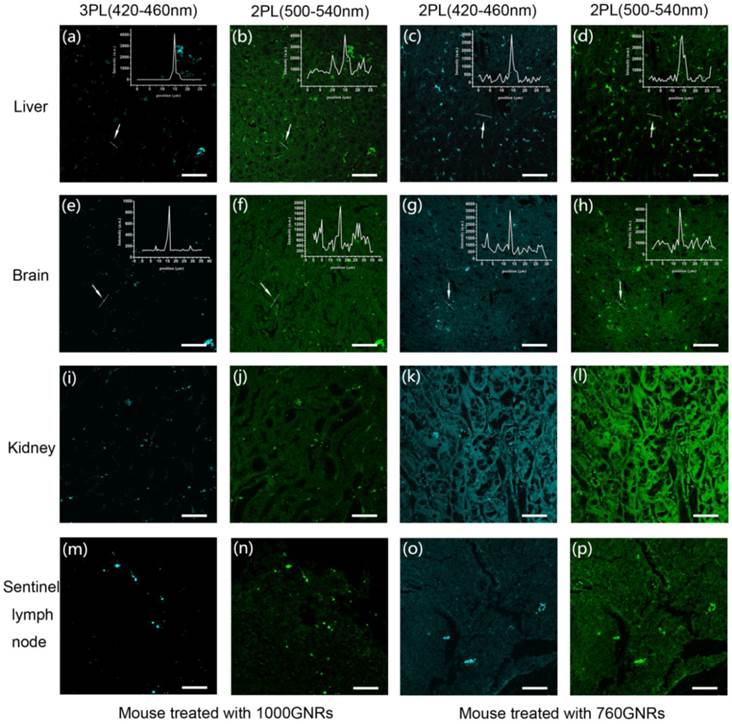
PEG-760GNRs and PEG-1000GNRs were intravenously injected into normal mice and tumor-bearing mice via the tail vein, respectively, and the two GNR samples were also intradermally injected into the left forepaw pad of the mice. All the control mice (normal and tumor-bearing mice) were treated with equal amount of saline (see Materials and Methods for details). For multi-photon excitation of PEG-1000GNRs and PEG-760GNRs in the tissues, 1000 nm and 760 nm fs laser beams were focused onto the sample by a 20 × objective (NA = 0.75), respectively. The MPL from GNRs and autofluorescence from tissues were simultaneously acquired by the same objective. Representative 3PL and 2PL images of liver, brain, kidney and sentinel lymph node (SLN) were shown in Figure 4, in which the GNRs appeared as bright dots in the sliced tissues. Both PEG-1000GNRs and PEG-760GNRs showed high accumulation in the mouse liver and kidney, which are part of the reticuloendothelial system (RES) responsible for the clearance of foreign materials by macrophage uptake [28]. In the brain tissues, GNRs were observed to be situated in and around the blood vessels, suggesting that they had been transported to the brain via blood circulation. GNRs also accumulated much in the SLN as a result of the lymph vessels transportation, and the mapping of the SLN is a key process in SLN biopsy for cancer staging and surgery [29,30]. Due to the fast processing of RES and blood circulation, the major organs were collected 0.5 h after the GNRs administration. As shown in the left two columns in Figure 4, under 1000 nm fs laser excitation, the autofluorescence from tissues was clearly observed in the 500-540 nm channel (corresponding to the 2PL channel) and hardly observed in the 420-460 nm channel (corresponding to the 3PL channel), whereas the 3PL (420-460 nm) from GNRs can be visualized with very high contrast. In addition, the line profiles of signal intensity in Figure 4a and 4e (insets) showed a relatively higher signal-to-background ratio of 3PL than that of 2PL (according to the line profiles in insets of Figure 4b and 4f). Under 760 nm fs laser excitation, 2PL images in the right two columns all exhibited obvious autofluorescence, reducing the contrast of 760GNRs distributed in tissues. One thing worth noting is that the excitation power of the 760 nm fs laser focused on the sample is only 2 mW. However, very strong autofluorescence from tissues was still excited. As for the control, no bright dots of GNRs were observed in images of the tissues explanted from mice injected with saline (Additional file 1: Figure S5).
3PL and 2PL images of tissue slices harvested from mice injected with PEG-1000GNRs and PEG-760GNRs. MPL from GNRs and autofluorescence from tissues were simultaneously acquired. The bright spots indicate the presence of GNRs. Scale bars: 50 μm.
For tumor-bearing mice, as shown in Figure 5 (top two rows), the bright MPL signals in tumor tissues indicated that substantial GNRs aggregated in the tumor. It illustrated that PEG-GNRs showed a high propensity to accumulate in the tumor via enhanced permeability and retention (EPR) effects. It is a time-dependent process and an appropriate long time (48 h) interaction is necessary for GNRs accumulation in tumors [44,45]. The black clusters in the bright field images confirmed that the PEG-GNRs accumulated into large aggregates within the tumor tissue post-injection and the white dotted lines indicated the boundaries of the tumor tissues (Figure 5a, 5e). The inset of Figure 5a is a magnification of the white box area and shows a clear boundary of tumor tissue (large and clear bright field images of tumor tissues are demonstrated in Additional file 1: Figure S6 and S7). Similarly, the accumulated 1000GNRs exhibited bright 3PL under 1000 nm fs laser excitation, and the autofluorescence from tissue is very weak (Figure 5b). However, autofluorescence (500-540 nm) of tumor tissue under 1000 nm fs excitation and autofluorescence (420-460 nm and 500-540 nm) of tumor tissue under 760 nm fs excitation, were very distinct (Figure 5c, 5f, 5g), which can be further confirmed by the line profiles of MPL signal intensity (inset of Figure 5c, 5f, 5g). The 3PL images provided evidence that GNRs had undergone an EPR directed aggregation process in the tumor tissue. The GNRs passively diffused into the tumor and were trapped within the extracellular space within the tissue. For the control, no bright dots were observed in images of the tumor tissues explanted from mice injected with saline. Histological images of tumor tissues harvested from the same area of tumor samples for imaging (tissue collected 48 h after GNRs injection) confirmed that there were no abnormalities or lesions of the tumor during the targeting of GNRs.
3PL and 2PL images of tumor tissue slices harvested from mice injected with PEG-1000GNRs, PEG-760GNRs and saline. The white dotted lines indicate the boundaries of the tumor tissues. Scale bars: 50 μm.
Although the accumulation of GNRs in tissues could be detected by TEM images, MPL imaging is an easier and quicker method. The high contrast of 3PL imaging is attributed to the low autofluorescence under 1000 nm fs excitation. First, the autofluorescence in the 420-460 nm channels is usually weaker than that in 500-540 nm channels, resulting in intrinsic lower background. However, we also notice that the intensity of two-photon autofluorescence (420-460 nm) under 760 nm fs excitation is indeed stronger than three-photon autofluorescence (420-460 nm) under 1000 nm fs excitation [46]. Thus, the lower autofluorescence background of 1000 nm excited 3PL imaging is attributed to shorter emission wavelength, as well as higher order of nonlinear optical effect. These indicate that 1000 nm fs excitation is advantageous for imaging with low autofluorescence. Although the 3PL of 1000GNRs is less than the 2PL of 1000GNRs under 1000 nm fs excitation, as well as the 2PL of 760GNRs under 760 nm fs excitation, the weaker autofluorescence can make 1000GNR-assisted 3PL microscopy under 1000 nm fs excitation have a higher signal to background ratio in tissue imaging, compared to 1000GNR-assisted 2PL microscopy under 1000 nm fs excitation, as well as 760GNR-assisted 2PL microscopy under 760 nm fs excitation. 3PL imaging of GNRs holds great potential in nanoparticle-assisted tumor diagnostic and therapeutic applications [39-44, 47-49].
In vivo 3PL imaging of GNRs in mouse ear blood vessels
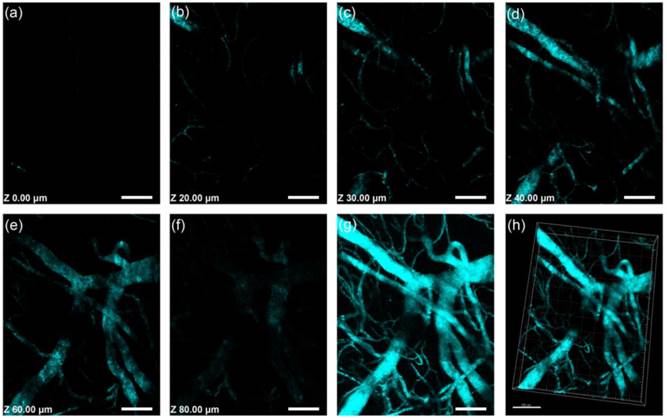
First, we used a mouse ear vessel model to examine the capability of GNRs in in vivo 3PL imaging (see Materials and Methods for details). Figure 6a-f showed 3PL images of 1000GNRs at various depths of mouse ear skin, under the fs excitation of 1000 nm. Aside from the small capillaries located throughout the dermis, major veins and arteries located deeper within the dermis could also be observed. Figure 6h showed a 3D reconstructed image of the blood vasculature network within a region of the ear dermis. In the control group, no obvious autofluorescence from ear vessels could be detected even when the excitation power was very high (Additional file 1: Figure S8). Combing the results from both control and experiment groups, we confirm that the MPL signals detected from the ear blood vessels of mice, which were treated with GNRs, were indeed from the GNRs flowing in the blood vessels. GNRs hold great promise to serve as an alternative contrast agent for intravital vasculature imaging.
Intravital 3PL images of PEG-1000GNR-stained mouse ear blood vessels. (a)-(f) Images at various vertical depths of mouse ear skin. (g) Stacked 3PL image from a depth of 0 μm to 80 μm. (h) 3D reconstructed image showing blood vessels in mouse ear skin. λex = 1000 nm. Signal collected within 420-460 nm. Scale bars: 100 μm.
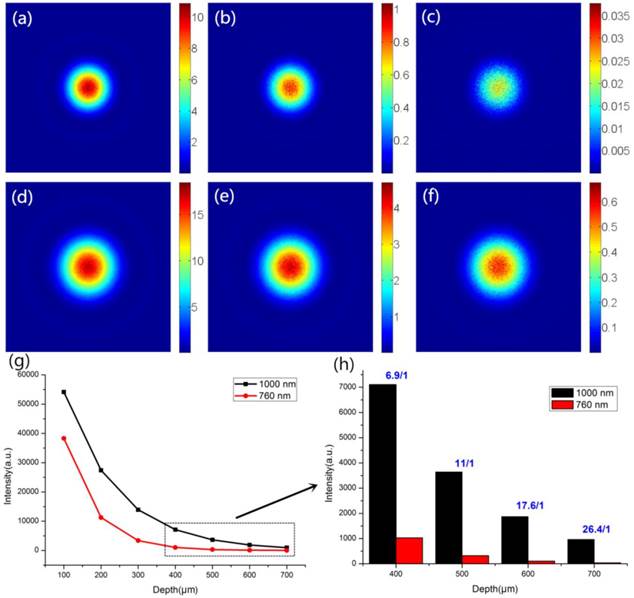
Simulation of the intensity distribution of focal spots of 1000 nm and 760 nm in biological tissue
Laser scanning microscopy (LSM), such as confocal microscopes and multi-photon microscopes, is the most common setup for imaging biological tissue [50]. To estimate the ability of LSM for deep in vivo imaging, vectorial electric field Monte Carlo (EMC) simulation, which can simulate the scattering and absorption of the electric field in biological tissue, was utilized to simulate the optical focal spots of 1000 nm and 760 nm at different depths of biological tissue [51]. The tissue simulated here was assumed to be an aqueous phantom containing 1-μm-diameter scattering beads at a concentration of 0.1044 spheres/micron [52]. 760 nm and 1000 nm laser wavelengths were selected for simulation as they were used in our nonlinear optical imaging experiment. Figure 7 shows the intensity distribution of focal spots at various depths. Initially, the size of the focal spot of the 1000 nm beam is larger than that of the 760 nm beam due to the diffraction effect. However, the scattering coefficient of the 760 nm light is larger than that of 1000 nm light. As the focal depth gets larger, the number of scattering events for the propagation of the 760 nm light increases rapidly, deteriorating the focal intensity in the biological tissues [53]. As shown in Figure 7, the intensity of the focal spot of 1000 nm light is always stronger than that of 760 nm light from depths of 100 μm to 700 μm, suggesting lower attenuation for longer-wavelength light in tissues. In particular, the intensity ratio of 1000 nm to 760 nm at a depth of 400 μm was around 6.9 and increased to about 26 at a depth of 700 μm (Figure 7h), indicating that the 1000 nm fs laser was more suitable than the 760 nm fs laser for optical excitation in deep multi-photon imaging.
Simulation of the intensity distribution of 760 nm and 1000 nm light in biological tissue. The simulated size of the focal spots of (a-c) 760 nm and (d-f) 1000 nm light at depths of 100 μm, 300 μm and 600 μm. (g) The simulated intensity distribution trend of focal spots at various depths of biological tissue. (h) The light intensity ratio of 1000 nm to 760 nm at depths of 400 μm, 500 μm, 600 μm and 700 μm.
3PL and 2PL imaging of GNRs in mouse brain blood vessels
In vivo imaging of mouse brain vessels was performed to demonstrate the capability of deeper tissue imaging in the "optical tissue window" by using 3PL of GNRs. The BALB/c mice (5 weeks old, male) were used for all the experiments. MPL signal intensity is higher when fs excitation wavelength is closer to the longitudinal LSPR of GNRs, given that the fs excitation power is set to be the same. Thus, two types of PEG-modified GNRs (PEG-1000GNRs and PEG-760GNRs) were used and compared for deep tissue MPL imaging, with excitation wavelengths at 1000 nm and 760 nm respectively.
We first performed a cranial window surgery on the mouse brain. To ensure an accurate comparison, 200 μl of a 1 × PBS mixed solution of PEG-760GNRs (100 μl, 25 nM) and PEG-1000GNRs (100 μl, 25 nM) were intravenously injected into the male BALB/c mice (see Materials and Methods for details). The absorption spectrum of the mixed PEG-GNRs showed two distinct LSPR peaks at 760 nm and 1000 nm, which were used to couple the fs excitation wavelengths of 760 nm and 1000 nm, respectively (Additional file 1: Figure S9). MPL process of the GNRs is plasmon-enhanced, and the brightness of the MPL reaches maximum when excited at the LSPR peak [16], thus bright MPL of GNRs can be excited by a fs laser at a low power when its wavelength is coupled with the longitudinal LSPR band of the GNRs. However, higher power is required to excite MPL of the GNRs when fs excitation wavelength is far away from the absorbance band of the GNRs. The MPL of 1000GNRs excited by 1000 nm fs laser and 760GNRs excited by 760 nm fs laser could be clearly observed at a low power (5 mW) in the imaging of intravital mice's ear blood vessels (Additional file 1: Figure S10). However, the MPL of 1000GNRs excited by 760 nm fs laser and 760GNRs excited by 1000 nm fs laser was not efficient even at very high excitation powers (25 mW). Therefore, MPL of the GNRs excited with fs excitation wavelength far away from their LSPR bands are very weak, and the MPL of a mixture of two kinds of GNRs excited by fs laser with two different wavelengths did not have any influence on each other. The surgery treated area of the brain was chosen for multi-photon imaging and comparison. For two-photon excitation of PEG-760GNRs and three-photon excitation of PEG-1000GNRs, 760 nm and 1000 nm fs lasers were adopted, respectively, and two filters within the 500-540 nm and 575-630 nm were used to extract the 2PL emission signals and a filter within 420-460 nm was used to collect 3PL emission signals from GNRs. The average powers required for MPL imaging at the surface of the brain was 2 mW for 760 nm excitation and 3 mW for 1000 nm excitation, and the powers were gradually increased when the imaging depths were increased, which can ensure that similar signal intensity and signal-to-noise ratio were achieved at different imaging depths.
We acquired a 429-μm-deep stack for 2PL of PEG-760GNRs and a 600-μm-deep stack for 3PL of PEG-1000GNRs, respectively, taken with a 1.5-μm-step depth. Figure 8j and 9j showed three-dimensional reconstructive MPL images of the mice brain vasculature imaged through a cranial window (for 3D reconstructed vessels network with 360° rotation, see Video 1 in Additional file 2). Z-sections (x-y frames) at various depths (see Video 2 in Additional file 3) showed that high contrast imaging of the major blood vessels and smaller capillaries in the pia mater could be visualized clearly with the help of 3PL of the GNRs. The maximum imaging depth of the PEG-1000GNRs with fs excitation at 1000 nm reached 600 μm below the brain surface, approximately 170 μm deeper than that of PEG-760GNRs with fs excitation at 760 nm. Microvasculature deep in the brain, beyond the pia matter (> 400 μm), could still be visualized with high resolution and contrast for the PEG-1000GNRs. At a depth of 600 μm, the small capillaries could still be detected with good contrast with the full power (~60 mW at the surface of the sample) of the excitation wavelength (Figure 9h). Comparing Figure 8j with Figure 9j, we could visualize more small capillaries in the three-dimensional reconstruction of 3PL of the PEG-1000GNRs with good resolution, while for PEG-760GNRs, these small capillaries could not be excited or detected (although they do exist). The reason why 3PL imaging of PEG-1000GNRs under 1000 nm fs excitation has a larger imaging depth can be found in our simulation results in Figure 7. Overall, considering the water absorption and tissue scattering, 1000 nm light has a better focusing effect than 760 nm light deep in the biological sample (e.g. the intensity ratio of 1000 nm to 760 nm at a depth of 600 μm was around 17.6). As MPL capability is closely related to the power density at the focal spot, 3PL of PEG-1000GNRs under 1000 nm fs excitation can have a higher efficiency than 2PL of PEG-760GNRs under 760 nm. In the control group, no obvious autofluorescence from brain vessels could be detected even when the excitation power was very high (Additional file 1: Figure S11).
Intravital 2PL images of PEG-760GNR-stained mouse brain blood vessels. (a)-(h) Images at various vertical depths of the mouse brain. (Inset, h) The line profile of the 2PL signal intensity from the point indicated by the white arrow illustrated that the 2PL signals could be detected with high contrast at a depth of 429 μm. (i) Stacked 2PL images from a depth of 0 μm to 429 μm. (j) 3D reconstructed image showing blood vessels in the mouse brain. λex = 760 nm. Signal collected within 500-540 nm and 575-630 nm. Scale bars: 100 μm.
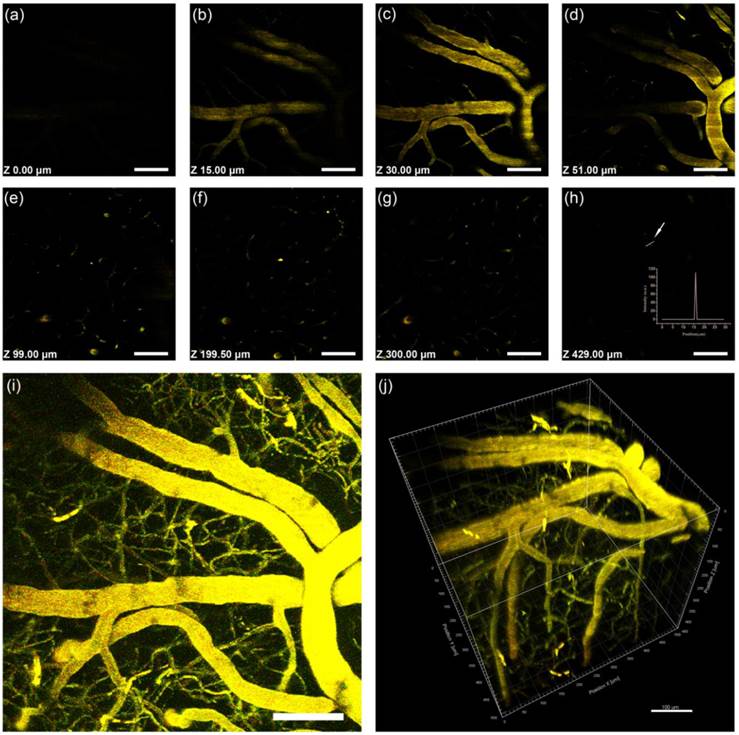
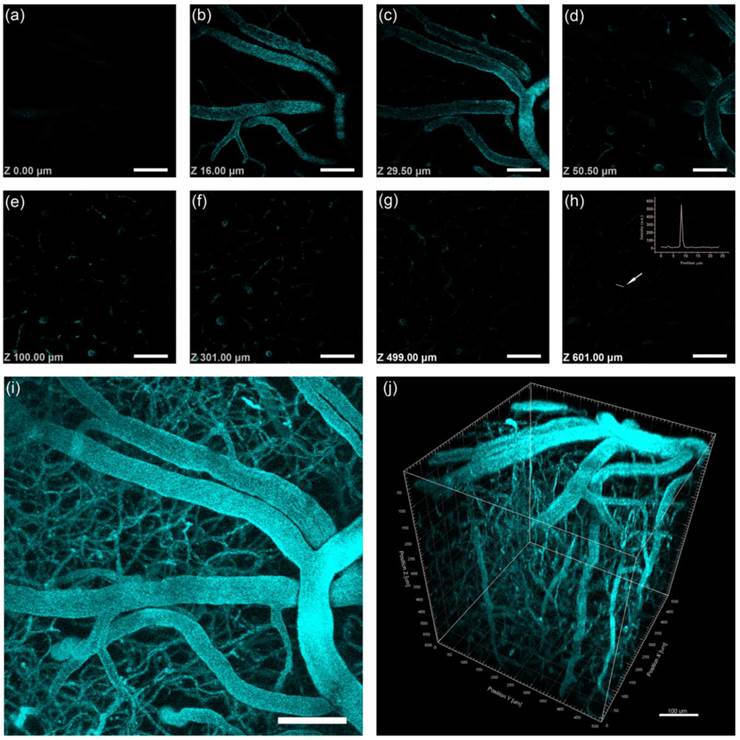
Intravital 3PL images of PEG-1000GNR-stained mouse brain blood vessels. (a)-(h) Images at various vertical depths of the mouse brain. (Inset, h) The line profile of the 3PL signal intensity from the point indicated by the white arrow illustrated that the 3PL signals could be detected with high contrast at a depth of 601 μm. (i) Stacked 3PL images from a depth of 0 μm to 601 μm. (j) 3D reconstructed image showing blood vessels in the mouse brain. λex = 1000 nm. Signal collected within 420-460 nm. Scale bars: 100 μm.
During the 3PL imaging of PEG-1000GNRs, 2PL signals from PEG-1000GNRs excited by 1000 nm (within the 500-540 nm and 575-630 nm ranges) were also collected. The maximum 2PL imaging depth of the PEG-1000GNRs reached 700 μm, 100 μm deeper than that of 3PL imaging of PEG-1000GNRs and 270 μm deeper than that of 2PL imaging of PEG-760GNRs excited by 760 nm (Additional file 1: Figure S12). However, under the fs excitation of the same wavelength, 3PL imaging has a higher spatial resolution. In our case, the spatial resolution of 3PL imaging of PEG-1000GNRs (excited by the 1000 fs laser) is 288 nm ( , 288 nm for λ = 1000 nm, NA = 1), which is higher than that of 2PL imaging of PEG-1000GNRs (
 , 353 nm for λ = 1000 nm, NA = 1, also excited by the 1000 fs laser) [54, 55]. In addition, owing to the significant improvement in the overall excitation localization, three-photon excitation can reduce the out-of-focus background and improving the signal-to-noise ratio by orders of magnitude when compared to two-photon excitation [24]. These results demonstrated that 3PL of GNRs excited by a long wavelength fs laser is advantageous for high contrast and deep in vivo imaging.
Conclusions
In summary, gold nanorods with low and high aspect ratios were synthesized by using two different protocols based on seed-mediated methods in aqueous solution, and their two-photon and three-photon luminescence were clearly observed and compared in in vitro and in vivo imaging. PEG modified CTAB/NaOL-GNRs exhibited high chemical stability under various pH values and negligible toxicity. In in vitro tissue imaging, three-photon luminescence imaging clearly illustrated the distribution of PEG-GNRs in major organs and tumor tissue with high contrast. Vectorial electric field Monte Carlo (EMC) was utilized to simulate the focal spots in the biological tissue, and the results confirmed that the longer wavelength laser was a more suitable optical source in deep multi-photon imaging. By tuning the longitudinal plasmonic bands of GNRs to absorb long-wavelength fs excitation in the optical tissue window, 3PL imaging of PEG-GNRs in in vivo imaging of mouse ear and brain vessels was achieved with a maximum depth of 600 μm. The main advantages of developing such wavelength-selective plasmon-enhanced MPL probes for biological applications are as follows: (i) the tunability of LSPR bands by controlling the aspect ratio of GNRs makes it easy for selecting an appropriate NIR wavelength to achieve deep in vivo imaging; (ii) PEG modified GNRs are more biocompatible for in vivo applications than some toxic nanomaterials; (iii) excited by a longer wavelength laser, which penetrates deep into tissue, 3PL imaging of GNRs holds great potential in nanoparticle-assisted tumor diagnostic and therapeutic applications in deep tissues.
Abbreviations
GNRs: gold nanorods; fs: femtosecond; MPL: multi-photon luminescence; 3PL: three-photon luminescence; 2PL: two-photon luminescence; PEG: polyethylene glycol; SPR: surface plasmon resonance; NIR: near-infrared; EPR: enhanced permeability and retention; TEM: transmission electron microscopy; H&E: hematoxylin- eosin.
Supplementary Material
Additional File 1Table S1 and Figures S1-S12.
Video 1.
Video 2.
Acknowledgements
This work was supported by National Basic Research Program of China (973 Program; 2013CB834704 and 2011CB503700), the National Natural Science Foundation of China (61275190, 61008052, 91233208 and 61107017), the Program of Zhejiang Leading Team of Science and Technology Innovation (2010R50007) and the Fundamental Research Funds for the Central Universities. Shaowei Wang is grateful to Ms. S. S. Liu for help with multi-photon laser scanning confocal microscopy and Mr. K. Wu for help with animal experiments.
Competing Interests
The authors have declared that no competing interest exists.
References
1. Hong G, Lee J C, Robinson J T. et al. Multifunctional in vivo vascular imaging using near-infrared II fluorescence. Nat Med. 2012;18:1841-1846
2. Lee J H, Huh Y M, Jun Y. et al. Artificially engineered magnetic nanoparticles for ultra-sensitive molecular imaging. Nat Med. 2007;13:95-99
3. Li N, Zhao P, Astruc D. Anisotropic Gold Nanoparticles: Synthesis, Properties, Applications, and Toxicity. Angew Chem Int Ed. 2014;53:1756-1789
4. Chen H, Shao L, Li Q. et al. Gold nanorods and their plasmonic properties. Chem Soc Rev. 2013;42:2679-2724
5. Huang X, Neretina S, El-Sayed M A. Gold nanorods: from synthesis and properties to biological and biomedical applications. Adv Mater. 2009;21:4880-4910
6. Zhang Z, Wang J, Chen C. Gold nanorods based platforms for light-mediated theranostics. Theranostics. 2013;3:223-238
7. Zijlstra P, Paulo P M R, Orrit M. Optical detection of single non-absorbing molecules using the surface plasmon resonance of a gold nanorod. Nat Nanotechnol. 2012;7:379-382
8. Mayer K M, Lee S, Liao H. et al. A label-free immunoassay based upon localized surface plasmon resonance of gold nanorods. ACS Nano. 2008;2:687-692
9. Qian J, Jiang L, Cai F. et al. Fluorescence-surface enhanced Raman scattering co-functionalized gold nanorods as near-infrared probes for purely optical in vivo imaging. Biomaterials. 2011;32:1601-1610
10. Zhang Y, Qian J, Wang D. et al. Multifunctional gold nanorods with ultrahigh stability and tunability for in vivo fluorescence imaging, SERS detection, and photodynamic therapy. Angew Chem Int Ed. 2013;52:1148-1151
11. Jang B, Park J Y, Tung C H. et al. Gold nanorod-photosensitizer complex for near-infrared fluorescence imaging and photodynamic/photothermal therapy in vivo. ACS Nano. 2011;5:1086-1094
12. Huang X, El-Sayed I H, Qian W. et al. Cancer cell imaging and photothermal therapy in the near-infrared region by using gold nanorods. J Am Chem Soc. 2006;128:2115-2120
13. Oldenburg A L, Hansen M N, Zweifel D A. et al. Plasmon-resonant gold nanorods as low backscattering albedo contrast agents for optical coherence tomography. Opt Express. 2006;14:6724-6738
14. Eghtedari M, Oraevsky A, Copland J A. et al. High sensitivity of in vivo detection of gold nanorods using a laser optoacoustic imaging system. Nano Lett. 2007;7:1914-1918
15. Vonnemann J, Beziere N, Böttcher C. et al. Polyglycerolsulfate Functionalized Gold Nanorods as Optoacoustic Signal Nanoamplifiers for In Vivo Bioimaging of Rheumatoid Arthritis. Theranostics. 2014;4:629-641
16. Wang H, Huff T B, Zweifel D A. et al. In vitro and in vivo two-photon luminescence imaging of single gold nanorods. Proc Natl Acad Sci U.S.A. 2005;102:15752-15756
17. Durr N J, Larson T, Smith D K. et al. Two-photon luminescence imaging of cancer cells using molecularly targeted gold nanorods. Nano Lett. 2007;7:941-945
18. Li J L, Gu M. Surface plasmonic gold nanorods for enhanced two-photon microscopic imaging and apoptosis induction of cancer cells. Biomaterials. 2010;31:9492-9498
19. Helmchen F, Denk W. Deep tissue two-photon microscopy. Nat Methods. 2005;2:932-940
20. Tozer G M, Ameer-Beg S M, Baker J. et al. Intravital imaging of tumour vascular networks using multi-photon fluorescence microscopy. Adv Drug Deliver Rev. 2005;57:135-152
21. Hoover E E, Squier J A. Advances in multiphoton microscopy technology. Nat Photonics. 2013;7:93-101
22. Xu C, Wise F W. Recent advances in fibre lasers for nonlinear microscopy. Nat Photonics. 2013;7:875-882
23. Kobat D, Durst M E, Nishimura N. et al. Deep tissue multiphoton microscopy using longer wavelength excitation. Opt Express. 2009;17:13354-13364
24. Horton N G, Wang K, Kobat D. et al. In vivo three-photon microscopy of subcortical structures within an intact mouse brain. Nat Photonics. 2013;7:205-209
25. Hu K W, Liu T M, Chung K Y. et al. Efficient near-IR hyperthermia and intense nonlinear optical imaging contrast on the gold nanorod-in-shell nanostructures. J Am Chem Soc. 2009;131:14186-14187
26. Nikoobakht B, El-Sayed M A. Preparation and growth mechanism of gold nanorods (NRs) using seed-mediated growth method. Chem Mater. 2003;15:1957-1962
27. Ye X, Zheng C, Chen J. et al. Using binary surfactant mixtures to simultaneously improve the dimensional tunability and monodispersity in the seeded growth of gold nanorods. Nano Lett. 2013;13:765-771
28. Khlebtsov N, Dykman L. Biodistribution and toxicity of engineered gold nanoparticles: a review of in vitro and in vivo studies. Chem Soc Rev. 2011;40:1647-1671
29. Kim S, Lim Y T, Soltesz E G. et al. Near-infrared fluorescent type II quantum dots for sentinel lymph node mapping. Nat Biotechnol. 2004;22:93-97
30. Kim T, Giuliano AE, Lyman GH. Lymphatic mapping and sentinel lymph node biopsy in early-stage breast carcinoma - A metaanalysis. Cancer. 2006;106:4-16
31. Huang G, Yang S, Yuan Y, Xing D. Combining x-ray and photoacoustics for in vivo tumor imaging with gold nanorods. Appl Phys Lett. 2011;99:123701
32. Tsai M F, Chang S H G, Cheng F Y. et al. Au Nanorod Design as Light-Absorber in the First and Second Biological Near-Infrared Windows for in vivo Photothermal Therapy. ACS Nano. 2013;7:5330-5342
33. Qiu Y, Liu Y, Wang L. et al. Surface chemistry and aspect ratio mediated cellular uptake of Au nanorods. Biomaterials. 2010;31:7606-7619
34. Niidome T, Yamagata M, Okamoto Y. et al. PEG-modified gold nanorods with a stealth character for in vivo applications. J Control Release. 2006;114:343-347
35. Imura K, Okamoto H. Properties of photoluminescence from single gold nanorods induced by near-field two-photon excitation. J Phys Chem C. 2009;113:11756-11759
36. Imura K, Nagahara T, Okamoto H. Near-field two-photon-induced photoluminescence from single gold nanorods and imaging of plasmon modes. J Phys Chem B. 2005;109:13214-13220
37. Wang D S, Hsu F Y, Lin C W. Surface plasmon effects on two photon luminescence of gold nanorods. Opt Express. 2009;17:11350-11359
38. He G S, Markowicz P P, Lin T C. et al. Observation of stimulated emission by direct three-photon excitation. Nature. 2002;415:767-770
39. Menon J U, Jadeja P, Tambe P. et al. Nanomaterials for photo-based diagnostic and therapeutic applications. Theranostics. 2013;3:152-166
40. Khlebtsov N, Bogatyrev V, Dykman L. et al. Analytical and theranostic applications of gold nanoparticles and multifunctional nanocomposites. Theranostics. 2013;3:167-180
41. Huang H C, Barua S, Kay D B. et al. Simultaneous enhancement of photothermal stability and gene delivery efficacy of gold nanorods using polyelectrolytes. ACS Nano. 2009;3:2941-2952
42. Alkilany A M, Thompson L B, Boulos S P. et al. Gold nanorods: their potential for photothermal therapeutics and drug delivery, tempered by the complexity of their biological interactions. Adv Drug Deliver Rev. 2012;64:190-199
43. Lukianova-Hleb E Y, Ren X, Sawant R R. et al. On-demand intracellular amplification of chemoradiation with cancer-specific plasmonic nanobubbles. Nature Med. 2014;20:778-784
44. Agarwal A, Mackey M A, El-Sayed M A, Bellamkonda R V. Remote triggered release of Doxorubicin in tumors by synergistic application of thermosensitive liposomes and gold nanorods. ACS Nano. 2011;5:4919-4926
45. Maeda H, Wu J, Sawa T, Matsumura Y, Hori K. Tumor vascular permeability and the EPR effect in macromolecular therapeutics: a review. J Controlled Release. 2000;65:271-284
46. Zipfel W R, Williams R M, Christie R. et al. Live tissue intrinsic emission microscopy using multiphoton-excited native fluorescence and second harmonic generation. Proc Natl Acad Sci U.S.A. 2003;100:7075-7080
47. Chen H, Zhang X, Dai S. et al. Multifunctional gold nanostar conjugates for tumor imaging and combined photothermal and chemo-therapy. Theranostics. 2013;3:633-649
48. Zhang Z, Wang L, Wang J. et al. Mesoporous Silica-Coated Gold Nanorods as a Light-Mediated Multifunctional Theranostic Platform for Cancer Treatment. Adv Mater. 2012;24:1418-1423
49. Zhang Z, Wang J, Nie X. et al. Near Infrared Laser Induced Targeted Cancer Therapy Using Thermo-Responsive Polymer Encapsulated Gold Nanorods. J Am Chem Soc. 2014;136:7317-7326
50. Pawley J. Handbook of biological confocal microscopy. Springer. 2010
51. Hayakawa C K, Potma E O, Venugopalan V. Electric field Monte Carlo simulations of focal field distributions produced by tightly focused laser beams in tissues. Biomed Opt Express. 2011;2:278-299
52. Cai F, Yu J, He S. Vectorial Electric Field Monte Caro Simulations for Focused Laser Beams (800 Nm-2220 Nm) in a Biological Sample. Prog Electromagn Res. 2013;142:667-681
53. Hayakawa C K, Venugopalan V, Krishnamachari V V. et al. Amplitude and phase of tightly focused laser beams in turbid media. Phys Rev Lett. 2009;103:043903
54. Hell S W, Malak H M, Gryczynski I. et al. Three-photon excitation in fluorescence microscopy. J Biomed Opt. 1996;1:71-74
55. Yu J H, Kwon S H, Petrášek Z. et al. High-resolution three-photon biomedical imaging using doped ZnS nanocrystals. Nat Mater. 2013;12:359-366
Author contact
![]() Corresponding authors: qianjunedu.cn and sailingse.
Corresponding authors: qianjunedu.cn and sailingse.