Impact Factor
- Issue 14; 2026
- Issue 13; 2026
- Issue 12; 2026
- Issue 11; 2026
- Issue 10; 2026
- Volume 16; 2026
- Advance Articles
- Past Issues
- Cover Images
- Cover Suggestion
- Index & Coverage
- Special Issues
Introduction
Materials and methods
Animal experiments
Results
Discussion
Conclusion
Supplementary Material
Acknowledgements
References
International Journal of Biological Sciences
International Journal of Medical Sciences
 Global reach, higher impact

Theranostics 2015; 5(4):378-398. doi:10.7150/thno.10084 This issue Cite
Research Paper
Small Sized EGFR1 and HER2 Specific Bifunctional Antibody for Targeted Cancer Therapy
Li Ding1, Caiping Tian1, Song Feng1, Guissi Fida1, Congying Zhang1, Yuxiang Ma1, Guanhua Ai1, Samuel Achilefu2, Yueqing Gu1 ![]()
1. Department of Biomedical Engineering, China Pharmaceutical University, School of Life Science and Technology, Nanjing, China.
2. Department of Radiology, Washington University, School of Medicine, St. Louis, USA.
Received 2014-7-10; Accepted 2015-1-5; Published 2015-1-21
Abstract

Targeting tumors using miniature antibodies is a novel and attractive therapeutic approach, as these biomolecules exhibit low immunogenicity, rapid clearance, and high targeting specificity. However, most of the small-sized antibodies in existence do not exhibit marked anti-tumor effects, which limit their use in targeted cancer immunotherapy. To overcome this difficulty in targeting multiple biomarkers by combination therapies, we designed a new bifunctional antibody, named MaAbNA (multivalent antibody comprised of nanobody and affibody moieties), capable of targeting EGFR1 and HER2, which are widely overexpressed in a variety of tumor types. The small-sized (29 kDa) MaAbNA, which was expressed in E.coli, consists of one anti-EGFR1 nanobody and two anti-HER2 affibodies, and possesses high affinity (KD) for EGFR1 (~4.1 nM) and HER2 (~4.7 nM). In order to enhance its anti-tumor activity, MaAbNA was conjugated with adriamycin (ADM) using a PEG2000 linker, forming a new complex anticancer drug, MaAbNA-PEG2000-ADM. MaAbNA exhibited high inhibitory effects on tumor cells over-expressing both EGFR1 and HER2, but displayed minimal cytotoxicity in cells expressing low levels of EGFR1 and HER2. Moreover, MaAbNA-PEG2000-ADM displayed increased tumoricidal effects than ADM or MaAbNA alone, as well exhibited greater antitumor efficacy than EGFR1 (Cetuximab) and HER2 (Herceptin) antibody drugs. The ability of MaAbNA to regulate expression of downstream oncogenes c-jun, c-fos, c-myc, as well as AEG-1 for therapeutic potential was evaluated by qPCR and western-blot analyses. The antitumor efficacy of MaAbNA and its derivative MaAbNA-PEG2000-ADM were validated in vivo, highlighting the potential for use of MaAbNA as a highly tumor-specific dual molecular imaging probe and targeted cancer therapeutic.
Keywords: EGFR1, HER2
Introduction
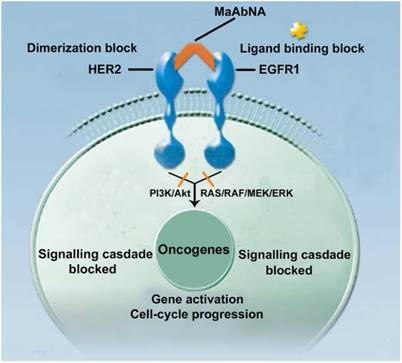
Epidermal growth factor receptors (EGFRs) are a sub-family of four transmembrane receptor tyrosine kinases (RTKs), EGFR1-4 (HER1-4). A variety of extracellular binding ligands, such as EGF, bind and activate HER1, HER3 and HER4, whereas HER2 is activated via dimerization with other EGFR family members [1- 3]. EGFR molecules can mediate cell proliferation as monomers, but their mitogenic effects can be exacerbated via inter-receptor interactions. EGFR1 and HER2 structures (Fig. 1) contain a tyrosine kinase domain that is responsible for activation of downstream signaling pathways, leading to expression of genes related to cell cycle progression, such as c-jun, c-fos and c-myc. But this activation (PI3K/Akt and Ras/Raf/MEK/ERK) could be inhibited to some extent by either anti-EGFR1 antibodies (Matuzumab, Cetuximab or anti-EGFR1 nanobody) [4, 5] or anti-HER2 antibodies (Herceptin) [6, 7]. Over-expression of EGFR1 and/or HER2 has been observed in a variety of human tumors, and these individual receptors are important diagnostic indicators as well as promising targets for anti-tumor therapy [8- 14]. However, accumulating evidence indicates that inhibiting the activity of individual EGFRs is insufficient to achieve complete clinical response. For example, the therapeutic effect of treating tumors with HER2 monoclonal antibody 4D5 can be reversed by EGF-related peptides [15]. The complex mechanisms of EGFR signaling pathway activation, both autonomous and dependent, have necessitated the development of combination therapies targeting multiple EGFRs to achieve synergetic effects compared to targeting a single receptor [16, 17]. Recently, the bifunctional small molecule tyrosine kinase inhibitor (TKI) Lapatinib, which targets both EGFR1 and HER2, was shown to exhibit enhanced therapeutic efficacy in HER2-positive breast cancers [18], although its deficiency in tumor targeting remains a limitation [19].
The mechanism of MaAbNA blocking the EGFR1 and HER2 signaling pathways.
In contrast to small molecule TKIs, which lack tumor targeting specificity, bivalent and bispecific antibodies exhibiting high tumor affinity are being widely applied in tumor targeting and therapeutics [20]. However, a limitation of targeted antibodies, which consist of two monoclonal antibodies (mAbs), is their large size, which results in subpar biodistribution profiles and limits their penetration into tumor tissue, yielding low tumor-specific accumulation [21]. To circumvent this issue, incomplete antibody fragments are being investigated as component forming bifunctional proteins which may exhibit enhanced tumor penetration. Baeuerle and others reported the design and construction of several bispecific antibodies suitable for tumor targeting through the use of single chain variable fragment (scFv) or CDR3 regions of mAbs [22- 24]. Unfortunately, due to the lack of functional units possessed by the complete antibody, most of these miniature bivalent antibodies do not exhibit appreciable biological activity with respect to tumor cell killing [25].
Affibody molecules, derived from staphylococcal protein A, are attractive surrogates for full-size antibodies in tumor targeting applications due to their small size and low immunogenicity [26, 27]. The single protein chain of affibodies facilitates direct fusion with various proteins. Similarly, nanobodies are small biomolecules derived from the heavy-chain of camelidae family [28, 29]. Although these antibodies are devoid of light chains, their antigen-binding ability is retained by integrating the functions of VH and VL into a single immunoglobulin (Ig) variable region termed VHH, or nanobody. Unlike mAbs, these fragments, which are composed of a single Ig fold and lacking Fc fragments, expose hydrophobic patches that bind to receptors without the need to undergo partial unfolding. Additionally, the lack of protease-sensitive peptide sequences confers higher in vivo stability to nanobodies compared to single-chain Fv fragments. Until now, in both preclinical and clinical settings, the immunogenicity of nanobodies has not exceeded predicted levels, presumably due to their high degree of homology with human VH domains [30]. Genes encoding these nanobodies can be easily engineered to obtain multivalent structures, and can be fused and recloned into other proteins. Henegouwen group constructed a biparatopic antibody by using two anti-EGFR1 nanobodies, which was effective at inhibiting tumor cell growth in a xenograft model of A431 cells in athymic mice [31]. Additionally, dimeric HER2-specific affibodies and EGFR1/HER2 bispecific antibodies, consisting of EGFR1 and/or HER2-specific affibodies, were designed by the Lennartsson [32] and Stahl [33] groups, respectively, and their in vitro efficacy were evaluated using SKOV-3 ovarian cancer cells. To date, all reported bivalent nanobodies and affibodies have exhibited impressive tumor targeting ability, and have uses in tumor imaging applications and as tumor ligands for drug delivery [34- 37]. However, no study was reported to fuse affibody with nanobody to form bispecific complex for enhanced targeting and antitumor efficacy, which motivate us to construct an affibody-nanobody complex for comprehensive tumor targeting and therapeutic efficacy investigation.
In this study, we constructed a novel bispecific antibody, MaAbNA, by fusing the ZHER2:4 affibody [38] to the anti-EGFR1 nanobody 7D12 [39]. Two affibody molecules were used in this construction since bivalent affibodies are more effective in tumor imaging and targeting than monovalent affibodies [40, 41]. In order to further enhance their tumoricidal activity, the widely used anticancer drug adriamycin (ADM) was conjugated to MaAbNA using a PEG2000 linker. The novel bispecific complex was intensively investigated both in vitro and in vivo.
Materials and methods
Materials
The pET22b vector and E.coli BL21 were purchased from Novagen and American Type Culture Collection (ATCC, USA), respectively. His GraviTrap, Sephadex G-15, Sephadex G-75, Sephadex G-100 and mono Q anion-exchange columns were obtained from GE Healthcare. The hydrophilic near-infrared dye ICG-Der-02 (MPA) (EX/EM: 760nm/830nm) was prepared in our laboratory [42]. Rhodamine B (MW 479.01, EX/EM: 540nm/625nm), 1-ethyl-3-(3-dimethylamino-propyl) carbodiimide hydrochloride (EDCI, MW 191.07), N-hydroxy-succinimide (NHS, MW 115.08), N, N-Diisopropylethylamine (DIPEA, MW 129.25) and NaBH3CN (MW 62.84) were purchased from Aladdin. RPMI-1640, 3-(4, 5-dimethylthialzol-a-yl)-2, 5-diphenyltetrazolium bromide (MTT), fetal bovine serum (FBS), penicillin, streptomycin, and trypsin-EDTA were purchased from commercial sources. Adriamycin hydrochloride (ADM.HCl, MW 579.99) was purchased from Beijing Huafenglianbo Technology Co. Ltd. The EGFR1 antibody (Cetuximab) was purchased from Merck, and the HER2 antibody (Herceptin) was from Roche. The 6×His-tag ELISA kit was from Abcam. NHS-PEG2000-ALD was from Xiamen Saigeluobang Biological Technology CO. Ltd. Trizol reagent, Reverse Transcription kit, and qPCR Master Mix were obtained from Promega. Restriction endonucleases (NcoI and BamHI) and T4 DNA Ligase were from Fermentas. The anti-EGFR1 nanobody 7D12 and ZHER2:4 affibody both tagging with 6×His were expressed and purified by Nanjing Jinsirui Biological Technology Co. Ltd. EGF with 6×His-tag was purchased from KeyGEN Biological Technology Co. Ltd. ON-TARGET plus siRNA SMART pools against EGFR1, HER2, c-myc, AEG-1 and negative control were from GE Dharmacon. Primers, BCA kits, all primary antibodies used in Western blots, and other reagents were from the Shanghai Chemical Reagent Company.
Design and construction of the bispecific antibody MaAbNA
Design and Expression of MaAbNA
The ZHER2:4 affibody and anti-EGFR1 nanobody 7D12 were used as the anti-HER2 antibody and the anti-EGFR1 antibody, respectively. The receptor-binding domains were linked with G4S (Fig. 2A), an established linker with high flexibility and hydrophobicity [43]. The gene encoding the sequence of NcoI-MaAbNA-BamHI was purchased from Nanjing Jinsirui biological technology company. NcoI and BamHI sites were designed for insertion into the pET22b vector, and the gene sequence of MaAbNA was optimized following the codon usage bias of E.coli BL21. The amino acid sequence of the MaAbNA is show in Fig. 2B.
Design (A) and amino sequence (B) of MaAbNA. C, construction and expression of MaAbNA. SDS-PAGE analysis of MaAbNA purified by His GraviTrap column (D), then by Sephadex G-75 (E). F, Western Blot analysis of MaAbNA using anti-His6 antibody. G, the absorption spectra of MaAbNA and MaAbNA-PEG2000-ADM. H, HPLC map of MaAbNA-PEG2000-ADM.
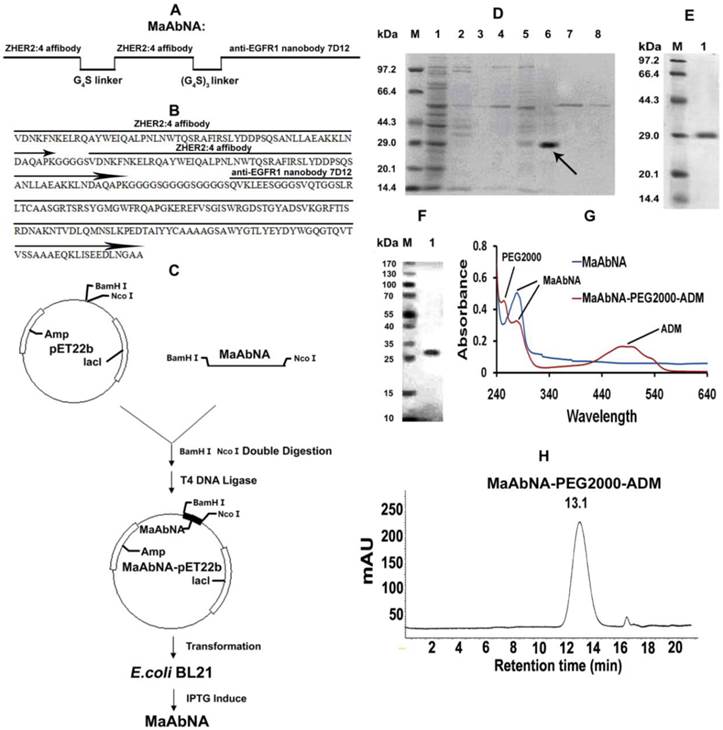
After double restriction enzyme digestion, the gene encoding the sequence of MaAbNA was inserted into the expression plasmid pET22b encoding the His6 tag (Fig. 2C). The recombinant plasmid was then transformed into E.coli strain BL21, where the MaAbNA molecule was expressed as a His6-tagged protein. Briefly, a pre-culture of E.coli cells was inoculated in fresh LB medium containing 100 mg/L ampicillin and grown in flasks at 37 °C with shaking until an attenuance (OD600) of ~0.6 was attained. Protein expression was induced by subsequent addition of IPTG to a final concentration of 1 mM. After culturing for a further 5 h at 37 °C, cells were harvested by centrifugation at 8000 rpm for 10 min at 4 °C. The cell pellet was resuspended in Lyse buffer (100 mM Tris/HCl, pH 8.0) and disrupted by sonication. After centrifugation at 13000 rpm for 30min at 4 °C, the pellet was dissolved in binding buffer (8 M urea, 10 mM Tris/HCl, pH 8.0), and purified on a His GraviTrap column. The Ni-column was washed with a concentration gradient of imidazole washing buffers (0, 5, 10, 20, 50, 100, 200, 500 mmol/L imidazole, 8 mol/L urea, Tris/HCl, pH 8.0) to obtain the optimal buffer solution. Incorrectly folded protein bounds to the column was eluted with imidazole buffer (100 mM imidazole, 8 M urea, Tris/HCl, pH 8.0), and refolding of the eluted protein was accomplished through dialysis with a concentration gradient of urea buffers (6, 4, 2, 1, 0.5, 0 mol/L urea, Tris/HCl, pH 8.0). Purification of the renatured protein was performed using Sephadex G-75 columns and protein was quantified using a BCA kit. To confirm the purity and correct molecular weight of the protein, the product was analyzed by SDS/PAGE, and the His6-tagged protein was identified by Western blot analysis using an Anti-His monoclonal antibody.
Synthesis of MaAbNA-PEG2000-ADM
MaAbNA-PEG2000-ADM was synthesized in a two-step process, as shown in Supplementary Material: Fig. S1. NHS-PEG2000-ALD (2 mg), ADM (0.6 mg) and DIPEA (0.2 mg) were first dissolved in 10 ml DMF, and the solution was stirred for 12 hours. After purification on a Sephadex G-15 column, the reaction product ADM-PEG2000-ALD was obtained. Second, ADM-PEG2000-ALD (0.2 mg), MaAbNA (15 mg) and NaBH3CN (0.01 mg) were dissolved in 10 ml PBS (pH 6.5), the solution was stirred at 4 °C for 24 hours, and the ALD (propionaldehyde) group was mostly conjugated to the N-terminal amino of MaAbNA through reductive amination. Using a mono Q anion-exchange column, we obtained the purified product MaAbNA-PEG2000-ADM, the purification of which was determined by HPLC using a Sephadex G100 column.
Fluorescence labeling
The constructed protein MaAbNA along with the His6-tagged anti-EGFR1 nanobody 7D12, ZHER2:4 affibody and EGF were labeled with the visible fluorescence dye RhodamineB for in vitro cell study. By controlling the feed ratios and reaction time, each antibody or ligand had a similar labeling efficiency with respect to Rhodamine B (molar ratio was approximately 1: 2), and at the same molar concentration, demonstrated equivalent fluorescence efficiency.
For in vivo study, the home built near infrared dye MPA (EX/EM: 760nm/830nm) was used to replace RhodamineB for the labeling to all the ligands with the similar method.
In vitro studies
Cell lines
Human tumor cell lines (MDA-MB-231, A549 and MCF-7) and the normal human pulmonary epithelial cell line L2 were all purchased from ATCC and used for evaluation of MaAbNA cytotoxicity and cell binding affinity. MDA-MB-231 and MCF-7 cells were cultured in DMEM medium supplemented with 10% FBS, 100 U/ml penicillin and 100 mg/ml streptomycin, while A549 and L2 were cultured in RPMI-1640 medium supplemented as for MDA-MB-231 and MCF-7. Cells were maintained at 37 °C in humidified atmosphere containing 5% CO2.
Primers
The mRNA sequences of the EGFR1 [GenBank: NM_005228.3 (human)], HER2 [GenBank: NM_004448.3 (human)], c-jun [GenBank: NM_002228.3 (human)], c-fos [GenBank: NM_005252.3 (human)], and the housekeeping gene GAPDH [GenBank: NM_002046.5 (human)] were obtained from the nucleotide database at the National Center for Biotechnology Information (NCBI) website. Oligonucleotide primers were designed using Primer 6 and are listed in Table 1.
Oligonucleotides sequence of 5' and 3' primers.
| Target gene | 5' primer | 3' primer |
|---|---|---|
| EGFR(Hum) | CTGTCCTGTGATGCTGTAA | ACTGCCTGGTCTCTGAAT |
| HER2(Hum) | TCTTGAATGTGGTGGTGTAA | TTGCTTGAACTGCTTGAAC |
| c-jun(Hum) | TGGTAGCAGATAAGTGTTGA | CGTGGAGAAGCCTAAGAC |
| c-fos(Hum) | GCTGACTGATACACTCCAA | CTGCTGATGCTCTTGACA |
EGFR1 and HER2 expression level analysis in tumor cells
Briefly A549, MDA-MB-231, and MCF-7 cells were cultured for 24 hours in 6-well dishes at 37 °C. Total RNA was extracted from cells using Trizol reagent, and was dissolved in diethylpyrocarbonate (DEPC)-treated water. Total RNA was adjusted to a final concentration of 0.1 µg/ml, and reverse transcribed using a Reverse Transcription kit. cDNA samples were mixed with primer pairs (EGFR1, HER2 or GAPDH) and a qPCR Master Mix were prepared for subsequent qPCR analyses using the StepOne plus Real-Time qPCR system. The results were analyzed by using StepOne Software.
To further investigate the EGFR1 and HER2 expression level in tumor cells, Western blot analysis was performed. After 48 hour incubation, A549, MDA-MB-231, and MCF-7 cells were lysed in lysis buffer. Proteins were separated on a 12% SDS-polyacrylamide gel and transferred onto polyvinylidene difluoride membranes (Millipore, USA). Membranes were blocked with 10% milk/Tris-buffered saline/0.1% Tween 20 for 2 h, incubated with primary antibodies (EGFR1, HER2 and β-actin), and incubated with fluorescent secondary antibody for 1 h. Fluorescence was visualized with enhanced chemiluminescence detection system (Amersham, UK), and protein expression was quantified by densitometry analysis using Quantity One software (BioRad).
In vitro tumor cells targeting
To assess the in vitro targeting ability, MaAbNA was compared to the positive control (anti-EGFR1 nanobody 7D12, ZHER2:4 affibody) in different tumor cell lines using immunofluorescence analysis. Cells were seeded in dishes suitable for confocal microscopy, incubated for 24 hours, then incubated for 2 hours in 1 mL of RhodamineB-MaAbNA, RhodamineB-anti-EGFR1 nanobody 7D12 or RhodamineB-ZHER2:4 affibody (5 μmol/L). After washing with PBS, cells were imaged by a laser confocal microscope (Olympus FV1100).
To elucidate the targeting mechanism of MaAbNA, blocking experiments with unlabeled (free) MaAbNA were conducted on all cell lines cultured at 37 °C for 24 hours. Free MaAbNA (0.25 mmol/L) was added to the cells 30min prior to incubation with RhodamineB-MaAbNA, RhodamineB-anti-EGFR1 nanobody 7D12 or RhodamineB-ZHER2:4 affibody for a further 2 hours. After washing with PBS, the cells were imaged using laser confocal microscopy.
Flow cytometric analysis of the FL2 mean fluorescent intensity (MFI) of the cells was used to perform a quantitative determination of the tumor targeting ability of MaAbNA.
Competition ELISA method for antibody affinity determination
The MaAbNA antibody (approximately 0.5 nmol/L) was combined with increasing concentrations of EGFR1 or HER2 antigen (0, 500, 1000, 1500 and 2000 nmol/L), and incubated at room temperature for 18 h to achieve equilibrium between free MaAbNA and MaAbNA-receptor complexes. Subsequently, reaction mixtures were added into wells precoated with antigen (over-dose), and incubated for 40 min to ensure that free MaAbNA was completely bound to the immobilized antigen. After removing the reaction mixture, wells were washed three times, and the amount of MaAbNA bound coated antigen were quantitated using a Standard ELISA (according to the instructions provided by the manufacturer of the 6×His-tag ELISA Kit). The affinity of MaAbNA binding to EGFR1 or HER2 was calculated using the following equation KD= lAilMi/(lM0-lMi) [44], where lAi is the molar concentration of antigen combined with MaAbNA, lMi is the molar concentration of free MaAbNA with a combined antigen concentration of lAi, and lM0 is the molar concentration of free MaAbNA in the absence of antigen, and (lM0-lMi) represents the molar concentration of the MaAbNA-antigen complex at equilibrium. Additionally, the affinity of MaAbNA-PEG2000-ADM binding to EGFR1 or HER2 was measured as the same protocol. As a reference, the affinity of the anti-EGFR1 nanobody 7D12 for EGFR1 and ZHER2:4 affibody binding to HER2 was also calculated using this method.
In vitro competitive inhibition of EGF binding
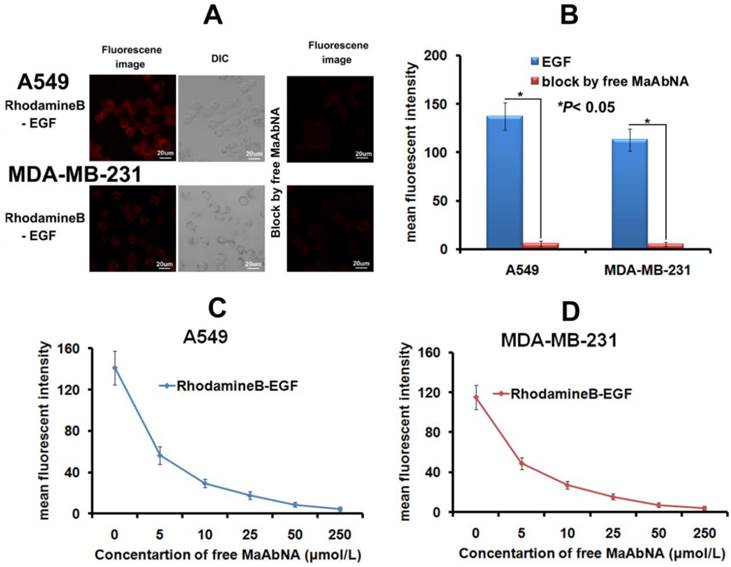
As the intrinsic ligand EGF will bind to EGFR1 of tumor cells and thus accelerate its proliferation, the EGF binding inhibition was carried out. RhodamineB-EGF (5 μmol/L) was added to tumor cells (A549 or MDA-MB-231) growing in confocal-compatible dishes, in the absence or presence of free MaAbNA (250 μmol/L). After 2 hour incubation at 37 °C, cells were washed with PBS and imaged by laser confocal microscopy.
To further verify the ability of MaAbNA to compete with EGF for binding to EGFR1, A549 and MDA-MB-231 tumor cells were trypsinized from 12-well cell culture plates, resuspended in PBS, and incubated with RhodamineB-EGF (5 μmol/L). Increasing concentrations of free MaAbNA (5, 10, 25, 50, 250 µmol/L) were added simultaneously to compete for EGFR1 binding, and the MFI of the cells was detected by flow cytometry.
In vitro therapeutic efficacy
Cell viability assays were carried out to evaluate the therapeutic efficacy of MaAbNA and MaAbNA-PEG2000-ADM in EGFR1-positive and/or HER2-positive cells, A549 and MDA-MB-231, as well as their toxicity toward an EGFR1-negative and HER2-negative cell line (MCF-7) and a non-tumorigenic cell line (L2). The commercial antibody drugs (anti-EGFR1 Cetuximab and anti-HER2 Herceptin) and the widely used anticancer drug adriamycin (ADM) were used as positive controls. After a 24 hour incubation, MaAbNA, MaAbNA-PEG2000-ADM, Cetuximab, Herceptin or increasing concentrations of ADM (0.1, 0.2, 0.4, 0.8, 1.6, and 3.2 μmol/L) were added to the cells growing in 96 well plates (n= 6), which were then incubated for 48 hours. MTT solution (20 mL; 5 mg/mL) was added to each well after incubation and the absorbance of the solution was measured at 490 nm using a multiwell plate reader.
To further investigate the EGFR1 and HER2 targeted antitumor efficacy of MaAbNA and MaAbNA-PEG2000-ADM, EGFR1- or HER2- knockdown A549 cells were constructed. The RNA interference assay was done according to the protocols provided by the manufacturer of the ON-TARGET plus siRNA SMART pools, and the knockdown effects were evaluated by western-blot analyses. At 24-hour post-transfection of EGFR1 or HER2 siRNA, A549 cells were seeded into 96-well plates. After 24-hour incubation, MaAbNA and MaAbNA-PEG2000-ADM (1 or 2 μmol/L) were added to the cells, which were then incubated for 48 hours to measure the inhibiting rate of cell proliferation.
Oncogene regulation analysis in tumor cells by qPCR
Briefly A549, MDA-MB-231, and MCF-7 cells were cultured for 24 hours in 6-well dishes at 37 °C in the presence of either MaAbNA or anti-EGFR1 nanobody 7D12 (3 μmol/L); non-treated cells were included as a negative control. Total RNA was extracted from cells and tumor tissues using Trizol reagent, and was dissolved in diethylpyrocarbonate (DEPC)-treated water. Total RNA was adjusted to a final concentration of 0.1 µg/ml, and reverse transcribed using a Reverse Transcription kit. cDNA samples were mixed with primer pairs (c-jun, c-fos or GAPDH) and a qPCR Master Mix were prepared for subsequent qPCR analyses using the StepOne plus Real-Time qPCR system. The results were analyzed by using StepOne Software.
Western blot analysis for signaling pathway proteins
A549 cells were seeded in 6-well plates and incubated for 48 hours with MaAbNA (3 μmol/L) or anti-EGFR1 nanobody 7D12 (3 μmol/L). Cells were divided into three groups respectively for detection of Akt S473 phosphorylation (pAkt), c-myc, and AEG-1. Cells transfected with c-myc or AEG-1 siRNA were used as controls for c-myc or AEG-1 expression; untreated cells were included as a control for each group. MDA-MB-231 cells treated with MaAbNA (3 μmol/L) or anti-EGFR1 nanobody 7D12 (3 μmol/L) were also used for detection of phosphorylated Akt (pAkt). After various treatments for the indicated periods of time, cells were lysed in lysis buffer; for analysis of phospho-protein expression, cells were lysed in lysis buffer supplemented with protease inhibitor cocktail, 1 mM sodium fluoride, and 1 mM sodium orthovanadate. Proteins were separated on a 12% SDS-polyacrylamide gel and transferred onto polyvinylidene difluoride membranes (Millipore, USA). Membranes were blocked with 10% milk/Tris-buffered saline/0.1% Tween 20 for 2 h, incubated with primary antibodies (pAkt, c-myc, AEG-1, Akt, or β-actin), and incubated with fluorescent secondary antibody for 1 h. Fluorescence was visualized with enhanced chemiluminescence detection system (Amersham, UK), and protein expression was quantified by densitometry analysis using Quantity One software (BioRad).
Animal experiments
Animal models
All animal experiments were carried out in compliance with the Animal Management Rules of the Ministry of Health of the People's Republic of China. A549, MDA-MB-231 and MCF-7 cells (5×10⁶) were injected subcutaneously into the upper axillary fossa of nude mice (Charles River Laboratories, n = 10 per group). When tumor size reached 0.3- 0.4 cm in diameter, mice were used for NIR imaging and treatment. For pharmacokinetic studies, Lewis rats were used (Charles River Laboratories, n= 10 per group).
Tumor targeting in tumor bearing mice
To investigate the dynamic distribution and tumor targeting ability of MaAbNA in nude mice, MPA-MaAbNA (50 nmol/kg) and the positive control (MPA-anti-EGFR1 nanobody 7D12, MPA-ZHER2:4 affibody) were injected intravenously and the fluorescence imaging was performed at various time points post-injection using an NIR imaging system. Free MaAbNA (2.5 μmol/kg) was used in blocking experiments. The tumor/normal tissue ratios (T/N ratio) were analyzed and compared using the analysis region of interests (ROI) function.
In vivo competitive inhibition of EGF tumor-binding
To investigate the ability of MaAbNA to compete with intrinsic EGF for binding to EGFR1 in vivo, A549 and MDA-MB-231 tumor-bearing mice were divided into 2 groups, one of which received MPA-EGF (50 nmol/kg) via intravenous injection while the other received MPA-EGF (50 nmol/kg) together with free MaAbNA (2.5 μmol/kg) in order to evaluate competitive blocking. Fluorescence imaging of the mice was performed using an NIR imaging system at various time points post-injection, and the tumor/normal tissue ratios (T/N ratio) were analyzed and compared using the analysis region of interests (ROI) function.
Pharmacokinetics of MaAbNA and MaAbNA-PEG2000-ADM
Lewis rats were divided into 2 groups (n= 6) for intravenous administration of MaAbNA and MaAbNA-PEG2000-ADM (300 nmol/kg). At 0.5, 2, 4, 6, 8, 12, 24, 48 and 72 hours post injection, blood samples were obtained from the fossa orbitalis, and serum concentrations of MaAbNA and MaAbNA-PEG2000-ADM were quantified using a 6×His-tag ELISA Kit. Serum drug levels were analyzed using WinNonlin pharmacokinetic software.
In vivo antitumor efficacy
A549 tumor-bearing mice were randomly divided into 6 groups (n= 6 per group), and treated every other day for 15 days via tail vein injection with 0.2mL of the following: (A) Saline (control group); (B) ADM (400 nmol/kg); (C) Cetuximab (400 nmol/kg); (D) Herceptin (400 nmol/kg) (E) MaAbNA (400 nmol/kg); and (F) MaAbNA-PEG2000-ADM (400 nmol/kg). The therapeutic efficacies and systematic toxicities of MaAbNA and MaAbNA-PEG2000-ADM were evaluated based on daily measurements of tumor volume and body weight. Upon completion of treatment (15 days), mice were sacrificed and the resected tumors were photographed, and along with hearts and kidneys to be processed from histologic examination.
Statistical analysis
Data were expressed as mean ± SD. Statistical analysis was conducted using a Students t-test, with statistical significance assigned to a P value lower than 0.05.
Results
Identification and characterization of MaAbNA
The experimental design and method of MaAbNA expression are shown in Figures 2A and 2C. MaAbNA was initially purified by His GraviTrap column, with lanes 1- 8 representing the proteins eluted from His GraviTrap column with wash buffer containing increasing concentrations of imidazole (0, 5, 10, 20, 50, 100, 200 and 500 mmol/L imidazole, respectively) (Fig. 2D). The intense signal in lane 6 with an approximate molecular weight of 29 kDa indicates that the target protein constitutes a large portion of the crude products. The crude product was further purified using a Sephadex G-75 column and subsequently analyzed by SDS-PAGE (Fig. 2E). Gray level difference analysis indicated purity of up to 90%. To further confirm the identification of the target protein, Western blot analysis using an anti-His antibody detected a protein with molecular weight of 29 kDa as our targeted protein (Fig. 2F). MaAbNA exhibited a single absorption peak at 280 nm (Fig. 2G). Using the BCA kit, we determined the protein concentration of the fermentation liquid to be 1.7 mg/L.
Identification and characterization of MaAbNA-PEG2000-ADM
Due to the presence of NaBH3CN, the ALD (propionaldehyde) group can be conjugated to the only primary amine groups in MaAbNA through reductive amination [45, 46]. In the peptide chain of MaAbNA, the only primary amines are the ε-amino groups in the side chain of lysine and N terminal α-amino groups. Additionally, the N terminal α-amino is more nucleophilic than the ε-amino at pH 6.5 [47], providing higher selectivity for the N terminal α-amino to be conjugated to ALD group through reductive amination. All of these had provided a feasible scheme to make an N terminal site-directed PEGylation of MaAbNA, with a final product of MaAbNA-PEG2000-ADM (Supplementary Material: Fig. S1).
As shown in Fig. 2G, MaAbNA-PEG2000-ADM exhibits three absorption peaks at 243 nm (PEG2000), 280 nm (MaAbNA), and 479 nm (ADM), confirming successful synthesis. In addition, a single peak of MaAbNA-PEG2000-ADM with a retention time of 13.1 min is observed by HPLC (Fig. 2H), reflecting a purity of greater than 90%. Moreover, MaAbNA-PEG2000-ADM was quantified using a 6×His-tag ELISA Kit, while the ADM component was quantitated based on an ADM (OD 479) standard curve, which together indicated a modified ADM/MaAbNA ratio of 1: 1.
Expression level of EGFR1 and HER2 in tumor cells
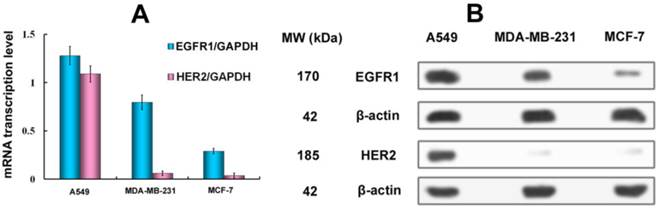
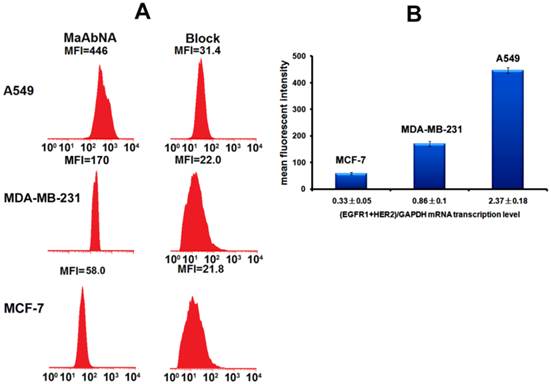
To assess the correlation between the combined EGFR1/HER2 expression and the targeting and therapeutic abilities of MaAbNA, mRNA transcription levels of EGFR1 and HER2 were investigated in tumor cell lines (A549, MDA-MB-231, MCF-7) (Fig. 3A). The expression of EGFR1 and HER2 in the different cancer cells decreased in the following order: A549 > MDA-MB-231> MCF-7; MDA-MB-231 and MCF-7 cells did not exhibit significant expression of HER2. Gene expression results were confirmed by Western blot analysis as shown in Fig. 3B.
A, qPCR analysis of EGFR1/GAPDH and HER2/GAPDH in A549, MDA-MB-231 and MCF-7 cancer cells. B, Western Blot analysis of EGFR1 and HER2 expressing in A549, MDA-MB-231 and MCF-7 cells. Data are given as mean±SD (n=5).
In vitro tumor-targeting ability
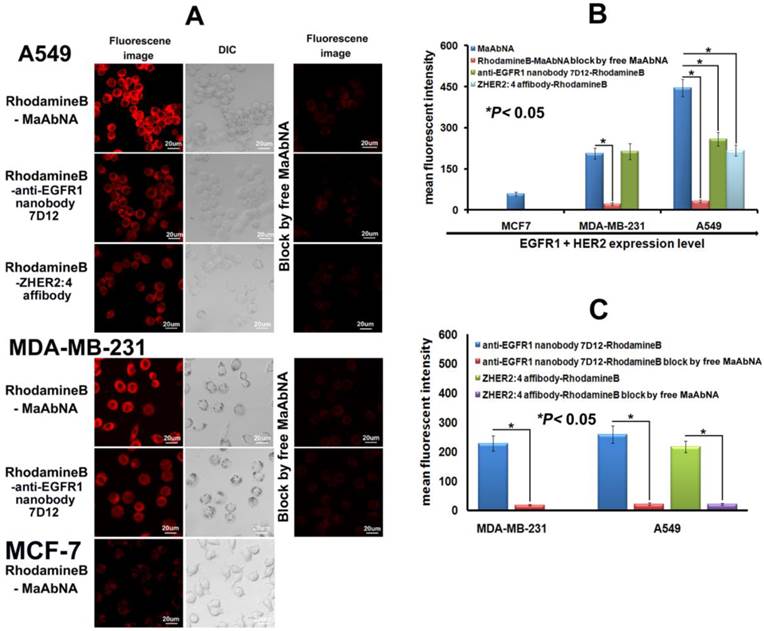
To investigate the specificity of the small-sized MaAbNA antibody for tumor cells over-expressing EGFR1 and/or HER2, we evaluated the binding of RhodamineB-MaAbNA to A549 cells (EGFR1 and HER2 positive), MDA-MB-231 cells (EGFR1 positive), and MCF-7 cells (EGFR1 and HER2 negative). RhodamineB-anti-EGFR1 nanobody 7D12 and RhodamineB-ZHER2:4 affibody were included as positive controls. The fluorescence intensity of A549 cells incubated with RhodamineB-MaAbNA was higher than that incubated with RhodamineB-anti-EGFR1 nanobody 7D12 or RhodamineB-ZHER2:4 affibody, but the fluorescence intensity of MDA-MB-231 cells incubated with RhodamineB-MaAbNA was similar to that incubated with RhodamineB-anti-EGFR1 nanobody 7D12 (Fig. 4A). The mean fluorescence was illustrated in Fig. 4B. Moreover, tumor cell lines overexpressing EGFR1 (A549 and MDA-MB-231) exhibited higher fluorescence intensity than MCF-7 cells (Figs. 4A, B). Pre-treatment with free MaAbNA inhibited the binding of RhodamineB-MaAbNA, RhodamineB-anti-EGFR1 nanobody 7D12 and RhodamineB-ZHER2:4 affibody (Fig. 4), confirming the binding of MaAbNA and its ability to selectively target cell membrane receptors (EGFR1 and HER2) on A549 and MDA-MB-231 cells..
A, laser confocal fluorescence microscopy images of cells (A549, MDA-MB-231 and MCF-7) incubated with different fluorescent probes (MaAbNA, anti-EGFR1 nanobody 7D12 and ZHER2:4 affibody), with or without blocking dose of free MaAbNA. B, mean fluorescence intensity of cells treated with the three fluorescent probes, while MaAbNA-treated cells were compared to the block. C, mean fluorescence intensity of cells treated with anti-EGFR1 nanobody 7D12 and ZHER2:4 affibody probes, compared to the blocking by free MaAbNA. Data are given as mean±SD (n=5). *P <0.05.
To quantitatively assess cellular binding of RhodamineB-MaAbNA to A549, MDA-MB-231, and MCF-7 cells, we performed flow cytometric analysis under blocking and non-blocking conditions (Fig. 5). The mean fluorescence intensity (MFI) in the tumor cells decreased in the following order: A549 (MFI: 446)> MDA-MB-231 (MFI: 170)> MCF-7 (MFI: 58), consistent with the receptor expression levels. In addition, A549 and MDA-MB-231 exhibited a much higher MFI than their blocked counterparts, indicating the specificity of MaAbNA to EGFR1 and HER2 receptors.
A, quantitative cellular binding (A549, MDA-MB-231 and MCF-7) of MaAbNA probe, additionally compared with the block. B, mean fluorescence intensity of MaAbNA-treated cells with different EGFR1+HER2 expression level. Data are given as mean±SD (n=5).
Quantitative affinity determination by competitive ELISA assay
To further confirm the specificity of MaAbNA to EGFR1 and HER2, the competitive ELISA was performed. As shown in Supplementary Material: Fig. S2A, increasing concentration of antigen (lAi) EGFR1 induced a linear increase in combined/free ratio of MaAbNA [(lM0- lMi)/lMi] (with R2 > 0.998), which ensured the accuracy of the affinity coefficient KD calculated as KD= lAilMi/(lM0-lMi). The affinity values of MaAbNA, MaAbNA-PEG2000-ADM and anti-EGFR1 nanobody 7D12 binding to EGFR1 are ~4.1, ~6.9 and ~3.5 nM, respectively. From Supplementary Material: Figure S2B, the affinity value of MaAbNA, MaAbNA-PEG2000-ADM and ZHER2:4 affibody binding to HER2 were calculated as ~4.7, ~7.2 and ~47.9 nM, respectively.
Each MaAbNA molecule is comprised of one anti-EGFR1 nanobody and two ZHER2:4 affibodies, and exhibits an EGFR1 binding affinity similar to anti-EGFR1 nanobody, indicating that the activity of the EGFR1 binding site was not significantly impaired by fusion of the proteins. In addition, the HER2 affinity of the bivalent ZHER2 domains of MaAbNA (~4.70 nM) showed a significant improvement compared to the monovalent affibody (~47.9 nM), which confirmed the correct design of double HER2 targeting domains. Furthermore, compared with free MaAbNA (~4.1 nM for EGFR1 and ~4.7 nM for HER2), MaAbNA-PEG2000-ADM exhibited similar affinity to EGFR1 (~6.9 nM) and HER2 (~7.2 nM), demonstrating that the activities of the EGFR1 and HER2 binding sites were not significantly impaired by the PEG2000-ADM conjugation.
It was noticed that the KDs of the anti-EGFR1 nanobody 7D12 and ZHER2:4 affibody (~3.5 and ~47.9 nM) were similar to that measured by Biacore (~2.3 and ~50 nM) [38, 48], confirming that competition ELISA is an effective method for evaluating antibody affinity [49, 50].
In vitro competitive inhibition of EGF binding
As the intrinsic EGF will bind to EGFR1 of tumor cells and thus accelerate its proliferation, the EGF binding inhibited by MaAbNA was performed here. As shown in Figures 6A and 6B, free MaAbNA effectively inhibited the cellular binding of RhodamineB-EGF. Furthermore, as the concentration of MaAbNA increased, the MFI of A549 and MDA-MB-231 treated simultaneously with RhodamineB-EGF gradually decreased (Figs. 6C, D), demonstrating a dose-dependent effect of MaAbNA on the competitive inhibition of standard ligand EGF binding to EGFR1, thus indicating the potential of MaAbNA to inhibit EGF-driven tumor cell proliferation.
A, the competitive inhibition of EGF cell-binding conducted by free MaAbNA, which was imaged by a laser confocal microscope. B, mean fluorescence intensity of cells, which was detected by a laser confocal microscope. The competitive inhibition of EGF-binding to A549 (C) and MDA-MB-231 (D) cells by increasing concentrations of free MaAbNA, which was detected by flow cytometer. Data are given as mean±SD (n=5). *P <0.05.
In vitro therapeutic efficacy
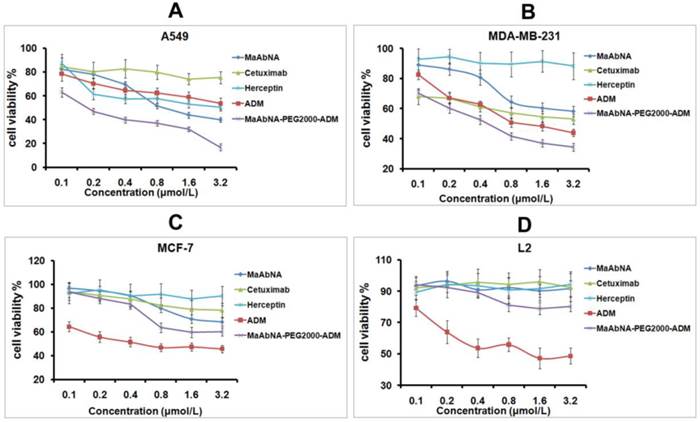
In order to evaluate the therapeutic efficacy of MaAbNA and MaAbNA-PEG2000-ADM as well as their potential cytotoxicity, cell viability assays were performed using tumor cell lines A549, MDA-MB-231, MCF-7, and normal cell line L2. As shown in Figs. 7A and B, MaAbNA and MaAbNA-PEG2000-ADM effectively reduced the viability of A549 (EGFR1- and HER2- positive) and MDA-MB-231 (EGFR1-positive, HER2-negative) cells. MaAbNA displayed a higher therapeutic efficacy in A549 cells than either the commercial antibody drugs (anti-EGFR1 Cetuximab and anti-HER2 Herceptin) or the commonly used anticancer drug ADM (Fig. 7A). Moreover, in MDA-MB-231 cells over-expressing only EGFR1, MaAbNA displayed a higher therapeutic efficacy than anti-HER2 Herceptin, but exhibited a similar efficacy to anti-EGFR1 Cetuximab (Fig. 7B). Importantly, MaAbNA-PEG2000-ADM exhibited higher therapeutic efficacy than ADM, MaAbNA and control antibodies in both A549 and MDA-MB-231 cells with high receptor expression (Figs. 7A, B), highlighting its improved antitumor activity versus MaAbNA alone, and further confirming a role for MaAbNA in delivering anti-tumor drugs to EGFR1 and/or HER2 positive tumor cells. MaAbNA and MaAbNA-PEG2000-ADM were minimally cytotoxic toward low receptor expression cells MCF-7 and L2 (Figs. 7C, D), so were Cetuximab and Herceptin, whereas ADM was highly cytotoxic to all cell lines (Fig. 7).
In vitro antitumor efficacy and cytotoxicity. Cell viability of A549 (A), MDA-MB-231 (B), MCF-7 (C), and L2 cells (D), incubated with MaAbNA, Cetuximab, Herceptin, ADM or MaAbNA-PEG2000-ADM. Data are given as mean±SD (n=5).
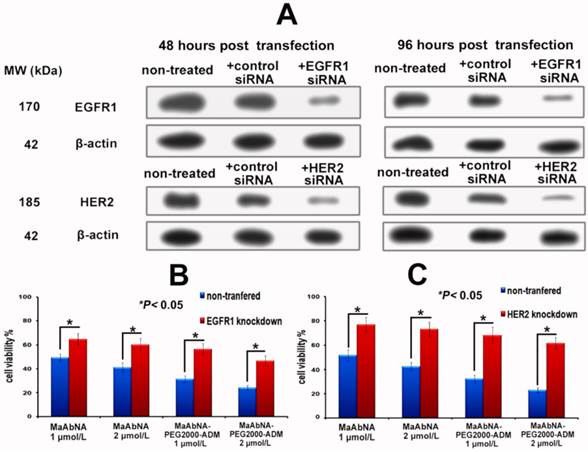
To further investigate the EGFR1 and HER2 targeted antitumor efficacy of MaAbNA and MaAbNA-PEG2000-ADM, EGFR1- or HER2- knockdown A549 cells were constructed. At 48-hour post-transfection of EGFR1- and HER2- siRNA, EGFR1 and HER2 expressions in A549 cells were effectively knocked down, and the knockdown effects were kept until 96-hour post-transfection, indicating that the gene knockdown cells were suitable to be applied in MTT assay (Fig. 8A). As shown in Figures 8C and 8D, MaAbNA and MaAbNA-PEG2000-ADM displayed significant higher inhibitory effects on non-transferred A549 than either EGFR1- or HER2- knockdown cells. The therapeutic efficacies of MaAbNA and its drug conjugated were consistent with the expression level of EGFR1 and HER2, demonstrating their specificities to both of the receptors.
A, EGFR1 and HER2 expression in A549 cells at 48 and 96-hour post-transfection of EGFR1 or HER2 siRNA. In vitro inhibiting ability of MaAbNA and MaAbNA-PEG2000-ADM on EGFR1 (B) and HER2 (C) knockdown A549 cells. Data are given as mean±SD (n=5). *P <0.05.
Taken together, these results suggest that MaAbNA antibody and MaAbNA-PEG2000-ADM are promising anticancer drugs for EGFR1- and/or HER2- overexpressing tumors.
Down-regulation of oncogenes in cells conducted by MaAbNA
C-jun and c-fos genes are regulated downstream of EGFR1 and HER2 [51, 52]. The dimer of c-fos and c-jun comprises the AP-1 early response transcription factor, which is closely related to the invasive capability of tumor cells. Down-regulation of c-jun and c-fos are important indexes of tumor therapy, therefore alterations in c-jun and c-fos transcription provides evidence for the binding function of MaAbNA to EGFR1 and HER2, and reduced expression of these genes will result in inhibition of downstream signaling, ultimately arresting tumor cell growth. To investigate the regulatory role of MaAbNA on tumor cell progression, c-jun, and c-fos mRNA transcription levels were assessed before and after MaAbNA treatment, or after treatment with anti-EGFR1 nanobody 7D12 as a positive control (Fig. 9). Transcription of c-jun and c-fos were significantly down-regulated after incubation of A549 cells with MaAbNA (P< 0.05). Changes in gene expression were also observed in A549 cells treated with the anti-EGFR1 nanobody 7D12, but to a much lesser extent than in MaAbNA-treated cells. This is presumably due to activation of downstream signal transduction pathways not only by binding of EGF to EGFR1 but also by autophosphorylation of heterodimeric EGFR1/HER2 receptors in HER2-overexpressing tumors [53]. For A549 cells, which overexpress both EGFR1 and HER2, MaAbNA is predicted to have dual-receptor targeting ability and thus exhibit a stronger inhibitory effect on oncogenic signaling than the monovalent anti-EGFR1 nanobody 7D12. As expected, expression of both c-fos and c-jun were similarly down-regulated in MDA-MB-231 cells treated with MaAbNA compared to anti-EGFR1 nanobody 7D12 treatment; however, the degree of down-regulation was lower than that observed in A549. In A549 cells treated with MaAbNA, c-fos and c-jun expression decreased by 73% and 72%, respectively, while in MDA-MB-231 c-fos and c-jun expression decreased by only 50% and 55%, respectively. In comparison, gene expression decreases were 32% and 29% (A549 cells) and 53% and 62% (MDA-MB-231 cells) following nanobody treatment, and no obvious down-regulation of c-fos or c-jun was observed in MCF-7 cells.
Down-regulation of c-jun and c-fos mRNA transcription level in A549, MDA-MB-231 and MCF-7 cells treated with MaAbNA and anti-EGFR1 nanobody 7D12. Data are given as mean±SD (n=5). *P <0.05.

Regulation of signal transduction pathways by MaAbNA in A549 cells
Expression of the AEG-1 oncogene is closely related to tumor migration and invasion [54, 55], and is mediated by Ha-ras and the associated signaling pathway shown in Fig. 10A. Ha-ras activates the PI3K signaling cascade, resulting in increased c-myc expression and binding of Myc-Max to the AEG-1 promoter, augmenting AEG-1 expression. AEG-1 activates the NF-κB pathway, which regulates expression of genes involved in migration and invasion and thus plays a crucial role in Ha-ras-mediated tumor progression [56]. C-myc is a proto-oncogene which is frequently found to be up-regulated in many types of cancers. Myc overexpression stimulates gene amplification, presumably through DNA over-replication [57].
A, signal transduction pathways involved in Ha-ras-mediated AEG-1 induction. B, phosphorylation of Akt S473, expression of c-myc and AEG-1 regulated by MaAbNA and anti-EGFR1 nanobody 7D12 in A549 (B) and MDA-MB-231 (C) cells.
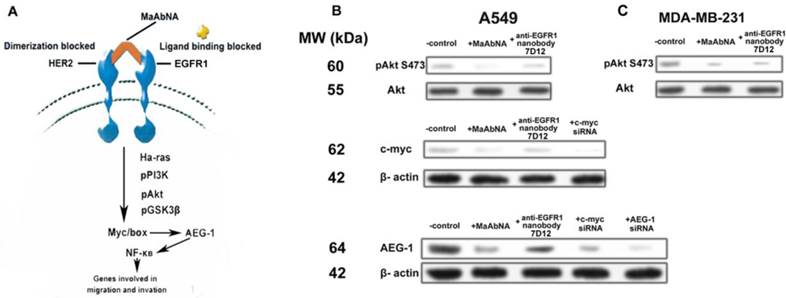
Introduction of either c-myc or AEG-1 siRNA similarly and effectively down-regulated AEG-1 expression, suggesting interplay between c-myc and AEG-1 (Fig. 10B). Comparing with the non-treated control, treatment of A549 cells (EGFR1- and HER2- overexpressing) with MaAbNA effectively inhibited c-myc and AEG-1 expression by decreasing Akt (S473) phosphorylation, while the anti-EGFR nanobody 7D12 did not inhibit c-myc or AEG-1 oncogenes significantly (Fig. 10B), suggesting that MaAbNA could limit cancer cell proliferation, migration and invasion through blocking of the Ha-ras-Akt signal pathway downstream of EGFR1 and HER2 [58]. Treatment with MaAbNA or the nanobody induced similar inhibition of Akt (S473) phosphorylation in MDA-MB-231 cells (EGFR1-negative, HER2-positive) (Fig. 10C), which further confirmed the synergistic effect of EGFR1 and HER2.
In vivo dynamic distribution and tumor-targeting ability of MaAbNA
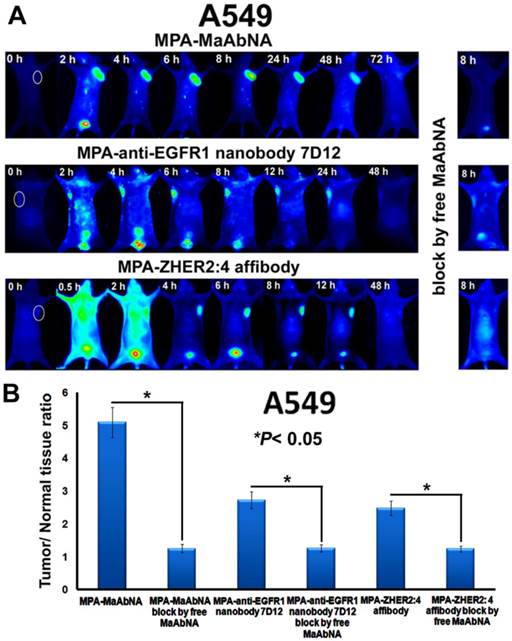
The in vivo dynamics of MPA-MaAbNA biodistribution is shown in Figures 11 and 12. MPA-MaAbNA was quickly distributed throughout the body within approximately 30 minutes after injection, was excreted by the kidneys by 4-hour post-injection, and was largely cleared from the body within 24 hours. In order to compare the tumor-targeting ability of MPA-MaAbNA to that of the MPA-anti-EGFR1 nanobody 7D12 and the MPA-ZHER2:4 affibody, nude mice bearing tumor xenografts of A549, MDA-MB-231, or MCF-7 cells were used. Fluorescence images obtained at different time points after administration of MPA-MaAbNA, MPA-anti-EGFR1 nanobody 7D12 and MPA-ZHER2:4 affibody in A549 tumor-bearing mice are shown in Fig. 11A. Within 2 hours after injection of the three probes, A549 xenografts were identifiable, and the intense signal at tumor sites was maintained up to 24 hours after injection, after which signal intensity gradually decreased. By 72 hours post-injection, the fluorescent probes had cleared from the body. Tumors in mice receiving MPA-MaAbNA displayed higher fluorescence intensity than tumors in mice injected with the MPA-anti-EGFR1 nanobody 7D12 or MPA-ZHER2:4 affibody, with maximal tumor/normal tissue contrast ratios of 5.09, 2.72 and 2.48, respectively (Fig. 11B). As expected, the administration of free MaAbNA antibody effectively blocked the tumor targeting of all the three probes (Fig. 11), confirming its affinity to EGFR1 and HER2 in vivo.
A, Dynamics and tumor-targeting ability of MaAbNA, anti-EGFR1 nanobody 7D12 and ZHER2:4 affibody in A549-bearing nude mice, with or without blocking dose of free MaAbNA. B, maximal tumor/normal tissue ratio {T/N ratio= [tumor signal background signal]/ [normal signal (muscle) background signal] × 100%} calculated from the ROIs at 8-hour post-injection of different probes into A549 tumor-bearing mice with or without blocking dose of free MaAbNA. Data are given as mean±SD (n=5). *P <0.05.
Dynamics and tumor-targeting ability of MaAbNA and anti-EGFR1 nanobody 7D12 in MDA-MB-231-bearing (A), MCF-7-bearing (B) and normal (C) nude mice, with or without blocking dose of free MaAbNA. D, maximal tumor/normal tissue ratio calculated from the ROIs at 8-hour post-injection of different probes into MDA-MB-231 and MCF-7 tumor-bearing mice with or without blocking dose of free MaAbNA. Data are given as mean±SD (n=5). *P <0.05.
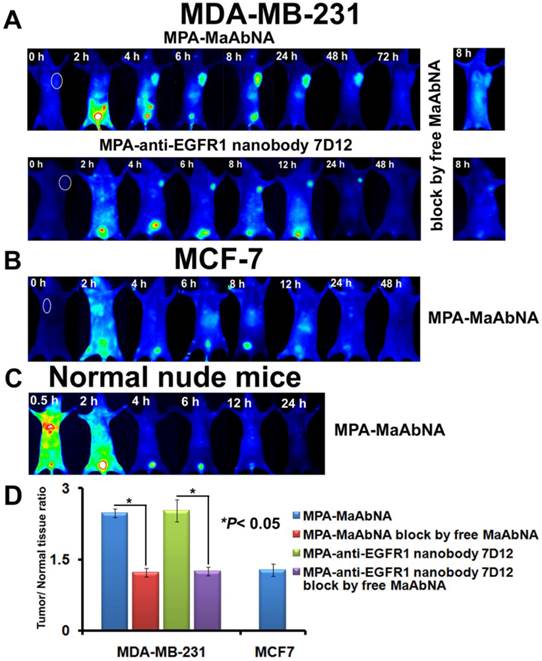
To further explore the specificity of MPA-MaAbNA, xenografts of MDA-MB-231 and MCF-7 tumor cells were studied. Similar tumor-specific fluorescence signals were detected in mice injected with MPA-MaAbNA relative to the MPA-anti-EGFR1 nanobody 7D12 treated group (Fig. 12A), with maximal T/N ratios of 2.48 and 2.53, respectively (Fig. 12D). Free MaAbNA inhibited the binding of both MPA-MaAbNA and MPA-anti-EGFR1 nanobody 7D12 to tumors (Figs. 12A, D). In contrast, in MCF-7-derived tumors MPA-MaAbNA showed no significant targeting ability (Figures 12B and 12D), consistent with the EGFR1-negative/HER2-negative status of MCF-7 cells.
The plots of the maximal T/N ratios for all groups of tumor-bearing mice indicated that MPA-MaAbNA showed the best targeting to A549 tumors, and the nude mice bearing A549 tumors treated with MPA-MaAbNA had a higher T/N ratio than those treated with other univalent-specific probes (Figs. 11B and 12D).
In vivo competitive inhibition of EGF tumor-binding
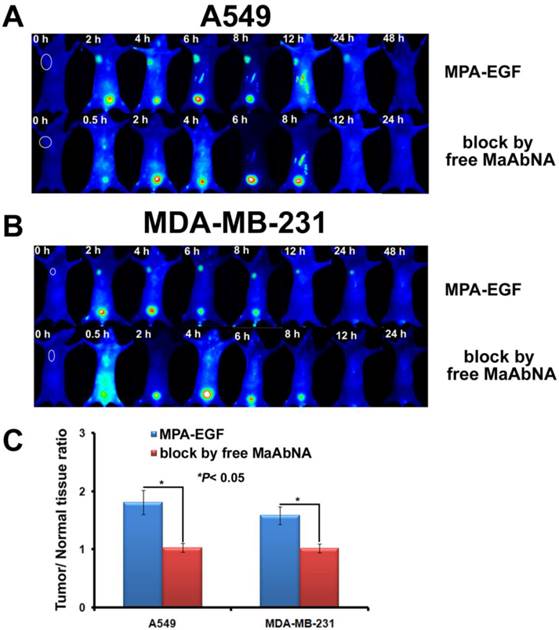
As shown in Fig. 13, free MaAbNA effectively inhibited the in vivo tumor-binding of MPA-EGF, which indicated the potential ability of MaAbNA to inhibit the EGF-driven tumor progression in vivo.
The tumor-binding block of EGF in A549-bearing (A) and MDA-MB-231-bearing (B) nude mice, which was conducted by free MaAbNA. C, maximal tumor/normal tissue ratio calculated from the ROIs at 8-hour post-injection of MPA-EGF into different tumor-bearing mice with or without blocking dose of free MaAbNA. Data are given as mean±SD (n=5). *P <0.05.
Pharmacokinetics of MaAbNA and MaAbNA-PEG2000-ADM
The serum concentrations of MaAbNA and MaAbNA-PEG2000-ADM at different post-injection time are shown in Supplementary Material: Fig. S3. Using WinNonlin software analysis, in accordance with the two-compartment model, the pharmacokinetic parameters of the two drugs in rats are listed in Table 2.
Pharmacokinetic properties estimated by two-compartmental model analysis following intravenous bolus injection of MaAbNA and MaAbNA-PEG2000-ADM to rats.
| PK properties | MaAbNA | MaAbNA-PEG2000-ADM |
|---|---|---|
| AUC0-∞ (nmol*h/L) | 1044±327 | 3568±722** |
| t1/2α (h) | 0.54±0.09 | 1.43±0.17* |
| t1/2β (h) | 6.95±2.14 | 19.46±2.31** |
| CL (L/h) | 0.061±0.002 | 0.018±0.01** |
| MRT (h) | 6.9±1.66 | 21.2±2.48** |
| Vdss (L) | 0.45±0.03 | 0.38±0.03* |
Data are expressed as mean ± SD (n = 6). *P < 0.05, **P < 0.01, MaAbNA vs MaAbNA-PEG2000-ADM. Abbreviations: AUC, area under the curve; CL, clearance; MRT, mean residence time; Vdss, steady state volume of distribution.
As indicated in Table 2, the plasma concentrations of both MaAbNA and MaAbNA-PEG2000-ADM showed an exponential decline after intravenous administration. The elimination of MaAbNA-PEG2000-ADM occurred more slowly than that of non-modified MaAbNA with a half-life of 19.46±2.31 h, approximately 2.8 fold longer than half-life of MaAbNA (6.9±1.66 h). In contrast to MaAbNA, MaAbNA-PEG2000-ADM showed a significant decrease in clearance (CL) and a marked increase in the area under the plasma concentration-time curve (AUC), which suggests that MaAbNA-PEG2000-ADM is retained longer in the blood circulation than MaAbNA. Taken together, these results demonstrate that PEGylation of MaAbNA improves its half-life in circulation, and promotes its intravascular retention, thus decreasing the required administration frequency.
In vivo antitumor efficacy of MaAbNA
In vivo antitumor efficacy of MaAbNA and MaAbNA-PEG2000-ADM were evaluated in A549-bearing nude mice by measuring the tumor growth of the mice. As shown in Fig. 14A and B, tumors in saline-treated mice grew faster than those of the ADM, Cetuximab, Herceptin, MaAbNA-PEG2000-ADM or MaAbNA-treated mice. Administration of MaAbNA reduced the tumor volume by 58% after 15 days of treatment. This decrease was higher than that in ADM (~47%) and Cetuximab (~36%)-treated mice, but was lower than that observed in Herceptin-treated mice (~70% decrease). Treatment with MaAbNA-PEG2000-ADM reduced tumor volume by 78%, the greatest extent of tumor reduction in any of the groups. Moreover, the body weights of mice in different groups gradually increased within the treatment period, indicating no apparent physical toxicity, but a decrease of body weight (1.2 g) in the ADM-treated group was observed after 13 days treatment (Fig. 14C). The 15-day survival rates of mice in the MaAbNA, MaAbNA-PEG2000-ADM and Herceptin-treated groups were 100%, and that in Cetuximab and ADM groups were 83.3% and 66.7% respectively, whereas the survival rate of the saline group was drastically decreased to 33.3% (Fig. 14D). Histological analysis of tumor tissues was used to further confirm the anti-cancer efficacy of MaAbNA (Fig. 14E). Compared to saline-treated control, significant amounts of necrotic tissue were observed in tumors of all the other groups. Furthermore, the extent of tumor necrosis in the MaAbNA-PEG2000-ADM group was higher than that in tumors treated with any other drugs, which was consistent with our in vitro cytotoxicity results in A549 cells over-expressing EGFR1 and HER2.
Therapeutic efficacy of MaAbNA in A549 tumor-bearing nude mice. A, tumor volumes of mice under different treatments (saline, MaAbNA, Cetuximab, Herceptin, ADM and MaAbNA-ADM, n= 6/group). B, tumors separated from mice under different treatments. C, body weights of mice in different groups. D, the 15-day survival rates of mice after administration of different drugs. E, the tissue slices of tumors in different groups. The tissue slices of hearts (F) and kidneys (G) in saline, MaAbNA-PEG2000-ADM and ADM-treated groups. Data are given as mean±SD (n=5). *P <0.05.
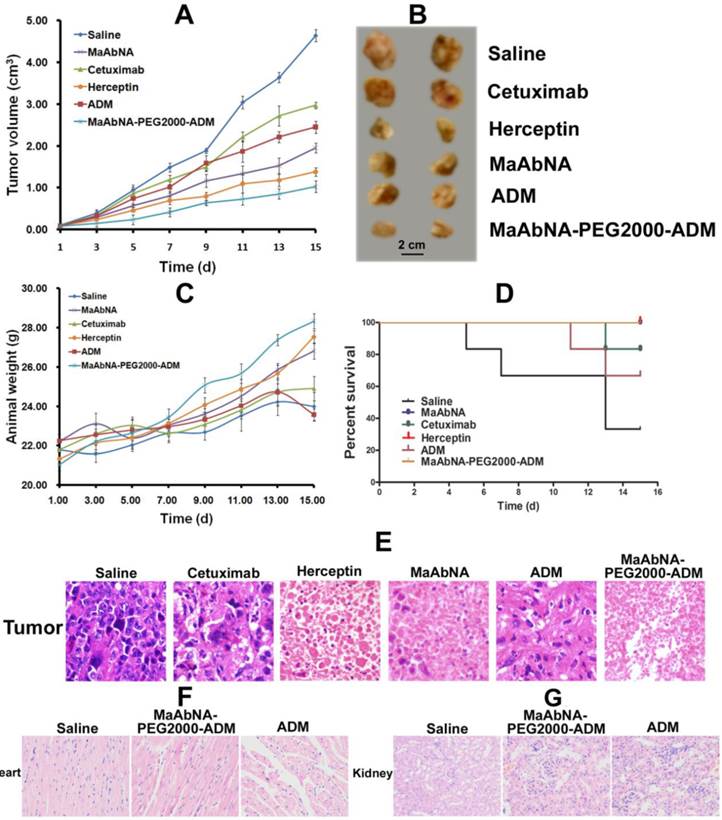
Heart is the main organ affected by free ADM, and the body accumulation of ADM was reported to result in significant cardiotoxicity [59]. In addition, the free ADM and MaAbNA were approved to be cleared out of the body through kidney. Therefore, to investigate the side effects of MaAbNA-PEG2000-ADM, cardiac and renal histological analyses of the treated mice were conducted. Sections of myocardium (Fig. 14F) demonstrated that, compared with the saline control, no distinct pathologic changes were found in the hearts of MaAbNA-PEG2000-ADM-treated mice. In contrast, the hearts of 2 members in the ADM-treated group showed noticeable pathologic changes, indicating that the MaAbNA ligand specifically carried ADM molecules to the tumors over-expressing EGFR1 and HER2, thus reduced the body-accumulation and toxic side effect of ADMs. Besides, no significant nephrotoxicity was observed in either MaAbNA-PEG2000-ADM or free ADM-treated mice (Fig. 14G).
Discussion
Several factors determine whether a molecular probe is appropriate for a given biological process or disease state, such as its pharmacokinetics, possible interactions that may results in increased non-specific signal, correlation between intensity of the probe signal and the levels of molecular target, and low cytotoxicity. Recently, various engineered protein probes, particularly antibody fragments, protein scaffolds and natural protein ligands with more compact size, shorter clearance time, and better tumor penetration are finding their way in early stage diagnosis, therapeutic response monitoring, and personalized treatment [60]. To explore the efficacy of a novel tumor-targeting ligand with high affinity and specificity for tumor cells, a 29 kDa antibody (MaAbNA), composed of one anti EGFR1 nanobody 7D12 and two ZHER2:4 affibodies, was developed and shown to possess high affinity for EGFR1 (~4.1 nM) and HER2 (~4.7 nM). And similar affinity for EGFR1 (~6.9 nM) and HER2 (~7.2 nM) was also possessed by its derivative MaAbNA-PEG2000-ADM. This bispecific biomolecule was approved to bind to both EGFR1 and HER2, which are over-expressed in variety of tumor cells. The avidity of MaAbNA to tumor cells was evaluated using three tumor cell lines with defined expression of EGFR1 and HER2 receptor tyrosine kinases: A549 (EGFR1-positive, HER2-positive), MDA-MB-231 (EGFR1-positive, HER2-negative), and MCF7 (EGFR1-negative, HER2-negative) (Figs. 4, 5). The in vivo tumor targeting ability of MaAbNA was consistent with our in vitro data and indicated that MaAbNA specifically targeted to A549 and MDA-MB-231 xenografts, with maximal T/N contrast ratios of 5.09 and 2.48, respectively, at 8 hours post injection, while MaAbNA displayed poor targeting ability for the receptor-negative MCF-7 (Figs. 11, 12). Moreover, both the in vitro and in vivo binding of anti-EGFR1 nanobody 7D12 and ZHER2:4 affibody to receptors was successfully blocked by free MaAbNA. These results strongly suggest that MaAbNA has high affinity and selectivity for tumor cells overexpressing EGFR1 and/or HER2, which further solidifies the potential of using MaAbNA as a molecular probe for tumor targeting.
In vitro MTT assays indicated that MaAbNA exhibited selective toxicity for A549 and MDA-MB-231 cells, but was non-cytotoxic toward MCF-7 cells and the non-malignant cell line L2 (Fig. 7). In contrast, adriamycin (ADM) was toxic to all cell lines investigated. In A549 cells, MaAbNA was more cytotoxic than either antibody controls (Cetuximab and Herceptin) or adriamycin. Additionally, after modification with ADM, the ability of MaAbNA-PEG2000-ADM to inhibit A549 cell growth was increased, due to the receptor targeting ability of MaAbNA. Moreover, as shown in Fig. 8, both MaAbNA and MaAbNA-PEG2000-ADM displayed significant lower therapeutic efficacy on either EGFR1- or HER2- knockdown A549 cells than those on non-transferred cells, further confirming their selective cytotoxicity toward tumor cells over-expressing EGFR1 and HER2. Furthermore, evaluation of the in vivo antitumor therapeutic efficacy (Fig. 14) showed that the antitumor activity of MaAbNA was higher than that of ADM and anti-EGFR1 Cetuximab, but was lower than that of Herceptin, inconsistent with its higher in vitro efficacy than Herceptin. This is mainly because MaAbNA molecule lacks Fc portion possessed by Herceptin, which could be combined with NK cells (nature killer cells), thus leading to an antibody-dependent cell-mediated cytotoxicity (ADCC) in vivo [61]. However, MaAbNA-PEG2000-ADM conjugation has overcome this limitation (Fig. 14), suppressed the proliferation of A549 xenografts to a greater extent than either control antibodies (Cetuximab and Herceptin) or ADM and MaAbNA alone. Moreover, the 15-day survival rates of mice treated with MaAbNA or MaAbNA-PEG2000-ADM were 100%, whereas only 33.3% of saline-treated tumor-bearing mice remained alive after 15 days. In contrast to the saline-treated control, MaAbNA and its derivative MaAbNA-PEG2000-ADM efficiently inhibited tumor growth, thus prolonging survival time. Both in vitro and in vivo studies confirmed the therapeutic efficiency of MaAbNA and MaAbNA-PEG2000-ADM in EGFR1-positive and HER2-positive tumors. Besides, from the sections of myocardium, noticeable cardiotoxicity occurred in the ADM-treated mice (Fig. 14F), which may result in their body weight decreasing after 13-day treatment of ADM (Fig. 14C). However, this cardiotoxicity was not observed in MaAbNA-PEG2000-ADM-treated group, indicating that the conjugated MaAbNA specifically delivered ADMs to tumor tissues, thus reduced the side effects of ADM, further demonstrating its selective targeting to EGFR1 and HER2 receptors. The PEG2000 modification also had the benefit of prolonging the half-life of MaAbNA in circulation, which decreased the administration frequency of the PEG2000-ADM-modified antibody.
Binding of EGF to the extracellular domain of EGFR1 induces receptor dimerization and subsequent activation of its intracellular tyrosine kinase domain, which leads to the activation of numerous downstream signaling pathways, driving cell proliferation and other cellular responses. EGFR1 signaling is tightly controlled in normal cells, however the aberrant overexpression of EGFR1 in tumor cells caused by amplification of the EGFR1 gene, over-production of EGF that results in abnormal autocrine or paracrine stimulation, or by mutations that increase the receptor's tyrosine kinase activity all promote cell proliferation, differentiation, angiogenesis and inhibition of apoptosis, thus favoring tumor growth and metastasis [62]. In this study, MaAbNA competed with EGF to bind EGFR1 (Figs. 6 and 13), which blocked the activation of EGF-EGFR1 downstream signaling pathway and inhibited tumor cell growth. The activity of HER2 in cell signaling is mediated by HER2 heterodimerization with other HER-family receptors and subsequent tyrosine phosphorylation of the intracellular domain of HER2 [63]. It is now recognized that HER2 can recruit a diverse set of intracellular signaling molecules by heterodimerizing with EGFR1 [64]. Therefore, tumors with both EGFR1 and HER2 over-expression are more invasive, and can be accompanied by c-myc overexpression [65, 66], which is closely associated with AEG-1 expression. Our miniature MaAbNA antibody blocked EGFR1 binding to EGF and also blocked the dimerization of EGFRs mediated by HER2, thus preventing activation of both the EGFR1 and HER2 signaling pathway (Ras/Raf/MEK/ERK and PI3K/Akt) [67]. MaAbNA also inhibited expression of c-jun, c-fos, c-myc and AEG-1, whose expression positively correlates with tumor cell proliferation and metastasis (Figs. 9 and 10). Our results confirm that MaAbNA has the capacity to inhibit cancer cell proliferation, migration and invasion, indicating therapeutic potential for MaAbNA in metastatic cancers [68]. On the other hand, the poor oncogene-regulating ability of anti-EGFR1 nanobody confirms the inhibition of MaAbNA due to the synergistic effect of EGFR1 and HER2.
In this study, we have used both in vitro and in vivo approaches to investigate the tumor-targeting and anticancer capability of MaAbNA, as well as to demonstrate the feasibility of the dual targeting approach. However, further studies are needed for MaAbNA to clinical applicability. Immunogenicity is an important index to estimate the clinical feasibility of antibodies. Although the anti-EGFR1 nanobody was reported to have no immunogenicity in preclinical and clinical tests [30, 69], the risk of immunogenicity of MaAbNA still exists due to the Staphylococcus origin of the affibody molecules. The ABD method (human albumin-binding domain) has been used for modification of humanized forms of affibodies [70]. After tagging with ABD, affibodies display no immunogenicity in human serum, which is beneficial for use in in vivo tumor imaging and targeting. A variety of other technologies and methods [71] could be adapted to reduce the immunogenicity of MaAbNA, including humanized reform and PEGylation [72], which would be conducive to the sequence and structure optimization of MaAbNA for potential clinical applications. Moreover, the side effects of MaAbNA and MaAbNA-PEG2000-ADM were not comprehensively investigated in this study, although they exhibited no apparent physical toxicity in mice (Fig. 14C). That is because no conclusive evidence indicated that the human-receptor specific antibody had the similar affinity to the murine receptors, which was also verified in our preliminary experiment, the targeting ability of MaAbNA to the murine EAC xenografts was not as good as that to the human A549 xenografts over-expressing EGFR1 and HER2. Consequently, the physical toxicity should be evaluated on cynomolgus (Macaca fascicularis) monkeys, which are the most relevant species for toxicological studies of the anti-EGFRs antibodies [73, 74]. Besides, our future work includes X-ray single crystal diffraction studies of the protein spatial structure and folding of MaAbNA, optimization of the MaAbNA formulation for optimal administration, as well as to study the pharmacokinetics in different in vivo model systems, and to reform the sequence of this antibody to improve its targeting efficiency.
Conclusion
MaAbNA exhibited significant tumor-targeting capability in EGFR1-positive and/or HER2-positive tumors, with minimal toxicity toward EGFR1/HER2-negative cells and non-malignant cells, and represents a potential antitumor agent in EGFR1-positive and/or HER2-positive cancer cells. In vitro and in vivo studies indicated that MaAbNA showed a good anti-tumor efficacy in EGFR1-positive and/or HER2-positive cancer cells, such as A549 and MDA-MB-231, with minimal cytotoxicity in non-tumor cells (L2). Moreover, conjugation of MaAbNA to ADM significantly enhanced its tumor lethality, inducing a better selective antineoplastic efficacy on EGFR1- and/or HER2- overexpressing cancer cells than ADM, Cetuximab and Herceptin. Overall, our results demonstrate that the MaAbNA bispecific antibody is a promising theranostic biomolecule for molecular imaging and targeted treatment of EGFR1/HER2- expressing tumors.
Supplementary Material
Fig.S1 - Fig.S3.
Acknowledgements
The authors are grateful to Natural Science Foundation Committee of China (NSFC 81220108012, 61335007, 81371684, 81000666, 81171395 and 81328012) for their financial support.
Authors' Contributions
Conception and design: Y.Gu, L.Ding
Development of methodology: L.Ding
Writing and/or revision of the manuscript: L.Ding, G.Fida, S.Achilefu, Y.Gu
Acquisition of data: C.Tian, S.Feng, C.Zhang, Y.Ma, G.Ai
Competing Interests
The authors have declared that no competing interest exists.
References
1. Olayioye MA, Neve RM, Lane HA. et al. The ErbB signaling network: receptor heterodimerization in development and cancer. EMBO. 2000;19:3159-67
2. Baselga J, Arteaga CL. Critical update and emerging trends in epidermal growth factor receptor targeting in cancer. J Clin Oncol. 2005;23:2445-59
3. Yarden Y, Sliwkowski MX. Untangling the ErbB signaling network. Nat Rev Mol Cell Biol. 2001;2:127-37
4. Yoshida T, Okamoto I, Okabe T. et al. Matuzumab and cetuximab activate the epidermal growth factor receptor but fail to trigger downstream signaling by Akt or Erk. Int J Cancer. 2008;122(7):1530-8
5. van de Water JAJM, Bagci-Onder T, Agarwal AS. et al. Therapeutic stem cells expressing variants of EGFR-specific nanobodies have antitumor effects. Proc Natl Acad Sci U S A. 2012;109(41):16642-7
6. García-Echeverría C. Protein and lipid kinase inhibitors as targeted anticancer agents of the RAS/RAF/MEK and PI3K/PKB pathways. Purinergic Signal. 2009;5(1):117-25
7. Yakes FM, Chinratanalab W, Ritter CA. et al. Herceptin-induced inhibition of phosphatidylinositol-3 kinase and Akt Is required for antibody-mediated effects on p27, cyclin D1, and antitumor action. Cancer Res. 2002;62(14):4132-41
8. Gschwind A, Fischer OM, Ullrich A. The discovery of receptor tyrosine kinases: targets for cancer therapy. Nat Rev Cancer. 2004;4:361-70
9. Mendelsohn J, Baselga J. The EGF receptor family as targets for cancer therapy. Oncogene. 2000;19:6550-65
10. Slamon DJ, Godolphin W, Holt JA, el al. Studies of the HER-2/neu proto-oncogene in human breast and ovarian cancer. Science. 1989;244:707-12
11. Dent S, Oyan B, Honig A. et al. HER2-targeted therapy in breast cancer: A systematic review of neoadjuvant trials. Cancer Treat Rev. 2013;39:622-31
12. Chen JS, Lan K, Hung MC. Strategies to target HER2/neu overexpression for cancer therapy. Drug Resist Updat. 2003;6:129-36
13. Agus DB, Akita RW, Fox WD. et al. Targeting ligand-activated ErbB2 signaling inhibits breast and prostate tumor growth. Cancer Cell. 2002;2:127-37
14. Baselga J, Norton L, Albanell J. et al. Recombinant Humanized Anti-HER2 Antibody (HerceptinTM) Enhances the Antitumor Activity of Paclitaxel and Doxorubicin against HER2/neu Overexpressing Human Breast Cancer Xenografts. Cancer Res. 1998;58:2825-31
15. Reid A, Vidal L, Shaw H. et al. Dual inhibition of ErbB1 (EGFR/HER1) and ErbB2 (HER2/neu). Eur J Cancer. 2007;43:481-9
16. Huang F, Greer A, Hurlburt W. et al. The Mechanisms of Differential Sensitivity to an Insulin-like Growth Factor-1 Receptor Inhibitor (BMS- 536924) Rationale for Combining with EGFR/HER2 Inhibitors. Cancer Res. 2009;69:161-70
17. Larbouret C, Robert B, Navarro-Teulon I. et al. In vivo Therapeutic Synergism of Anti-Epidermal Growth Factor Receptor and Anti-HER2 Monoclonal Antibodies against Pancreatic Carcinomas. Clin Cancer Res. 2007;13:3356-62
18. Geyer CE, Forster J, Lindquist D. et al. Lapatinib plus Capecitabine for HER2-Positive Advanced Breast Cancer. N Engl J Med. 2006;355:2733-43
19. Imai K, Takaoka A. Comparing antibody and small-molecule therapies for cancer. Nat Rev Cancer. 2006;6:714-27
20. Liu Z, Niu G, Wang F. et al. 68Ga-labeled NOTA-RGD-BBN peptide for dual integrin and GRPR-targeted tumor imaging. Eur J Nucl Med Mol Imaging. 2009;36:1483-94
21. Chames P, Van Regenmortel M, Weiss E. et al. Therapeutic antibodies: successes, limitations and hopes for the future. Br J Pharmacol. 2009;157(2):220-33
22. Dreier T, Lorenczewski G, Brandl C. et al. Extremely potent, rapid and costimulation-independent cytotoxic T-cell response against lymphoma cells catalyzed by a single-chain bispecific antibody. Int J Cancer. 2002;100(6):690-7
23. Offner S, Hofmeister R, Romaniuk A. et al. Induction of regular cytolytic T cell synapses by bispecific single-chain antibody constructs on MHC class I-negative tumor cells. Mol Immunol. 2006;43:763-71
24. Holt LJ, Herring C, Jespers LS. et al. Domain antibodies: proteins for therapy. Trends Biotechnol. 2003;21:484-90
25. Nelson AL. Antibody fragments Hope and hype. mAbs. 2010;2(1):77-83
26. Eklund M, Axelsson L, Uhlen M. et al. Anti-idiotypic protein domains selected from protein A-based affibody libraries. Proteins. 2002;48(3):454-62
27. Gao J, Chen K, Miao Z. et al. Affibody-based nanoprobes for HER2-expressing cell and tumor imaging. Biomaterials. 2011;32:2141-8
28. Revets H, De Baetselier P, Muyldermans S. Nanobodies as novel agents for cancer therapy. Expert Opin Biol Ther. 2005;5(1):111-24
29. Oliveira S, Schiffelers RM, Veeken J. et al. Downregulation of EGFR by a novel multivalent nanobody-liposome platform. J Control Release. 2010;145:165-75
30. Harmsen MM, De Haard HJ. Properties, production, and applications of camelid single-domain antibody fragments. Appl Microbiol Biotechnol. 2007;77(1):13-22
31. Roovers RC, Vosjan MJWD, Laeremans T. et al. A biparatopic anti-EGFR nanobody efficiently inhibits solid tumour growth. Int J Cancer. 2011;129(8):2013-24
32. Ekerljung L, Lindborg M, Gedda L. et al. Dimeric HER2-specific affibody molecules inhibit proliferation of the SKBR-3 breast cancer cell line. Biochem Biophys Res Commun. 2008;377(2):489-94
33. Friedman M, Lindström S, Ekerljung L. et al. Engineering and characterization of a bispecific HER2× EGFR-binding affibody molecule. Biotechnol Appl Biochem. 2009;54(2):121-31
34. Gao J, Chen K, Miao Z. et al. Affibody-based nanoprobes for HER2-expressing cell and tumor imaging. Biomaterials. 2011;32:2141-8
35. Orlova A, Magnusson M, Eriksson TLJ. et al. Tumor imaging using a picomolar affinity HER2 binding affibody molecule. Cancer Res. 2006;66:4339-48
36. Cortez-Retamozo V, Backmann N, Senter PD. et al. Efficient cancer therapy with a nanobody-based conjugate. Cancer Res. 2004;64(8):2853-7
37. Huang L, Gainkam LOT, Caveliers V. et al. SPECT imaging with 99mTc-labeled EGFR-specific nanobody for in vivo monitoring of EGFR expression. Mol Imaging Biol. 2008;10(3):167-75
38. Wikman M, Steffen AC, Gunneriusson E. et al. Selection and characterization of HER2/neu-binding affibody ligands. Protein Eng Des Sel. 2004;17(5):455-62
39. Gainkam LOT, Huang L, Caveliers V. et al. Comparison of the biodistribution and tumor targeting of two 99mTc-labeled anti-EGFR nanobodies in mice, using pinhole SPECT/micro-CT. J Nucl Med. 2008;49(5):788-95
40. Steffen AC, Wikman M, Tolmachev V. et al. In vitro characterization of a bivalent anti-HER-2 affibody with potential for radionuclide-based diagnostics. Cancer Biother Radiopharm. 2005;20(3):239-48
41. Ekerljung L, Lennartsson J, Gedda L. The HER2-Binding Affibody Molecule (ZHER2∶ 342) 2 Increases Radiosensitivity in SKBR-3 Cells. PloS One. 2012;7(11):e49579
42. Cao J, Wan S, Tian J. et al. Fast clearing RGD-based near-infrared fluorescent probes for in vivo tumor diagnosis. Contrast Media Mol Imaging. 2012;7:390-402
43. Albrecht H, DeNardo GL, DeNardo SJ. Monospecific bivalent scFv-SH: effects of linker length and location of an engineered cysteine on production, antigen binding activity and free SH accessibility. J Immunol Methods. 2006;310(1):100-16
44. Bobrovnik SA, Komisarenko SV, Ilyina LV. Novel and simple ELISA-based method for antibody affinity determination. Ukr Biokhim Zh. 2004;77(2):169-74
45. Kingshott P, Thissen H, Griesser HJ. Effects of cloud-point grafting, chain length, and density of PEG layers on competitive adsorption of ocular proteins. Biomaterials. 2002;23(9):2043-56
46. Edwards III CK, Martin SW, Seely J. et al. Design of PEGylated soluble tumor necrosis factor receptor type I (PEG sTNF-RI) for chronic inflammatory diseases. Adv Drug Deliv Rev. 2003;55(10):1315-36
47. Gaudriault G, Vincent JP. Selective labeling of α-or ϵ-amino groups in peptides by the Bolton-Hunter reagent. Peptides. 1992;13(6):1187-92
48. Gainkam LOT, Huang L, Caveliers V. et al. Comparison of the biodistribution and tumor targeting of two 99mTc-labeled anti-EGFR nanobodies in mice, using pinhole SPECT/micro-CT. J Nucl Med. 2008;49(5):788-95
49. Bobrovnik SA. Determination of antibody affinity by ELISA. Theory. J Biochem Biophys Methods. 2003;57(3):213-36
50. Beatty JD, Beatty BG, Vlahos WG. Measurement of monoclonal antibody affinity by non-competitive enzyme immunoassay. J Immunol Methods. 1987;100(1):173-9
51. Yarden Y. The EGFR family and its ligands in human cancer: signalling mechanisms and therapeutic opportunities. Eur J Cancer. 2001;37:3-8
52. Normanno N, Luca AD, Bianco C. et al. Epidermal growth factor receptor (EGFR) signaling in cancer. Gene. 2006;366:2-16
53. Hartman Z, Zhao H, Agazie YM. HER2 stabilizes EGFR and itself by altering autophosphorylation patterns in a manner that overcomes regulatory mechanisms and promotes proliferative and transformation signaling. Oncogene. 2013;32:4169-80
54. Emdad L, Sarkar D, Su Z. et al. Activation of the Nuclear Factor κB Pathway by Astrocyte Elevated Gene-1: Implications for Tumor Progression and Metastasis. Cancer Res. 2006;66:1509-16
55. Hu G, Wei Y, Kang Y. The Multifaceted Role of MTDH/AEG-1 in Cancer Progression. Clin Cancer Res. 2009;15:5615-20
56. Lee S, Su Z, Emdad L. et al. Astrocyte elevated gene-1 (AEG-1) is a target gene of oncogenic Ha-ras requiring phosphatidylinositol 3-kinase and c-Myc. Prog Nucleic Acid Res Mol Biol. 2006;103:17390-5
57. Denis N, Kitzis A, Kruh J. et al. Stimulation of methotrexate resistance and dihydrofolate reductase gene amplification by c-myc. Oncogene. 1991;6:1453-7
58. Sheng H, Shao J, Dubios RN. Akt/PKB Activity Is Required for Ha-Ras-mediated Transformation of Intestinal Epithelial Cells. J Biol Chem. 2001;276:11498-504
59. Rajagopalan S, Politi PM, Sinha BK. et al. Adriamycin-induced free radical formation in the perfused rat heart: implications for cardiotoxicity. Cancer Res. 1988;48(17):4766-9
60. Gebauer M, Skerra A. Engineered protein scaffolds as next-generation antibody therapeutics. Curr Opin Chem Biol. 2009;13:245-55
61. Kono K, Takahashi A, Ichihara F. et al. Impaired antibody-dependent cellular cytotoxicity mediated by herceptin in patients with gastric cancer. Cancer Res. 2002;62(20):5813-7
62. Press MF, Lenz HJ. EGFR, HER2 and VEGF Pathways. Drugs. 2007;67:2045-75
63. Hommelgaard AM, Lerdrup M, Deurs B. Association with membrane protrusions makes erbB2 an internalization-resistant receptor. Mol Biol Cell. 2004;15:1557-67
64. Earp HS, Dawson TL, Li X. et al. Heterodimerization and functional interaction between EGF receptor family members: a new signaling paradigm with implications for breast cancer research. Breast Cancer Res Treat. 1995;35:115-32
65. Tauchi K, Hori S, Itoh H. et al. Immunohistochemical studies on oncogene products (c-erbB-2, EGFR, c-myc) and estrogen receptor in benign and malignant breast lesions. Virchows Arch. 1989;416:65-73
66. Dam PA, Vergote IB, Lowe DG. et al. Expression of c-erbB-2, c-myc, and c-ras oncoproteins, insulin-like growth factor receptor I, and epidermal growth factor receptor in ovarian carcinoma. J Clin Pathol. 1994;47:914-9
67. Luca AD, Maiello MR, D'Alessio A. et al. The RAS/RAF/MEK/ERK and the PI3K/AKT signalling pathways: role in cancer pathogenesis and implications for therapeutic approaches. Expert Opin Ther Targets. 2012;16:S17-S27
68. Yu C, Chen K, Zheng H. et al. Overexpression of astrocyte elevated gene-1 (AEG-1) is associated with esophageal squamous cell carcinoma (ESCC) progression and pathogenesis. Carcinogenesis. 2009;30:894-901
69. Cortez-Retamozo V, Lauwereys M, Gobert M. et al. Efficient tumor targeting by single-domain antibody fragments of camels. Int J Cancer. 2002;98(3):456-62
70. Nilsson J, Larsson M, Stahl S. et al. Multiple affinity domains for the detection, purification and immobilization of recombinant proteins. J Mol Recognit. 1996;9(5-6):585-94
71. Nilsson J, Ståhl S, Lundeberg J. et al. Affinity fusion strategies for detection, purification, and immobilization of recombinant proteins. Protein Expr Purif. 1997;11(1):1-16
72. He XH, Shaw PC, Tam SC. Reducing the immunogenicity and improving the in vivo activity of trichosanthin by site-directed pegylation. Life Sci. 1999;65(4):355-68
73. Ledón N, Casacó A, Casanova E. et al. Comparative analysis of binding affinities to epidermal growth factor receptor of monoclonal antibodies nimotuzumab and cetuximab using different experimental animal models. Placenta. 2011;32(7):531-4
74. Dokter W, Ubink R, van der Lee M. et al. Preclinical Profile of the HER2-Targeting ADC SYD983/SYD985: Introduction of a New Duocarmycin-Based Linker-Drug Platform. Mol Cancer Ther. 2014;13(11):2618-29
Author contact
![]() Corresponding author: Yueqing Gu, Department of Biomedical Engineering, China Pharmaceutical University, Nanjing 210009, Jiangsu Province, China. Phone: 86-25-83271046; Fax: 86-25-83271046; E-mail: guyueqingedu.cn.
Corresponding author: Yueqing Gu, Department of Biomedical Engineering, China Pharmaceutical University, Nanjing 210009, Jiangsu Province, China. Phone: 86-25-83271046; Fax: 86-25-83271046; E-mail: guyueqingedu.cn.